
Abstract
In this paper, high-pressure torsion (HPT) was conducted on pure molybdenum (Mo) (99.9 wt.%) under the 6 GPa pressure at room temperature with an angular velocity of 1 rev min−1. The samples processed by 1, 2, 5 turns of HPT were obtained. After 5 revolutions of HPT, the grains were significantly refined to 0.77 ± 0.17 µm and the main textures are {012}<121> and {001}<110>. The dislocation density of the sample after 2 turns of HPT deformation reaches to the maximum value. The elastic modulus of pure molybdenum after 5 turns of HPT has a great decrease. It is found that texture structures, dislocations and non-equilibrium grain boundaries can influence the elastic modulus evolution, and the latter two are the main factors.
Introduction
Molybdenum (Mo) is a typical refractory metal with many excellent properties, such as high-temperature hardness and strength, excellent wear corrosion resistance and irradiation resistance, which has been applied in many fields like electronics industry, manufacturing industry, aerospace engineering, military field, medical field and nuclear field [1-3]. At present, molybdenum materials are usually produced by sintering and subsequent rolling. However, the prepared materials with coarse grains have poor comprehensive performances, so that they cannot meet various requirements well. High-pressure torsion (HPT) is a severe plastic deformation (SPD) technique where a sample is subjected to torsional shear straining under a high hydrostatic pressure. The HPT processing is becoming more popular in these days as a powerful scientific tool to investigate the structural and multifunctional properties of bulk nanostructured materials, and it has been applied to various materials such as aluminium, copper and their alloys [4-7]. HPT can result in the formation of ultrafine-grained (UFG) structures with predominantly high-angle grain boundaries (HAGBs) [8-10]. As for hard materials, the most researches about HPT focused on the influence of strain on grain refinement and hardness evolution [11-14]. Although some literature focused on the variation of elastic modulus under the SPD deformation [15-17], the variation of elastic modulus for Mo under the HPT deformation is still unclear. In fact, Mo is a kind of anisotropic material, so its elastic modulus will have an obvious difference in different structure states. Hence, the research about elastic modulus evolution of Mo or other anisotropic material should be paid more attention [18-20]. In addition, based on the texture, one of the key factors, affected the elastic modulus of anisotropic materials, quantitatively analysing the contribution of texture structure to elastic modulus is necessary. But the relationship between the texture structure and elastic modulus under HPT deformation is unclear. Recently, the texture evolution of Mo and other metals in previous literature is mainly based on hot rolling, uniaxial compression, extrusion process and heat treatment [21-25]. There are obvious differences between the microstructure formed by HPT deformation and by the conventional plastic deformation process, which is due to severe continuous shear deformation under extremely high hydrostatic pressure. So the role of deformation mode and the texture changes, as the significant characteristics of the HPT deformation [26], in the mechanical properties should be investigated.
The present research was undertaken by testing the microstructure, dislocation density, nanohardness and elastic modulus of pure Mo after HPT deformation at room temperature (RT). And the influence factors of the evolution of elastic modulus were discussed.
Methodology
High-pressure torsion
Commercially pure molybdenum prepared by power metallurgy followed by hot rolling, centreless grinding and annealing were used in this paper. Disc samples with the diameter of 10 mm and the thickness of 0.85 mm were obtained from the rod of commercially pure Mo. The quasi-constrained HPT experiments were carried out on a RZU2000HF pressing and torsion machine. The discs were rotated for 1, 2, 5 turns by HPT at RT under an applied pressure of 6.0 GPa through the rotation of the lower anvil at a speed of 1 rev min−1. The depth on the two anvils is 0.25 mm and thereby the as-received samples produce some flash during HPT processing, so the thickness decreases with the increasing revolutions number. The HPT-processed sample after 5 turns is 0.75 mm in thickness approximately.
There are three directions of the tested samples after HPT processing, which are axial direction, radial direction and tangential direction, as displayed in Figure 1. Before the mechanical and microstructural characterisation, the radial direction–tangential direction surface (the bottom surface) of the samples before and after HPT deformation were polished mechanically using different grit of SiC paper starting from 200 to 2000 grit.
Schematic illustration of HPT directions.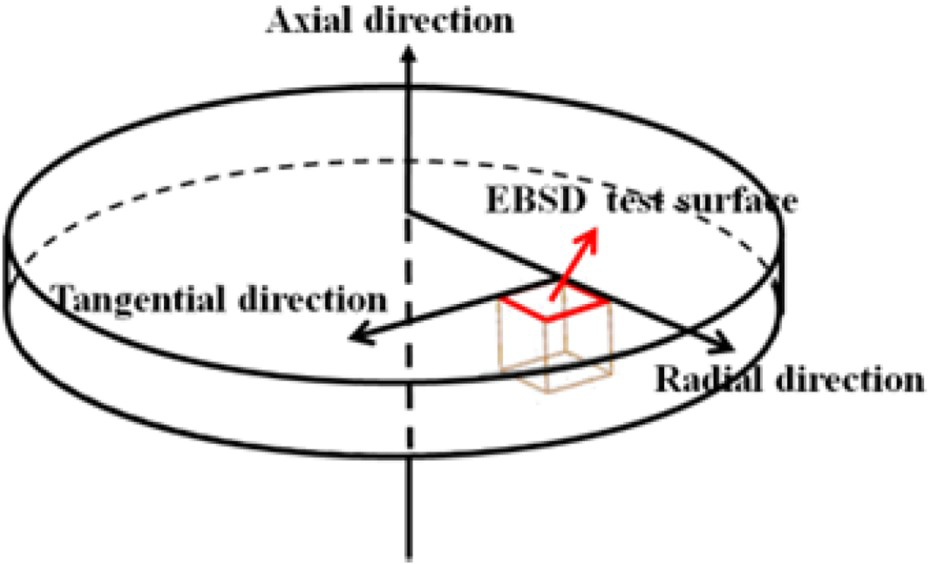
Microstructure test
The XRD patterns of as-received and HPT-processed samples were recorded from 35° to 90° by D/MAX2500VL/PC X-ray diffractometer operating at 40 kV and 150 mA using Cu Kα radiation with step scanning mode of 0.02° in 2θ and counting time of 1 s per step. The data were processed by MDI Jade 6.0 analysis system.
After electron polishing with an electrolyte made of 5% perchloric acid and 95% methanol, the samples were investigated using electron backscatter diffraction (EBSD) technique in an FEI scanning electron microscope (SEM) with a field emission gun source operated at 25 kV. Scanning areas were located 3 mm from the centre of the disc. The step size was 0.2 μm, the minimum confidence index (CI) value was 0.26, and a clean-up procedure where the total number of modified points was less than 10% of the total points measured was adopted in the EBSD analysis. TSL-OIM data collector and analysis software were used for EBSD data acquisition and analysis.
In addition, the microstructure after 5 turns of HPT processing was observed via an FEI TecnaiG2 F20 S-TWINTEM at the region 3 mm from the sample centres and the selected-area aperture for the SAED patterns was 730 nm. The TEM sample was ground mechanically to the thicknesses of ∼50 μm followed by electrolytic thinning using a twin-jet polisher with a solution of 10% H2SO4 and 90% CH3OH at a voltage of 13 V under an operating temperature of −20°C.
Nano-indentation test
An Agilent Nano Indentor G200 hardness tester was used to conduct the nano-indentation experiments at the region 3 mm away from the centre of the samples. The indenter is the Berkovich tip, which is a diamond indenter with three-sided pyramidal indenter shape and high spatial resolution. The applied force (load) and the corresponding indentation depth (displacement) of the indenter into the specimen surfaces were recorded continuously to generate the L-D curves. The loading rate was set as 2 mN·s−1 for 50 s to the peak with holding time of 10 s and then the unloading process was processed at the same rate. Then the nanohardness and the elastic modulus were obtained from the L-D curves [27-30]. Each sample was tested for five times and the average value was used.
Results and discussions
Microstructure evolution
The microstructures observed at the region 3 mm away from the disc centre before and after HPT processing are shown in Figures 2 and 3, respectively. Compared with the microstructure before HPT processing, there is a significant grain refinement and an obvious misorientation angle increasing after 5 turns of HPT deformation. The corresponding statistical variations of grain size (equivalent circle diameter) are shown in Figures 2(b) and 3(b), and the average grain size is 383 ± 64 µm for the initial material, which decreases to 0.77 ± 0.17 µm after 5 turns of HPT deformation, and ∼85.4% of the grains have the size less than 1 µm. Also, the grain boundary misorientation angles are shown in Figures 2(c) and 3(c). The average misorientation for the as-received sample is about 9.9°, and the value increases to 33.9° after 5 turns of HPT. In addition, almost all the grains in the as-received sample are of LAGBs, but the fraction of HAGBs after 5 turns of HPT is up to 96.7%. It reveals that HPT leads to significant grain refinement and a large number of fine grains with HAGBs were generated in the material processed with 5 turns. The grain refinement may be due to the continuous shear deformation during the HPT deformation, which is consistent with earlier reports that the microstructure evolves from subgrains with low-angle boundaries (LAGBs) to HAGBs [10,11].
Characteristics of the initial sample: microstructure (a), grain size (b), misorientation (c), ODFs (d). Characteristics of sample after 5 turns of HPT: microstructure (a), grain size (b), misorientation (c), ODFs (d).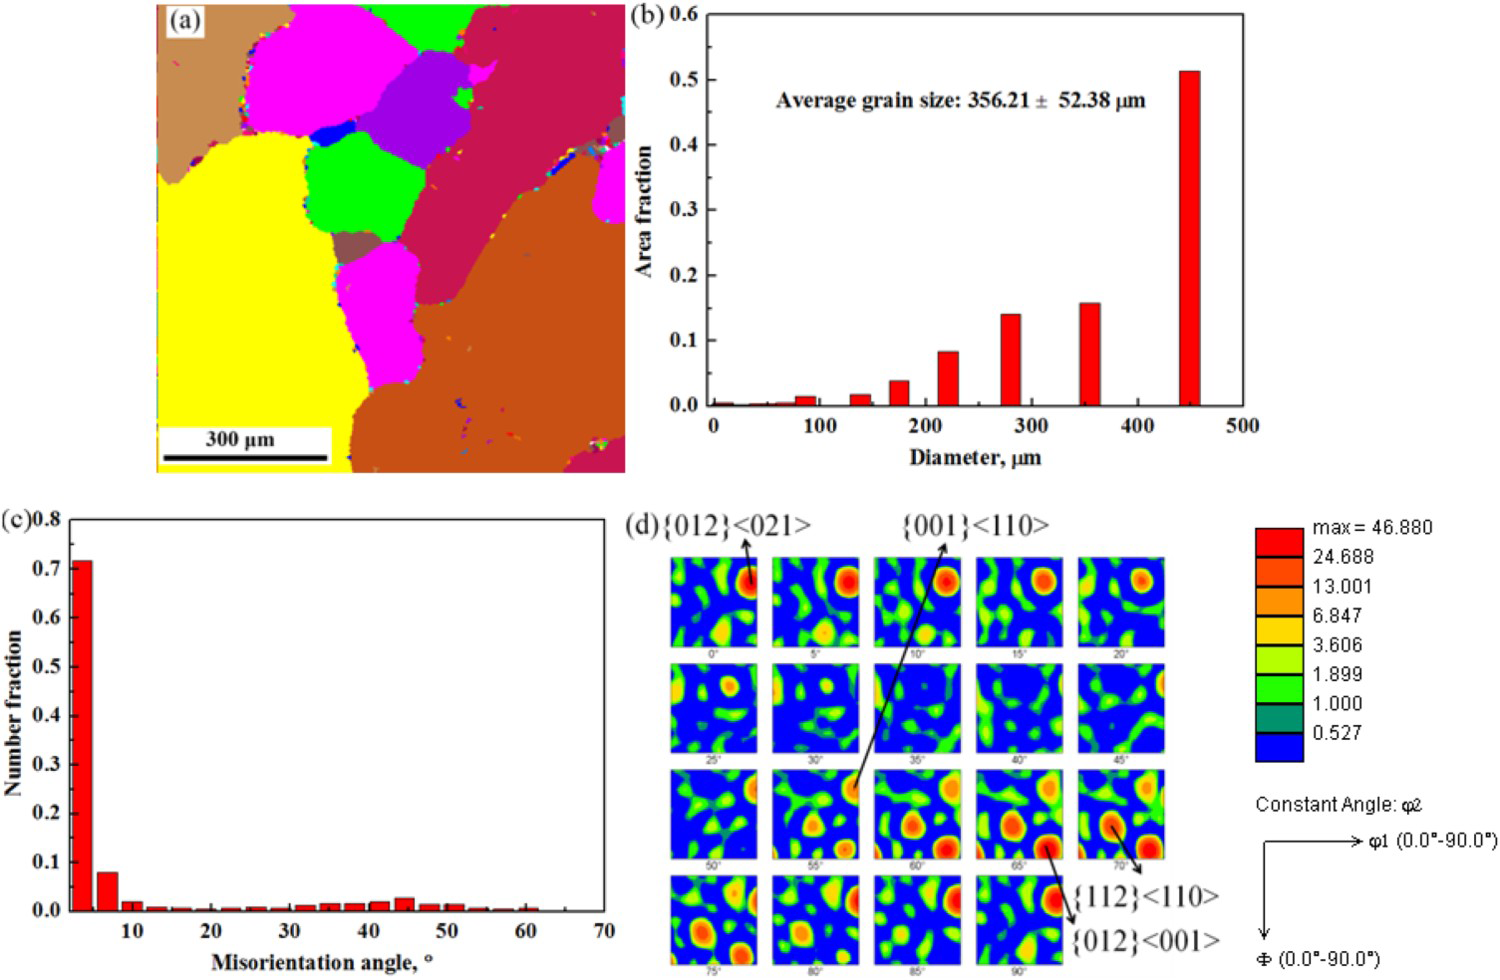
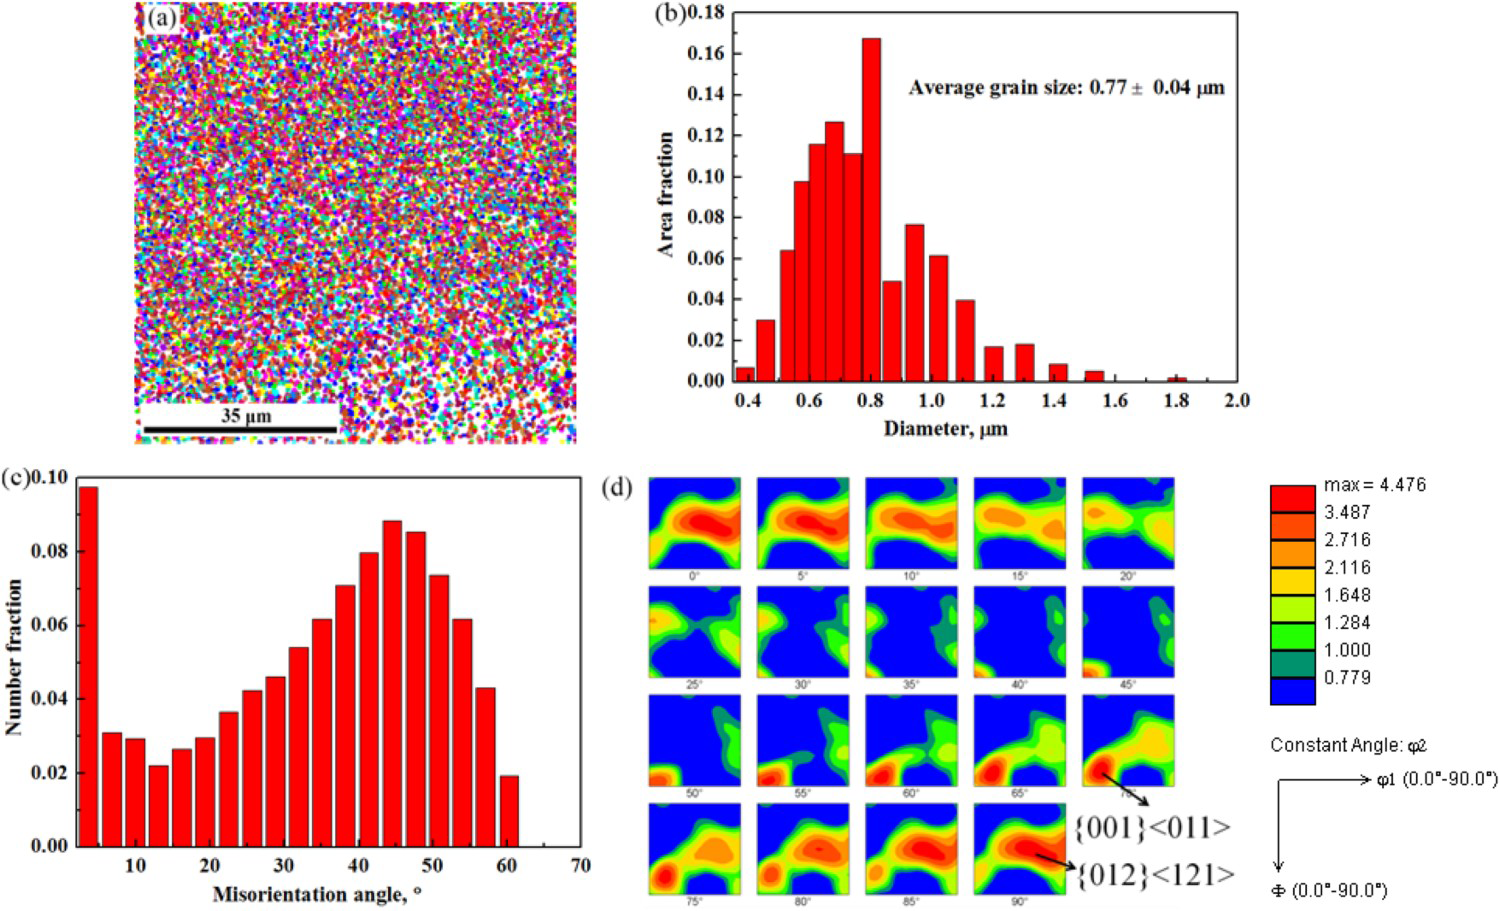
The grains orientations of the initial Mo are random, which can be demonstrated from the ODFs of Figure 2(d). According to the calculation by using the formulation of Bunge [21], several micro-textures can be found in the initial Mo including {012}<001>, {012}<021>, {112}<110> and {001}<110>. However, only two strong textures were formed after 5 turns of HPT deformation, which are {012}<121> and {001}<110>, as shown in Figure 3(d). Typical rolling textures for BCC metals were γ-fibre texture (i.e. {111}<110> and {111}<112>) and α-fiber texture (i.e. {111}<110>, {112}<110> and {001}<110>) [21-25]. The difference is mainly due to the deformation condition, namely the large torque with super high hydrostatic pressure. The main texture after 5 turns of HPT deformation is {012}<121>, {012} has a certain angle to radial direction–tangential direction surface, and <121> has a certain angle to the axial direction. The other texture is {001}<011>, {001} is parallel to radial direction–tangential direction surface, and <011> is parallel to axial direction.
Dislocation density
The XRD patterns of the samples before and after HPT processing are shown in Figure 4(a). It can be seen that there is an apparent peak breath broadening for the samples after the HPT-processed. The reasons for the broadening include a high level of lattice distortion and their interaction, small crystallite size and so on. There is the Cauchy–Gaussian function based on the assumption that the size broadening and strain broadening are Cauchy and Gaussian components, respectively, which can depict the broadening of the peak breadths, and it is shown in the following equation [31]:
XRD patterns (a) and IB plot (110)-(220) for molybdenum samples before and after HPT.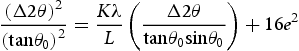
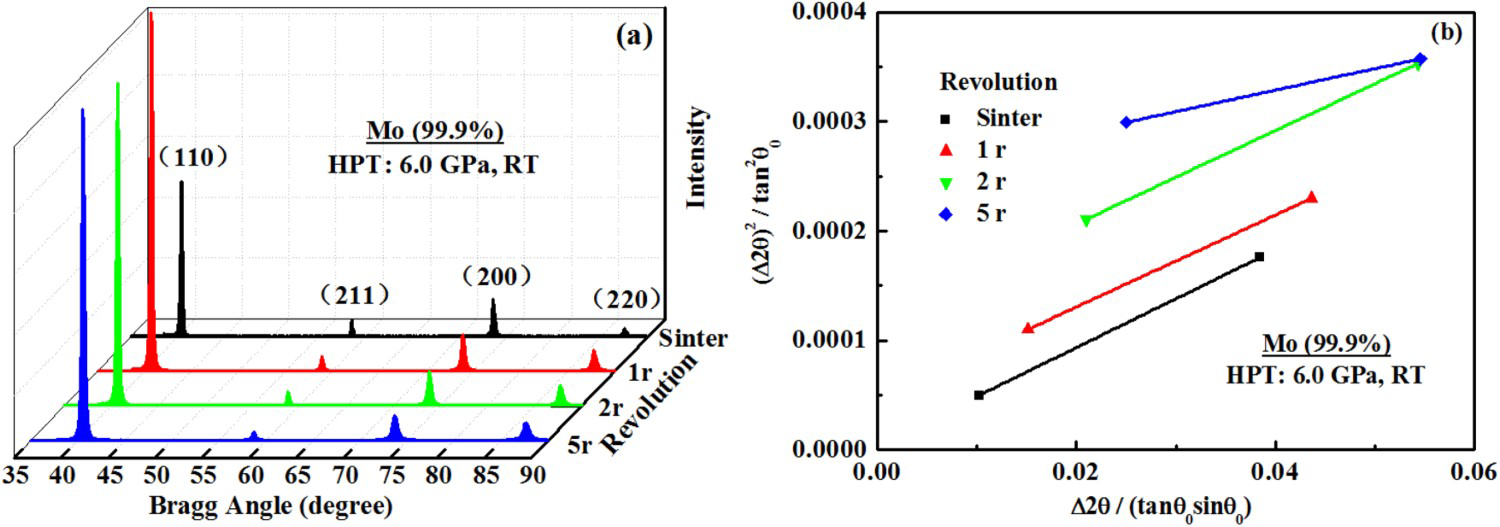
According to Ref. [10], calculating the crystallite size by the IB method depends on the assumption of the isotropic or anisotropic microstrain presence in nano materials. In the former case, various reflection peaks should be used to minimize the measurement error, whereas in the latter case, multiple orders of reflection of the identical crystallographic planes (two orders or peak pair herein) must be used. Therefore, for the anisotropy Mo processed by HPT deformation, peak pairs of (110) – (200), are used to calculate the crystalline size (L) and micro strain (< ε2 >1/2), which are obtained from the slope and the intercept from the fitting lines as shown in Figure 4(b), respectively [10]. Finally, the average dislocation density (ρ) can be calculated by the following Equation (2) due to crystallite size and micro strain [31-33]:
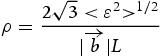
 is Burgers vector which can be obtained from the terms of
  for BCC metals, and a is the lattice parameter.
The variation of dislocation density is shown in Figure 5, and the initial Mo shows a low level of dislocation density about 1.5 × 10¹⁴ m−2. The dislocation density increases rapidly to 4.8 × 10¹⁴ m−2 after 1 turn of HPT deformation, then it is up to the peak about 7.8 × 10¹⁴ m−2 after 2 turns of HPT deformation, which is about 4 times higher than that of the initial Mo. However, the dislocation density decreases slightly to 5.1 × 10¹⁴ m−2 after 5 turns of HPT deformation, which is still more than that of the initial Mo. During the HPT processing, the dislocations kept moving and were accumulated by different multiplication mechanisms, including double cross slip mechanism, polar axis mechanism and so on [34]. Thus, the dislocation density increased rapidly at the early stage of HPT deformation. Grain size and grain boundary evolutions based on EBSD analysis show that during early large deformation, the dislocations moved gradually along the slip plane within the grains under the action of shear stress, and the dislocation cell structures formed by the intersect of a large number of dislocations. With the increase of deformation strains, the dislocation walls developed into subgrain boundaries. During this deformation stage, the production and annihilation of dislocations tended to a dynamic balance state. When the strains accumulated to a certain value, the substructures with LAGBs were transformed into fine grains with high-angle boundaries, and the misorientation of grain boundaries increases by rapid annihilation of a large number of dislocations thereby the dislocation density decreases due to the dynamic recovery [35,36]. In this case, the dislocation density increases within 2 turns of HPT, but decreased after 5 turns.
Variation of dislocation density.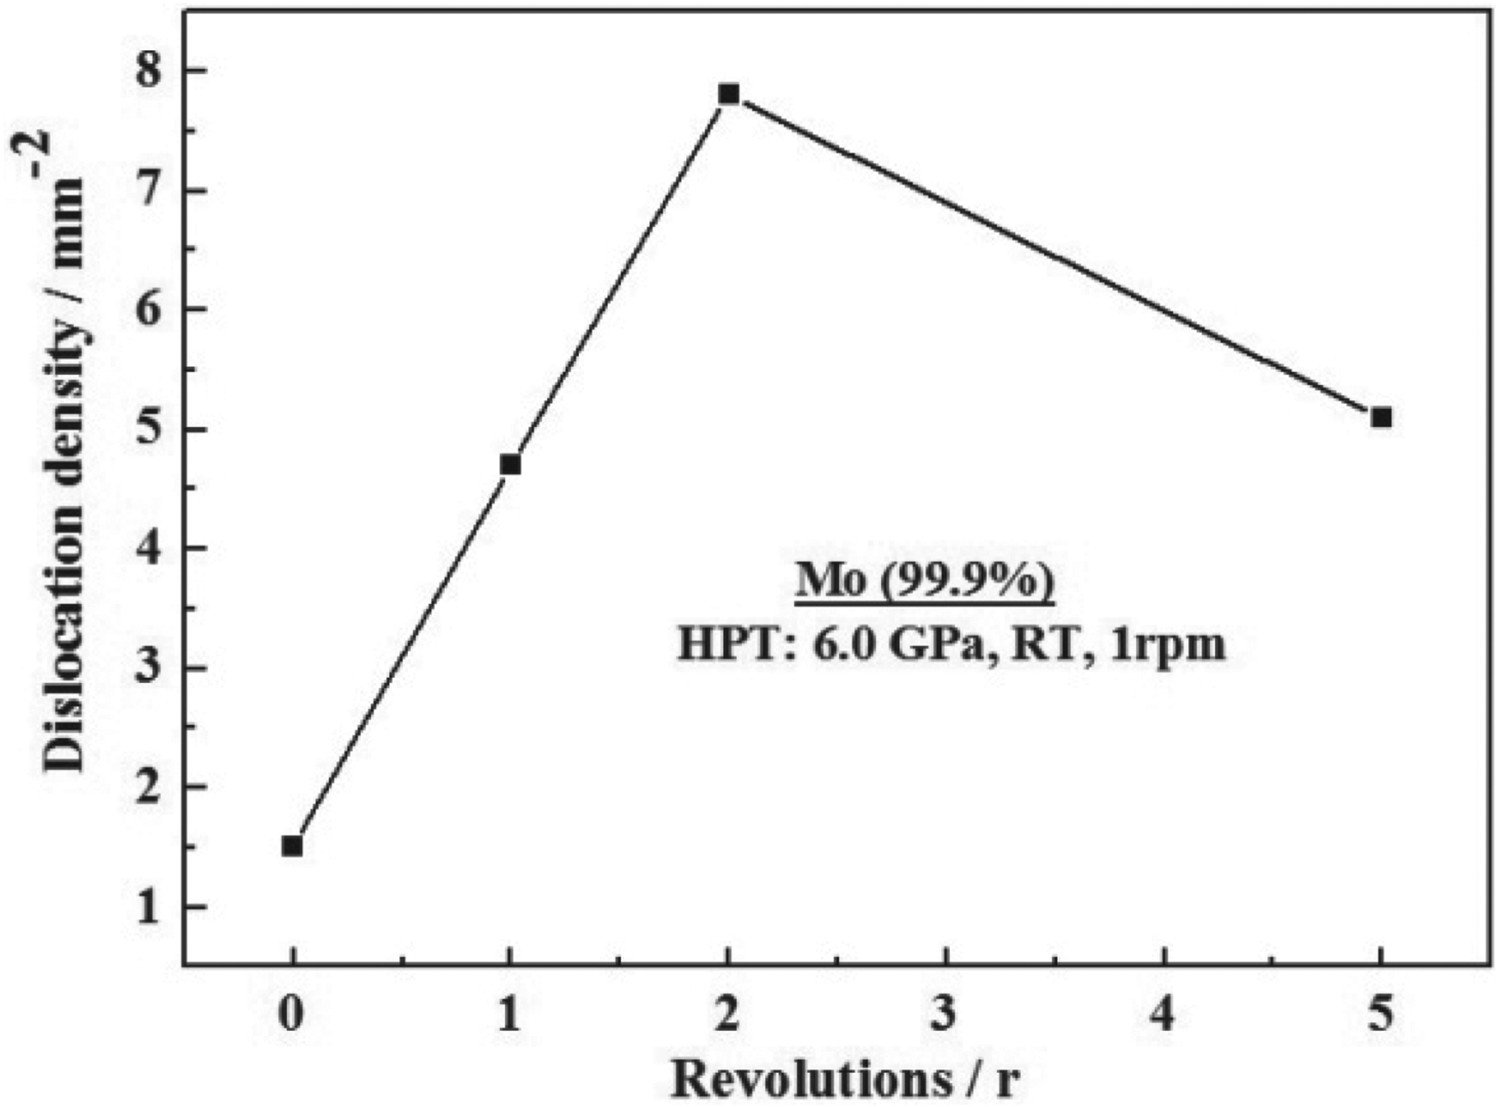
Nanohardness
The Load–displacement (L-D) curves during the indentation test of the as-received molybdenum and the samples processed by HPT with 1, 2, 5 turns are plotted in Figure 6(a). The curves can be divided into three periods including loading stage, peak holding stage and unloading stage. All of the four curves have a similar tendency that the displacement increases during the periods of loading and peak holding, and decreases in the unloading stage. However, the plastic displacements of samples after HPT processing are significantly smaller than that of the initial sample, which indicates the yield strength of the material increases with the HPT processing, and it is consistent with the variation trend of nanohardness. As can be seen from Figure 6(b), the nanohardness of the initial sample is 3.0 ± 0.08 GPa, which is much lower than that of the HPT-processed samples. And with the increasing number of HPT turns, which also can be called the accumulated deformation strains, the nanohardness becomes stable after a rapid increase, and the values of HPT deformation samples are 7.3 ± 0.05 GPa, 7.5 ± 0.02 GPa and 7.8 ± 0.01 GPa for 1, 2, 5 turns, respectively. The improvement of strength or hardness is caused by many factors. For pure Mo, the main reasons are grain refinement and dislocation accumulation during HPT deformation. As the dislocation density increased, the dislocations inside the grains began to get entangled and significant strain hardening occurred in the Mo samples due to the effect of dislocation pinning on the dislocation movement inside the grains. On the other hand, some dislocations inside the grains moved towards the subgrain or grain boundaries and a number of new grain boundaries were generated by absorbing the extrinsic dislocations. The grain boundaries impeded the dislocation movement passing through the grains. Also, the accumulated large strain lead to continuous dynamic recrystallisation after 5 turns of HPT, which results in the further grain refinement with limited dislocation density decreasing [11,12]. Under the comprehensive effect of continuous grain refinement and a slight dislocation density decrease, the nanohardness keeps steady during 2 turns to 5 turns. Thus, the refined microstructure with more grain boundaries and dislocation evolution improved the mechanical properties, which is agreed with the increasing of dislocation density and nanohardness. It should be noticed that the variation tendency of nanohardness is in accordance with the microhardness, but the value of nanohardness is higher than the microhardness, which is caused by the difference of the test scale. During the test of the microhardness, there are countless grains joining into the deformation, but only dozens of grains are involved in the nano-indentation test.
Load–displacement (a) and variation of nanohardness (b).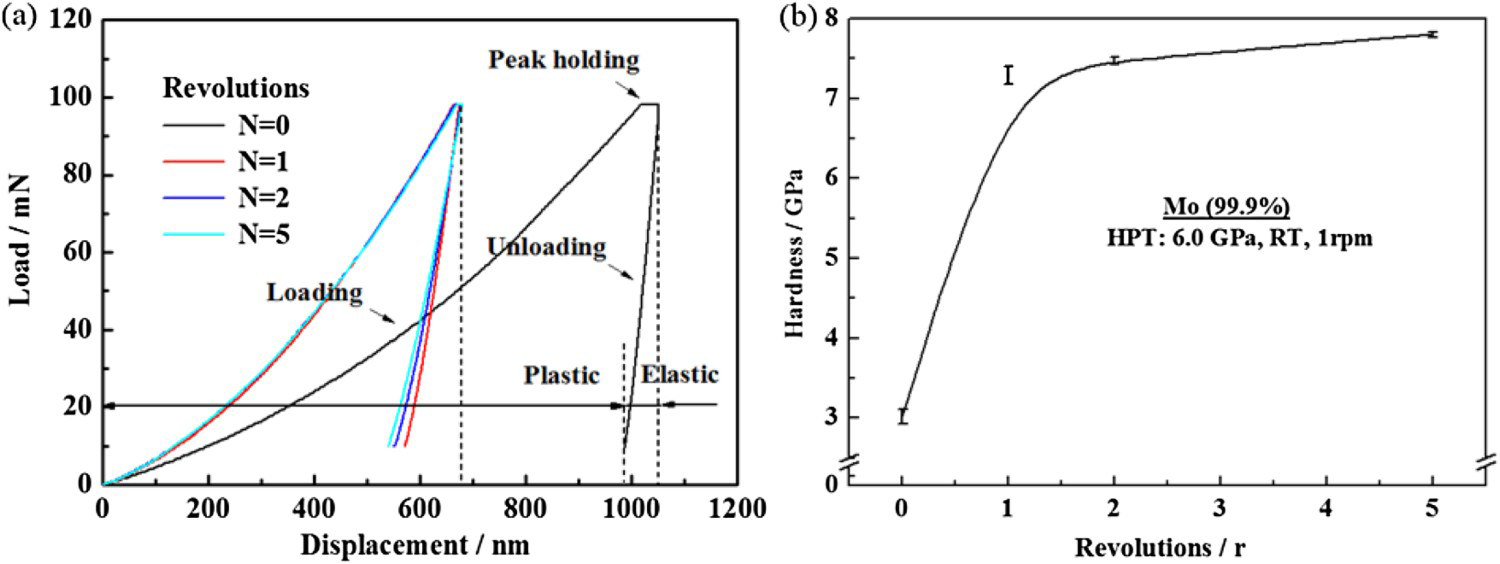
Elastic modulus
In a general way, the modulus of Mo and alloys is 320–365 GPa [19]. The elastic modulus given by nano-indentation of the samples before and after HPT processing is plotted in Figure 7. The elastic modulus decreases as the increasing number of HPT turns. The elastic modulus of the initial material is 321 ± 10 GPa, and it decreases to 309 ± 5 GPa after 1 turn of HPT deformation, so it can be seen that the decreased value is very small after 1 turn of HPT. For the turns of 2 and 5, there is a significant decrease to 246 ± 8 GPa and 207 ± 6 GPa, respectively. Finally, the modulus after 5 turns of HPT deformation decreases by 36% compared to the initial material, whereas the decrease rate after conventional plastic deformation is about 5–20% [19].
Variation of elastic modulus.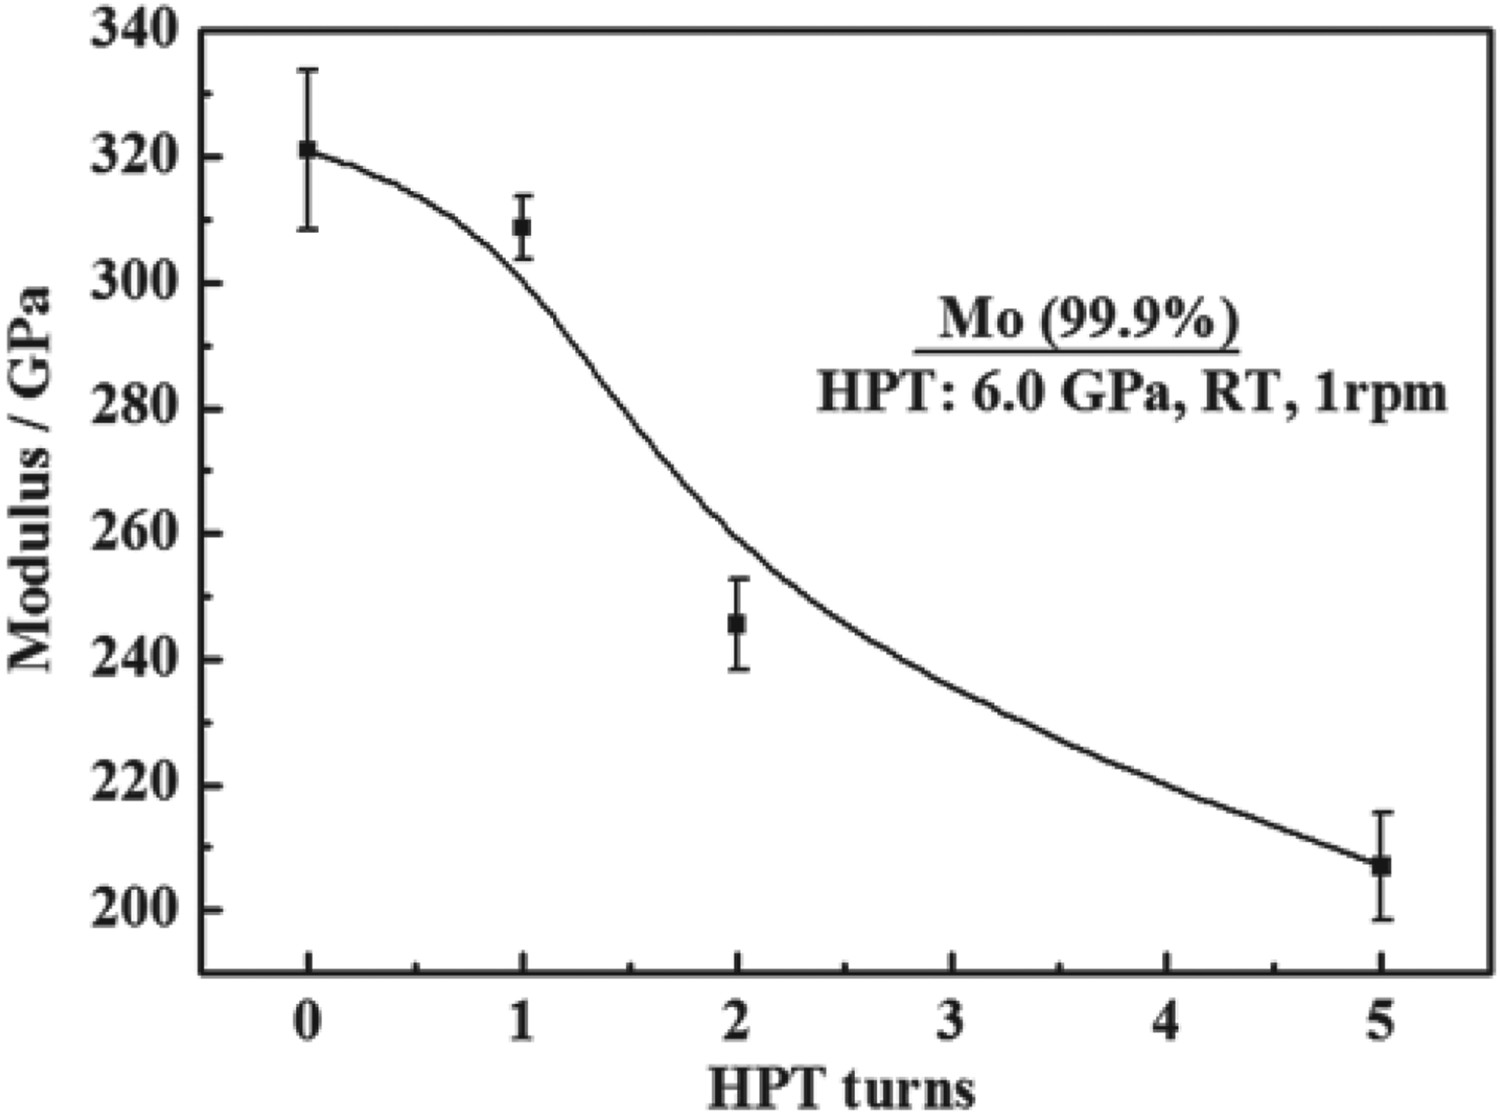
Normally, elastic modulus would decrease after plastic deformation due to the change of bonding force between atoms, and the main factors are impurity, secondary phase, defects (pore, dislocations and boundaries), grain orientations and so on [19]. In this paper, the initial material is high purity Mo (99.9 wt-%), and the HPT experiment carried out at RT, on which condition it can be considered that the chemical composition of the sample is highly stable, so the changes of impurity content and secondary phase before and after HPT deformation can be ignored. In other words, the elastic modulus is mainly affected by dislocations, non-equilibrium grain boundaries and texture in this research, which will be discussed in detail below [10,11].
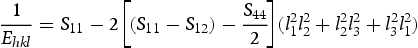
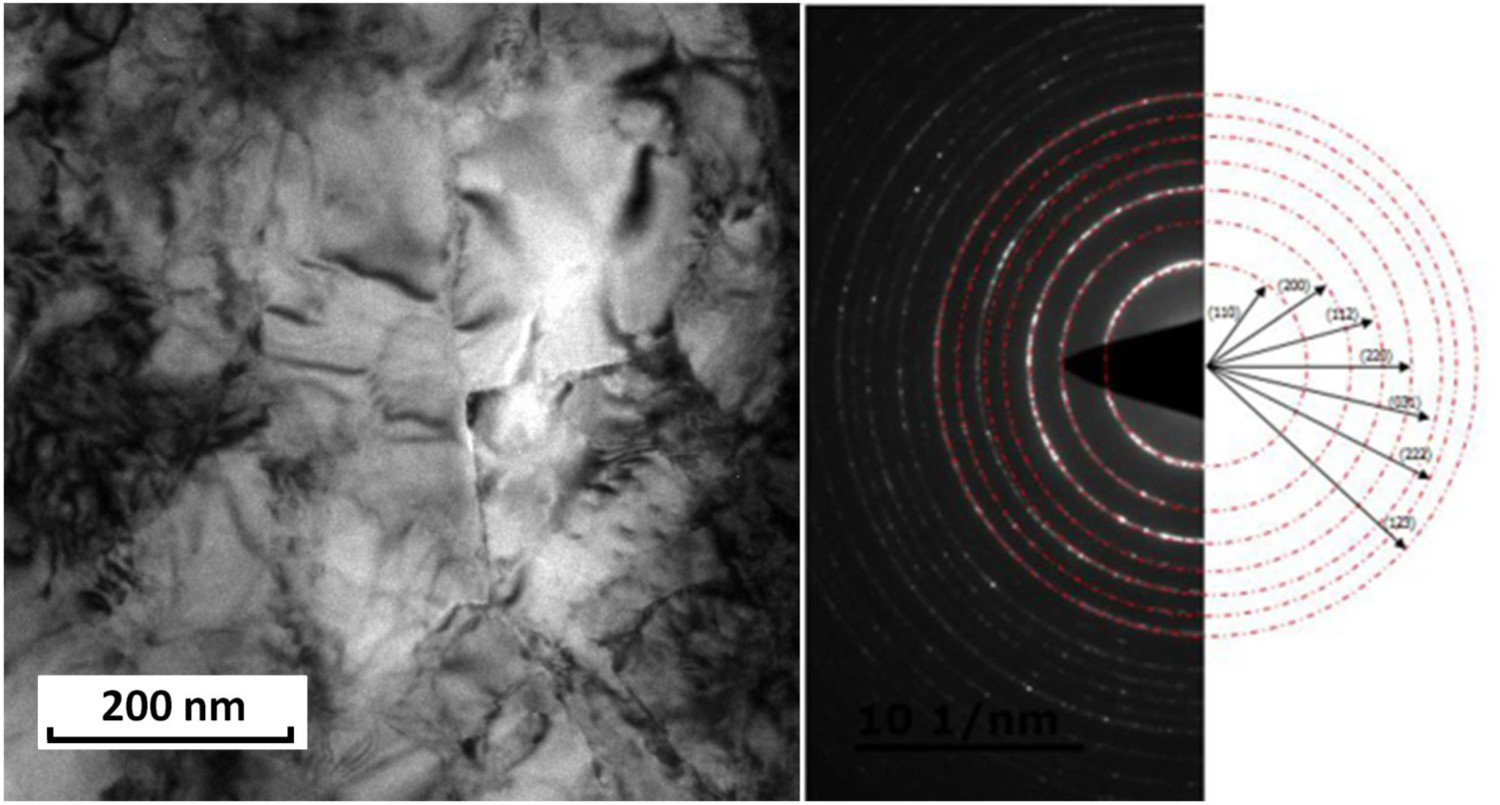
The modulus along the different directions can be estimated from the stiffness coefficients. For cubic crystals, Young's modulus along a crystallographic [hkl] direction is given by the following equation [19,20]:
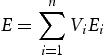
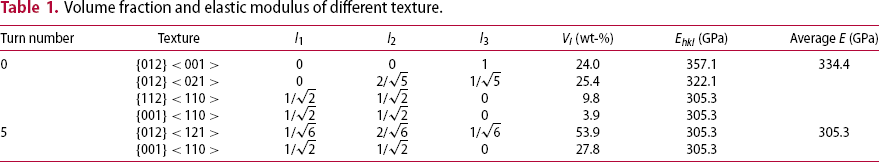
The direction cosines, volume fraction and elastic modulus of different texture of the samples are given in Table 1. Based on the assumption that defects (dislocations and grain boundaries) have little effect on the elastic modulus, the elastic modulus calculated by texture components is 334.5 GPa and 305.3 GPa for the initial sample and 5 turns of HPT-processed sample, respectively. The decrease of the calculation result indicates that texture does have an influence on the elastic modulus for molybdenum. In addition, for the elastic modulus of the initial sample, the difference between calculation result and the test result is 14 GPa, however, the value is up to 100 GPa for the sample after HPT processing. Comparing the characteristics of microstructure between the initial sample and HPT-processed sample, dislocation density and volume of grain boundaries are in high level for the latter. So it can be detected that texture is not the major factor resulting in the significant decrease of elastic modulus, but the high density of dislocations and non-equilibrium grain boundaries with high internal stress. Figure 8 shows the TEM bright-field image after 5 turns with the corresponding selected-area electron diffraction (SAED) patterns. It shows ultrafine grains and nanograins with reasonably equiaxed in shape the sizes of about 200–300 nm. The grain boundaries have diffuse appearances which is typical of the non-equilibrium grain boundaries. The SAED patterns contain many diffuse spots oriented around rings which are consistent with high levels of internal stress within these samples. It is known that dislocations and grain boundaries have an influence on the atomic arrangement, further affect the bonding between atoms. The high density of dislocations was induced by the severe shear deformation, and the non-equilibrium grain boundaries with high angles were generated. The extra dislocations lead to the higher energy of the boundaries, which is beneficial to the generation of elastic stress layer around the grain boundaries. Therefore, the elastic modulus for the HPT-processed Mo can be expressed as
TEM bright-field images (on left) and the corresponding SAED patterns (on right) for Mo processed by HPT with 5 turns. Volume fraction and elastic modulus of different texture.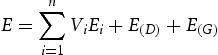
Summary and conclusions
UFG Mo with HAGBs was obtained by HPT with the applied pressure of 6 GPa at the RT. The grain size was refined from 383 ± 64 µm to 0.77 ± 0.17 µm after 5 turns, and the textures of {012}<121> and {001}<110> were generated. The dislocation density after 2 turns of HPT increases obviously to 7.8 × 10¹⁴ m−2, which is 4 times higher than that in the initial sample. But the dislocation density after 5 turns of HPT deformation has a slight decrease to 5.1 × 10¹⁴ m−2 due to dynamic recovery. Grain refinement and high density of dislocations result in the significant improvement of nanohardness after 5 turns of HPT, but the elastic modulus of pure molybdenum has a great decrease from 321 ± 10 GPa to 207 ± 6 GPa.
Footnotes
Acknowledgement
This work was supported by the National Natural Science Foundation of China (51705118, 51675154), the Fundamental Research Funds for the Central Universities (JZ2019HGTA0048) and the Program for New Century Excellent Talents in University (No. NCET-13-0765).
Disclosure statement
No potential conflict of interest was reported by the author(s).