






Abstract
Selective laser melting technology was proposed to form the multi-element mixed rare earth magnesium alloys of Mg–3.4Y–3.6Sm–2.6Zn–0.8Zr (wt-%). The formation process, relative density, evaporation, microstructure and microhardness of the deposited samples at different laser power and scanning speed were characterised. Under the experimental conditions with a laser power of 40 W and a scanning speed of 300 mm s−1, the maximum relative density of the sample is 98.6%. The evaporation of elements exists but is not serious under all process parameters. Compared with the as-cast process, the microstructure of the samples prepared by SLM is mainly composed of α-Mg matrix and (Mg, Zn)3(Y, Sm) eutectic phase, Mg12(Y, Sm)Zn eutectic phase and LPSO structure are not found.
Keywords
Introduction
As the lightest metal structural materials, magnesium alloys have been widely applied in aerospace, mechanical manufacturing, biomedicine and other fields because of their low density, high specific strength and large elastic modulus [1,2]. However, the mechanical properties of magnesium alloys are poor at high temperature, the strength and creep resistance decrease sharply when the temperature increases. The addition of mixed rare earth elements can improve the high temperature mechanical properties of the magnesium alloys [3]. In recent years, the development of new rare earth heat-resistant magnesium alloys is one of the important topics.
The rare earth heat-resistant magnesium alloys are usually produced by high pressure casting. The grain size of the casted Mg alloys is coarse, and it is easy to generate some common defects such as composition segregation, shrinkage cavity and crack, which reduces the mechanical properties. On the other hand, it is difficult to form thin-walled parts with complex shapes by casting. So, it is urgent to develop a new formation technology to produce the mixed rare earth magnesium alloys [4].
Selective laser melting (SLM) technology is a rapid manufacturing process and it gets the metal powder melting with laser to produce directly complex 3D metal parts [5]. In SLM processing, a 3D CAD model is made by the computer and after slicing, the powder is scanned selectively by the laser beam so that the powder is melted and solidified rapidly, and the parts are manufactured by layer-by-layer accumulation. SLM is a process of rapid cooling and solidification, so non-equilibrium supersaturated solid solution and fine microstructure can be obtained, and formed parts with complex shape, high relative density and good mechanical properties can be prepared [6,7]. Up to now, the research on SLM of Mg alloys is much less than other popular alloys (aluminium [8], steel [9,10], titanium [11], nickel [12], etc.). The SLM of traditional commercial magnesium alloys such as AZ91D, ZK60, WE43 and AZ61 has also been studied [13-18]. But the SLM of multi-element mixed rare earth magnesium alloys has not been reported.
In this work, selective laser melting (SLM) technology was proposed to form the multi-element mixed rare earth magnesium alloys of Mg–3.4Y–3.6Sm–2.6Zn–0.8Zr (wt-%). The formation process, relative density, element evaporation, microstructure and microhardness of the deposited samples at different laser power and scanning speed were studied and characterised.
Experiment
The non-spherical Mg–3.4Y–3.6Sm–2.6Zn–0.8Zr (wt-%) alloy powders were obtained by grinding of as-cast alloy ingot and ball milling, and the powders particle size ranged from 40 to 80 (a) SEM image showing characteristic morphology of powders, (b) particle size distribution, (c) EDS chemical point in (a), (d) the schematic of SLM processing, (e) and (f) morphology of the selected laser melted samples. were used as the initial material in SLM experiments. The morphology, particle size distribution and EDS chemical compositions of the powders are shown in Figure 1(a–c).

BLT-S210 (Xi'an Bright Laser Technologies Co., Ltd.) was selected as the selective laser melting equipment, equipped with Nd: YAG laser with a wavelength of 1080 nm, the maximum laser scanning speed is V = 7 m s−1 and the maximum laser power is P = 500 W. High purity argon (99.99%) was used as the shielding gas, which was continuously injected during the entire formation process while the gas in the formation chamber was exhausted. The oxygen content in the formation chamber is about 10 ppm, which was detected in the expulsion of gas. In the present study, the laser spot diameter (D) is 60  , the hatch spacing (S) is 80
  , and the thickness of powder layer (T) is 20
  , the substrate material is ZK61M and has been preheated to 180°C during the experiment. The laser power (P), scanning speed (V) and scanning strategy are shown in Figure 1(d). During single-layer scanning, the area is divided along the single diagonal direction, the number of areas is 2, and the prepared sample size is 10 × 10 × 10 mm (Figure 1(e)).
Microstructures of the selected laser melted samples were observed by the scanning electron microscope (SEM) and phase analysis of each sample was checked by the X-ray diffractometer (XRD), the content of each element was measured by the X-ray fluorescence spectrometry (XRF), and the relative density was measured by Archimedean method. Microhardness tests were carried out at a load of 200 g and a holding time of 10 s and 8 indents with 0.5 mm intervals were made in each sample.
Results and discussion
Formation process
The results of sample preparation under 35 groups of parameters are shown in Figure 2. I is the area with insufficient powder melting, II is the normal area of formation process, III is the area with serious macro cracks, and IV is the area with abnormal formation during the SLM. The experimental results show that the formation of the SLM process of Mg–3.4Y–3.6Sm–2.6Zn–0.8Zr (wt-%) alloy mainly depends on the laser power. Due to the eutectic phase formed by the traditional element Zn and the rare earth elements Y and Sm may increase the residual stress during the rapid solidification process. When the power is more than 60 W (Region IV), the sample is warped during the SLM processing (Figure 1(f)), in this case, no part can be formed by Mg–3.4Y–3.6Sm–2.6Zn–0.8Zr (wt-%) alloy. As shown by area III, when the laser power is equal to 60 W, the prepared sample has serious macro cracks (Figure 1(f)) no matter how fast the scanning speed is selected. The SLM process of the sample in area II can be completed normally, and subsequent experimental research can be conducted. When the laser power is 30 W and the scanning speed is equal to 500 mm s−1 (area I), black smoke is produced during the SLM processing, which is caused by the insufficient heat accumulation, the insufficient melting of the powder.
Results as function of the range of laser powers and scan speeds.
During the SLM process of Mg–3.4Y–3.6Sm–2.6Zn–0.8Zr (wt-%) alloy, although the energy density has an absolute influence on the heat input in the formation process, the influence of the laser power on the bath temperature is greater than that of the scanning speed. Therefore, the change of laser power has a greater impact on the formation process of selected laser melted samples, so the energy density is not used as the formation parameter. The corners of the sample are in contact with the surrounding powders more, while the centre part is in contact with the formed solid area. Due to the difference in heat transfer efficiency between powders and solid area, different parts of the sample experience different thermal effects. Figure 3 shows the samples and schematic diagram of the warping process. After the single-layer powder laser scanning is completed, the heat transfer efficiency of the solid area is greater than that of the powder layer, so that the intermediate temperature of the solid area is lower than the edge area, so the middle portion shrinks and the edge expands. As the laser scans, the direction is turned at the edge, which increases the residence time of the laser and further increases the accumulation of heat at the edge, making the temperature of the edge greater than the middle area, especially at the corner. This uneven heat distribution and large temperature gradient will cause warping of the alloy samples. And the gradual accumulation of residual stress will eventually lead to cracks. On the other hand, when the laser power is 50 W, the sample prepared at lower speed is normal, and micro-cracks are also generated at higher speed. Because cracks are gradually generated when the parameters are changed, and the micro-cracks (50 W, 500 mm s−1) are much smaller than the severe macro cracks at high power in Figure 1(f). The temperature of the molten pool is relatively high at 50 W (compared to 40 W), and the cooling rate of the SLM process is usually (a) image of the warped samples, (b) schematic diagram of the warping process. , such a large cooling rate will not increase the cooling time of 50 W. Therefore, the relatively large temperature gradient causes micro-cracks in the sample due to higher residual stress. The increase in speed increases the cooling rate although the effect is very slight, the sample has micro-cracks at 500 mm s−1 (compared to 400 mm s−1) due to greater residual stress.

Relative density
The maximum value of the relative density is 98.6% when the scanning speed is 300 mm s−1, and the laser power is 40 W, as shown in Figure 4. At all of the laser power, when the scanning speed increases from 200 to 300 mm s−1, the relative density increases and reaches the maximum at 300 mm s−1. When the scanning speed gradually increases to 600 mm s−1, the relative density generally shows a downward trend, and the change trend of relative density is the same at all of the laser power. The reason is that in a smaller laser power range (30–50 W), the stability of the molten pool is better at 300 mm s−1. The high scanning speed will cause the powder particles to splash during the formation process, while the low scanning speed will increase the recoil pressure of the molten pool and decrease relative density of the sample. When the laser power is 60 W, all the samples show serious macro cracks, so the relative density is not calculated.
Relative density of the selected laser melted samples at different parameters.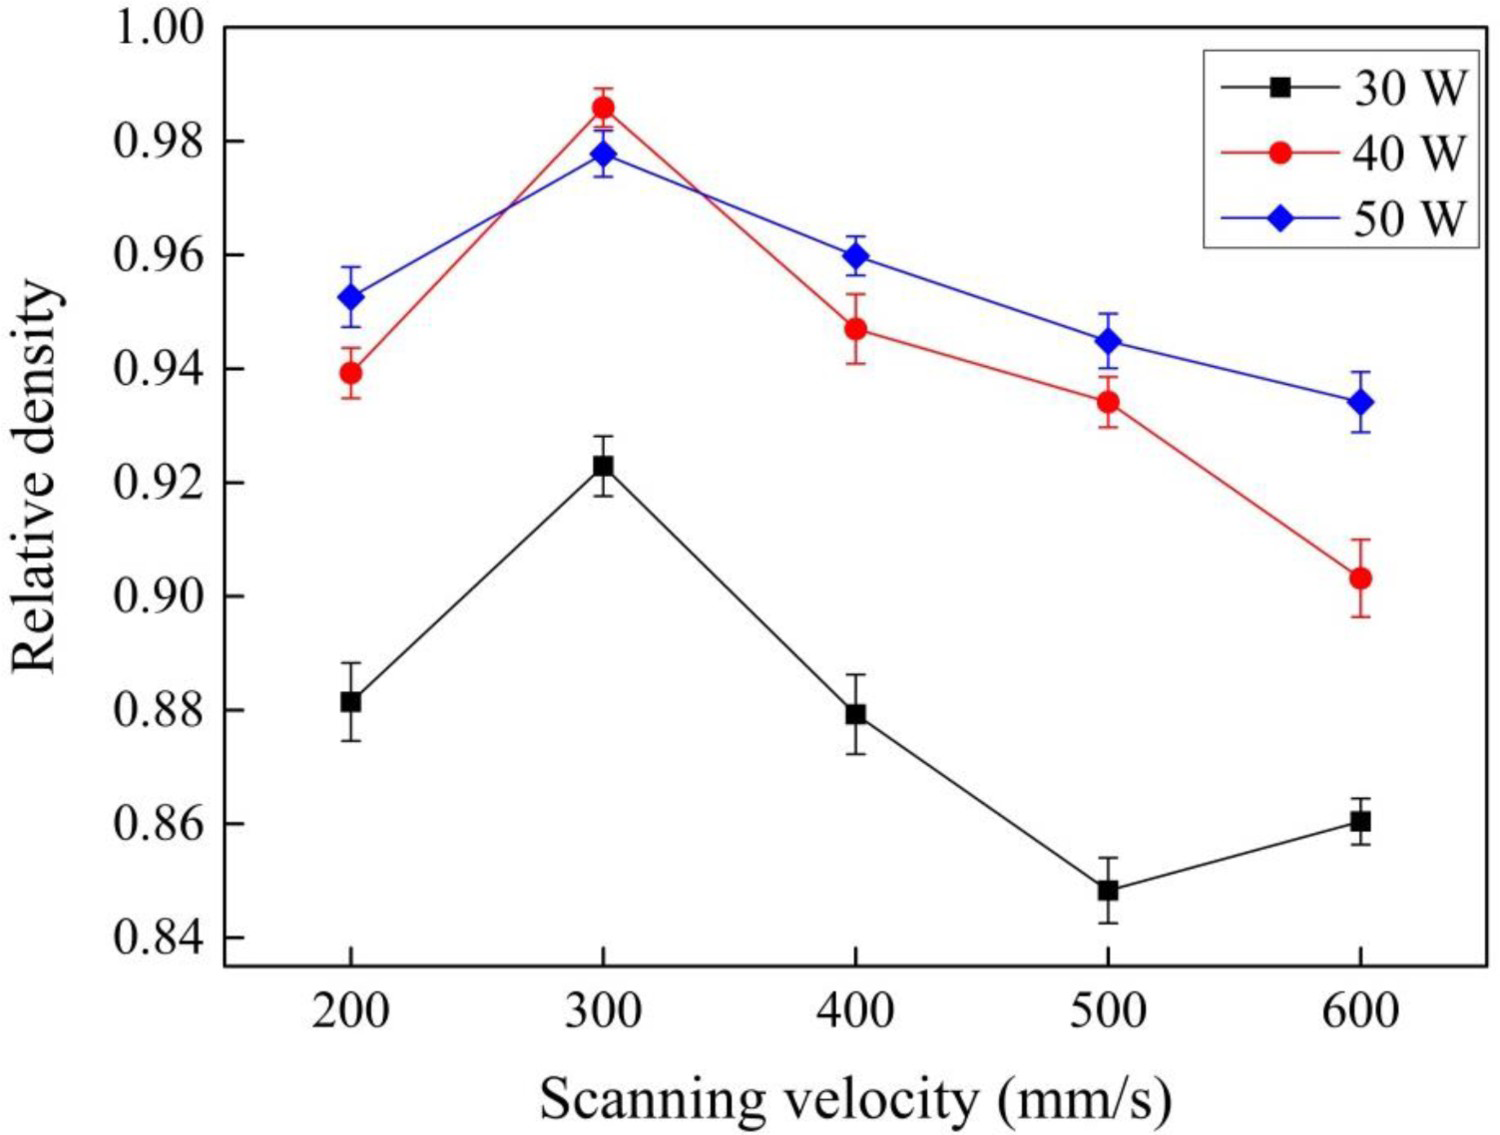
Figure 5 shows the surface morphology of the samples under different laser powers. As the laser power increased from 30 to 60 W, the sample surface was gradually flattened. When the laser power is 30 W, more serious ‘spheroidization’ phenomenon and unmelted powders and voids generate in the sample, but as the laser power increases, these defects have been significantly improved. The ‘spheroidization’ phenomenon is mainly due to the competition between droplet solidification and spreading. According to the calculation formula of droplet solidification time (1) and complete spreading time (3) [19, 20]:
SEM images showing surface morphology of the samples at different laser power, 300 mm s−1: (a) 30 W, (b) 40 W, (c) 50 W, (d) 60 W.


 is the specific heat capacity,
  is the thermal conductivity, r is the radius of the droplet,
  is the density of the droplet,
  is the surface tension of the droplet,
  is the temperature of the substrate,
  is the temperature of the droplet,
  is the solidus temperature.
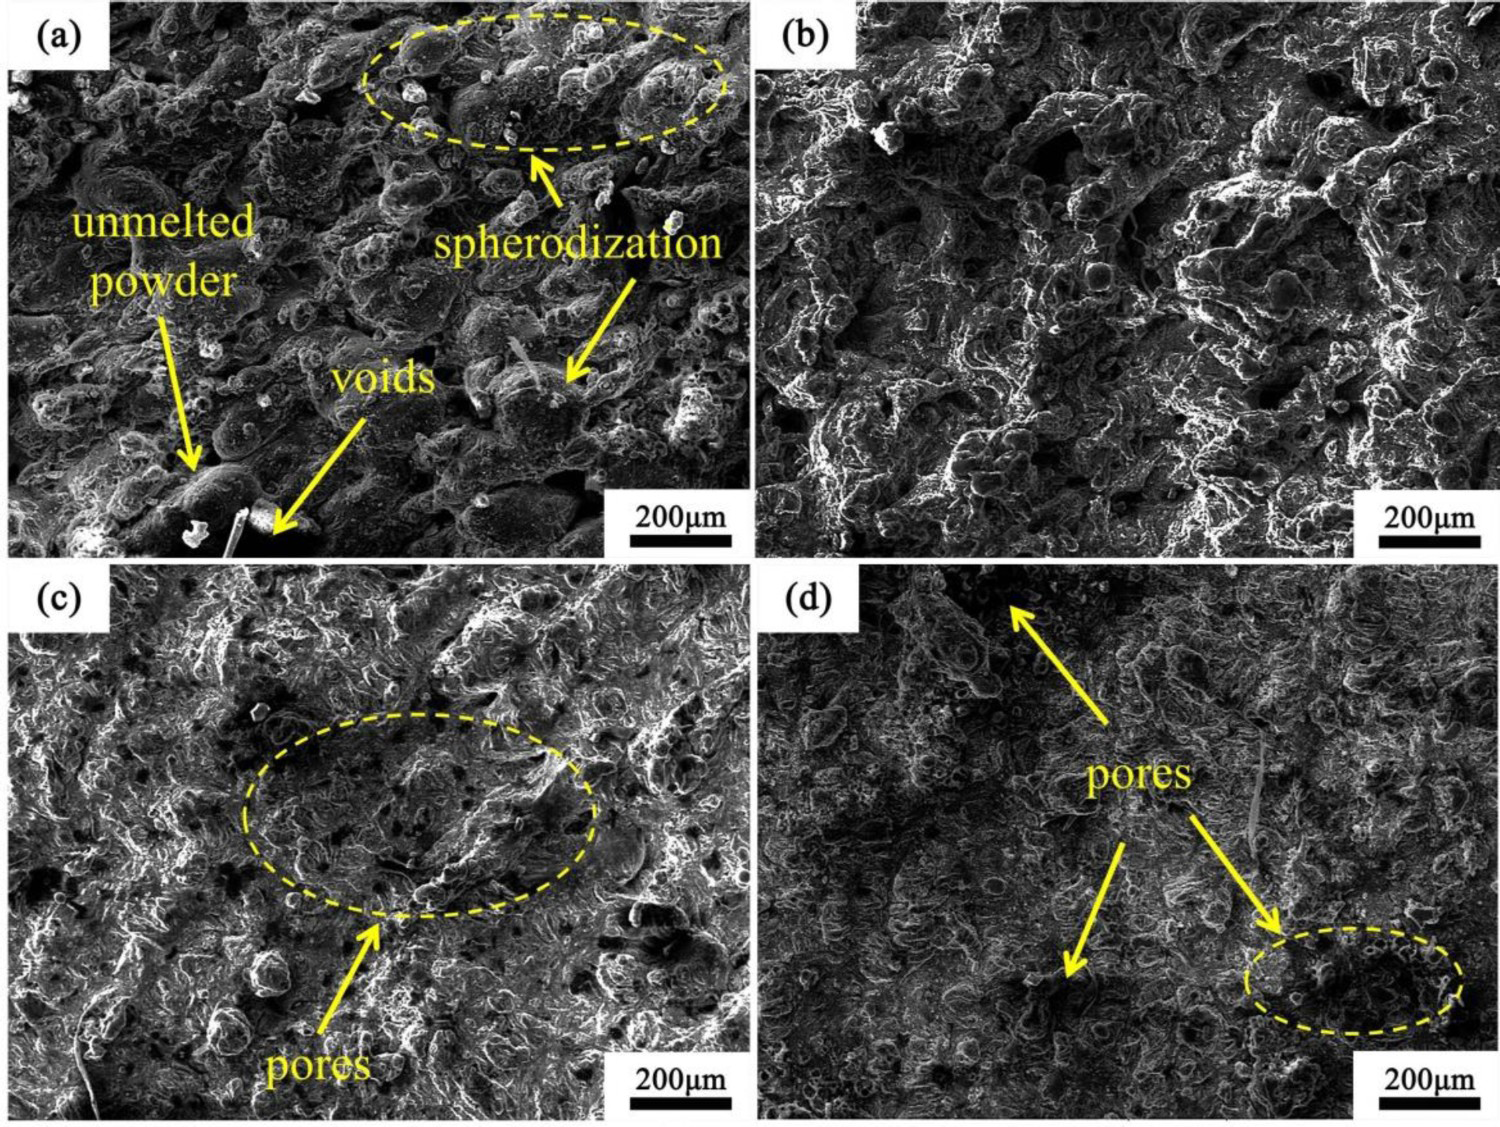
According to the calculation formula (3), the complete spreading time of Mg–3.4Y–3.6Sm–2.6Zn–0.8Zr (wt-%) alloy is 54.4 μs. The solidification time is considered to be the time when the droplet drops from the melt temperature to the solidus temperature. We calculated the curve of solidification time with the droplet temperature that is presented in Figure 6 (cf. Fe, Ti, Al [19]). Low laser power, due to insufficient heat accumulation, makes the molten pool temperature lower, and the solidification time of the droplet is shorter. In the process of solidification and spreading, the droplet has already solidified when it is not fully spread, so there will be a lot of ‘spheroidization’ phenomenon. On the other hand, an increase in the scanning speed will increase the cooling rate of the droplet, which promotes the solidification behaviour of the droplet and hinders spreading, thereby exacerbating the ‘spheroidization’ phenomenon. At the same time, due to the bulk density of the powder in the SLM process, under insufficient heat input, the molten liquid is not enough to fill the pores between the powders, which will cause a large number of voids in the formed sample. As shown in Figure 5(a,b), when the laser power is increased from 30 to 40 W, the ‘spheroidization’ and voids of the sample are significantly decreased, so the relative density is increasing and reaches the maximum value of 98.6% at 40 W. When the laser power continues to increase to 50 and 60 W, although the surface of samples is gradually flattened, the high energy input causes the element to evaporate, formation circular pores in the samples as shown in Figure 5(c,d). Therefore, the relative density of the sample is decreased. These circular pores are mainly caused by the movement of bubbles during the evaporation of the Mg element in the molten pool, which is different from the formation of voids where powders are not completely melted at 30 W.
The curve of the solidification time with the droplet temperature.
Evaporation
The element evaporation of Mg–3.4Y–3.6Sm–2.6Zn–0.8Zr alloy in the SLM process is mainly manifested by the decrease of Mg element content. Figure 7 shows the content (wt-%) of Mg element at different power at 300 mm s−1. As shown in Figure 7, the content of Mg element is 88.4% of the laser power at 30 W, so there is only micro evaporation compared with the nominal component of 89.6%. When the laser power is increased to 40, 50 and 60 W, the content of Mg element is 83.1%, 82.0% and 81.9%, respectively. With the increase of laser power, the evaporation of Mg element increases gradually, but there is no serious loss. This is because the alloy has a narrow range of molten pool temperatures during the SLM process (Figure 6). From the beginning of melting of the powder to the evaporation of the magnesium element, the value range is only 500 K, which is much smaller than other alloys. In the case of other process parameters being the same, as the laser power is increased from 30 to 60 W, the molten pool temperature is also rising, which increases the evaporation of the magnesium element. However, the overall relatively small laser power did not evaporate a large amount of magnesium.
Different processing parameters of Mg element content.
Microstructure
Figure 8 shows the microstructure of Mg–3.4Y–3.6Sm–2.6Zn–0.8Zr alloy in different processes, (a) as-cast and (b) SLM. After SLM processing, the grains of the alloy are fine equiaxed grains with an average grain size of 1.5 SEM images showing the characteristic microstructures of different processing (a) as-cast, (b) SLM. XRD patterns of the alloys in different conditions (a) as-cast and SLM, (b) SLM, 300 mm s−1. . According to XRD phase analysis in Figure 9(a), the alloy microstructure after SLM processing is mainly composed of the α-Mg matrix and eutectic phase
  (Y, Sm) distributed in a network along the grain boundary. Compared with the as-cast, no Mg12(Y, Sm)Zn eutectic phase was found during the SLM processing, which is caused by rapid solidification in the SLM process. The Mg12(Y, Sm)Zn phase is produced at low cooling rate, which is consistent with the research results of Zhang et al. [21]. Figure 9(b) shows the XRD phase analysis of the samples prepared under different process parameters of SLM. It can be found that the peak value in the XRD pattern does not change with the change of the process parameters, so with the change of the process parameters, no new phases were found or the old phases disappear, which may be due to the narrow range of process parameters. As revealed by the XRD chart, the Y2O3 phase is produced in the SLM process of the alloy, which is because of the large specific surface area of powder particles and strong oxidation of Y element although the oxygen content is guaranteed to be about 10 ppm in the SLM process.


Microhardness
Figure 10 shows the microhardness of the samples under different conditions. The laser power is increased from 30 to 60 W, and the microhardness of the samples is 102, 103, 104 and 106 HV, respectively. Although the change of process parameters does not significantly change the microhardness of the SLM formed samples, they are all greater than the as-cast microhardness of 80 HV. According to the Hall-Petch formula, grain refinement can significantly increase the microhardness of the alloy. The average grain size of 1.5 μm under SLM process (compared to as-cast, 40 μm) provides better microhardness.
Microhardness of the as-cast and selected laser melted samples, 300 mm s−1.
Conclusions
Selective laser melting of Mg–3.4Y–3.6Sm–2.6Zn–0.8Zr (wt-%) alloy has been carried out in this research. The warped model, ‘spheroidization’ mechanism and the influence of process parameters on the selected laser melted samples are analysed. The main findings are listed as follows:
Large residual stress is generated during the SLM formation process of this alloy under higher laser power, while serious ‘spheroidization’ phenomenon occurred under 30 W. Nearly dense and free of defects sample are obtained, the maximum relative density is 98.6% with laser power of 40 W and scanning speed of 300 mm s−1. Element evaporation during the SLM process of Mg–3.4Y–3.6Sm–2.6Zn–0.8Zr (wt-%) alloy is mainly manifested as the decrease of Mg content. As the laser power increases from 30 to 60 W, the Mg content decreases from 88.4 to 81.9 wt-%. The average grain size of selected laser melted samples is 1.5 μm, which is much smaller than the as-cast (40 μm), and main phases constitution: Mg matrix and eutectic phase (Mg, Zn)3(Y, Sm). Due to the grain refinement, the microhardness of the selected laser melted sample is close to 105 HV, which is an increase of nearly 31.3% compared with the as-cast (80 HV).
Footnotes
Acknowledgements
Thanks for the supports of the Key Research and Development Plan of Shaanxi Province (2020GY-255), Scientific Research Plan Projects of Shaanxi Education Department (20JC020), and Scientific Research Plan Projects of Xi'an Technology Department (2020KJRC0052).
Disclosure statement
No potential conflict of interest was reported by the author(s). We declare that we do not have any commercial or associative interest that represents a conflict of interest in connection with the work submitted.