
Abstract
This paper is focused on the investigation of fatigue failure mechanism for TC17 with surface roughness, which is the quantitative expression of surface micro-scratch. First, the designed fatigue tests for TC17 with different surface conditions are carried out to investigate the mechanism of fatigue failure behavior for TC17 with surface roughness. A modified formula is developed to evaluate the fatigue limit of TC17. Then, with the comprehensive application of S–N curve models and test results, the new finding of model parameters is adopted, leading to a fatigue life model of TC17 with surface roughness. Study of fatigue evaluation model of TC17 with surface roughness is significant in theoretical and engineering fatigue study.
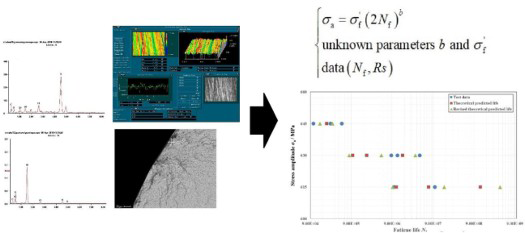
GRAPHICAL ABSTRACT
Introduction
Fatigue failure is the main failure form of metal materials and parts in actual working conditions [1-4]; according to the fracture mechanics and stress distribution law, fatigue crack initiation always prefer the position with free surfaces (or internal inclusions). Surface micro-scratches, as one of stress concentration factors, can't be neglected in the fatigue analysis and fatigue life evaluation for metal material [5,6], especially in a high-cycle-fatigue (HCF) and very-high-cycle-fatigue (VHCF). TC17 titanium alloy is no exception, which has been widely applied in the aerospace field for its excellent mechanical properties [7-10]: high strength to weight ratio, high strength, good corrosion resistance, low relative density and good high-temperature oxidation resistance. Many aerospace mechanical parts are manufactured by TC17, and in normal conditions, fatigue failure is the most threatening form of failure [11-13]. The surface micro-scratches can be easily caused in many situations (in the maintenance process or application period) and treated as a ‘fatigue defect’. In fatigue research, these micro-scratches are quantitatively expressed by the surface roughness, as two index values Ra and Rz. Ra has been widely employed to analyse the effect of surface roughness on the fatigue property for its advantages: first, both the surface micro-geometry and profile peak of the surface morphology can be reflected by Ra at the same time; second, the data acquisition and processing are simple. Another roughness index value Rz is the sum of highest and deepest groove depth at the minimum cross-section of the specimen. It is a critical value of the surface roughness that is unrepresentative to the surface quality. So, surface roughness Ra is also employed as quantitative expression of surface micro-scratch in this paper.
According to fracture mechanics, the high extent of surface roughness means the deep machining groove with the small radius of bottom grain. With the continuous effect of fatigue load, stress concentration occurs at the location of deep machining groove, weakening the fatigue property of TC17 to resist fatigue failure and thus specifically reduce the fatigue life of the material, by promoting the initiation and propagation of fatigue defect. A clear understanding of the effect of surface micro-scratch on fatigue failure is beneficial to TC17 fatigue study to avoid the sudden occurrence of the fatigue failure of TC17 components.
Quite a few investigations of fatigue property of TC17 and the surface roughness affecting material fatigue performance are carried out. Zhang et al. [14] investigated the effect of two typical microstructures on the fracture morphology of high-cycle fatigue. The results show that the surface defect is the main factor causing the fatigue failure and the macro-fracture surface of the samples with both microstructures is chartered by brittle fracture. Xu et al. [15] made an investigation about the effect of surface roughness on the EA4T steel, and this study proved that the surface micro-scratch will affect the fatigue limit of metal material significantly. A modified model is proposed to evaluate the fatigue limit of the EA4T steel. Sharifimehr and Fatemi [16] investigated the evaluation methods for estimating shear fatigue properties of steels and titanium alloys; Roessle-Fatemi method is employed to estimate the shear fatigue property and fatigue life of three different titanium alloys; furthermore, a modified model is proposed. Romero et al. [17] made a review for the fatigue and fracture properties of Ti alloys; microstructural features inherent to each specific method, such as porosity and phases, have on the fatigue and fracture behaviours were clarified. And a systematic and critical analysis of the current scientific knowledge about fatigue and fracture properties of titanium alloys is also performed. Gunther et al. [18] studied the effect of internal channels and surface roughness on the high-cycle fatigue performance of Ti-6Al-4V processed by SLM, and the failure mechanism of failure is found. Zhang et al. [19] investigated the fatigue failure behaviour of TC17 titanium alloy with ultrasonic fatigue test system, and a modified model was proposed to evaluate the fatigue life based on Paris formula. Based on the fatigue test and finite element simulation, Fan et al. [20] studied the fatigue life prediction method for titanium. Relation equation among fatigue life and surface roughness Rz was simulated; the correctness of the simulation results and equation were further validated by fatigue experiments. Ding et al. [21] investigated the effect of micro-scratch on the fatigue strength of TC17 titanium; a new fatigue strength model is proposed based on the geometric characteristics of micro-scratch.
Although some theoretical research results have been proposed, further study about TC17 fatigue failure with micro-scratches is limited. Especially there is short of the reliable testing data and effective evaluation method which can be used quantitatively to estimate the effect of surface scratches on the fatigue performance of TC17 titanium alloy. Neither the effect of surface micro-scratches on TC17 fatigue property nor the TC17 fatigue life prediction model with the consideration of micro-scratches is studied well.
This paper mainly focuses on analysis of the fatigue behaviour and the development of fatigue life model regarding surface micro-scratch for TC17. Designed fatigue tests of TC17 specimen with different surface roughness conditions are carried out; surface roughness Ra is employed to quantitatively express the surface micro-scratch. The effect of the surface micro-scratch on fatigue failure for TC17 is in detail analysed based on the observations obtained with scanning electron microscope (SEM), including morphology of crack initiation, crack propagation region and energy spectrum analysis curves. Then, a modified fatigue limit evaluation model is proposed based on the Murakami equation to calculate the fatigue limit of TC17 with different surface conditions. With the comprehensive application of the Basquin model and test results, S–N curves for TC17 with different surface conditions are obtained. Then two new modified formulas are proposed to quantitatively describe the relationships between the model parameters and the surface roughness. The new finding between model parameters and Ra is adopted, leading to the development of a new fatigue life model for TC17 as a function of surface micro-scratch. The new proposed model for TC17 is verified by a comparison among the new calculated fatigue life, theoretical model results and the test data.
A frame work has been done in analysing fatigue property of TC17 affected by micro-scratch and proposing a revised estimation method to predict the fatigue life under different surface conditions, which will enhance the accuracy of the fatigue life prediction in engineering practice of TC17. This experimental study is valuable in engineering and also very supportive to future theoretical development of TC17 fatigue study.
The fatigue test
Material and mechanical properties
The chemical composition (wt-%).
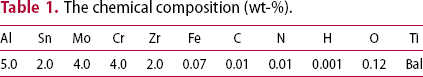
Mechanical property of TC17.
The specimen and test method
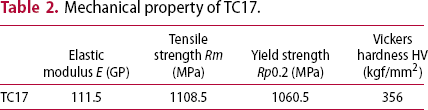
Standard hourglass type test specimen is employed as the specimen in this test; it is designed according to the elasticity modulus and density of TC17. The details of the specimen and test system are shown in Figure 1.
The specimen and test system.
The mean stress is set to 0, which means the stress ratio r = −1. The maximum stress amplitude is 675 MPa and the minimum one is 615 MPa; the interval is 15 MPa. Air cooling is employed to avoid the influence of temperature rising. Both stress amplitude and the relevant fatigue life will be recorded. The microstructure and morphology of the fracture surface are observed by SEM, and the energy spectrum analysis will be carried out after the observations to make sure the chemical composition of the fatigue fracture region. All these results and test data will be used to analyse the effect of surface roughness on TC17 fatigue failure. The test is ceased at nearly 1 × 10⁸ cycles.
A variety of parameters can be used to express surface roughness, including Ra, Rz, Rq, Rvk, Sk, Ku and so on. Ra is the average surface roughness, or average deviation of all points from a plane fit to the test part surface. Rz is the sum of highest and deepest groove depth at the minimum cross-section of the specimen. It is a critical value of the surface roughness that is unrepresentative to the surface quality. Rq is the root-mean-square roughness; it is the root-mean-square of the deviation of contour mean. Rvk is the reduced peak height; the lowest part of the surface that retains lubricant. Sk or Rsk is the roughness slope, which represents the asymmetry of the contour height amplitude curve relative to the average line. Ku or Rku is a measure of the randomness of profile heights, and of the ‘shapness’ of a surface. In the study of the fatigue failure and life evaluation, Ra is the most widely used parameter to analyse the effect of surface roughness on the fatigue property for its advantages: first, both the surface micro-geometry and profile peak of the surface morphology can be reflected by Ra at the same time; second, the data acquisition and processing are simple. Murakami proposed that surface micro-scratch can be equivalent to surface fatigue defect, and surface roughness Ra is employed to model the quantitative expression of the equivalent surface fatigue defect. Other parameters like Rq, Pkv, Rvk, Sk, Ku are important to measure the surface quality, but may not be suitable for the fatigue defect conversion or life evaluation.
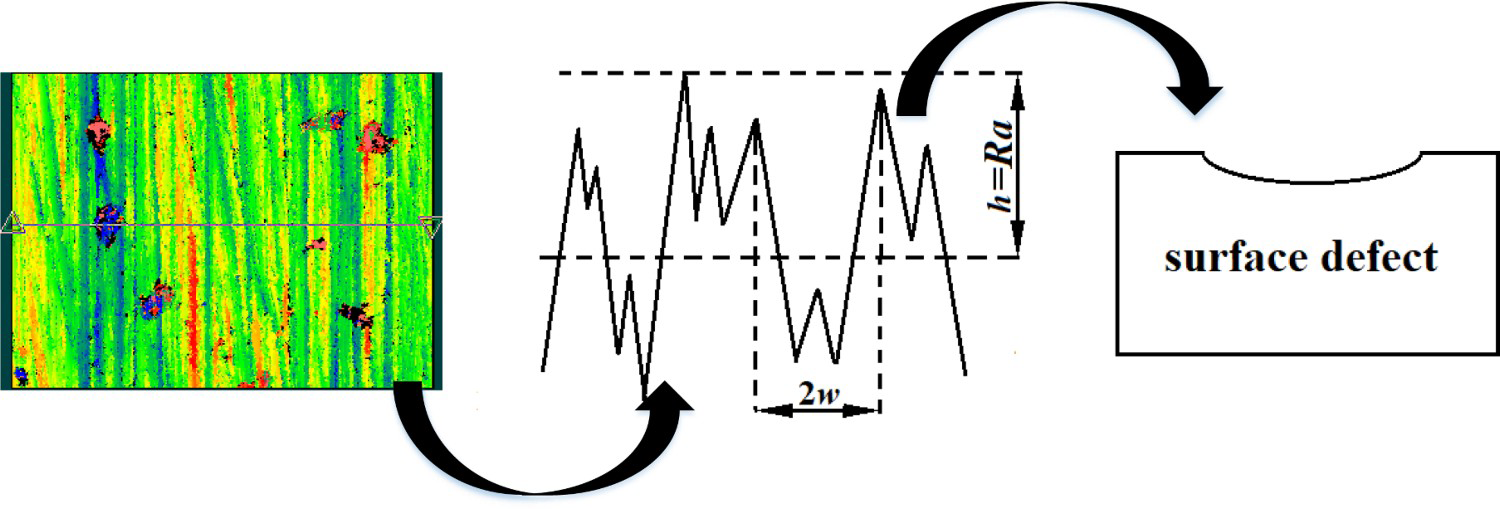
In order to analyse the effect of surface micro-scratch on the fatigue failure and property evaluation of TC17, the specimen with different surface conditions is employed in the fatigue test and the average surface roughness Ra is employed as the quantitative expression of surface micro-scratch. The specimens are divided into three groups: Group1, Ra1 ≈ 0.25 μm, Group2, Ra2 ≈ 0.6 μm, Group3, Ra3 ≈ 1.2 μm. With ZYGO surface profilometer, the surface roughness of the specimen is measured, the measurement direction is the direction of the maximum principal stress and the examples are shown in Figure 2.
The examples of the surface roughness measurement.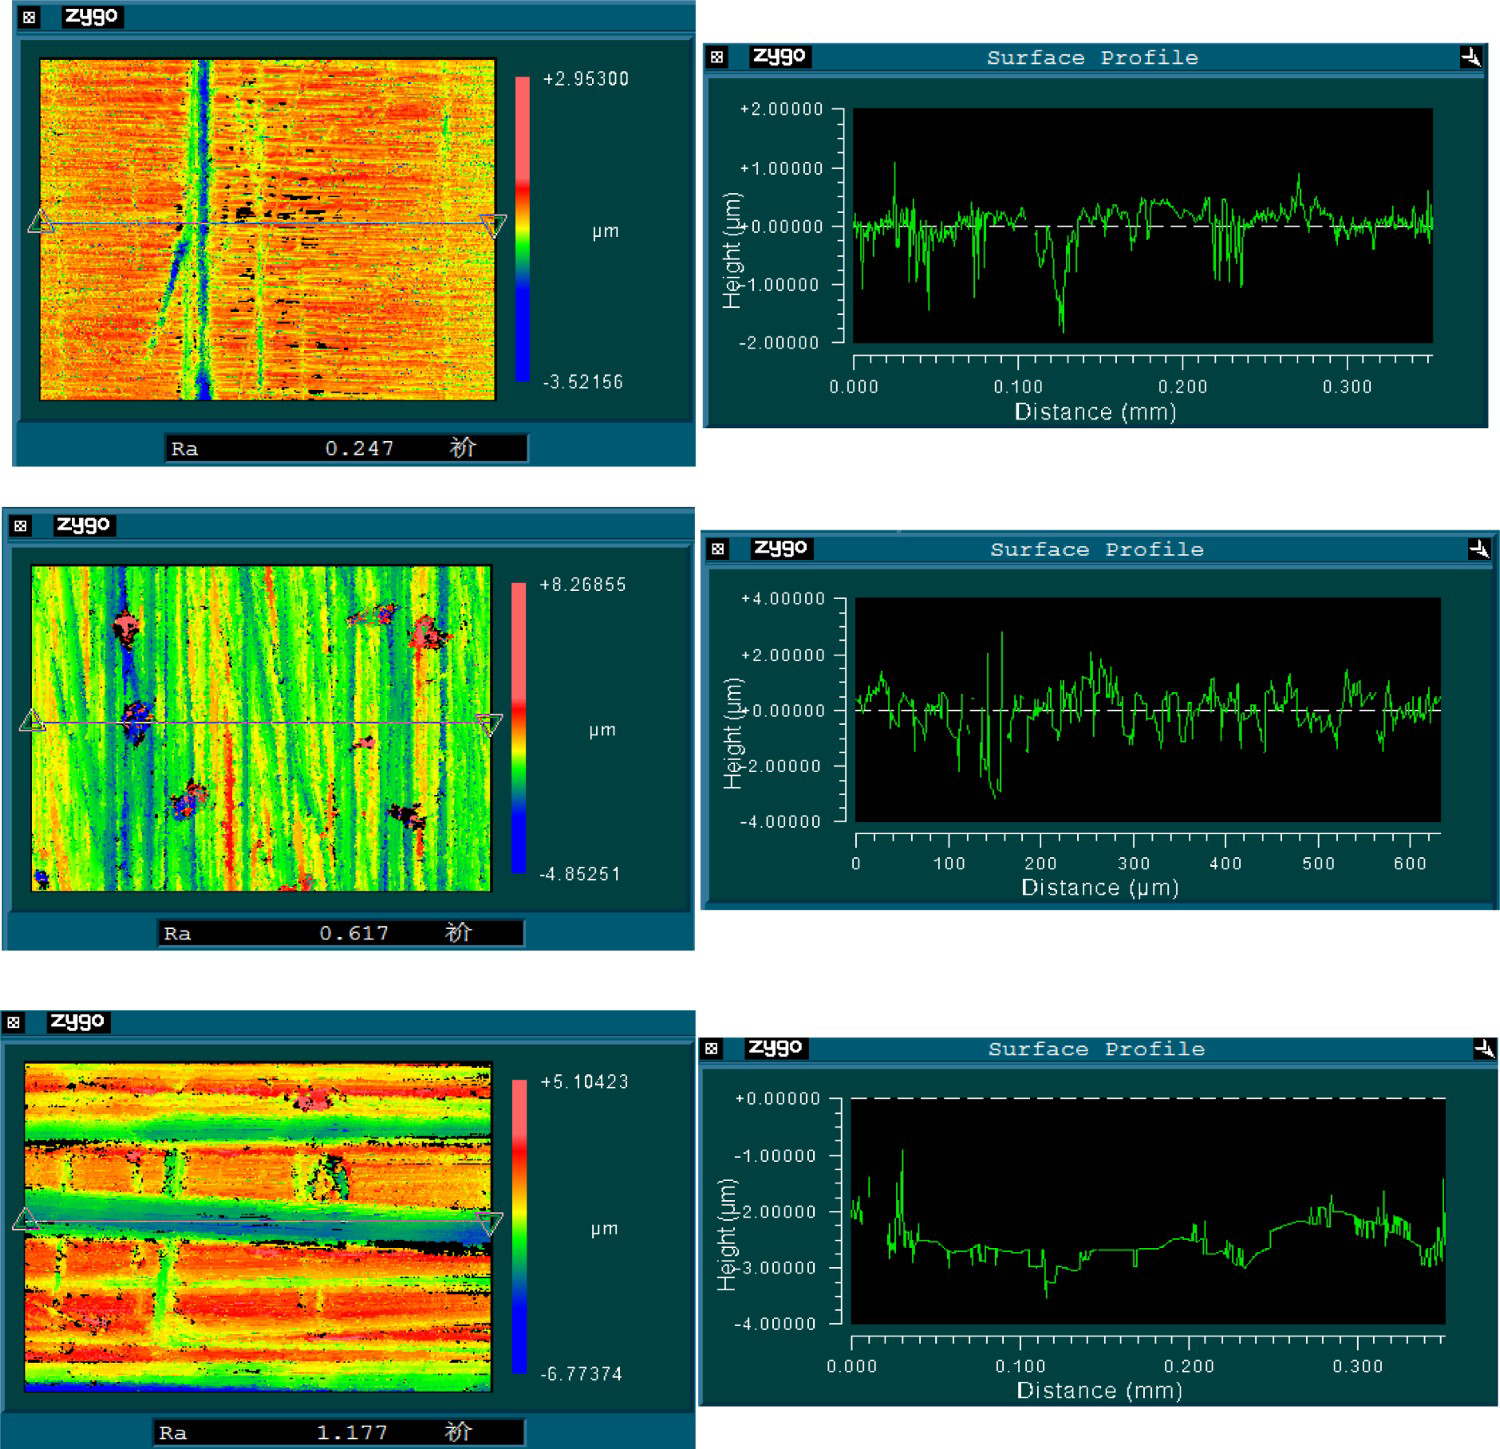
Results
The test results
The test data are recorded, including fatigue stress amplitude σa and fatigue life Nf, as shown in Figure 3. The fatigue life mainly concentrated in the high-cycle fatigue (105 < Nf < 107); only five specimens have fatigue life more than 107 cycles. Three specimens don't fracture, and the rest of the specimen all have surface fatigue failure, including the specimen in the VHCF regime.
The test data.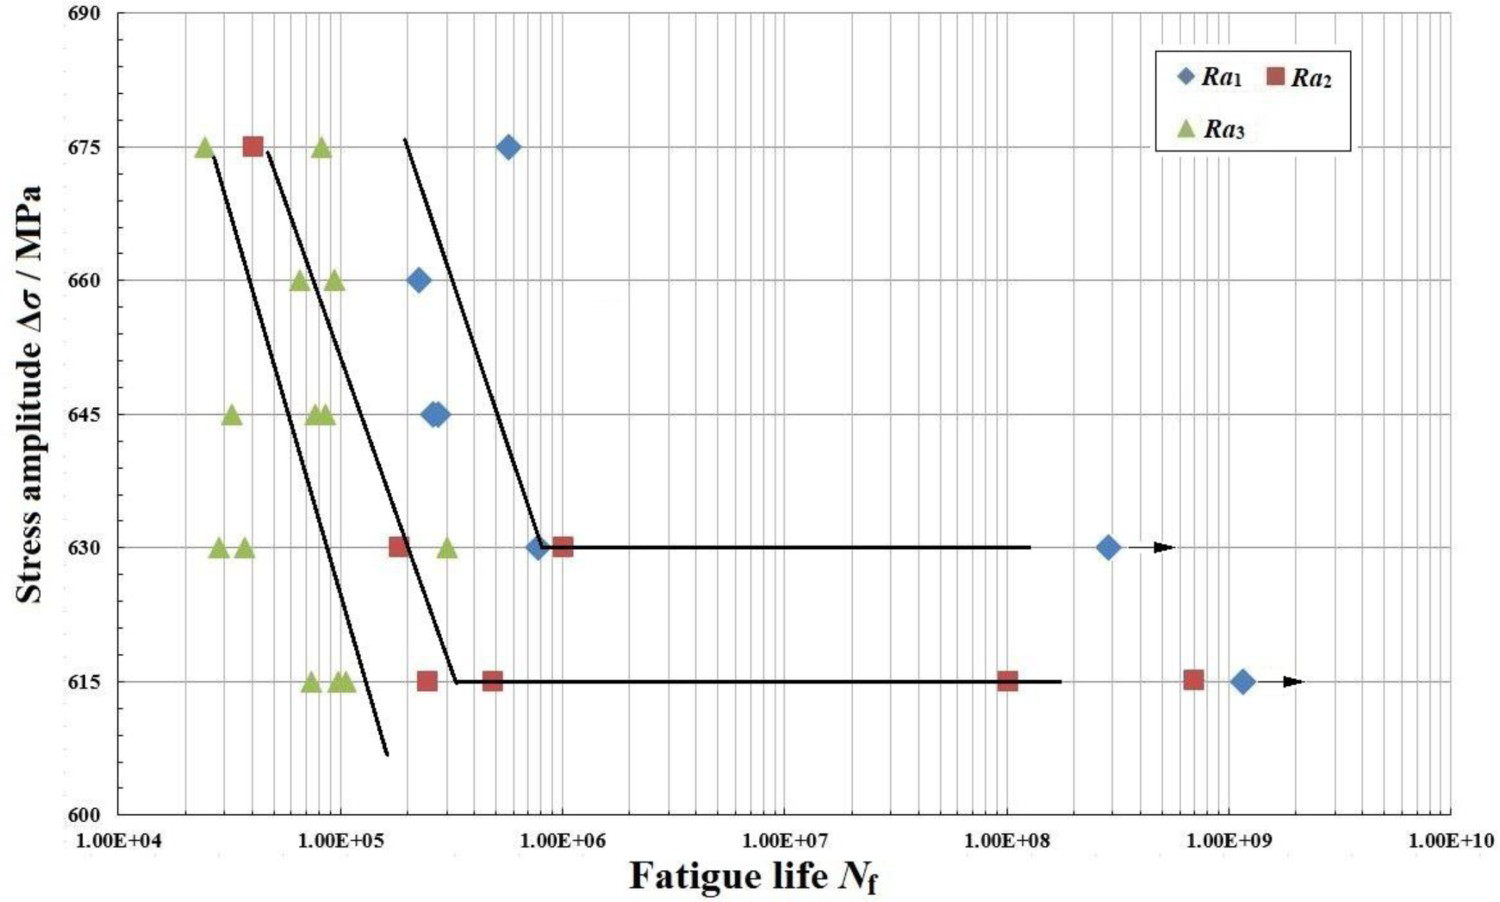
According to Figure 3, some characteristics of the TC17 test results are summarised: first, the distribution of test data in Figure 3 shows that, with the negative effect of surface micro-scratches, the fatigue limit of TC17 decreases obviously. For the specimen with the surface condition of Ra1, the fatigue limit is identified as 630 MPa. In addition, for the specimen with Ra2, the fatigue limit can be identified as 615 MPa. Second, with a certain stress amplitude, there is a negative-correlation relationship between fatigue life and surface micro-scratch, with the decrease in surface roughness, the fatigue life increases, in another words, small stress amplitude will cause the fatigue failure of TC17 specimen with big surface micro-scratch; third, three qualitative distribution trend curves between stress amplitude σa and fatigue life Nf are drawn in Figure 3, slopes of the curves increase with the decreases in surface roughness, with the decrease in the surface roughness, the dispersion of the test data distribution becomes bigger. For example, with the situation of Ra3, in the range of the stress amplitude from 615 to 675 MPa, the relevant fatigue life is about from 3 × 10⁴ cycles to 3 × 10⁵ cycles and the range-ability in one order of magnitude. But as the surface roughness decreases to Ra1, the fatigue life distribution becomes more discrete, the relevant fatigue life is about from 105 cycles to 109 cycles and the range-ability is about four orders of magnitude.
It should be pointed out that the straight line in Figure 3 only shows the qualitative distribution trend of the test data. It does not mean the surface roughness and the fatigue life satisfy a linear relation statistically. Moreover, the fatigue life evaluation model of TC17 considering the surface micro-scratch will be proposed, respectively, in The fatigue limit with surface micro-scratch for TC17 section, which will be used to quantitatively express the effect of surface micro-scratch on fatigue property and fatigue failure behaviour of TC17.
Fracture feature in HCF regime
As discussed above, surface micro-scratch has a significant influence on the fatigue property of TC17; most failure occurring in high-cycle regime. The morphology characteristics around the fatigue crack initiation site of some specimens in high-cycle regime are detected with SEM, as shown in Figure 4. After that, energy spectrum analysis is carried out to clarify the chemical composition of the crack initiation site to determine the type of defect that causes the fatigue failure.
The fatigue crack initiation sites.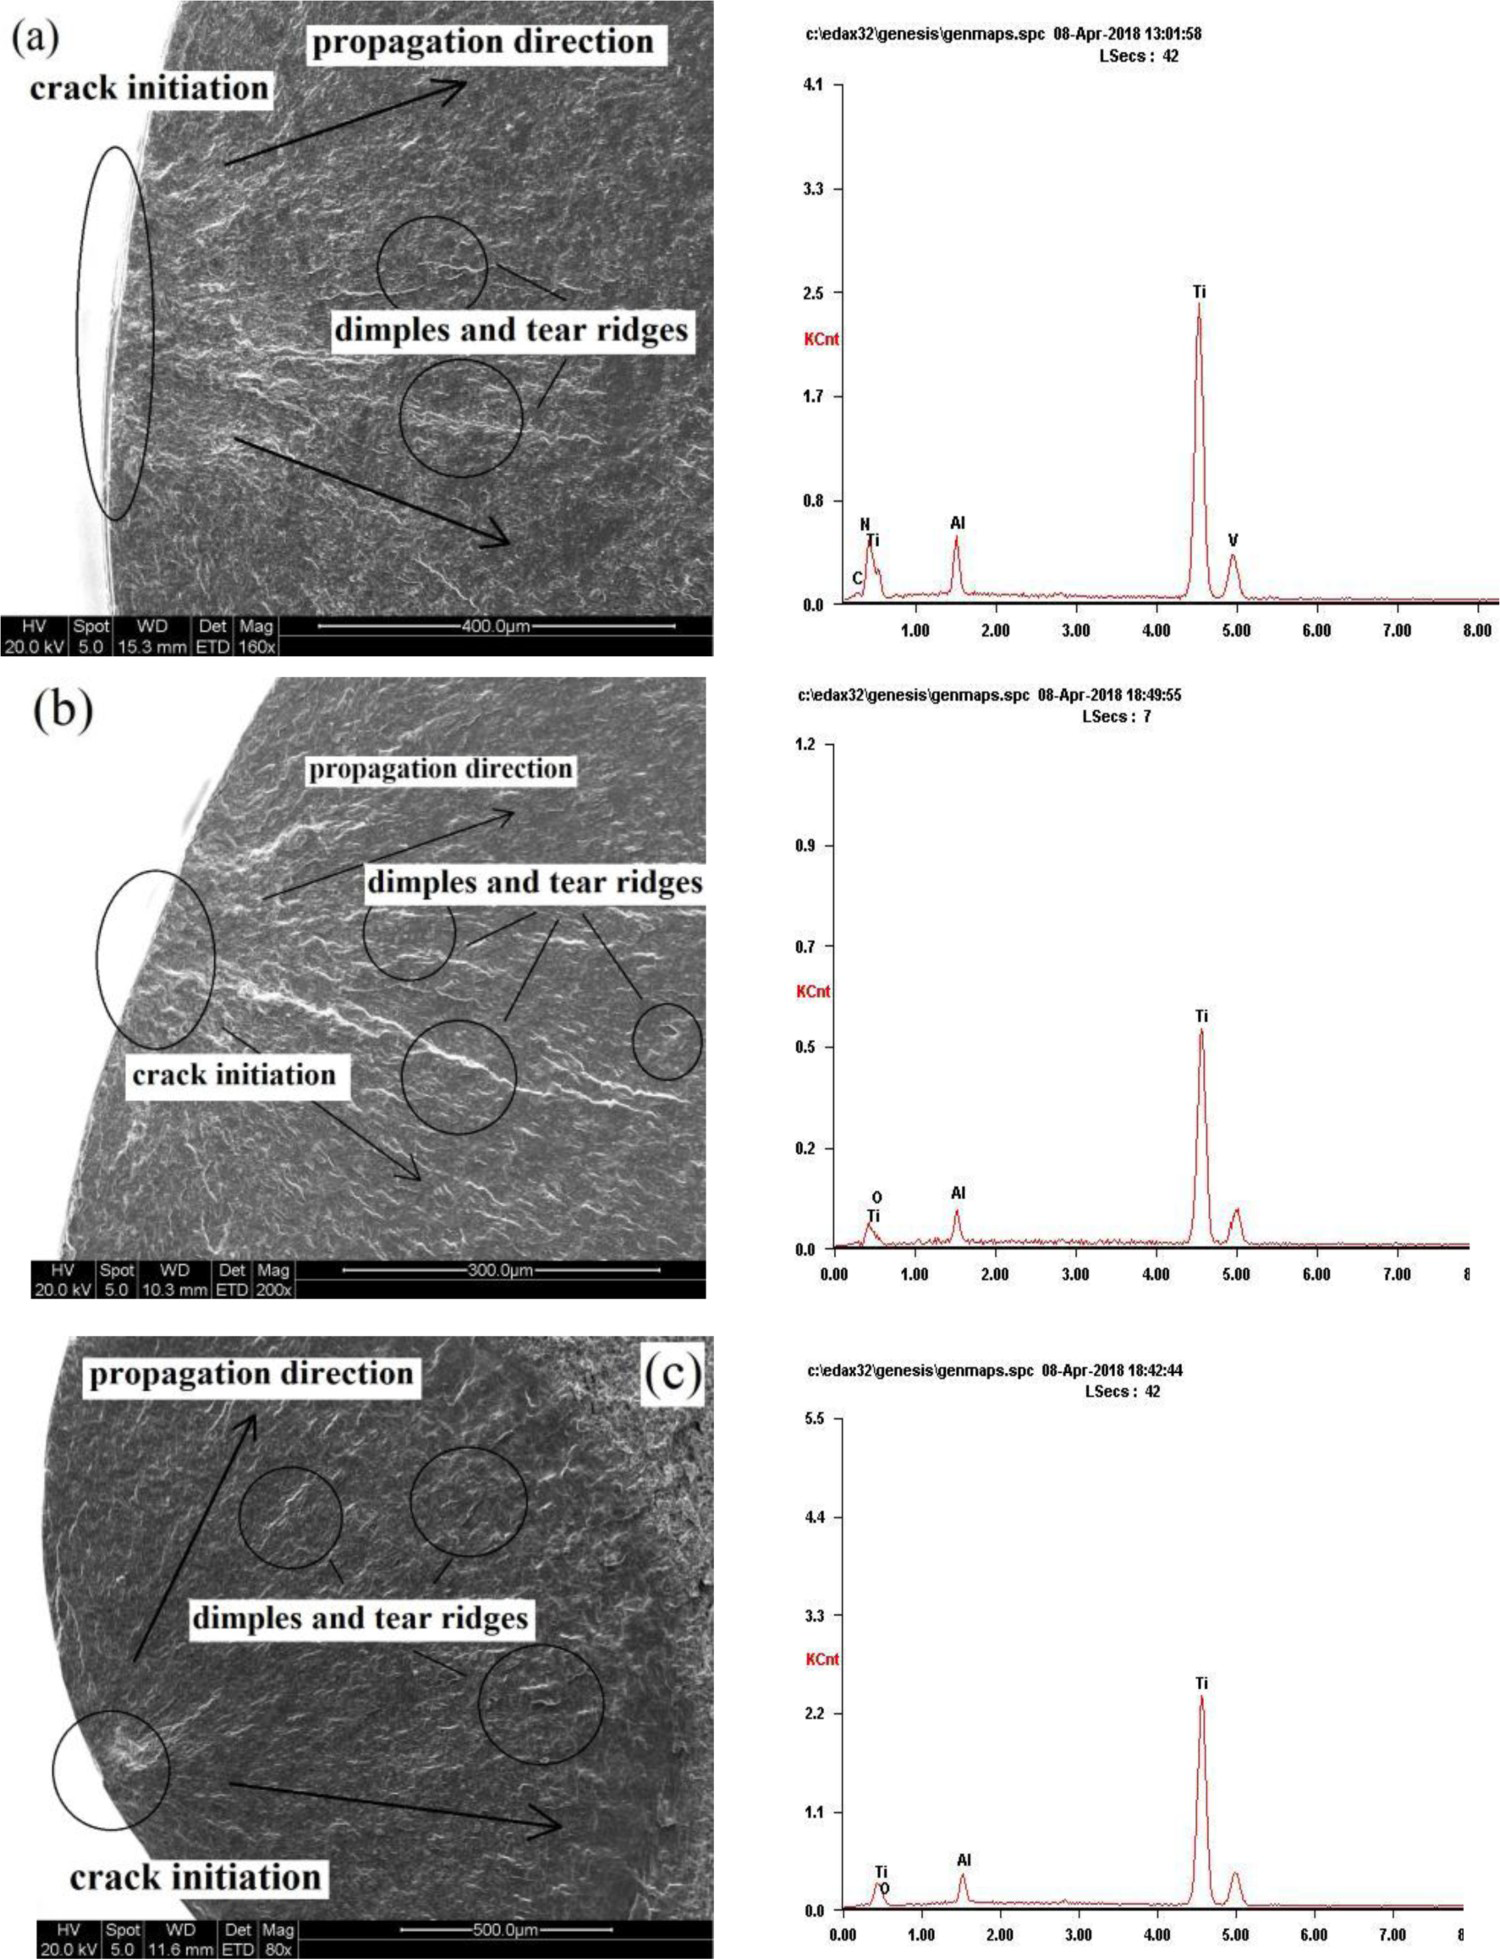
Figure 4(a) is the observation for Ra3, Figure 4(b) is for Ra2 and Figure 4(c) is for Ra1, which show the observations under the same stress amplitude. It is clear that no GBF region or ‘fish-eye’ is observed in Figure 5, which implies that the fatigue failure is caused by the surface micro-scratch. Figure 4(a–c) shows that with the increase in the surface roughness, the morphology of the matrix material around the crack initiation site becomes more and more corrupt, and the crack initiation region becomes bigger with the increase in the surface roughness. More than that, multiple failure sources are detected in the crack initiation region site for Ra3. These observations are caused by the effect of the surface micro-scratch increasing. With the increase in surface roughness, the surface micro-scratch will have more opportunities to cause the crack initiation. And during the crack initiation stage, the plastic deformation of the matrix material around the crack initiation sites progresses faster and faster, and the crack initiation procedure is promoted, resulting in the poor surface morphology.
Micro-topographies of the specimen in VHCF failure.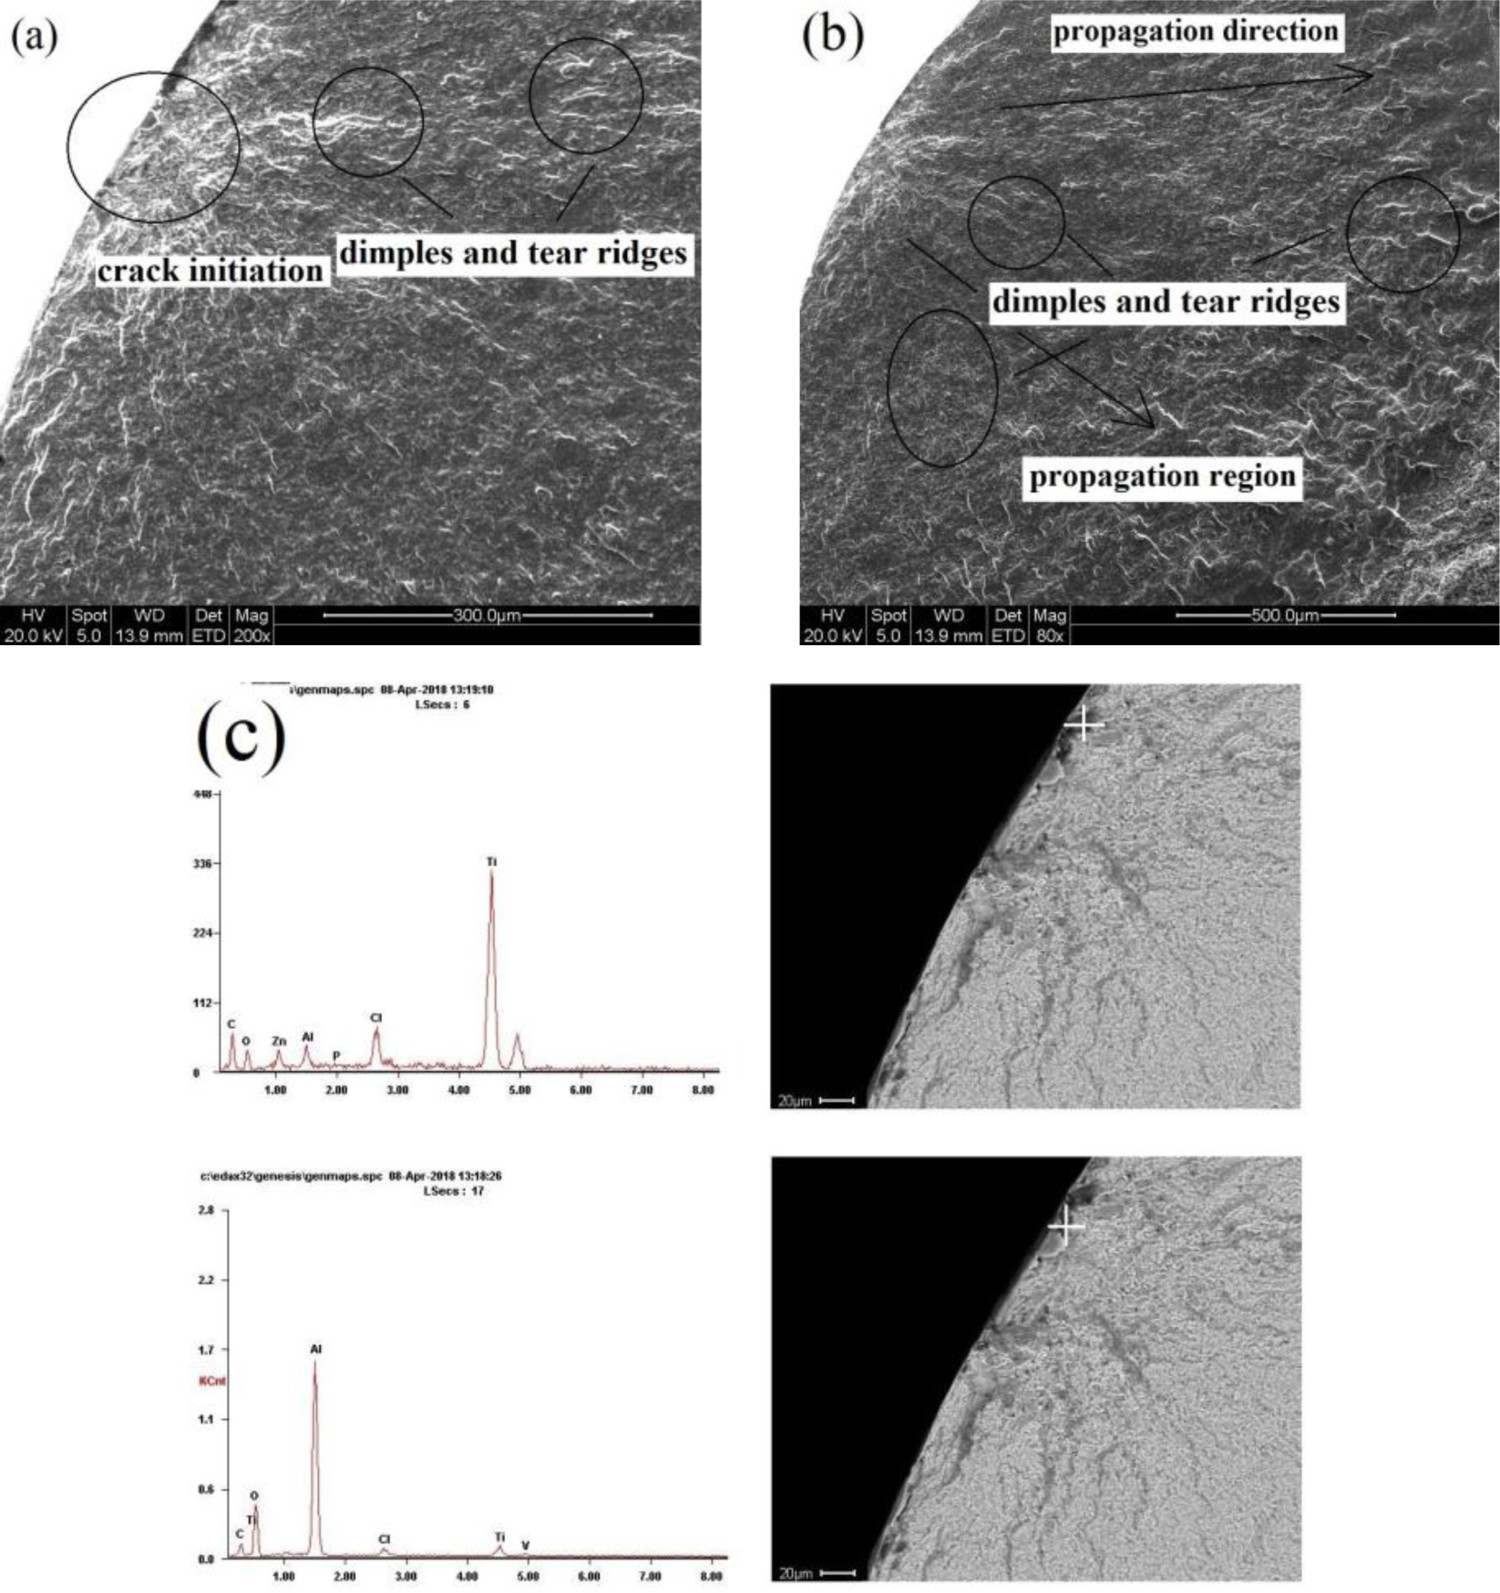
Another point from Figure 4(a–c) is that the surface micro-scratch has an influence on the fatigue crack propagation. Obvious dimples and tear ridges are clearly detected on the fracture surface. Dimples and tear ridges are the most significant characteristic of the surface failure, which is the same morphology of crack propagation with the normal fracture surface, caused by the surface defect that the crack propagates from the crack initiation site to the boundary between the stable propagation region and the instable propagation region. In the crack propagation stage, the plastic deformation of the matrix material around the fatigue crack progresses faster and faster; and the crack propagation procedure is promoted. This results in the high strain rate of fatigue crack propagation in high surface roughness. And it is difficult for matrix material to timely recover under high strain rate of fatigue crack propagation; therefore, the fatigue crack propagation continuous until failure happens, and dimples and tear ridges are left on the path of the fatigue crack propagation. So, as shown in Figure 4(a–c), with the increase in the surface roughness from Ra1 to Ra3, the dimples and tear ridges are observed and become more obvious.
The energy spectrum analysis result can also be adopted to verify the fatigue failure does initiate from the surface roughness, as the main chemical composition in the initiation site is Ti, and the content of the other chemical element is very low. This implies that the fatigue crack initiates from the surface matrix material, no inclusion or other chemical element that involved in the effect of the fatigue failure. Combining the observations and energy spectrum analysis results, it is clear that the surface micro-scratch should be allocated as the primary factor of the fatigue failure.
Observations in VHCF regime
Except the surface micro-scratches, the subsurface defects can also result in fatigue crack initiation within a low stress level (615 MPa) and small surface roughness conditions (Ra1 and Ra2). In Figure 3, two specimens with fatigue life in the VHCF failure regime are obtained. The micro-topographies of the fatigue crack initiation site and the propagation region are observed. Energy spectrum analysis is also carried out to analyse the chemical composition around the crack initiation site to clear the primary factor causing the final failure. Figures 6 and 7 show the fracture morphology of two specimens in the VHCF regime, respectively.
Micro-topographies of the specimen in VHCF failure. Surface micro-scratch, surface roughness and surface defect.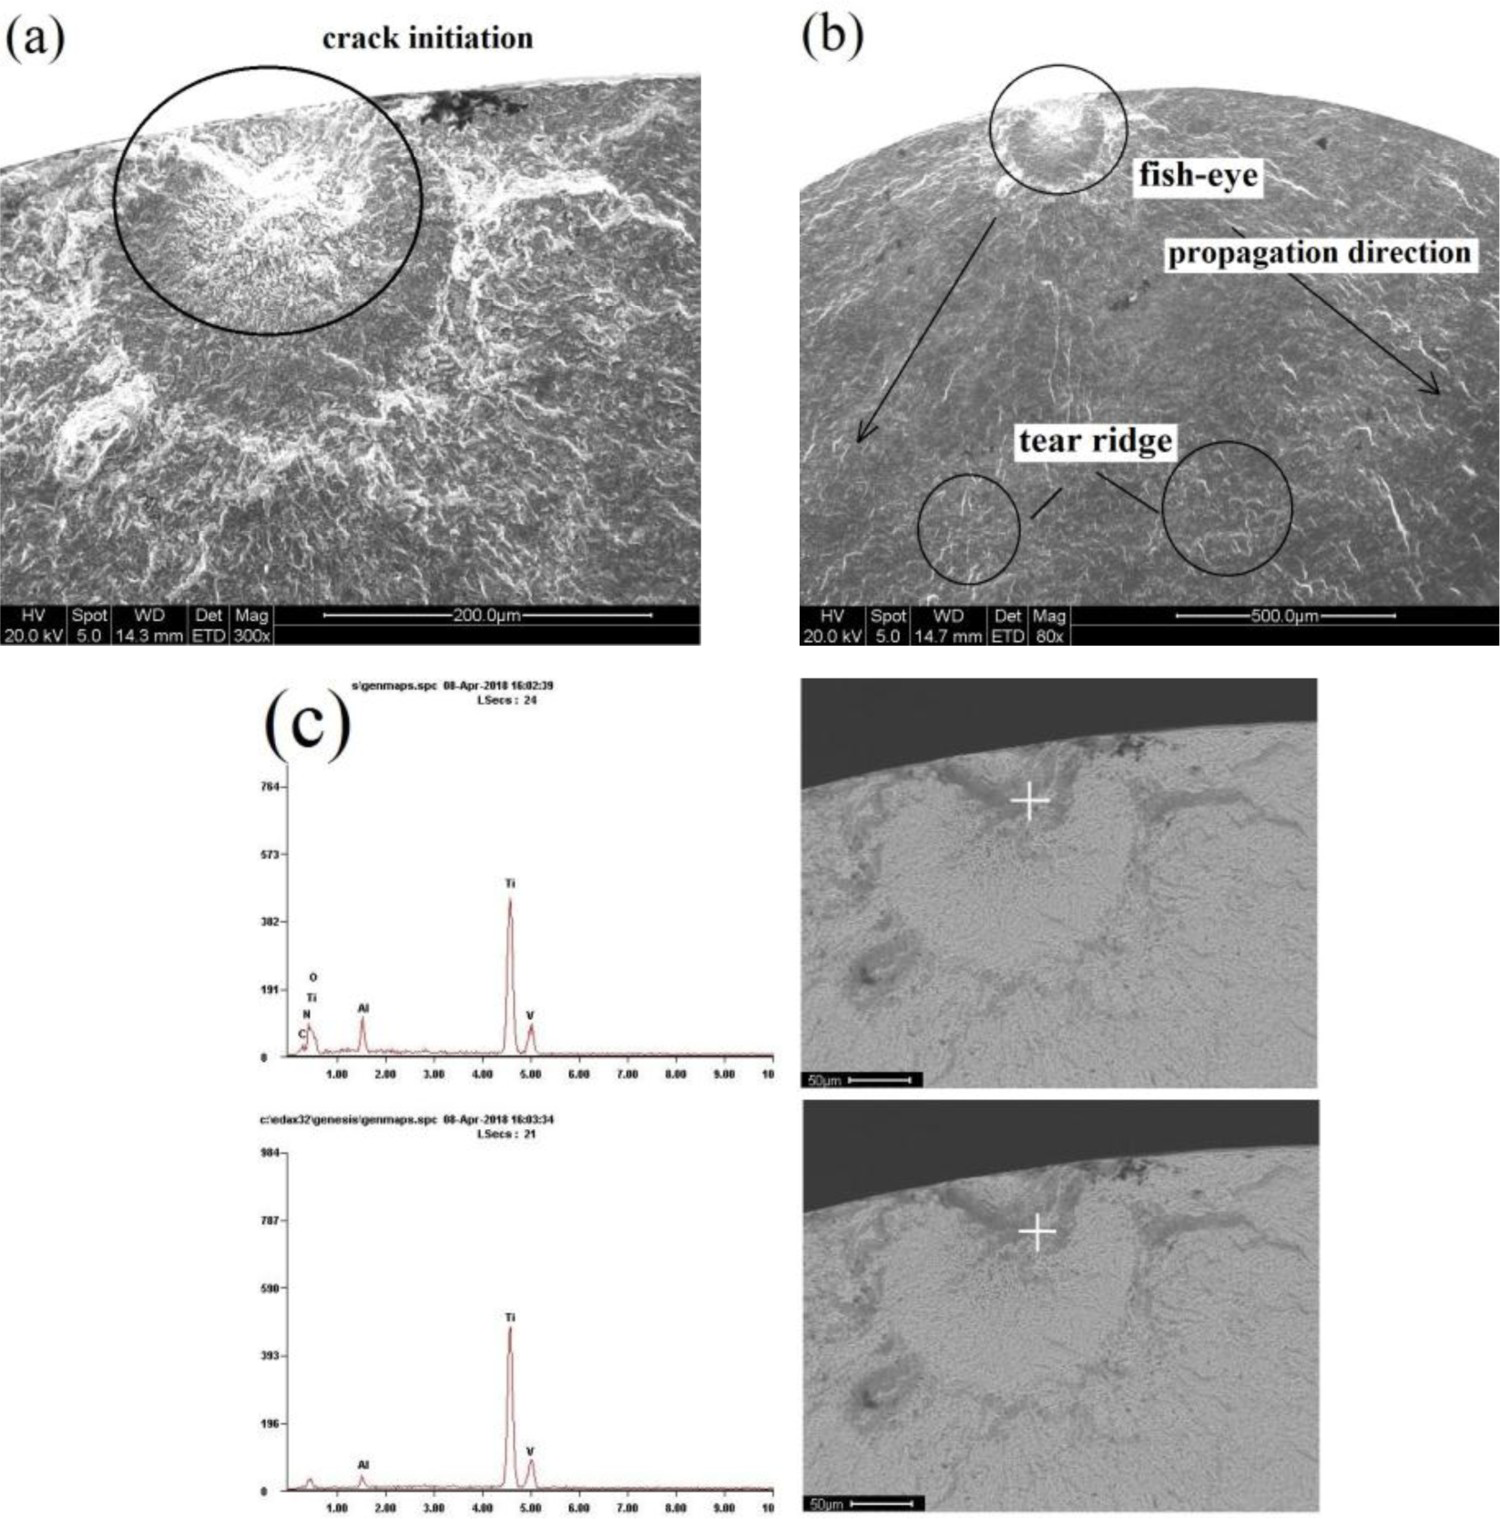
More than that some different result of the energy spectrum analysis is obtained, as shown in Figure 5(c), except the element Ti, another metal element Al is also detected around the fatigue crack initiation site. The existence of Al implies that an influence of inclusion on the fatigue failure exists. But neither the ‘fish-eye’ nor the GBF region is observed in Figure 5. And on the contrary, the similar fracture characteristics in crack propagation region as Figure 4 are obviously detected, as shown in Figure 5(b). It means that the surface micro-scratch still has more significant influence on the fatigue failure than the inclusion for this TC17 specimen in the VHCF regime.
Another specimen in the VHCF regime is observed, as shown in Figure 6. As displayed in Figure 6(a,b), a characteristic similar to the ‘fish-eye’ is observed. Fish-eye is the most typical characteristic of VHCF failure, and it is very common in the internal fatigue cases. The energy spectrum analysis is further carried out to clarify chemical composition around the crack initiation site and make sure what primary factor is causing the fatigue failure. The result of the energy spectrum analysis is shown in Figure 6(c), in which no other element is detected except the matrix material Ti. This implies that the fatigue failure is caused by porosities or grain boundaries. More than that, the radial striations extending from the surface to the inside can be observed on the fracture surface, this is because the crack initiation site is closer to the surface. Thus, both the characteristics of surface failure and the characteristics of internal failure will be detected. In summary, Figure 6 proves that surface roughness is less effective on fatigue life in the VHCF regime and the possibility of internal cracks is higher in the VHCF regime.
Discussions of the fracture morphology
For TC17 titanium alloy, although only two VHCF failure cases are obtained in this study, the surface micro-scratch should be a primary fact that is causing the fatigue failure, even the fatigue failure is in VHCF regime. In the condition with big surface roughness (Ra3), the fatigue failure prefers to occur on the surface. With the surface roughness decreases from Ra3 to Ra2 and Ra1, the effect of surface roughness on the fatigue failure gradually decreases, also the relevant fatigue life becomes longer. In addition, in low stress level and small surface roughness conditions, the influence of internal inclusion on the fatigue life is gradually highlighted. However, the effect of internal defect is still less than the surface micro-scratch on fatigue failure, the surface micro-scratch is still the primary factor causing the fatigue failure. In summary, surface fatigue failure is the main failure type for TC17 in both HCF and VHCF regime.
The fatigue limit with surface micro-scratch for TC17
As discussed above, the fatigue failure of TC17 is mainly caused by the surface micro-scratch, and Murakami [22,23] introduced the surface defect area into the surface micro-scratch to describe the effect of surface roughness on fatigue behaviour, as shown in Figure 7.
Murakami carried out many fatigue tests with kinds of metal to investigate the relationship between surface roughness and surface defect. As shown in Figure 7, the average depth of the surface groove is h, the average peak value is 2w and the equivalent surface defect size is Scr
The errors between the test results and theoretical calculation value.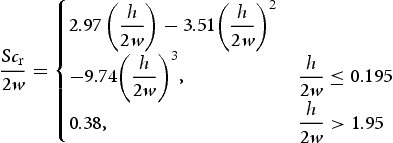
 2w, thus the surface defect is expressed as

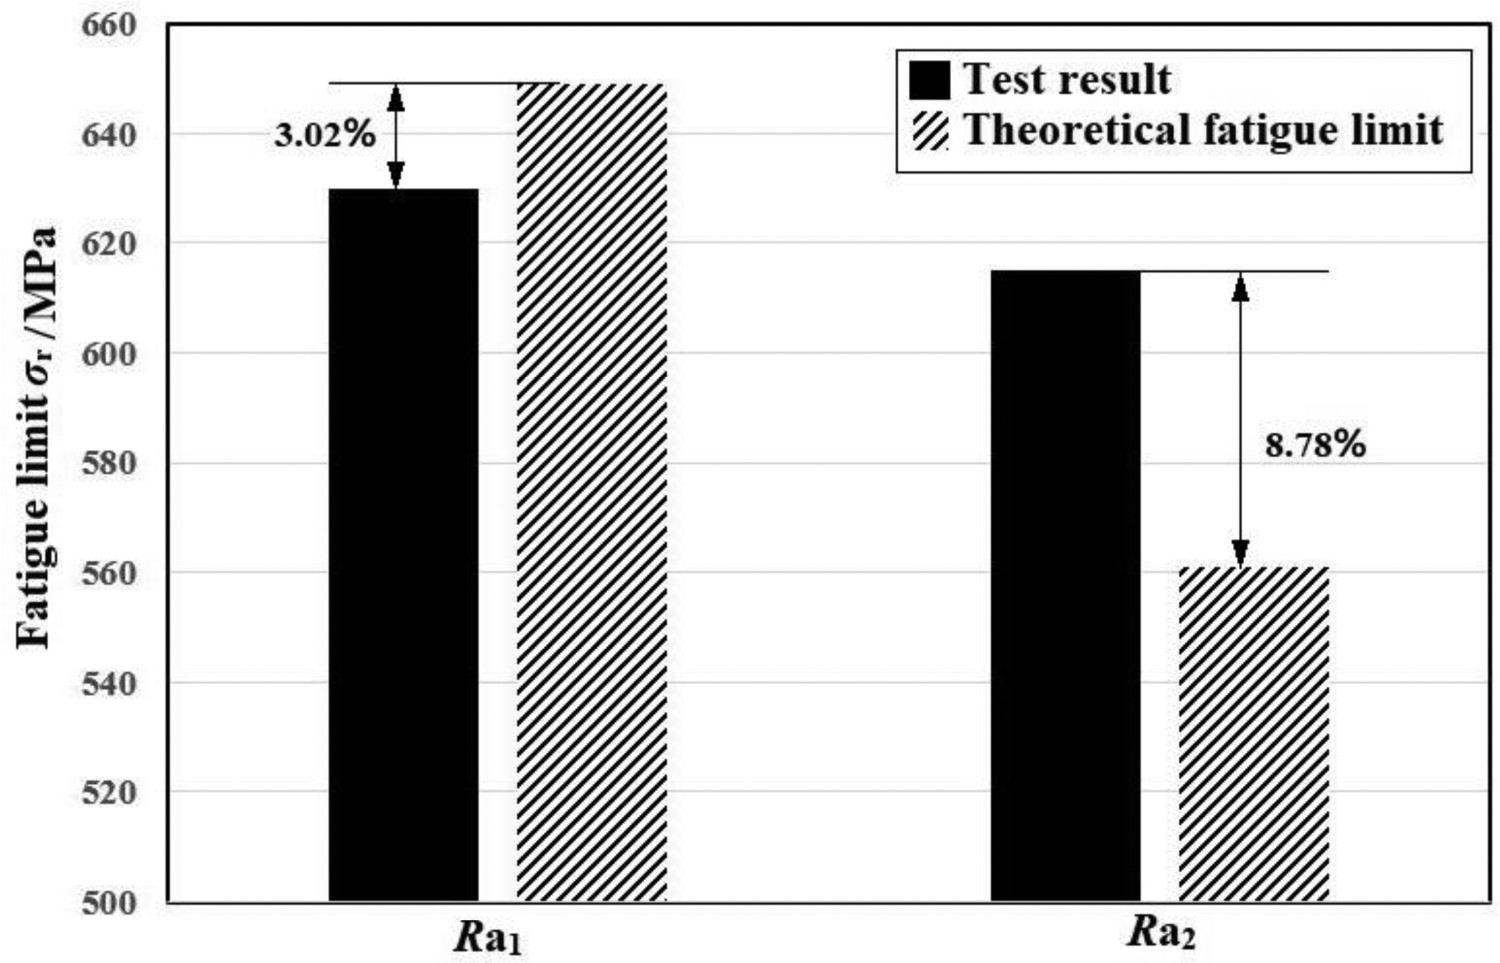
Figure 9 demonstrates the tendency of fatigue limit changing with the surface condition Ra, the continuous curve in Figure 9 is obtained by Equation (3). The fatigue limit calculated by Equation (3) is closer to the test results, and also the errors for these two situations are in the acceptable range. Thus, the fatigue limit analysis process above demonstrates that the modified Murakami model can be applied to predict the fatigue limit of TC17 with different surface conditions, and it is also suitable for simultaneous analysis of multiple specimens. By employing Equation (3), the predicted fatigue limit for Ra3 in VHCF regime can be estimated, σr(Ra3) ≈ 500 MPa. The additional test is carried out for Ra = 1.2 μm, the fatigue limit is about 575 MPa. The error between the test result and theoretical one is about 13%; it is in the acceptable range.
Relationship between fatigue limit and Ra.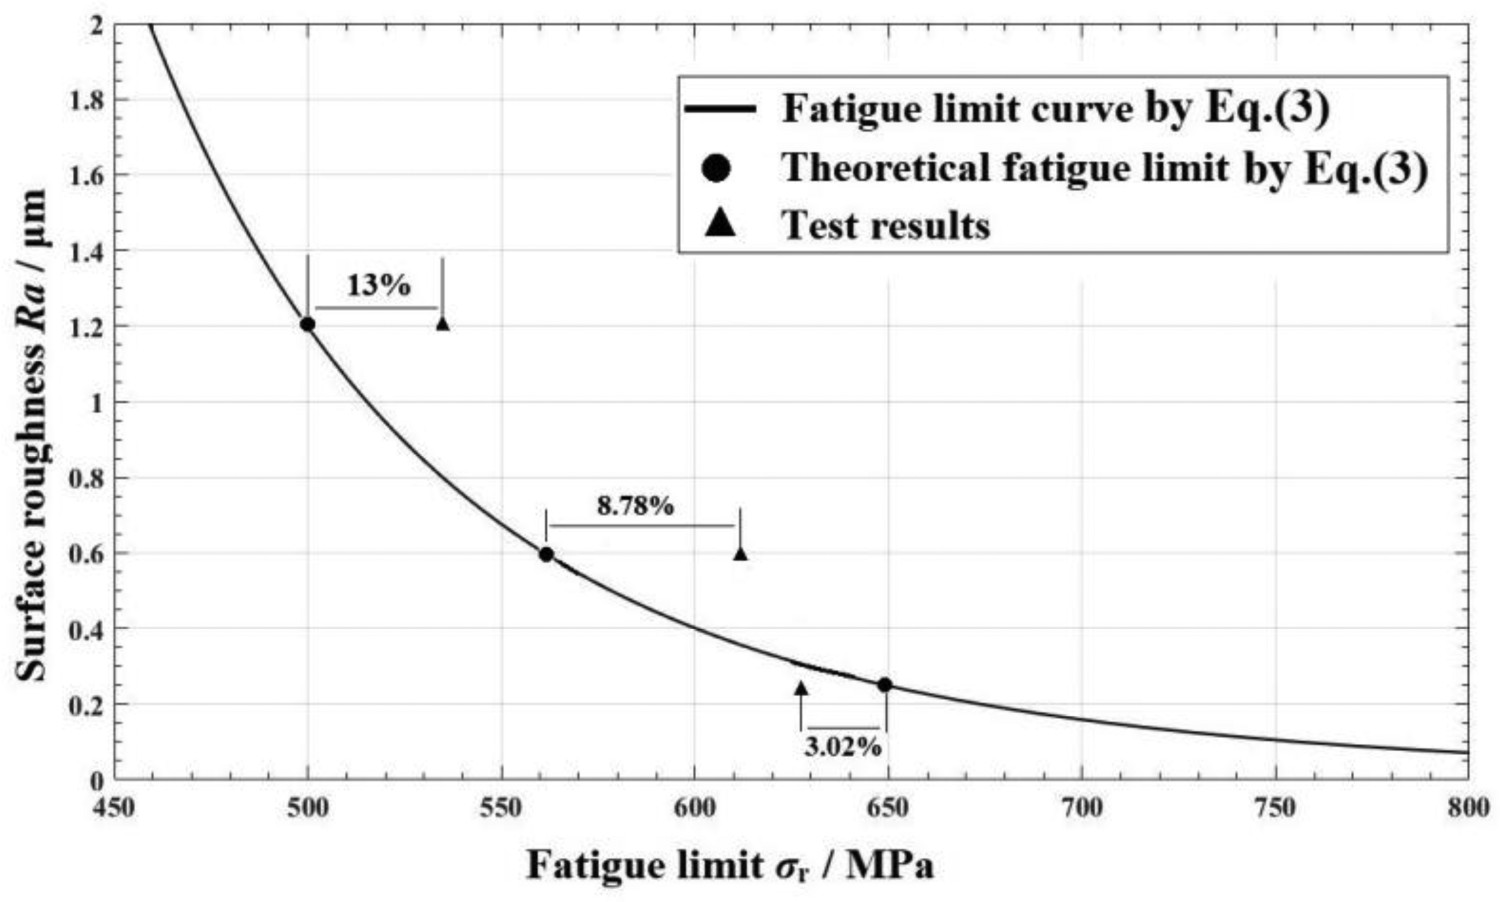
The fatigue life evaluation of TC17 considering the surface roughness
The S–-N curve models for TC17 with different surface conditions
The S–N curve is the most widely used method to express the quantitative relationship between the fatigue stress and fatigue life, as shown in Figure 3. When the fact of surface micro-scratch is involved for fatigue life, the S–N curves for different surface roughness should be determined correspondingly.
The Basquin formula [24,25] has numerous advantages such as simple calculation process, reliable calculation results and extensive applicability. It has been widely used to describe the continuous decline stage of S–N effectively in HCF. The Basquin formula [26] can be expressed as
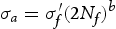
 is the fatigue strength coefficient; b is the fatigue strength index. The parameters
  and b are unknown model parameters related to the material TC17, and they are specific on the material to study. There are no common values for the parameters that can be used for the prediction model of fatigue life with surface micro-scratch. These two parameters are essential in the establishment of the life model. A small change of the parameters will result in a significant alteration on the fatigue life prediction. This also implies that there is not a common model that can cover different materials for life prediction, and the fatigue life of TC17 should be obtained by its own life prediction model with particular parameters. So, it is key work to identify the unknown parameters from the designed test data to obtain a specific fatigue life model for TC17.
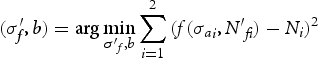
 and b for the function f (σai,
  ) by the minimising operation of Equation (5), i.e.
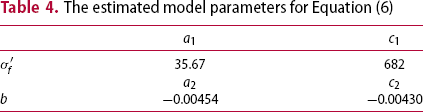
The estimated model parameters
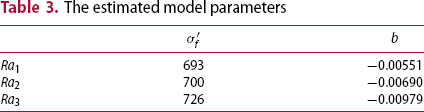

So the S–N curve models for TC17 with different surface conditions can be obtained by substituting the estimated parameters into the developed basic model (Equation (4)), as shown in the below equation
The new modified fatigue life model for TC17 with surface roughness
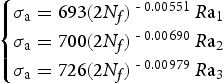
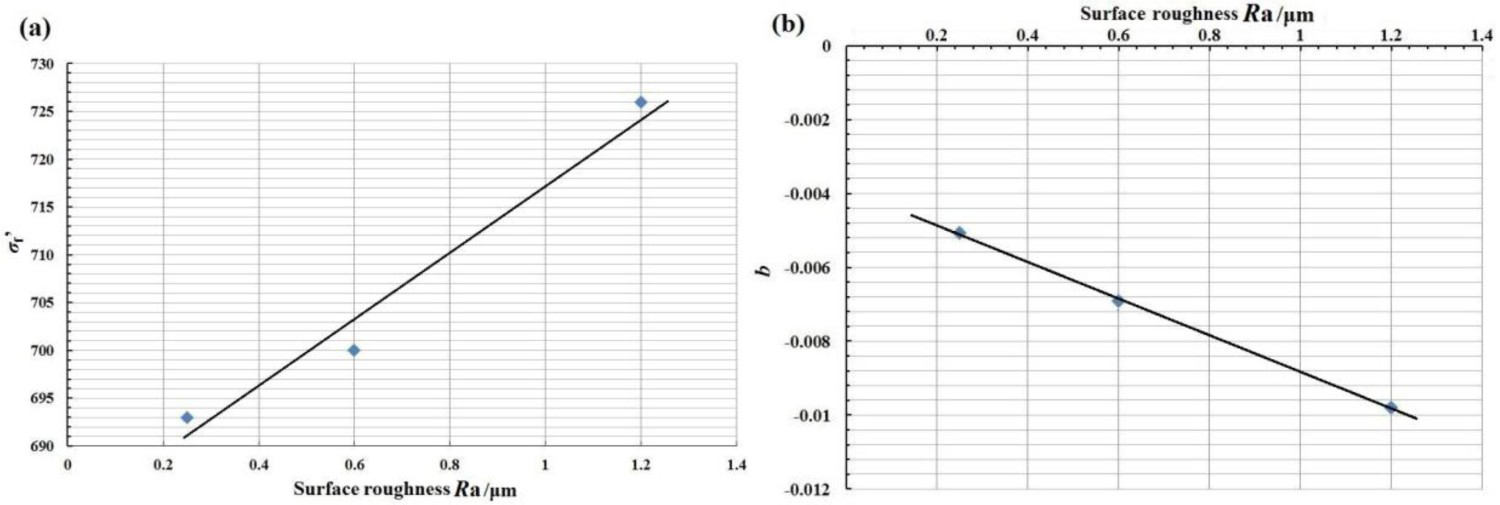
As talked before, the surface roughness will have a significant influence on the fatigue failure behaviour and fatigue life. But it won't affect the fatigue life of TC17 directly; it will have a significant influence on the model parameters. This assumption wasn't reported before, so it is novel in the metal fatigue study, and it should be tested by the fatigue test data. As shown in Table 3, the model parameters are variables, related to surface roughness. So, it is necessary to clear the effect of surface roughness on fatigue failure behaviour of TC17 by making sure the relationship between the model parameters and the surface roughness and introducing the surface roughness into the Basquin models. Figure 10(a) shows the distribution of The distribution of the model parameters and surface roughness Ra. and surface roughness Ra; Figure 10(b) shows the distribution of b and surface roughness Ra.
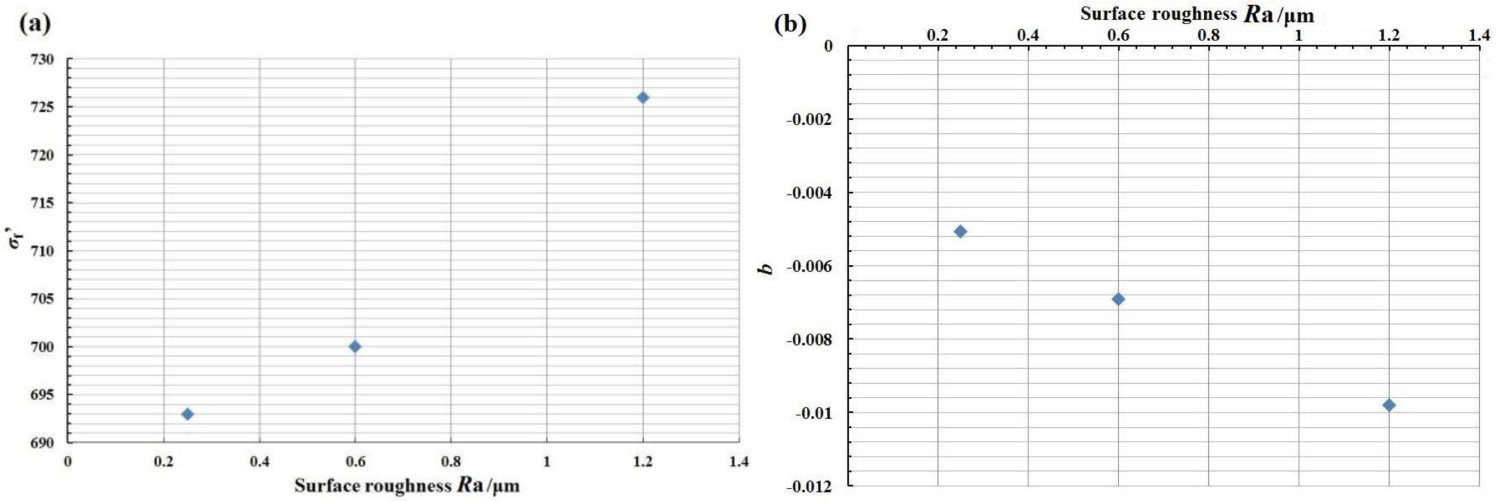
 and surface roughness Ra; Figure 10(b) indicates that there is a negative correlation between b and surface roughness Ra. According to the distributions in Figure 10(a,b), assuming that the relationships between
  and Ra, b and Ra satisfy the linear relation, the modifier formulas are expressed as
The estimated model parameters for Equation (6)
The modified formulas are expressed as
The relation curves between the model parameters and the surface roughness.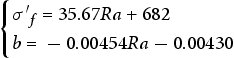
 and Ra; Figure 11(b) is the relation curve between b and Ra.
By substituting Equation (8) into Equation (4), the revised fatigue life prediction model with the effectiveness of surface roughness Ra is expressed as

The verification
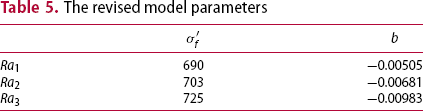
 and b are obtained by substituting the surface roughness Ra (Ra1 = 0.3 μm, Ra2 = 0.6 μm, Ra3 = 1.2 μm) into Equation (8), the results are displayed in Table 5.
The revised model parameters

The model parameters in Table 5 are employed to replace the original ones and substituted into Equation (6) to calculate the fatigue life of TC17, so the revised models are displayed in the below equation
The fatigue life calculated by Equations(6) and (10) and the test data. The errors between theoretical predicted life and test results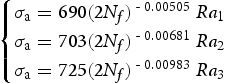
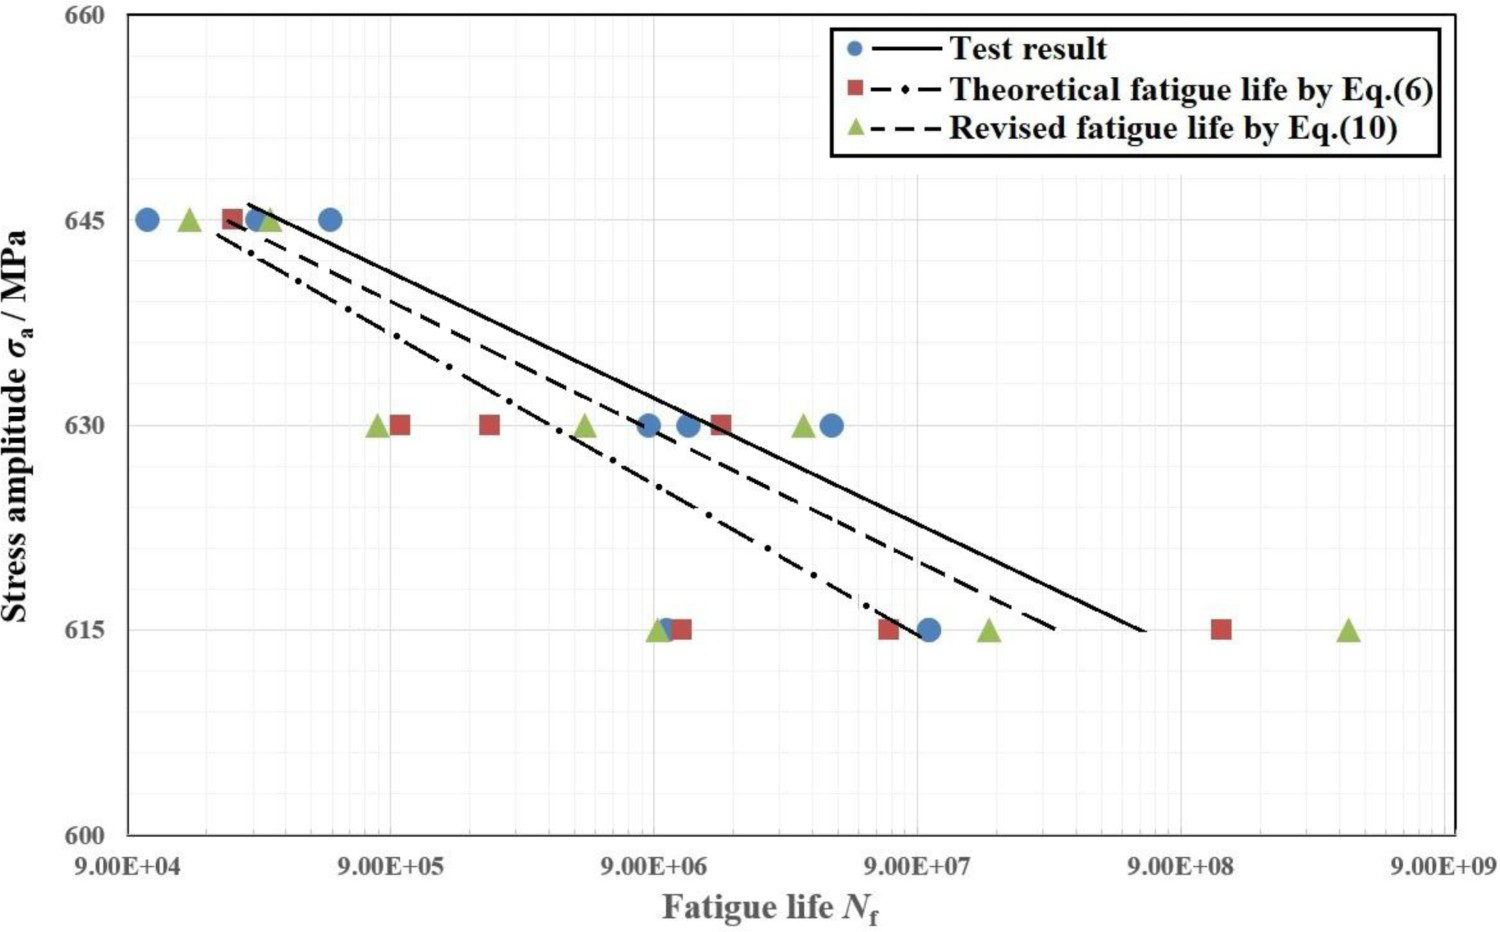
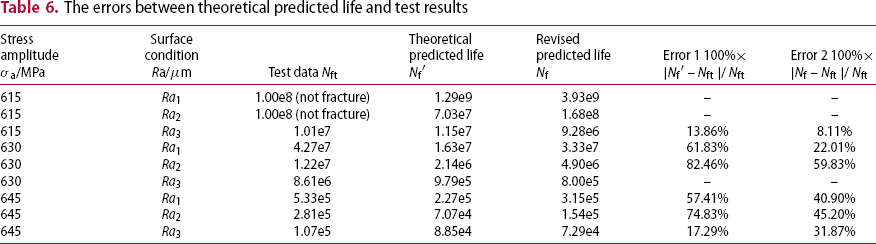
As shown in Table 6, for the fatigue life predicted by Equation (10), the maximum error is 59.83%, the minimum error is 8.11%, and all the predicted life and the test results are in one order of magnitude, except the specimen without failure. For the fatigue predicted by Equation (6), the maximum error is 74.83%, the minimum error is13.86%, and all the predicted life and the test results are in one order of magnitude, except the specimen without failure. Five sets of errors between the test data and the revised predicted life are smaller than that in unrevised cases; only one error between the test data and the revised predicted life is bigger than the unrevised cases. This is consistent with the phenomenon shown in Figure 12 that the curve of revised fatigue life is more close to the curve of test result than the theoretical one.
It implies that, comparing to the fatigue life calculated by Equation (6), the fatigue life calculated by the revised model (Equation (10)) is much closer to the test results, the revised model with updated parameters have a higher accuracy of fatigue life prediction. Although the errors still exist between the test results and the theoretical calculation, they are smaller than one order of magnitude, within an acceptable range in engineering practice. Thus, Equations (9) and (10) can be used to predict the fatigue life of TC17 with the effect of surface micro-scratch. More than that, these modified formulas and the fatigue life prediction model of TC17 can be beneficial to providing a meaningful prognostic for preventive maintenance, and used for fatigue analysis of TC17 to avoid sudden catastrophic failure of mechanical systems in real application.
Conclusions
A few conclusions are drawn from this fatigue study.
The distribution of fatigue life is mainly concentrated in the high-cycle fatigue area even with a relatively low stress amplitude. In addition, with the decrease in the surface roughness, the dispersion of the test data distribution becomes bigger, this means TC17 specimen with small surface micro-scratch is more sensitive to the change of stress amplitude, and a small change of the surface roughness will result in a big improvement of the fatigue life. With the effect of surface micro-scratch, the fatigue failure of most specimens originates from the surface, which means the surface fatigue failure is the common failure type for TC17 in HCF. Obvious radial striations are clearly detected in the fracture surface, and with the increase in the surface roughness, the radial striation becomes more obvious. And in VHCF regime, both surface micro-scratch and internal defect have influence on the fatigue failure. The fatigue limit for TC17 can be calculated with modified Murakami model as a function of surface roughness, with the increase in the surface roughness Ra, the fatigue limit decreases obviously. The theoretical value has been verified to be reasonable and reliable by comparing to the test results. The fatigue limit with Ra3 is predicted as 500 MPa.
S–N curves for TC17 with different surface conditions are proposed. A new assumption about the linear relationship model between the parameters of S–N curve model and the surface roughness is proposed for TC17. The quantitative expression models between the model parameters and surface roughness are developed and applied to modify the fatigue life prediction model of TC17. A new fatigue life prediction model of TC17 considering the surface micro-scratch is developed with the comprehensive application of Basquin formula, laboratory test data and the parameters model. The unknown model parameters for TC17 are identified and the model applicability is verified through the additional fatigue test. The development of the fatigue life evaluation model is novel in fatigue theory study for TC17.
The new fatigue life model for TC17 contains two important factors that will affect the fatigue life: surface roughness and stress amplitude, which makes the new model more appropriate for fatigue life prediction of TC17 than the other models. Both the establishment of fatigue life model and the parameter determination are novel and a creative development to fatigue study of TC17, which is a new research direction for TC17 in fatigue failure analysis and remanufacturing engineering. More than that, the derivation method of the new model is proposed based on the classic fatigue theory and test data and observations, which means the theoretical foundation has been accepted and the accuracy can be guaranteed. Further study and effort are also needed to test the assumption of the linear relation between the model parameters and surface roughness.
Footnotes
Disclosure statement
No potential conflict of interest was reported by the author(s).
Data availability
The raw/processed data required to reproduce these findings cannot be shared at this time due to legal or ethical reasons.