
Abstract
In this study, the effects of 0.14 wt-% Sn on accelerating the precipitation kinetics during heat treatment are quantified. By calculating the activation energy of θ′ phase, it was found that the combined additions of Cu and Sn can reduce the energy barrier and increase the number density of the θ′ phase in the peak aged state, and thus improving yield strength and ultimate tensile strength from 239 and 318 to 445 and 457 MPa, respectively. Based on the quantitative analysis of the θ′ phase, it was found that with the combined additions of Cu and Sn, the average length of the θ′ phase increased from 18.11 to 25.82 nm, and the number density increased from 2.17 × 10²¹ to 4.62 × 10²¹ m−3.
Introduction
Al–Cu alloys are widely used in the aerospace and automotive fields owing to their high strength and toughness [1]. The strength of Al–Cu alloys can be significantly improved due to the precipitation of semi-coherent θ′-Al2Cu upon the solution and aging treatment. It is well known that the additions of alloying elements optimise the size and distribution of the precipitates, thus enhancing the mechanical properties [2]. As is known, Cu is the main alloying element, the maximum solid solubility of Cu in Al is 5.65 wt-%, but it is very small at room temperature. Therefore, the addition of Cu is related to the formation of the main precipitate θ′ phase. On the other hand, the coarse Al2Cu particles at the grain boundaries can cause stress concentration and act as crack initiation sites, resulting in fracture of the alloy [3]. Therefore, optimising Cu content has an important influence on the age-hardening and mechanical properties. In addition, Sn is considered as an important trace element to restrain vacancy annihilation due to its high binding energy with vacancies [4-6]. Studies have shown that Sn promotes the formation of the θ′ phase by reducing the interfacial energy between the precipitate and the matrix or acting as heterogeneous nucleation particles [7]. Therefore, adding trace element Sn is also a way to modify the composition of alloys to improve the precipitation kinetics.
Many studies have reported the effect of Sn on the precipitation kinetics. Most of the studies are based on transmission electron microscopy or 3D atom probe tomography combined with the age-hardening curve [4-6]. However, there are few quantitative analyses on the effect of Sn on precipitation kinetics. The Avrami-Johnson-Mehl (AJM) model was proposed to characterise the kinetic theory of nucleation and crystal growth in the solid state [8,9]. Many studies have reported the study of the precipitation kinetics of different age-hardening alloys by the AJM model, for example, Al–Mg–Si–Cu alloy [10], Al–Li alloy [11] and Al–Mg–Si alloy [12], etc. However, there are few reports on the effects of Cu and Sn on the precipitation activation energy of the θ′ phase in Al–Cu alloys.
The strengthening effect of the age-hardening alloy is mainly related to the distribution, size, volume fraction and shape of precipitates [13]. These precipitates inhibit dislocation motion and thus enhance alloy strength, especially yield strength. The interaction between the precipitate and the dislocation can be described by the Friedel and Orowan mechanism [14,15]. Many studies have predicted the contribution of precipitation to yield strength [16,17]. However, the quantitative characterisation of the synergistic effects of Cu and Sn on the precipitation strengthening mechanism of Al–Cu alloys is rarely involved according to previous reports. Therefore, it is necessary to quantitatively explore the relationship between the evolution of the θ′ phase with the additions of trace elements and the contribution of precipitation strengthening to yield strength in Al–Cu alloys.
In this paper, the evolution of Al2Cu in Al–Cu alloys was investigated by Field Emission Scanning Electron Microscope (FE-SEM) and X-ray tomography combined with Calculation of Phase Diagram (CALPHAD) method. Differential Scanning Calorimetry (DSC) was used to calculate the precipitation activation energy of θ′ in Al–Cu alloys. High-Angle Annular Dark-Field Scanning Transmission Electron Microscopy (HAADF-STEM) was used to explore the morphology and type of precipitates. Based on these results, this paper investigated the synergistic effects of Cu and Sn on the microstructure and mechanical properties. In addition, the aging precipitation kinetic of the θ′ phase and its size distribution were quantitatively characterised in Al–Cu alloys. This provides a pathway for the design of high-performance Al–Cu alloys by microalloying.
Experiments
The experimental alloys were prepared in an industrial furnace by melting commercial pure Al (99.9 wt-%), pure Cu (99.9 wt-%) and Al-10 wt-% Mn master alloy from Suzhou Chuanmao Metal Materials Co., Ltd. The raw materials were heated from room temperature to 730°C, and then Al-5 wt-% Ti-1 wt-% B and pure Sn (99.9 wt-%) were put into the melt. Subsequently, the melt was degassed by C2Cl6 at 720°C for 10 min. After holding for 20 min at 720°C, the melt was poured into the 145 × 70 × 20 mm3 sand mould at 715°C. The chemical compositions of three alloys were analysed by inductively coupled plasma-optical emission spectroscopy (ICP-OES), which are presented in Table 1. In order to modify the platelike Fe-rich phase (Al7Cu2Fe) into a compact Fe-rich phase (Al6(FeMn)) with less harmful morphology, Mn was added to the three alloys. In addition, Ti was added to refine the grain size. In any case, Si and Fe are found in three alloys, which is due to the low purity of aluminium (99.9%). The schematic diagram of the sample location is shown in Figure 1(a). DSC results of three alloys in as-cast states are shown in Figure 1(b). It can be seen from Figure 1(b) that the phase transformation temperatures of Al2Cu of three alloys are 537°C, 537°C and 535°C, respectively. The purpose of solution heat treatment is not only to make sure that all Cu atoms are dissolved in solid solution before quenching but also to ensure that Al2Cu will not be melted. Therefore, according to the thermodynamic calculation, the solubility of Cu in Al is 4.88 wt-% at 530°C, which is lower than the maximum solubility of 5.10 wt-%/5.19 wt-% at 535°C/537°C. In order to minimise the risk of Al2Cu melting as a result of heat treat furnace non-uniformity, the solution temperature was chosen at 530°C. The prepared heat treatment samples were then subjected to 7.5 h solution treatment of A1 alloy and 14 h solution treatment of A2 and A3 alloys at 530°C using a Thermo Scientific Linderberg blue M LGO 1200°C furnace. After solution treatment, these samples were quenched immediately with water at room temperature to obtain the uniform supersaturated solid solution. Subsequently, these samples were artificially aged for 6 h at 120°C after 12 h of natural aging, and then artificially aged at 185°C at different times. In order to study the effects of Sn-vacancy complexes or clusters on the formation of the θ′ phase, natural aging heat treatment was adopted. In addition, Al–Cu clusters can form in advance by artificial aging at 120°C for 6 h, and accelerate the precipitation of the θ′ phase at 185°C.
(a) Geometry of the sand casting and sample locations from the casting for heat treatment and microstructure, DSC, CT and tensile experiments (unit: mm); (b) DSC results of three alloys in as-cast state. Compositions of three cast alloys (wt-%).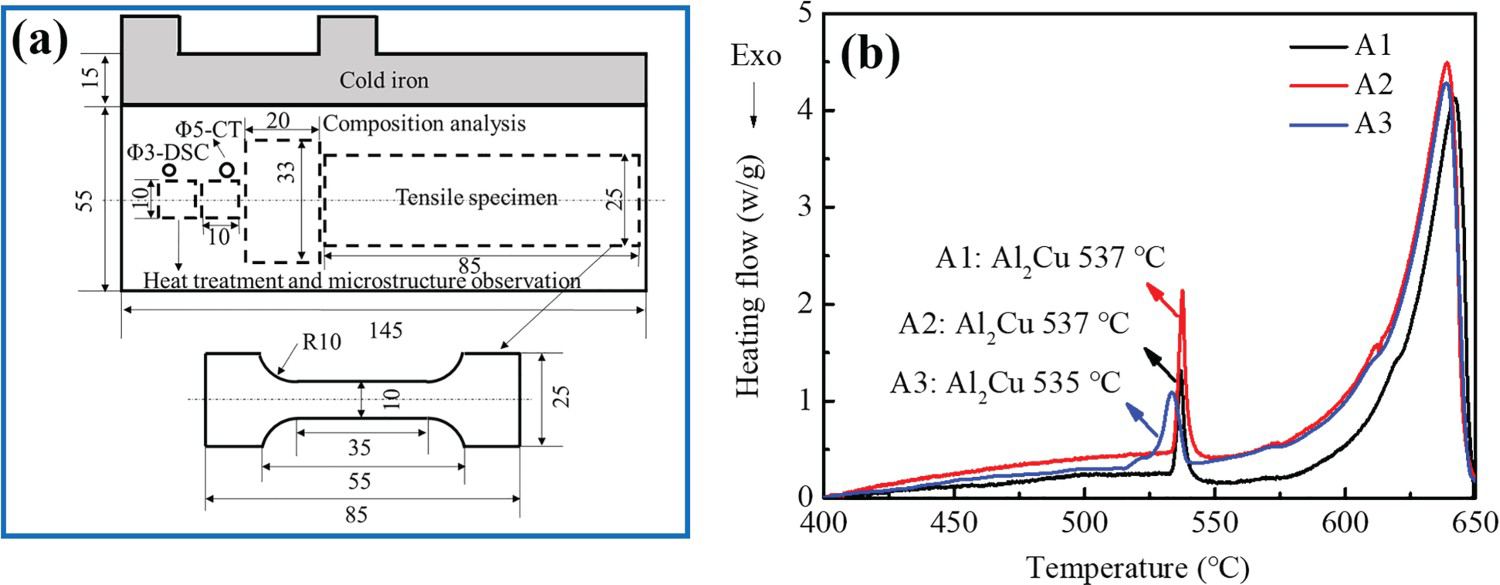
The specimens were mechanically ground with 600–2000 grit SiC papers and polished with 1.0 µm diamond paste before the as-cast microstructure was observed. The as-cast optical microstructure was observed using an LWD200-4XC Optical Microscope (OM). A Hitachi S4800 Field Emission Scanning Electron Microscope (FE-SEM) was used to characterise the SEM microstructure, and the acceleration voltage is selected as 15 kV and the current is 10 µA.
The 3D morphology of intermetallic was performed using the Zeiss Xradia 520 Versa at 80 kV and 7 W. The as-cast sample has a dimension of Φ5 × 10 mm. Each sample was rotated 360°to obtain 2501 projections with a voxel size of 3 × 3 × 3 µm. 3D reconstruction of the volume was done using Avizo. In order to reduce the various types of noise, the 3 × 3 × 3 median filter was used. The intermetallic was segmented by thresholding at a fixed value which is based on the statistic distribution of grey scale of every projection.
To quantify the nano-sized precipitates, the High-Angle Annular Dark-Field Scanning Transmission Electron Microscopy (HAADF-STEM) imaging was characterised using a Thermo Fisher Scientific Talos F200X. The foils of 10 × 10 × 0.5 mm3 were cut from the peak-aging heat treatment sample and mechanically thinned to about 80 µm. Disks of 3 mm diameters were then stamped out from the foils and then thinned by twin-jet electropolished in a 30%vol nitric acid and 70%vol methanol at −25°C with a voltage of 20 V. The number density of precipitates is obtained by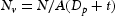 [18], where N is the number of precipitates in the view field, A is the area of the image,
  is the mean equivalent length of precipitates and t is the foil thickness which is assumed to be 100 nm according to the literature [19]. In addition, the volume fraction (
 ) of the precipitates is estimated by
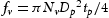 [20], where
  is the mean equivalent thickness of precipitates. Quantitative statistics were completed by using Image-Pro plus 6.0 to measure and analyse the mean size, number density and volume fraction.
In order to characterise the precipitation kinetics of three alloys in the quenched state, the Differential Scanning Calorimetry (DSC) tests were performed using an HQR-4 thermal analyser. The cylindrical samples with a diameter of 3 mm and a height of 1 mm were cut from the quenched sample, and then mechanically polished. The final mass of DSC samples of A1, A2 and A3 alloy are 14.3, 11.5, and 11.5 mg, respectively, which meet the GB/T 1245–1996 standard. The cylindrical samples were heated from room temperature to 530°C at 10°C min–1.
To investigate the aging hardening of three alloys, Vickers hardness tests for the experimental alloys were performed using a TMVS-1 Vickers hardness tester with a load of 0.2 kgf and a loading time of 10 s. The hardness under each aging process parameter is the average of 10 measurements, and the error of Vicker's measurement comes from 10 test data. The tensile tests were performed using an MTS E45 electronic universal testing machine at a strain rate of 1 mm min–1. The size of the tensile specimen is determined according to the GB/T228.1-2010 standard as shown in Figure 1(b), and the thickness is 2 mm.
Results
As-cast microstructure characteristics
Microstructure and grain size
Figure 2 shows the grain size of three alloys under the as-cast condition. The grain size was measured using the linear intercept method implemented in the Image-Pro plus 6.0 metallographic analyser. It can be observed that the grain refinement of Cu and/or Sn additions on Al–Cu alloys. With the increases of Cu content from 4.32 wt-% to 5.27 wt-%, the grain size decreases from 79.1 ± 5.0 to 76.3 ± 3.5 µm. Note that the addition of 0.14 wt-% Sn results in refinement of grain size, where the grain size is decreased from 76.3 ± 3.5 to 74.8 ± 2.0 µm. In addition, the quantitative measurement of intermetallics in three alloys was conducted based on optical microscope observation (Figure 2(a–c)), and the percentage of intermetallics is defined as the area percentage of intermetallics in the 2D image. The percentage of intermetallics is shown in Figure 2(d). It can be seen from Figure 2(d) that the percentage of intermetallics of A2 and A3 alloys are significantly higher than that of A1 alloy due to the addition of Cu, and the percentage of intermetallics in A1, A2 and A3 alloys are 7.2 ± 0.48%, 8.1 ± 0.25% and 8.2 ± 0.28%, respectively. However, the addition of Sn has no obvious effect on the increase in the number of intermetallics.
As-cast optical micrographs of the (a) A1, (b) A2 and (c) A3 alloys; (d) grain size and the percentage of intermetallics of three alloys.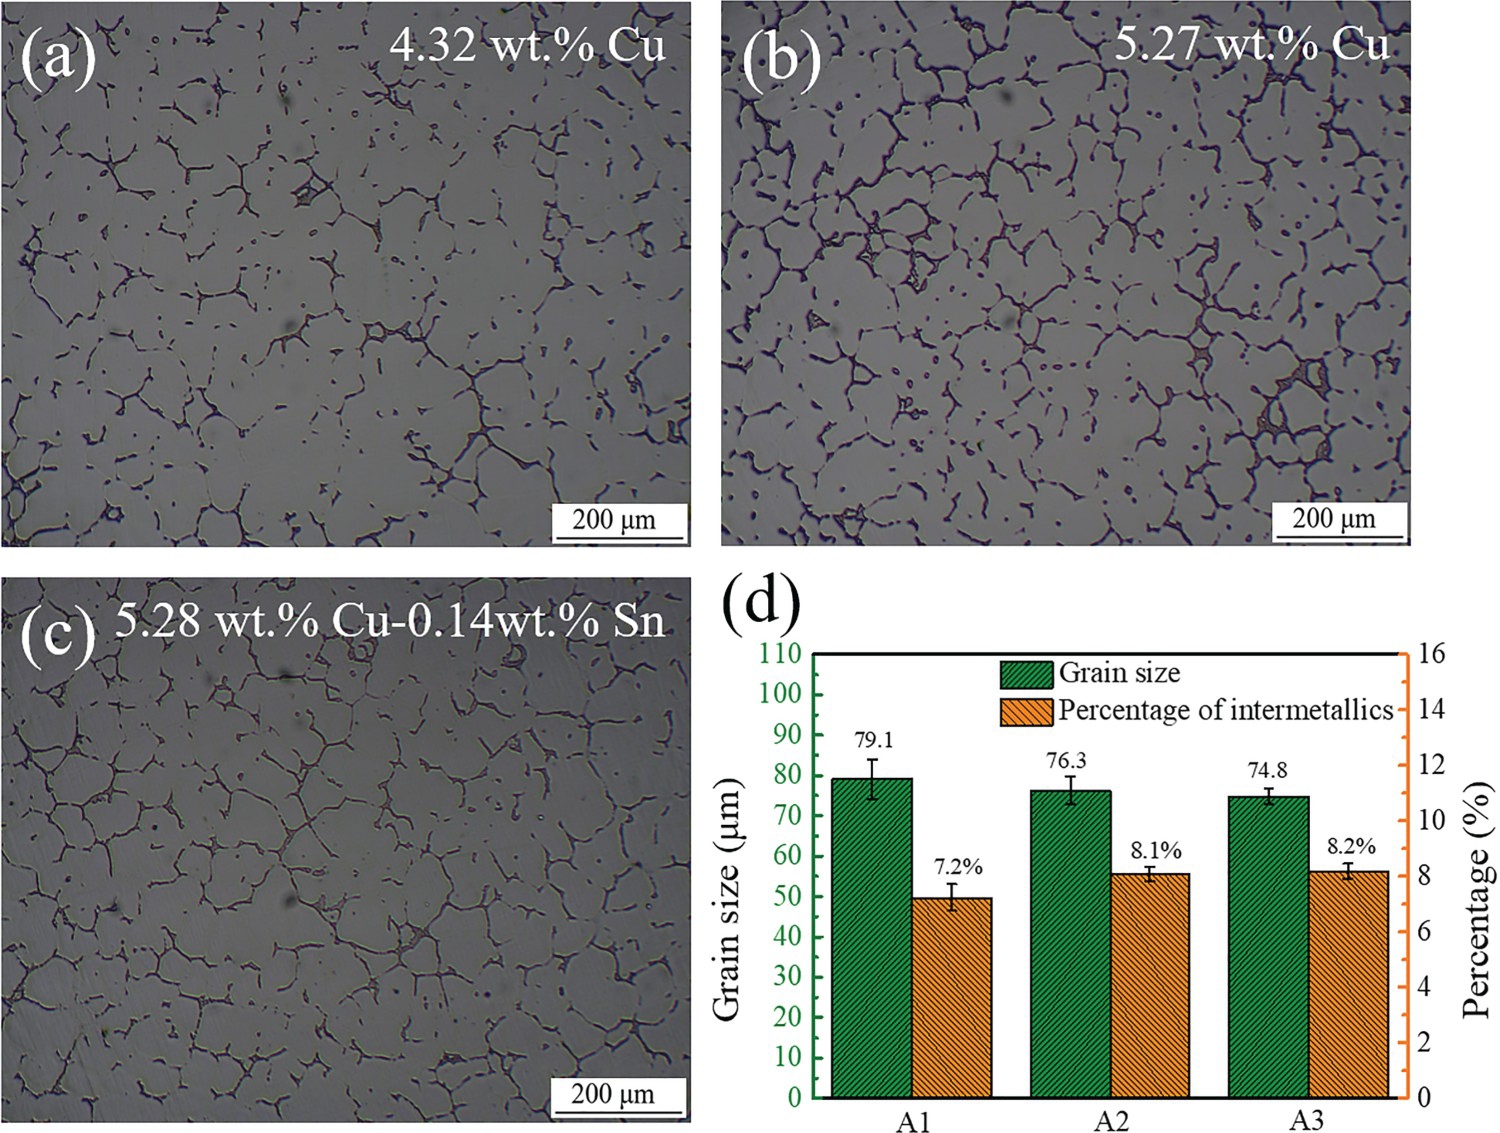
As seen from Figure 2, increasing Cu content reduces grain size. Meanwhile, it can be observed that the addition of Sn refined the grain size. It is known that the grain refinement is significantly influenced by the potent nucleant particles, sufficient solutes and undercooling during solidification [21,22]. The efficiency of grain refinement is related to the nucleation rate and growth rate [23]. The previous study has shown that the additions of solute atoms result in a change in solute concentration in front of the solid–liquid interface due to solute repartition, which leads to the change of theoretical solidification temperature, thus forming the constitutional undercooling [24]. According to the growth restriction factor (GRF) theory [25], the formation of constitutional undercooling limits the growth of grains. Therefore, with the additions of Cu and Sn, the grains are refined.
Thermodynamic calculation
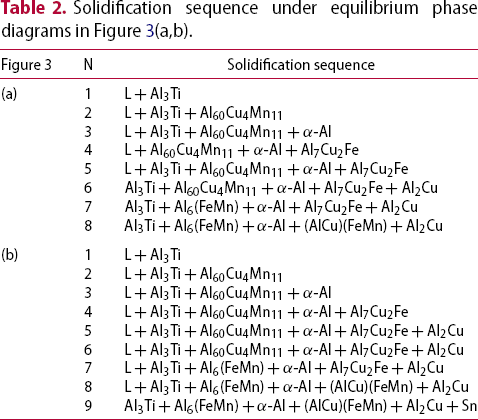
The phases of three alloys in the as-cast state were calculated based on the CALPHAD method. Figure 3(a,b) shows the phase diagrams of three alloys at the theoretical composition using Pandat software, and the solidification sequence is shown in Table 2. As shown in Figure 3(a) and Table 2, the microstructure at room temperature consists of Al3Ti, α-Al, Al6 (FeMn), (AlCu)(FeMn) and Al2Cu in the Al–Cu alloy without Sn. However, as shown in Figure 3(b) and Table 2, Sn precipitation appears with the addition of Sn. Alternatively, in order to study the influence of Cu and Sn on the precipitation of Al2Cu, the precipitation temperature and content of Al2Cu under different Cu and Sn contents were calculated thermodynamically. The weight percentage of Al2Cu as a function of temperature and Cu content in equilibrium conditions is shown in Figure 3(c). With the increase of Cu content from 0.5 wt-% to 6.0 wt-%, the weight percentage of Al2Cu increases from 0.36% to 10.54%, and the precipitation temperature increases from 137°C to 546°C. Alternatively, it can be seen from Figure 3(d) that Sn content has no obvious effect on the content and precipitation temperature of Al2Cu. With the increase of Sn content, the precipitation temperature of Al2Cu only decreases from 530°C to 528°C, and the weight percentage remains at about 9.24%.
Phase diagrams of (a) Al-(0–6) wt-%Cu-0.5 wt-%Mn-0.25 wt-%Ti-0.14 wt-%Fe alloy and (b) Al-5.3 wt-%Cu-0.5 wt-%Mn-0.25 wt-%Ti-0.14 wt-%Fe-(0–0.3) wt-%Sn alloy; (c) weight percentage of Al2Cu as a function of temperature and Cu content in equilibrium conditions; (d) weight percentage of Al2Cu as a function of temperature and Sn content in equilibrium conditions. Solidification sequence under equilibrium phase diagrams in Figure 3(a,b).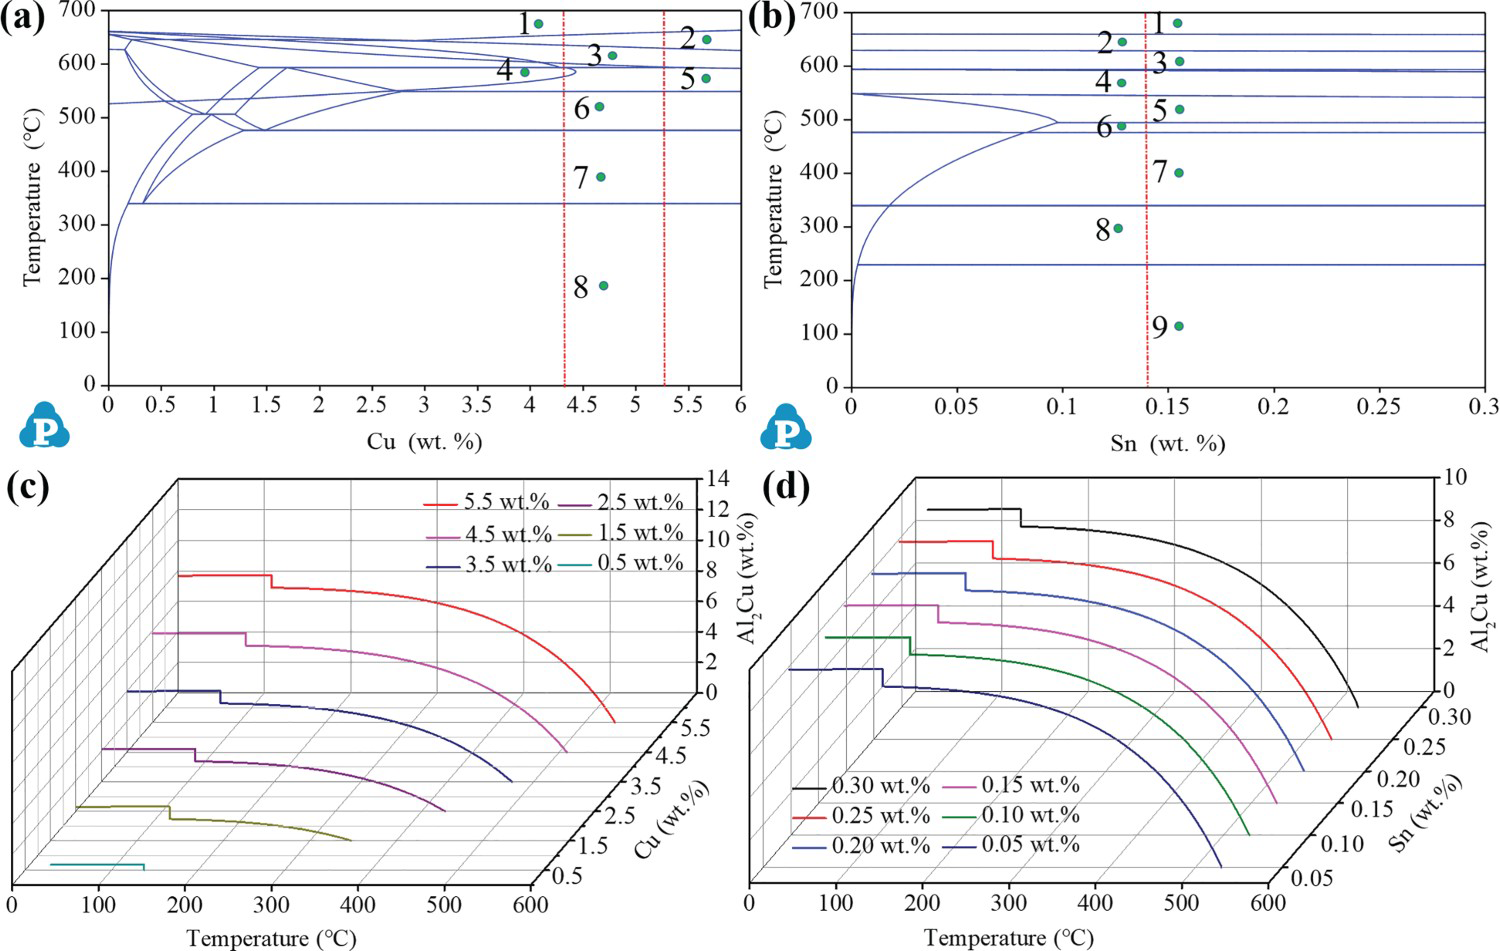
The calculation under equilibrium conditions can analyse the phases and the precipitation temperature range of different phases during solidification [26]. However, the phase reactions may completely deviate from the phase reactions under the equilibrium conditions in the actual solidification process. In order to explore the microstructure evolution of experimental alloys during solidification at the actual composition, the thermodynamic simulations of three alloys were repeated using the Scheil-Gulliver solidification mode. The Scheil model assumes that there is no diffusion in the solid and infinite diffusion in the liquid. Figure 4 and Table 3 are the non-equilibrium solidification paths calculated using the Scheil model for three alloys. As shown in Figure 4 and Table 3, the phases of three alloys at room temperature contain Al3Ti, α-Al, Al6Mn, Alpha, Al7Cu2Fe and Al2Cu, and are all formed by the same eutectic reaction:
Scheil simulation of solidification path for three alloys. Solidification sequence of three alloys and the precipitation temperature and weight percentage (wt-%) of the phases.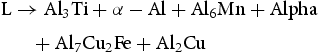
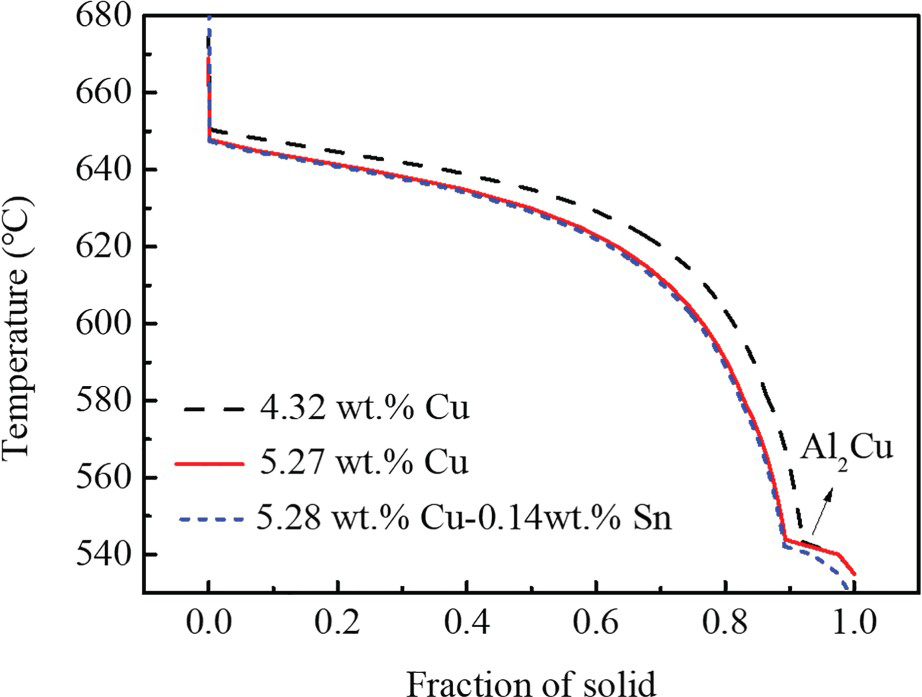
It can be seen from thermodynamic calculations (Table 3) that the addition of Cu leads to an increase in the weight percentage of Al2Cu from 4.44 wt-% to 5.94 wt-%. However, the addition of 0.14 wt-% Sn has little effect on the weight percentage of Al2Cu, only increasing from 5.94 wt-% to 6.04 wt-%, which is consistent with the calculation in equilibrium conditions (Figure 3(d)).
Phase identification
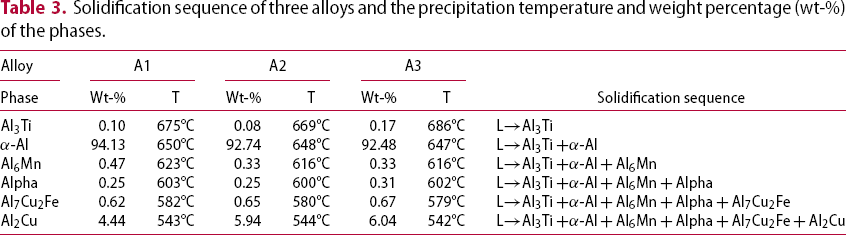
The SEM micrographs of three experimental as-cast alloys are shown in Figure 5. As shown in Figure 5, a large amount of Al2Cu with blocky form is continuously distributed at the grain boundary, and it is also found that Al2Cu has the spherical-shaped eutectic feature (circle area shown in Figure 5). Besides this phase, there are a small number of intermetallic particles at the grain boundaries of three alloys. The EDS elemental mapping result (Figure 5(d-II)) illustrates that this intermetallic contains Al, Fe, Mn and Cu. Combining with other literature reports on the as-cast structure of Al–Cu alloys [27,28] and the thermodynamic calculations (Figures 3 and 4), it was found that the intermetallics were Al6 (FeMn) and Al7Cu2Fe phases. In addition, it is worth mentioning that the bright particle (white arrow in Figure 5(c)) is observed in A3 alloy. The EDS elemental mapping results (Figure 5(d)) indicate that the bright particle is Sn particle (white arrow in Figure 5(d)), which is consistent with thermodynamic calculation at equilibrium conditions (Figure 3).
As-cast SEM micrographs of the (a) A1, (b) A2 and (c) A3 alloys; (d) EDS elemental mappings of the region I and region II in (c), and the green represents the Sn particle.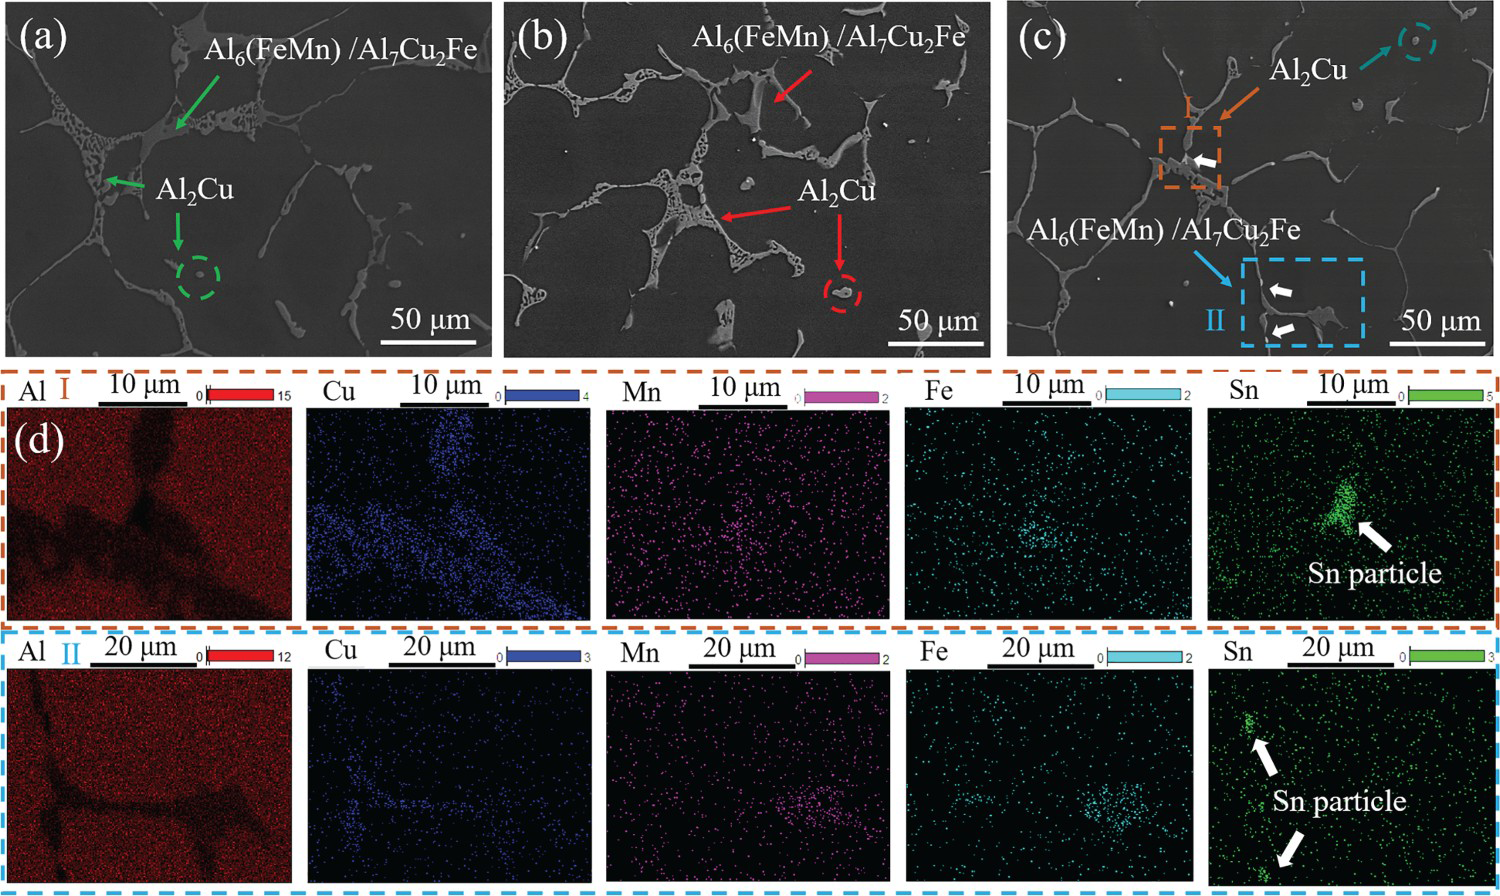
Figure 6 shows the 3D reconstructed morphology of intermetallic in three experimental as-cast alloys. In order to characterise the 3D morphology of the intermetallic clearly, the volume of 450 × 450 × 450 µm was extracted from the total reconstructed cylinder. It can be observed that the morphology of many Al2Cu (blue) is tortuous with many branches, and Al2Cu with spherical morphology has also been observed. In addition, the typical 3D morphology of Fe-rich phase (yellow) indicates that there are two different morphologies of Fe-rich phases, one is tortuous morphology, and the other is platelike morphology. According to the previous literatures [29,30], the Fe-rich phase with tortuous morphology is considered as Al6(FeMn), and the Fe-rich phase with platelike morphology is considered as Al7Cu2Fe. According to the 2D morphology of the Sn particle in Figure 5(c), the contrast of the Sn particle is different from that of Al2Cu and Fe-rich phases. Therefore, the 3D morphology of the Sn particle was reconstructed. Considering the 2D morphology size of the Sn particle and the speckle noise, the particles with an equivalent diameter of 3–10 µm were screened. As shown in Figure 6(c), Sn particles (red) are distributed on Al2Cu and Fe-rich phases, which is consistent with 2D morphology, indicating that Sn precipitates from intermetallics. Furthermore, the 3D morphology of the Sn particle presents an approximate spherical morphology.
Typical 3D volume rendering of intermetallics in (a) A1, (b) A2 and (c) A3 alloys.
Microstructure characteristics of heat treated state
Microstructure of solution treated
Figure 7 shows the microstructure of three alloys after solution treatment. It is observed that the microstructure is very different from the as-cast microstructure. Most of the Al2Cu continuously distributed on the grain boundary disappear after solution treatment, and only a small amount of intermetallics (Fe-rich phase and Al2Cu phase) are left in intermittent distribution. As shown in Figure 7, the percentages of intermetallics remaining in three alloys are 0.69%, 0.82% and 0.97%, respectively. In addition, it is obvious that there is over-burning at the grain boundary of A3 alloy (Figure 7(c)), which is related to Sn particles distributed at the grain boundary. The thermodynamic calculation shows that with the decrease of temperature, Al–Cu alloy containing Sn will produce the Sn particle (Figure 3(b)) at 229°C. Therefore, the solution treatment leads to the over-burning of low melting point Sn particles, which leads to the coarsening of grain boundaries, and the percentages of intermetallics in A3 alloy is greater than that in A1 and A2 alloys.
Solid solution optical micrographs of the (a) A1, (b) A2 and (c) A3 alloys; (d) the percentage of intermetallics of three alloys after solution treatment.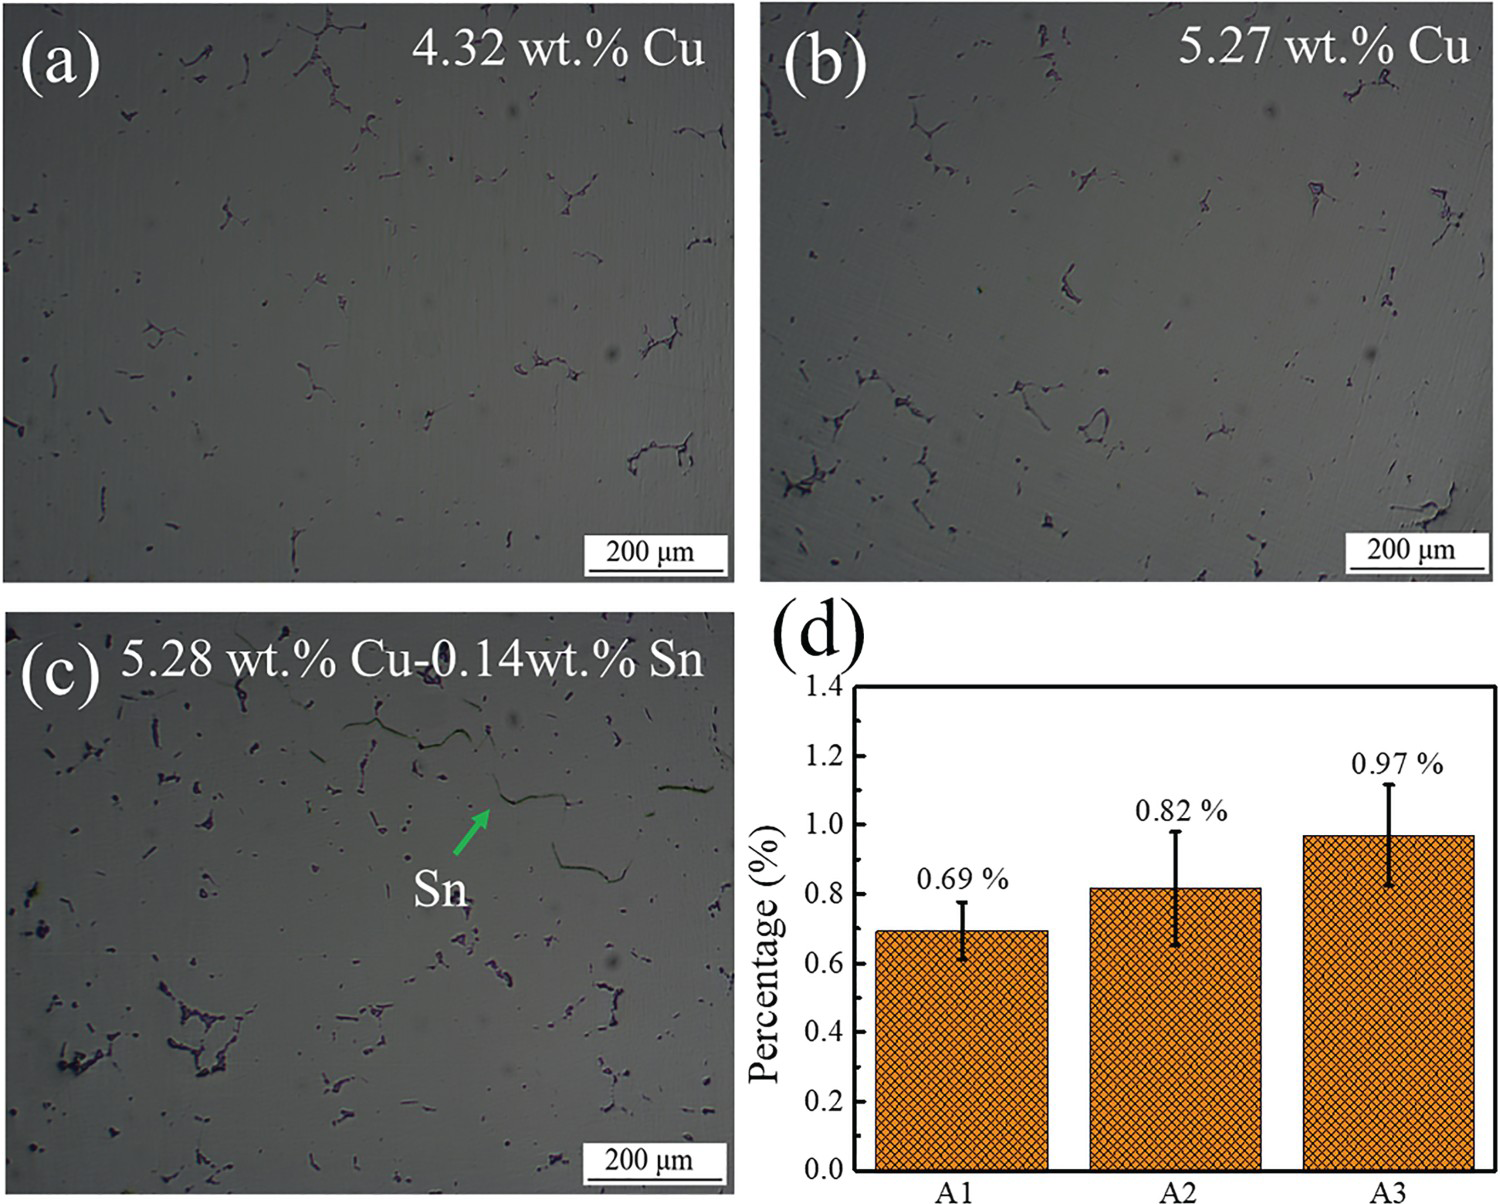
Age-hardening response
Figure 8 shows the evolution of the Vickers hardness for three alloys during aging at 185°C. It can be seen that with the increase of aging time, the hardness of three alloys increases gradually due to the precipitation strengthening. When the aging time is increased to 8 h, the hardness of A1 and A2 alloys reaches the peak values of 121 and 134 HV, respectively. In addition, A1 and A2 alloys reach peak aging at a similar rate. However, the A3 alloy has a different age-hardening behavior compared with A1 and A2 alloys. The peak hardness (162 HV) of A3 alloy is higher than the other two alloys, and the time to peak aging is only 3 h. On the other hand, the age-hardening rate of A3 alloy is higher than that of the other two alloys, which indicates that Sn promotes the age hardening of Al–Cu alloys. Table 4 shows the Vickers hardness of three alloys in the quenching state and natural aging state. The hardness of A1 and A2 alloys in the quenching state is 79 and 88 HV, respectively. After natural aging, the hardness of A1 and A2 increased to 85 and 95 HV, respectively. However, natural aging does not lead to a significant increase in the hardness of A3 alloy, which only increased from 78 to 79 HV. In addition, with the addition of Cu, the hardness of A2 alloy in the quenching state is higher than that of A1 alloy due to the improvement of solution strengthening. However, with the addition of Sn, the hardness of A3 alloy is lower than that of A1 and A2 alloys due to the over-burning of Sn particles.
Age-hardening curves of three alloys. Vickers hardness of three alloys in the quenching state and natural aging state.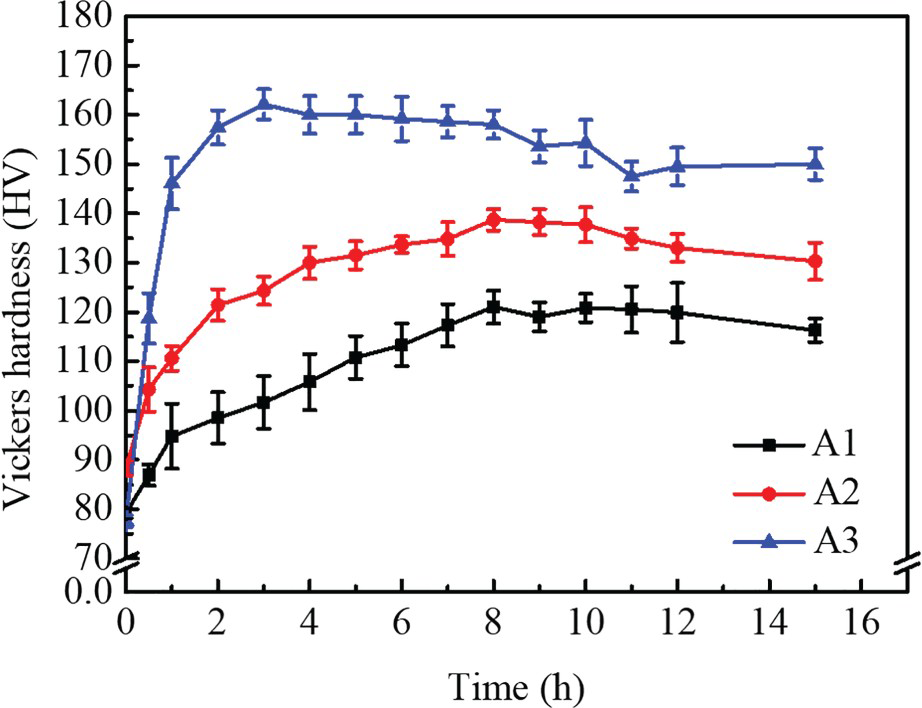
Precipitate microstructure
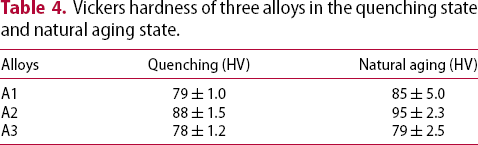
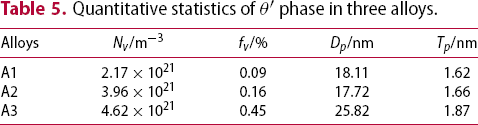
The aging precipitation hardening of the alloy is related to the precipitate microstructure. Figure 9 shows the HAADF-STEM images taken along [110]Al direction of typical precipitate in three alloys. As shown in Figure 9, two kinds of precipitates with different structures are observed in the peak aged state. According to reference [31,32], the precipitate in the red box is considered to be θ′ phase, and the precipitate in the blue box is considered to be θ′ phase. The amount of the θ′ phase increases gradually with the additions of Cu and Sn, and the dispersion of the θ′ phase is uniform in the A3 alloy containing Sn (Figure 9(c)). It can be seen from the quantitative statistics of the θ′ phase in Table 5, the number densities of θ′ phase in A1, A2 and A3 alloys are 2.17 × 10²¹, 3.96 × 10²¹ and 4.62 × 10²¹ m−3, and the volume fractions are 0.09%, 0.16% and 0.45%, respectively. Figure 9(d–f) shows the distributions of θ′ phase length in three alloys. According to the size distribution of the θ′ phase, the addition of Sn not only increases the number of θ′ phase, but also increases the average length from 18.11 to 25.82 nm. Therefore, it can be shown that the addition of Sn accelerates the precipitation of the θ′ phase.
HAADF-STEM images taken along [110]Al direction of precipitate and the distributions of θ′ phase length in the (a,d) A1, (b,e) A2 and (c,f) A3 alloys. Quantitative statistics of θ′ phase in three alloys.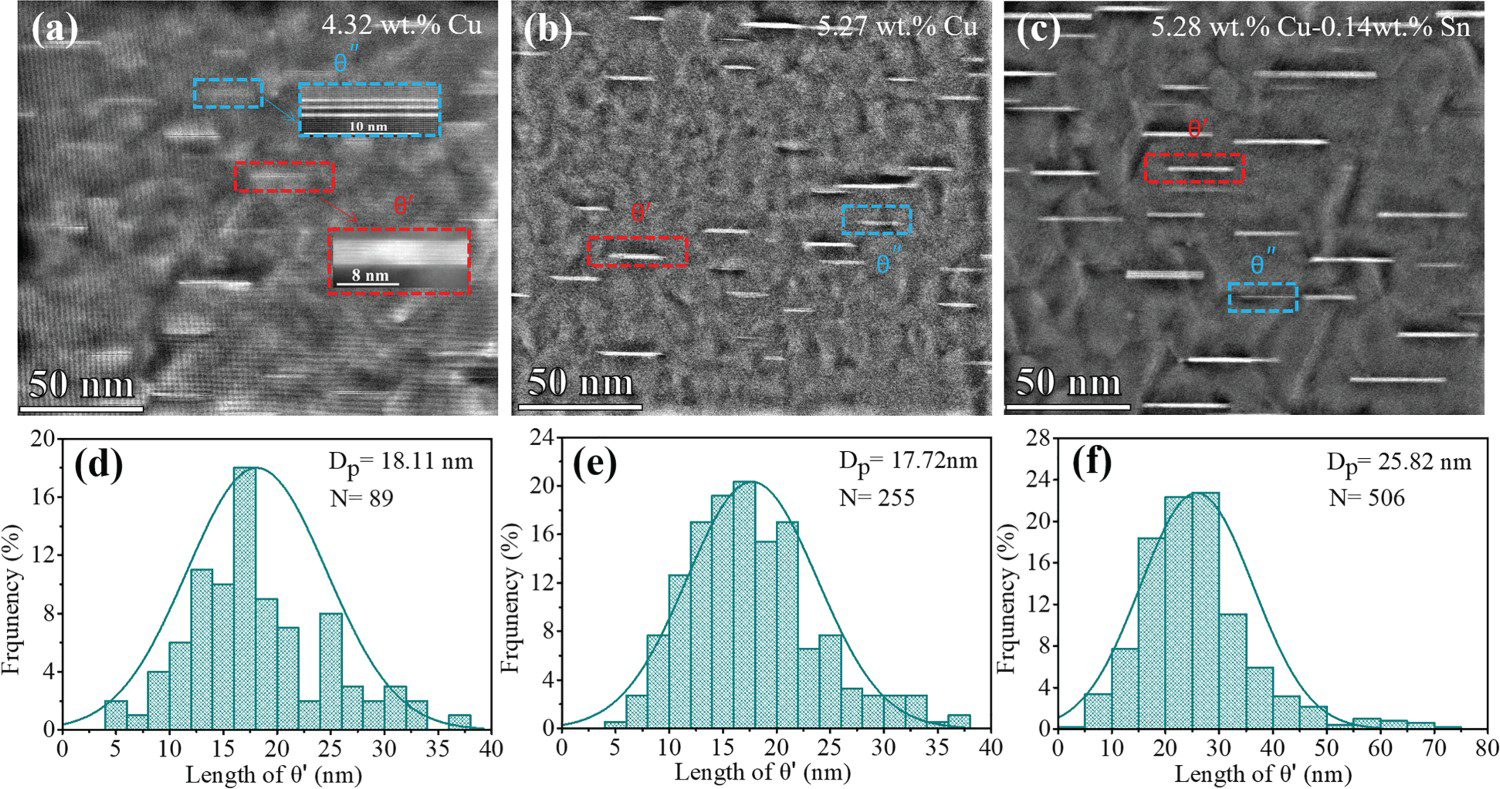
The trace elements have a positive effect on precipitate formation by forming element-vacancy clusters [7,31,32]. It is found that the formation of precipitates is related to element diffusion, and the high number of free vacancies promotes element diffusion. Inevitably, the annihilation of vacancies reduces the number of free vacancies, resulting in the difficulty of precipitation. However, Sn has high binding energy (0.25 eV) with a vacancy and can form Sn-vacancy clusters [33]. The trapped vacancies are released due to the strong thermal activation energy during high-temperature aging, which accelerates the precipitation of the θ′ phase. Therefore, the addition of Sn increases the volume fraction and average length of the θ′ phase. As Sn-vacancy suppresses the formation of the Al–Cu clusters by inhibiting the diffusion of Cu in the natural aging, which retards the natural aging effect [34]. Therefore, the hardness of A1 and A2 increases after natural aging, while A3 alloy does not change significantly. In addition, addition Sn promotes aging precipitation kinetics of A3 alloys by releasing trapped vacancies, resulting in higher hardness and age-hardening rate of A3 alloy than A1 and A2 alloys.
Tensile properties and fracture characteristics
Tensile properties
The tensile properties of three alloys are presented in Figure 10 and Table 6. The A1 alloy has a yield strength (YTS) of 239 MPa, ultimate tensile strength (UTS) of 318 MPa and elongation (EL) of 6.4%. With the increase of Cu content, the YTS and UTS of A2 alloy are increased to 299 and 378 MPa, respectively, and EL is decreased to 5.7%. When Sn is added, the YTS and UTS of A3 alloy are increased to 446 and 457 MPa, respectively, while the EL is decreased to 1.6%.
Tensile properties of the three alloys after T6 treatment. (a) a comparison of the tensile properties; (b) The engineering stress–strain curves. Tensile properties of the three alloys after T6 treatment.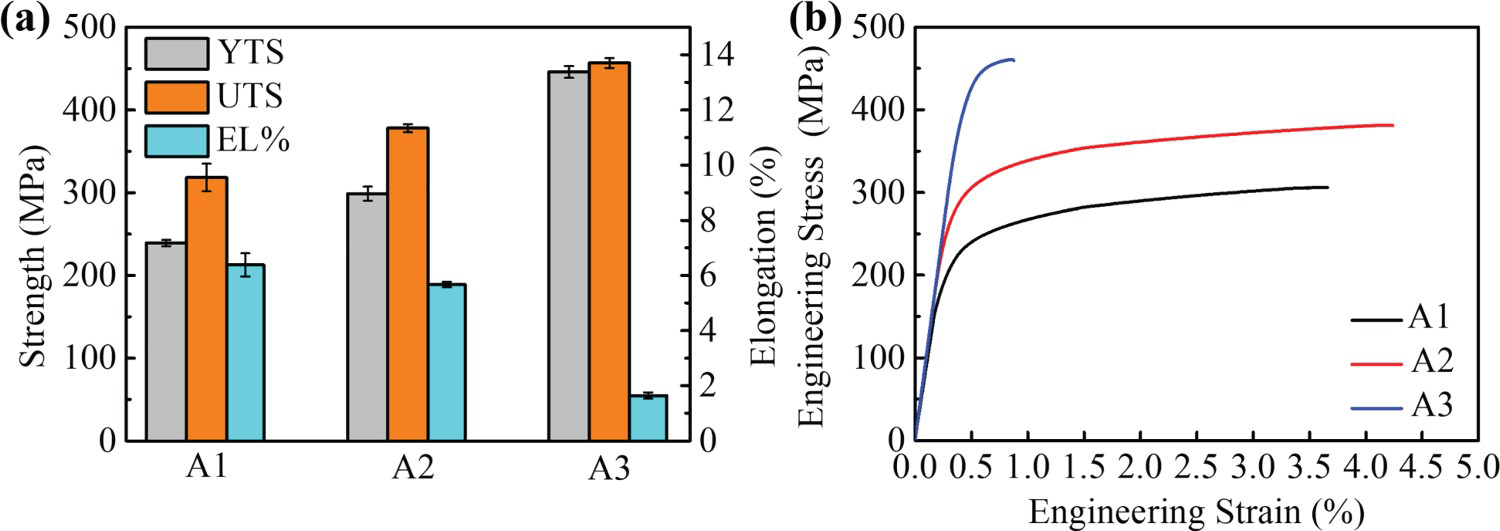
As shown in Figure 10, the YTS and UTS of the A2 alloy are significantly improved compared to the A1 alloy. This is mainly due to the increase of the Cu content, which causes the A2 alloy to form more θ′ phases than A1 alloy after the T6 treatment (Figure 8(b)). On the other hand, Cu provides solid solution strengthening. The addition of Sn promotes the precipitation of the θ′ phase (Figure 9(c)). Therefore, the YTS and UTS of the A3 alloy are further improved. However, the addition of Sn results in a significant decrease in EL.
Fracture characteristics
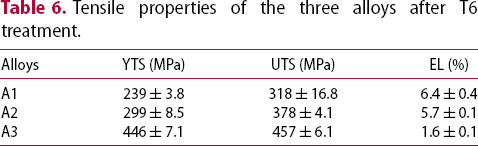
Figure 11 shows the typical fracture characteristics of three alloys after aging. As shown in Figure 11(a,b), A1 and A2 alloys have typical quasi-cleavage fracture morphologies, which are composed of dimples, tearing ridges, and a small number of cleavage planes. A3 alloy has more cleavage planes than A1 and A2 alloys, and Sn particles are found around the secondary cracks (Figure 11(c)), leading to a lower elongation of A3 alloys than A1 and A2 alloys. Figure 11(d–f) shows cross-sectional views of the fracture specimen of A1, A2 and A3 alloys, respectively. It is observed that there are coarse fracture particles near the fracture of three alloys, and these cracks are almost perpendicular to the tensile direction. It can be obtained from the EDS that these particles may be a mixed phase of Al2Cu, Al6 (FeMn) and Al7Cu2Fe, and these phases are not completely dissolved in the solution process. In addition, Sn particles are found in the vicinity of the coarse particles in A3 alloy, and these fracture particles have many cracks, which is consistent with the low elongation of the A3 alloy. However, the over-burning of A3 alloy also results in a decrease in the elongation of the alloy (Figure 7(c)).
Typical fracture characteristics of the (a,d) A1, (b,e) A2 and A3 (c,f) alloys after T6 treatment.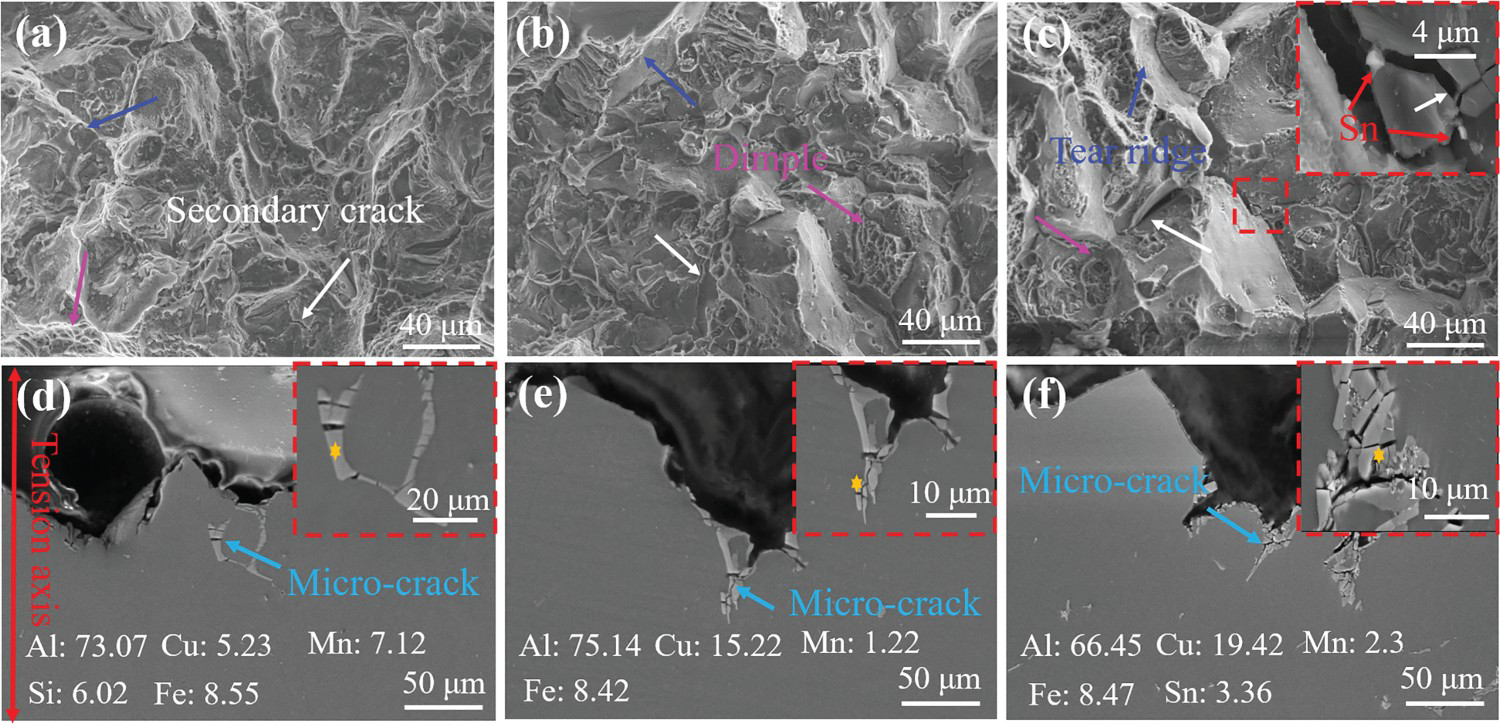
Studies have shown that these undissolved coarse phases are generally brittle phases, which are prone to crack during plastic deformation. Furthermore, these brittle phases tend to produce stress concentration and play the role of crack initiation source [3,35]. During the plastic deformation, the interaction between the coarse particles and the slip bands causes the fracture of the particles. Some cracks propagate along the grain boundary after the particles repeated fracture, and eventually lead to fracture of the alloy. It is obvious that the final fracture paths of three alloys pass through these coarse particles, indicating that the coarse particles are the main source of the cracks.
Discussion
Analyses of aging precipitation kinetics
It can be seen from Figures 8 and 9 that Cu and Sn have a considerable influence on the precipitation behavior of Al–Cu alloys during aging. In order to characterise the influences of Cu and Sn on the aging precipitation kinetics of Al–Cu alloys, the precipitation kinetics of three alloys are studied by DSC curves. Figure 12 shows the DSC curves of three alloys in the solution state at 10°C min–1 heating rate. The DSC curves of three alloys show similar characteristics, including an endothermic peak (a1, a2, a3) and an exothermic peak (b1, b2, b3). In addition, another exothermic peak c appears in the A3 alloy. According to the previous report [36], the endothermic peak (a1, a2, a3) was attributed to the dissolution of GP zones. It can be seen from the box in Figure 12 that there is a weak exothermic peak related to the formation of the θ′ phase. This exothermic peak may overlap with the dissolution of GP zone, resulting in a small peak area. In addition, the previous report has shown that Sn tends to suppress the formation of the θ′ phase in Al–Cu alloys during aging [37]. Therefore, the formation of the θ′ phase in A3 alloy is not obvious compared to the other two alloys. The other two exothermic peaks b and c result from the formation of θ′ phase and θ phase.
DSC curves of three alloys in the solution state.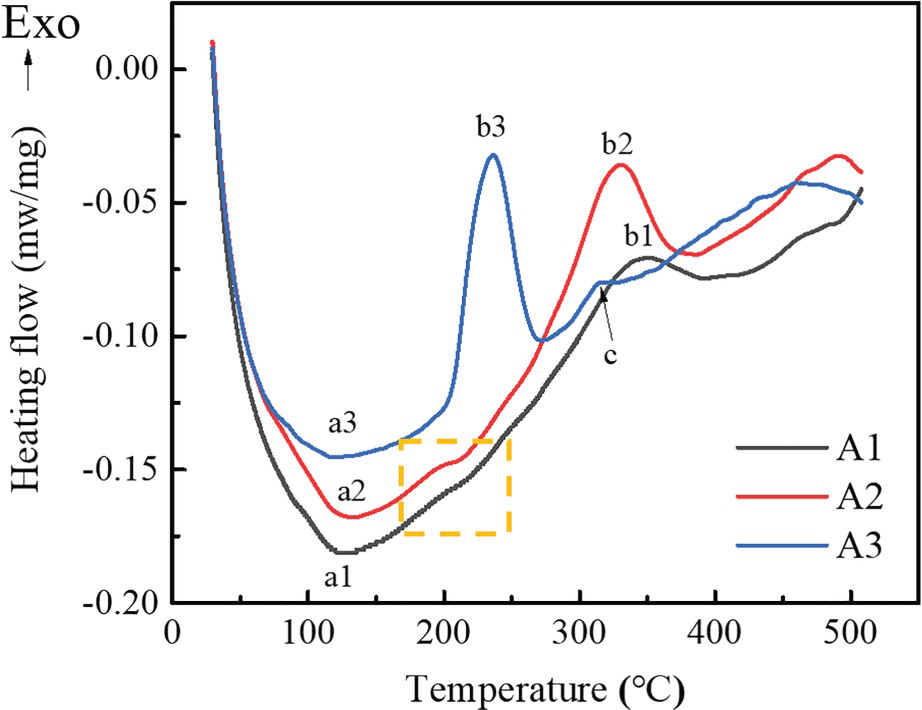
It can be seen from Figure 12 that the additions of Cu and Sn have a certain influence on the precipitation behavior of Al–Cu alloys. The modified Avrami-Johnson-Mehl (AJM) model [8,9] usually is used to represent the precipitation kinetics, and is described as follows:

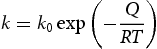
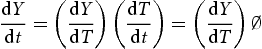
 are gas constant and constant, respectively. Q and T are precipitation activation energy and temperature, respectively. Taking the derivative of Equation (1), the expression of the transformation rate of the precipitate volume fraction in the non-isothermal process can be obtained as follows:


 is the area of peak at temperature T, Af is the total peak area. The transformation rate of the precipitated phase volume fraction related to DSC heating rate (
 ) is described as follows:
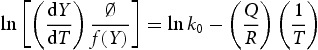
 and
and  meet a linear relationship, and the slope can be obtained by fitting Equation (7). Therefore, the precipitation activation energy can be obtained.
As metastable θ′ phase is the main strengthening phase in Al–Cu alloys, we only focus on the precipitation behavior of the θ′ phase to analyse the effects of Cu and Sn on the precipitation kinetics of Al–Cu alloys. Figure 13 shows the determination of precipitation activation energy of three alloys. In order to improve the calculation accuracy, the tangent method based on thermal effect is used to correct the peak b in Figure 12 to ensure that both sides of the peak are on a horizontal plane, and the peak area is calculated by the tangent method. As can be seen from Figure 13(a), the peak area of the θ′ phase in A2 alloy is larger than that of A1 alloy, mainly due to the addition of Cu, leading to a significant increase in the number of θ′ phase in A2 alloy. On the other hand, the precipitation temperature of the θ′ phase in A1 and A2 alloys is 218°C and 214°C, respectively, indicating the addition of Cu has no great influence on the precipitation temperature of the θ′ phase. However, the addition of Sn causes the precipitation temperature of the θ′ phase in the A3 alloy to drop to 196°C. By fitting the curve in Figure 13(d), the value of n in this process is 2 as reported in Ref. [38,39], and the precipitation activation energies of three alloys are 44.8, 44.2, and 36.9 KJ mol–1, respectively. Accordingly, the addition of Sn results in a lower precipitation temperature and lower precipitation activation energy for the θ′ phase in the A3 alloy than those of A1 and A2 alloys, indicating that Sn promotes the aging precipitation kinetics of Al–Cu alloys, and it also shows that Sn can promote the age-hardening response of Al–Cu alloys.
Determination of activation energy for the phase transformations of three alloys: (a) precipitation peak of θ′ phase; (b) Y–T curves; (c) dY/dT–T curves; (d) ln[(dY/dT) /f(Y)]–1/T curves. (Y is the mole fraction of excess solute precipitated at time t; T is temperature;
 is heating rate).
Strength contribution from θ′ phase
Precipitations have a great contribution to the yield strength of age-hardening alloys [40]. It can be seen from Figure 9 that the main precipitates of three alloys during peak aging is the θ′ phase. Therefore, the contribution of the θ′ phase to the increment in yield strength is studied. In order to quantitatively estimate the contribution of the θ′ phase to the yield strength increment, Zhu and Starke proposed a strength model for the unshearable platelike θ′ phase to calculate the shear stress  [41]. The
  is determined to be
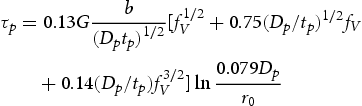
 is the inner dislocation cut-off radius,
  =b = 0.286 nm [42],
  ,
,  and
and  are the volume fraction, average length and thickness of the θ′ phase, respectively. According to Equation (8), the difference of shear stress is related to the volume fraction and average size of the θ′ phase. The average length and thickness of the θ′ phase meet the relationship shown in Equation (9) [17]. In addition, the tensile stress
  and shear stress
  meet the relationship of Equation (10) [43]:

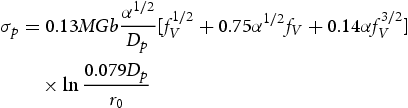
 is a constant related to the composition and heat treatment conditions of alloy, and M is the Taylor factor, M = 3. Therefore, the contribution of the θ′ phase to the yield stress is given by combining Equations (8)–(10), as follows:
Conclusions
The microstructure of as-cast Al–Cu alloys is composed of α-Al, Al2Cu, Al6 (FeMn) and Al7Cu2Fe phases. Moreover, the addition of Sn has no obvious effect on the formation temperature and amount of Al2Cu in the solidification process of Al–Cu alloys, and the additions of Cu and Sn refine the grain size of Al–Cu alloys from 79.1 to 74.8 µm. The additions of Cu and Sn decrease the precipitation temperature of the θ′ phase from 218°C to 196°C, and the precipitation activation energy from 44.2 to 36.9 KJ mol–1. Sn retards the natural aging effect, and causes the peak aging of Al–Cu alloys to be shortened from 8 to 3 h, and the hardness increased from 121 to 162 HV, which improves the age-hardening response. Owing to the additions of Cu and Sn, the Al–Cu–Sn alloy achieves a higher number density and volume fraction of the θ′ phase than Al–Cu alloys in the peak aged state. The yield strength and ultimate tensile strength of Al–Cu alloys increased from 239 MPa and 318 to 446 and 457 MPa, respectively, while the elongation decreased from 6.4% to 1.6%. In addition, with the increase of Cu and Sn content, the calculated strength contributions of the θ′ phase to the yield strength are 30, 41 and 71 MPa, respectively.
Footnotes
Acknowledgements
The authors would like to thank all labmates in the Integrated Computational Materials Engineering (ICME) lab, Advanced Research Institute of Multidisciplinary Science (ARIM), Beijing Institute of Technology (BIT). The helps from Ms Dongmei Chen at Yangzhou Fengming Photoelectric New Materials Co., LTD and Dr. Pengcheng Mao from the Center for Micro and Nano Technologies, Beijing Institute of Technology, for coordinating the resources for experiments are greatly appreciated.
Disclosure statement
No potential conflict of interest was reported by the author(s).