
Abstract
Q1N samples with different degrees of tempering were produced and changes in MBN energies in non-stressed and stressed samples was investigated. It was observed that while MBN energy decreased with increasing degree of tempering, it increased with applied uniaxial stress and the two opposing effects cannot be easily separated. MBN energy increased with stress along RD and decreased in the transverse direction (TD). Therefore, the ratio of MBN energy in RD to TD was examined. The value of the ratio at 0.3 T was successfully shown to be strongly correlated with applied uniaxial tensile stress level, regardless of the degree of tempering (pinning site density) in Q1N samples.
Keywords
Introduction
Q1N is a low carbon alloy steel (similar to HY-80) with a minimum yield strength of 550 MPa that is widely used in its quenched and tempered condition [1]. Possessing a good combination of strength and toughness, it has potential for implementation in a variety of industries involving exposure to high temperature and pressure, as might be found in petrochemical, shipbuilding and submarine applications. Prolonged high-temperature service can result in continuous changes in the microstructure of Q1N steel, degradation of its mechanical properties and occurrence of Temper Embrittlement (TE) [2] as a result of impurity migration and formation of an intergranular crack path [3,4].
Non-destructive testing (NDT) methods can provide helpful data to evaluate the integrity of components and structures, and predict their remaining service life [5]. In addition, using NDT methods, 100% of the components can be tested – provided they are accessible. In particular, non-destructive micromagnetic characterisation of ferromagnetic materials is increasingly being used for evaluation of defects [6], as well as fabrication or identification of in-service microstructural changes [7] and the presence of stress [8]. The applicability of a technique largely depends on the ability to establish an empirical relation between measured electromagnetic parameters and the physical state of the component for a specific application, with proper resolution and sensitivity.
It is well documented that there is a strong relationship between microstructure and magnetic properties of materials [9]. In the demagnetised state, microstructural parameters such as grain size, dislocation density, crystallographic texture, as well as residual stress have a significant impact on the resulting magnetic domain structure [10]. Applying an external magnetic field or stress modifies the domain configuration in accordance with overall energy minimisation [10]. Some microstructural parameters can halt the change in magnetisation and are commonly referred to as local energy barriers or pinning sites [11]. The potential barriers can affect the MBN signals by setting a new threshold for the magnetic field required to move domain walls [12].
When a time-varying magnetic field is applied to a sample and a local threshold level is exceeded, formerly pinned domain walls move irreversibly to achieve a new equilibrium condition. The temporary domain wall pinning is the result of various microstructural parameters, such as inhomogeneities in the form of carbides, inclusions and precipitates [10,13] as well as plastic deformation involving dislocation structure [14]. Grain size [15], texture [16] and phase change [17] can also affect the domain structure, which, in turn, modifies interactions with domain wall pinning sites. Size, density, distribution and strength of pinning sites have significant effects on the critical magnetic field required to start domain wall motion [18]. The abrupt changes can be a result of overcoming the pinning barriers by domain walls and their subsequent displacements, which, in turn, produces a new magnetisation state [9,10]. These sudden changes in magnetisation produce noise-like signals known as magnetic Barkhausen Noise (MBN). MBN is an emerging micromagnetic measurement technique, which is used to study irreversible movements of domain walls and the subsequent evolution of domain structure.
Differences in the interaction of pinning sites with domain structure and consequent domain wall movement are the core idea behind the application of this technique for microstructural characterisation of steel. Changes in MBN signal output with changes in martensite microstructure in plain carbon [19] and low alloy [20] steel with increasing tempering temperature have been investigated. The change in signals was attributed to the decomposition of retained austenite to cementite and ferrite as well as precipitation, dissociation and coarsening of precipitated carbides [20]. The precipitates are generally known as (domain wall) pinning sites, which would subsequently affect domain wall displacement. It was, also, suggested that both density and morphology of carbides are among the main factors affecting MBN characteristics [21].
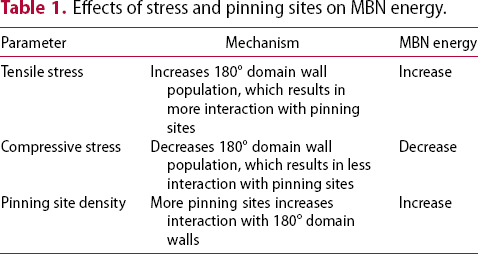
Effects of stress and pinning sites on MBN energy.
These conditions make MBN signals sensitive to both stress and microstructural parameters [12] and have been used to evaluate residual stress as well as microstructural characterisation for quality control in various fabrication processes, in particular, heat treatment [25,26], grinding [27], welding [28], casting [29], machining [30] and forming [31]. MBN analysis has also been used to predict mechanical properties, such as hardness estimation [32], considering the governing effect of microstructure on both magnetic and mechanical properties. Recently, the interaction of domain structure with pinning sites and its consequent change with stress has been modelled based on the Magnetic Object (MO) model [33] and the association of MBN signals with domain structure [34].
Although several investigations have been dedicated to the study of tempering effects, considering detailed effects of carbide characteristics (chemical composition, morphology and distribution) on MBN output signals, simultaneous effects of both microstructural changes and stress on MBN parameters have not been investigated. The goal of this work is to provide a direct measure of microstructural degradation of a component or structure in service and provide technical information to enable condition-based assessment. To this end, the present work studies the effect of stress on MBN energy of Q1N samples with different degrees of tempering (pinning site density) and decouples these two interplaying parameters. This could have practical application for non-destructive stress evaluation of components, independent of their gradual microstructural changes in service life.
Materials and methods
Chemical composition (wt-%) of Q1N steel.

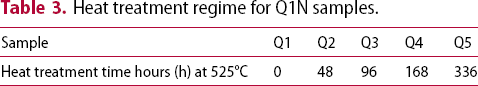
Heat treatment regime for Q1N samples.
A Quanta 250 Scanning Electron Microscope (SEM) was used to prepare images of the sample surfaces of the main specimens. Samples (10 mm × 10 mm) were prepared for the microstructural characterisation and were lightly sanded using emery paper of grit size 240, 320, 400 and 600, respectively. Then, the samples were polished using 6 µm followed by 1 µm diamond paste. The surfaces were given a final finish by polishing using 0.05 µm alumina paste. The samples were then etched using 5% Nital solution. An in-house MBN flux control testing device with a tetrapole probe [35] was used to generate MBN signals in the samples. Using the tetrapole probe provides the ability to measure BN energies for different magnetisation angles (compared to rolling direction) at the same location. A 5 mm diameter pickup coil of 400 turns wound on a 1 mm diameter ferrite core was used to detect MBN signals. The flux-controlled system ensures the effects from small changes in liftoff (spacing between probe and sample) are minimised [36]. The probe possessed four excitation coils (500 turns for each excitation coil), and one pickup coil (400 turns) mounted between the poles. Coils on each pole were excited with a sinusoidal current at a fixed frequency of 50 Hz, using the flux control technique. The flux was increased from 0.1 to 1 T (in 0.1 T steps) as measured at the pole ends. These sweeps ensured that the peak flux used in a subsequent scan was below the saturation level for the MBN signal response. The second pair of coils (feedback coils) was used to measure the induced flux through each pole. The MBN tests were carried out for angles of 0 and 90 degrees, which represent rolling (RD) and transverse (TD) directions, respectively. The reference direction of the sample was also the sample's easy axis or easy magnetisation direction (preferred crystallographic direction for domain walls), which was determined by angular-dependentmeasurements [37,38].
The resulting MBN energy was calculated by the integral of the voltage-squared signal over time, summed over all the Barkhausen events in a cycle, given as [10]
The Q1N samples were tested under applied uniaxial tensile stress conditions using a 50 kN Instron Universal Testing Machine. Each sample was subjected to six different stress levels of 0, 80, 160, 240, 320 and 400 MPa. Uniaxial tensile stress was applied in the rolling direction of the Q1N samples. MBN flux sweep measurements were performed and MBN energies were measured at each loading step. The highest force represented a stress of 400 MPa, which was well below the yield strength of the Q1N steel (550 MPa). This ensured that all readings were in the elastic deformation zone and there was no interference from plastic deformation parameters. To demonstrate that microstructural inhomogeneity effects on measured MBN signals could be separated from effects of stress and TE, the test on each tempered sample was repeated five times at independent and randomly selected locations along the sample's midline. The average of these five separate readings was reported as the MBN energy parameter. Corresponding Standard Errors (SE) were also calculated for these measurements.
Results/discussion
Figure 1(a–e) shows micrographs of SEM observations for as-received sample (Q1) Figure 6(a) as well as samples heat-treated for different holding times (48–336 h) at 525°C (Q2 to Q5) Figure 6(b–e). The micrographs indicate gradual changes in microstructure, which results in the reduction of carbide density in the matrix with increasing holding time in the tempering temperature range. Furthermore, rod-shaped carbide precipitates in the as-received (Q1) sample steadily change to a spherical shape with time.
SEM images of samples heat-treated for different holding times at (a) Q1 (0 h), (b) Q2 (48 h), (c) Q3 (96 h), (d) Q4 (168 h) and (e) Q5 (336 h) (white precipitates represent carbides in the matrix). The scale bar in the bottom left of the micrographs is 2 µm long.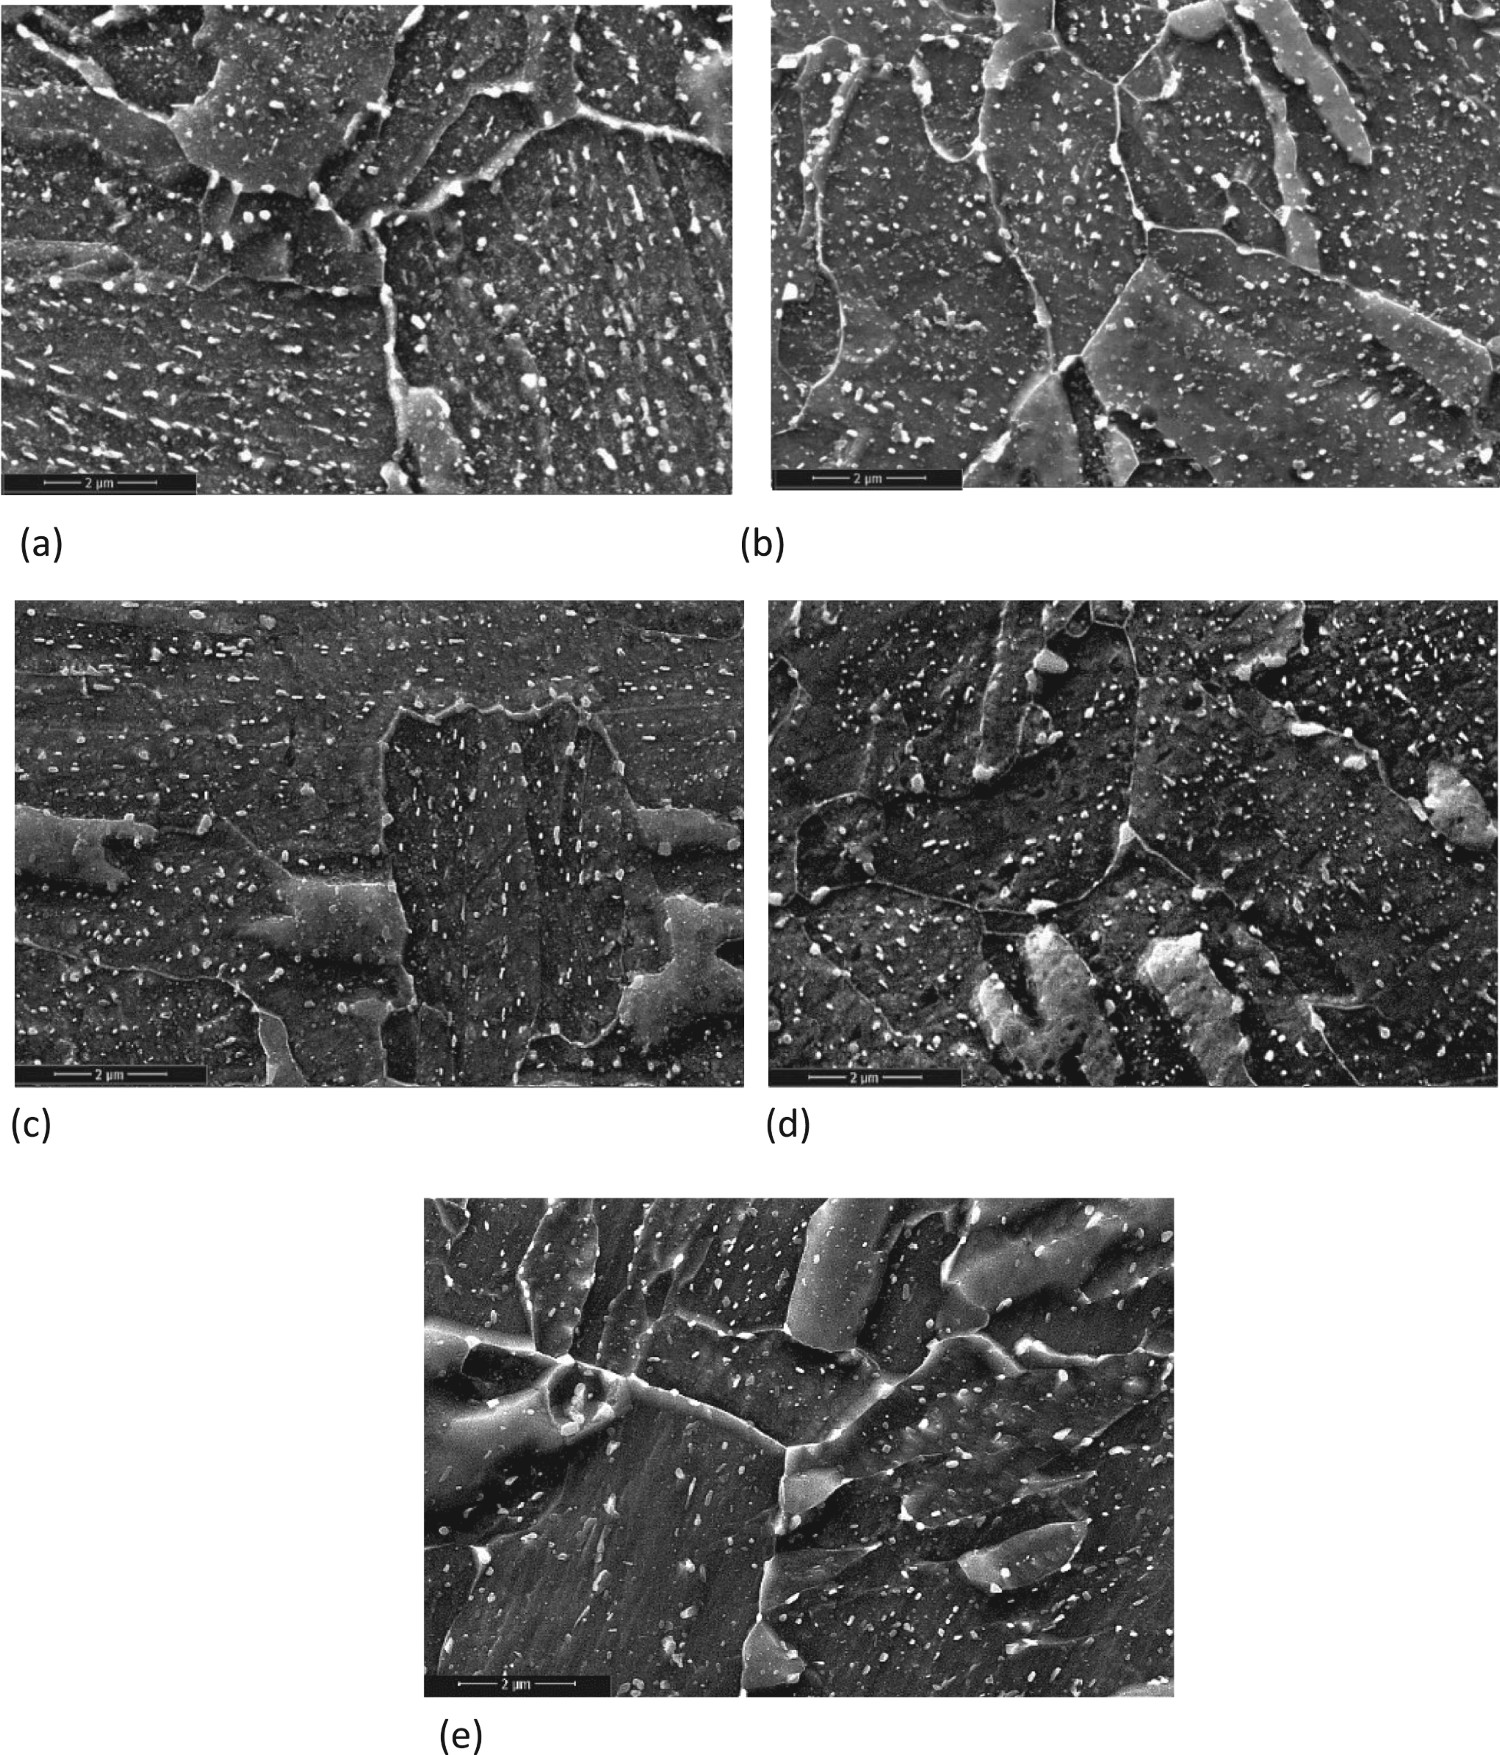
Figure 2(a) shows a comparison of MBN energy along RD between samples with different tempering times at zero stress. Data from as-received sample (at one location) is also presented for comparison. In this case, the large difference between the as-received and subsequent tempered samples may be due to the relief of residual stresses in the as-received sample by heat treatment at 525°C. Application of an increased flux density at a constant frequency (50 Hz), increases the rate of motion of 180° domain walls and consequently, a greater number of pinning barriers may be overcome [39,40]. This, in turn, amplifies the MBN energy.
(a) MBN energy as a function of peak flux (RD) for all samples with no stress, (b) MBN energy for all samples with no stress and at 1.0 T.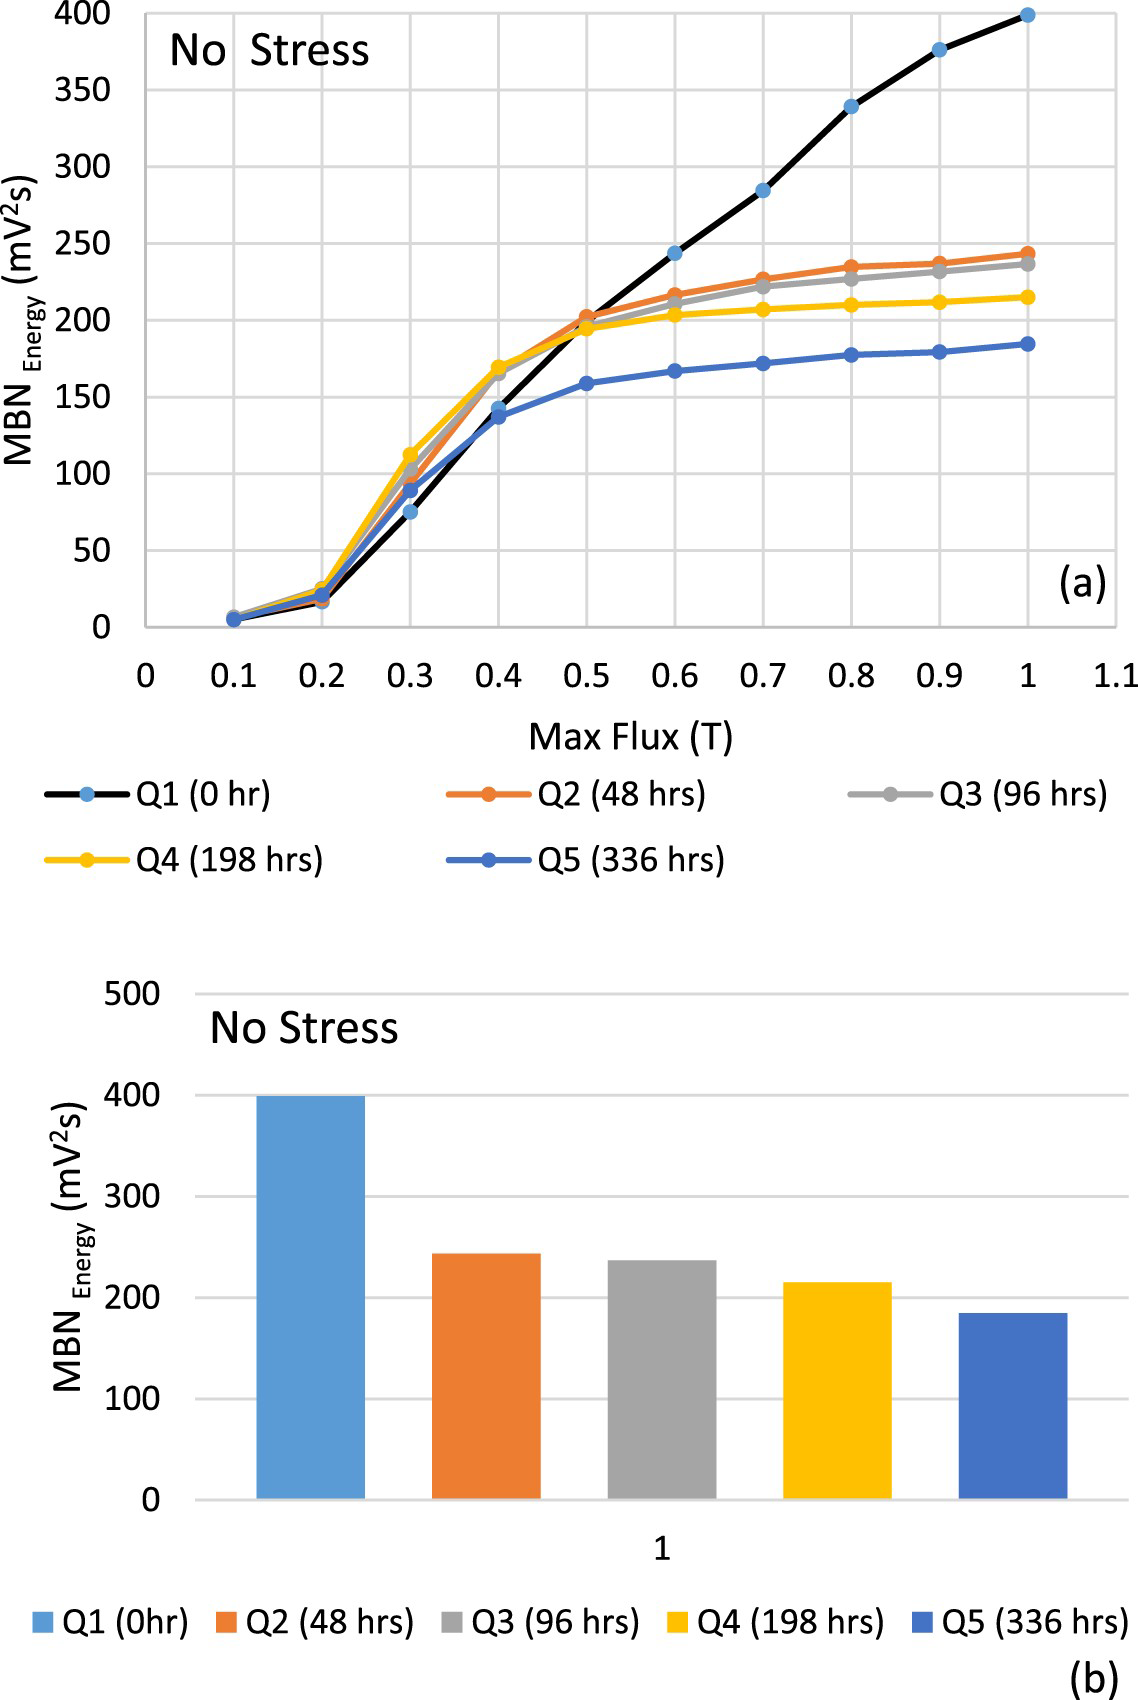
Depending on the microstructure of Q1N samples, different intensities of MBN signals were observed. Figure 2(b) represents corresponding data at peak flux of 1.0 T. A decrease in MBN energy is associated with a reduction in precipitate density within the matrix [41]. As a result, there are fewer pinning sites in the grain to interact with the moving 180° domain walls and subsequently, lower MBN energy is measured.
The MBN energy has a strong dependence on applied field amplitude (or resultant field density in the sample). The applied field strength serves not only for magnetisation processes within the sample but also for Barkhausen signals, with the largest contribution to abrupt magnetisation changes arising due to 180° domain wall movement [42]. It is well documented that 180° domain wall movement is the main contributor to MBN signals, as the resulting change in local magnetisation is greater than that associated with 90° domain wall motion, and their movement occurs at lower magnetic fields [9].
For tempered samples, application of an increased flux density (<0.5 T) at constant frequency (50 Hz), increases the rate of motion of 180° domain walls and consequently a greater number of pinning barriers may be overcome [42]. This, in turn, amplifies the MBN energy. At higher flux density (0.5 T and greater) along the rolling direction the slope is lower, which suggests that the majority of MBN signals that are related to the movement of 180° domain walls has been completed and only decreasing contributions to MBN energy come from 90° domain wall motion.
Previous research has focused on microstructural changes as a result of tempering in the absence of stress [41]. Investigation of the combined effect of microstructure and stress on MBN signals is a matter of great interest in the practical application of the MBN technique. As a result, each tempered sample was also subjected to applied stress.
Figures 3–6 show the average of five MBN energy (mV2s) readings for each tempered sample (Q2 to Q5) at different stress levels from 0 to 400 MPa (in 80 MPa steps). Standard Errors are also presented in the plots and show that the greatest variability arises at the highest stress levels in the RD and is less in the TD, where it decreases further with stress. In this case, absolute variability in the MBN energy, in general, appears to scale with the magnitude of the MBN energy itself. However, some sample-to-sample variation is also present with Q3 showing the least variability in the RD, but the greatestin the TD.
MBN energy as a function of peak flux at various stress levels of 0, 80, 160, 240, 320, 400 MPa, for the holding time of 48 h (sample Q2). (a) RD and (b) TD. MBN energy as a function of peak flux at various stress levels of 0, 80, 160, 240, 320, 400 MPa, for the holding time of 96 h (sample Q3). (a) RD and (b) TD. MBN energy as a function of peak flux at various stress levels of 0, 80, 160, 240, 320, 400 MPa, for the holding time of 168 h (sample Q4). (a) RD and (b) TD. MBN energy as a function of peak flux at various stress levels of 0, 80, 160, 240, 320, 400 MPa, for the holding time of 336 h (sample Q5). (a) RD and (b) TD.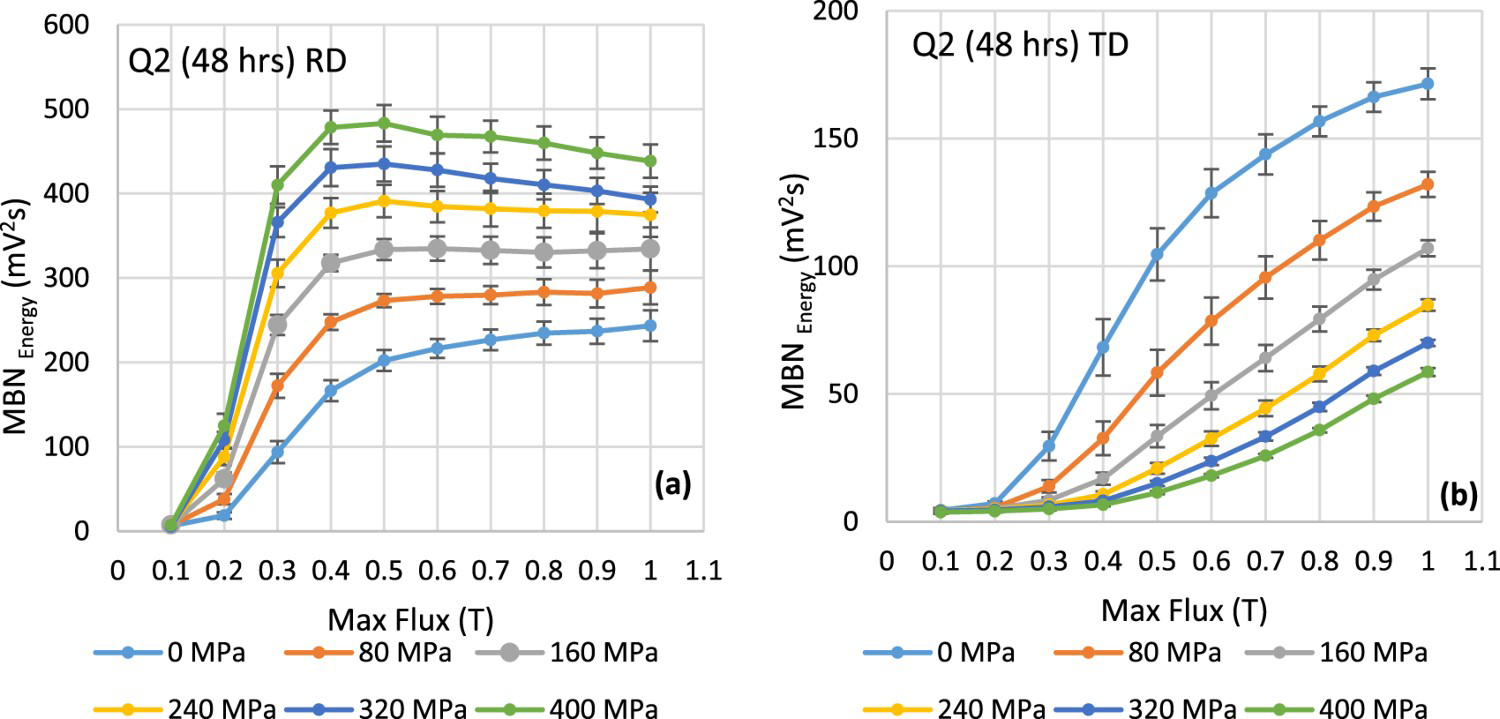
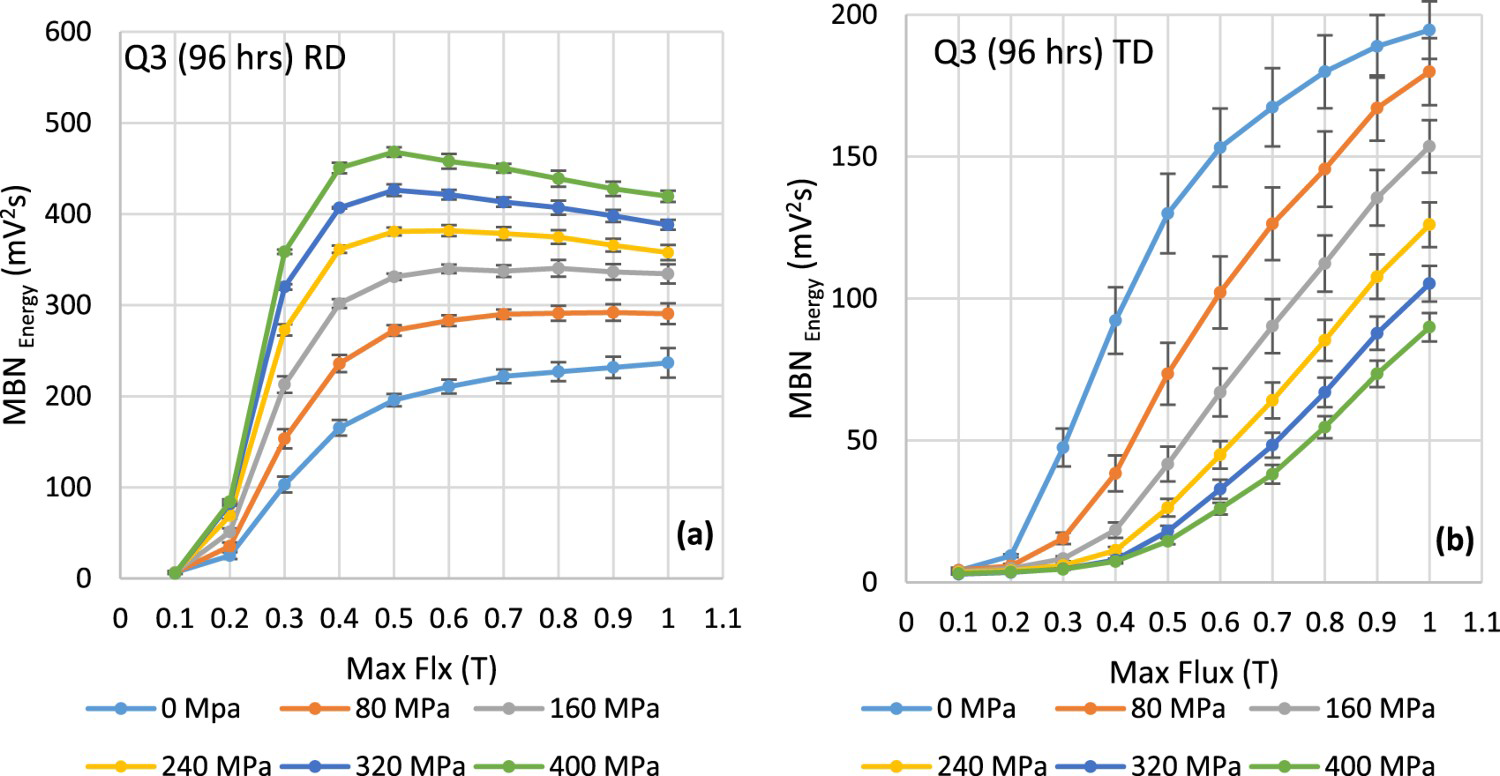
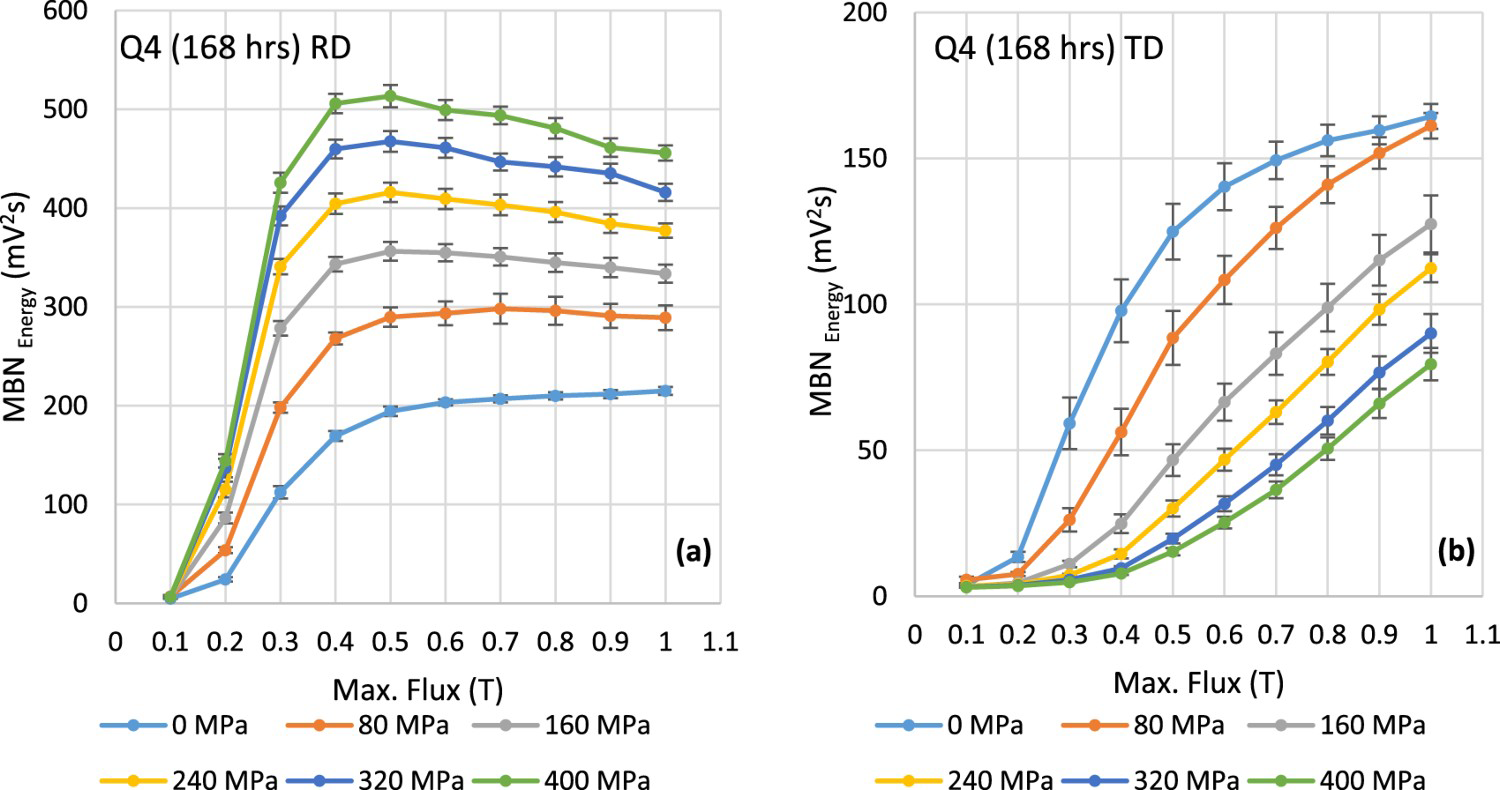
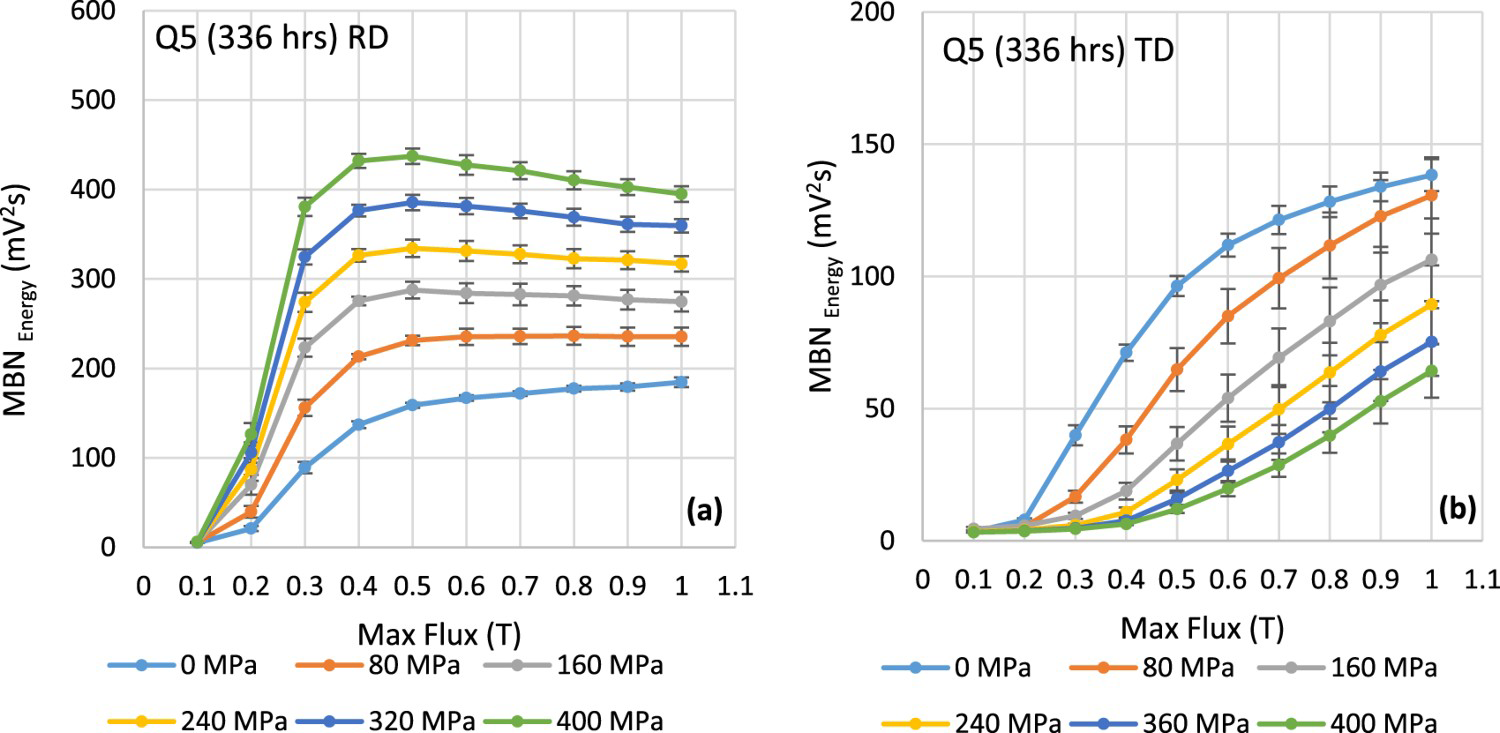
For all samples, MBN energy was observed to increase with stress along the RD and decrease along with the TD. An increase in MBN energy along RD is greatest for the sample with the shortest tempering time (Q2) and is least for the 336 h heat-treated sample (Q5). As Figure 1 indicates, the density of pinning sites decreases with tempering time and is a minimum for the 336 h sample (Q5), which could be a result of the dissolution of weaker carbides and coarsening of strong ones [20], leaving the matrix with fewer pinning barriers for the movement of 180° domain walls. This, in turn, results in a reduction in the recorded MBN energy [41]. This, also, results in a reduction in variability of MBN energies for different locations on each sample.
The increase in MBN energy with uniaxial tensile stress along the RD is in agreement with models that interpret the increase in the MBN energy with an increase of the active 180° domain wall population, with a consequent reduction of the 90° domain wall volume [10,22]. In the central region of the magnetisation curve, 180° domain wall movement is the major magnetisation mechanism [9]. This is where the Barkhausen signal is at its highest level [43] and also shows the most sensitivity to stress [42,44]. So, the sensitivity of MBN signals to 180° domain wall density may be considered to be the major factor in its dependency on stress level [45].
For low flux density, MBN energy continues to reflect the same abrupt magnetisation process and increasing stress allows more pinning sites to be overcome. This is associated with an increased level of sample magnetisation, due to increased permeability, which results in an increase in MBN energy. At high flux density levels, the majority of 180° domain wall motions have already been completed so increasing flux density does not greatly affect MBN energy [42].
For RD, it was also noted that with increasing stress the MBN energy has its highest rate of change between 0.2 and 0.3 T. The rate starts to decrease after 0.3 T. Furthermore, above 0.5 T, MBN energy remains roughly constant or decreases slightly, but with higher levels of MBN energy having been achieved for higher stresses. Reduction in MBN energy at high stress and flux density can be attributed to the reduction in the interaction of 180° domain walls with available pinning sites [34].
Enhanced stress sensitivity of MBN at low magnetic fields can be attributed to the effect of the increasing number of 180° domain walls with stress [22]. At low flux densities, MBN energy increases rapidly with stress, while at higher flux densities sensitivity of MBN energy with stress reduces. As a result, the recorded behaviour of MBN energy with stress suggests that optimum sensitivity of MBN energy to stress can be achieved at lower flux densities, where MBN energy is a rapidly changing function of flux density [42].
In order to compare the MBN energy signals along applied stress direction, also the RD, corresponding average MBN energy (mV2s) of different samples at various uniaxial tensile stress levels is shown in Figure 7 (no stress was applied along with TD). For ease of comparison, only data for 0, 160 and 400 MPa stress levels are presented in the graph. Data from the as-received sample is also presented (solid lines). Figure 7 clearly indicates that the as-received sample (Q1, solid lines) behaves differently compared with the tempered samples. Q1 sample exhibits the largest increase in MBN energy with an increase in magnetic flux. Therefore, the as-received sample can be easily separated from tempered ones. In contrast to the continuing increase of MBN energy with peak flux, observed for the Q1 sample, all tempered samples demonstrate a decrease (or plateau) from the peak value at 0.4–0.5 T.
Average MBN energy as a function of peak flux (rolling direction) for samples; Q1 (0 h), Q2 (48 h), Q3 (96 h), Q4 (168 h) and Q5 (336 h) at stress levels of 0, 160 and 400 MPa.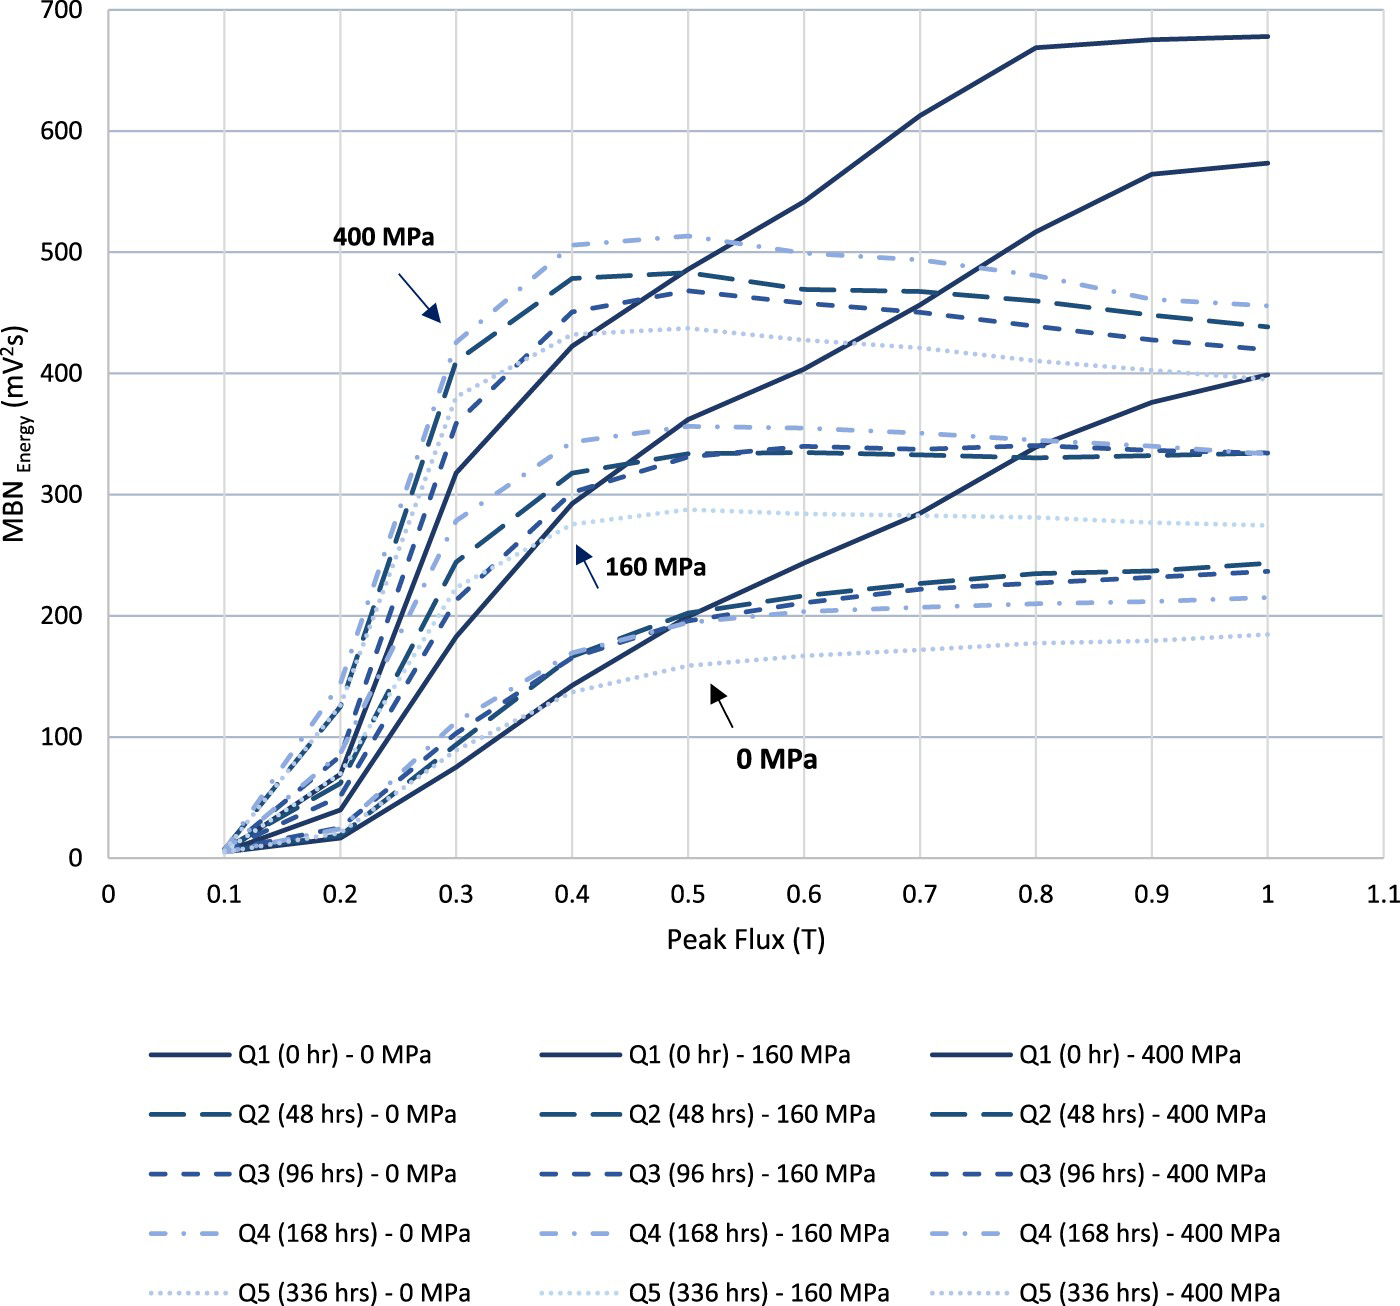
The thickness of a 180° domain wall is 80 nm, whereas that of 90° domain wall is 40 nm [9,46]. Pinning is stronger when the dimension of the pinning barrier is roughly equal to domain wall width [10]. In the present study, the average carbide size for the Q1N samples was measured and found to be between 40 and 60 nm, with the smallest being Q3 with 40 nm. In a detailed study on changes in carbide characteristics during prolonged tempering of Cr–Mo steel, it was noticed that new complex carbides may gradually precipitate, while weaker ones dissociate [47]. This could have an effect on domain wall pinning site characteristics depending on the carbide size, shape and strength at different tempering times. In addition, the size of carbides may increase and their shape may change with holding time due to coarsening.
So, tempering time results in a reduction in carbide density within grains, which in turn, decreases the number of pinning sites 180°domain walls can interact with, thereby causing a decrease in MBN energy [41]. On the other hand, stress increases MBN energy due to an increase in 180° domain wall population [48]. This, in turn, explains the observation that although at zero stress MBN energy decreases with holding time (Figure 2), there is not the same straightforward behaviour for the samples over the whole stress range (Figure 7). As a result, separating the interplay of these two factors, when magnetisation and stress are in the RD, is challenging, and is an indication of the complexity of investigating simultaneous effects of stress and microstructural change. Separation of these two parameters would be desirable for the case of monitoring residual and/or active stress when gradual changes in the microstructure are alsopresent.
Angular-dependent MBN energy has previously been used to determine the magnetic easy axis as well as identify the degree of material anisotropy [48,49]. Its relation with stress would be consistent with reorientation and increase in 180° domain walls aligned in direction of stress, which, in turn, results in changes in magnetic anisotropy and a shift of magnetic easy axis toward the direction of applied stress [50]. As a result, a previously introduced parameter (to investigate easy axis in pipeline steel) [51] was chosen for this new application. In this work, the ratio of MBN energy in line with the direction of the easy axis (RD), under applied tensile stress, to that orthogonal to it (TD) was used as follows:
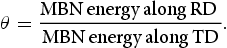
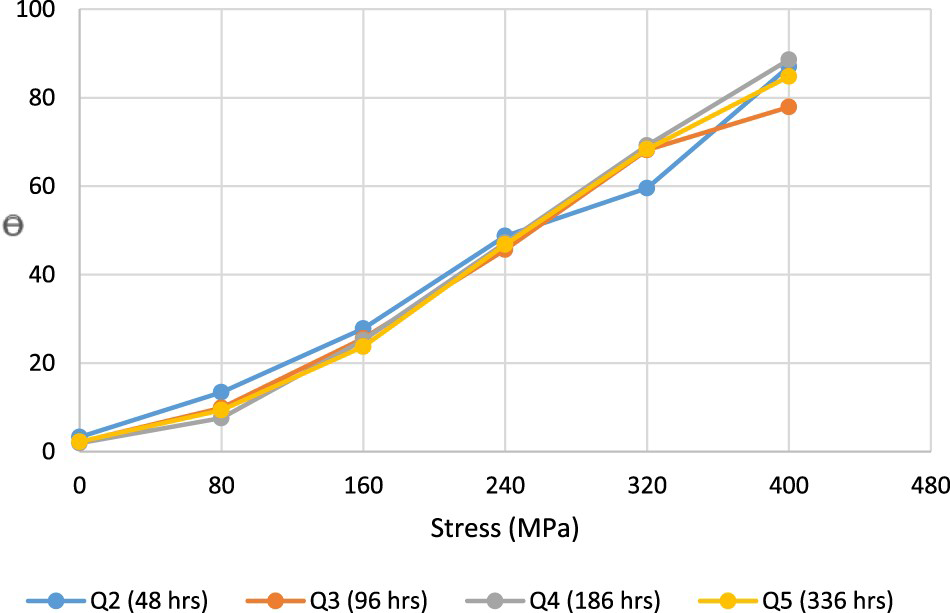
Figure 8 shows the calculated θ as a function of peak flux for the heat-treated samples at various stress levels. The average of the five readings was used for MBN energy calculation along each direction. The graph clearly indicates that samples with different degrees of tempering have similar values of θ at any given stress. The graph also indicates that for all samples, θ shows maximum sensitivity to stress level at 0.3 T peak flux. So, θ was plotted against applied directional stress at 0.3 T maximum flux peak (Figure 9). As the graph indicates, θ shows the independence of the degree of tempering (and the resultant microstructural changes) and is directly proportional only to the applied stress. The findings agree well with other research on the application of this ratio in pipeline magnetic flux leakage inspection [45].
θ as a function of peak flux for samples experiencing different heating times; Q2 (48 h), Q3 (96 h), Q4 (168 h) and Q5 (336 h) at stress levels of 0, 80, 160, 240, 320 and 400 MPa. Effect of stress on θ for samples with different degrees of tempering at 0.3 T. Q2 (48 h), Q3 (96 h), Q4 (168 h), Q5 (336 h). Stress levels: 0, 80, 160, 240, 320 and 400 MPa.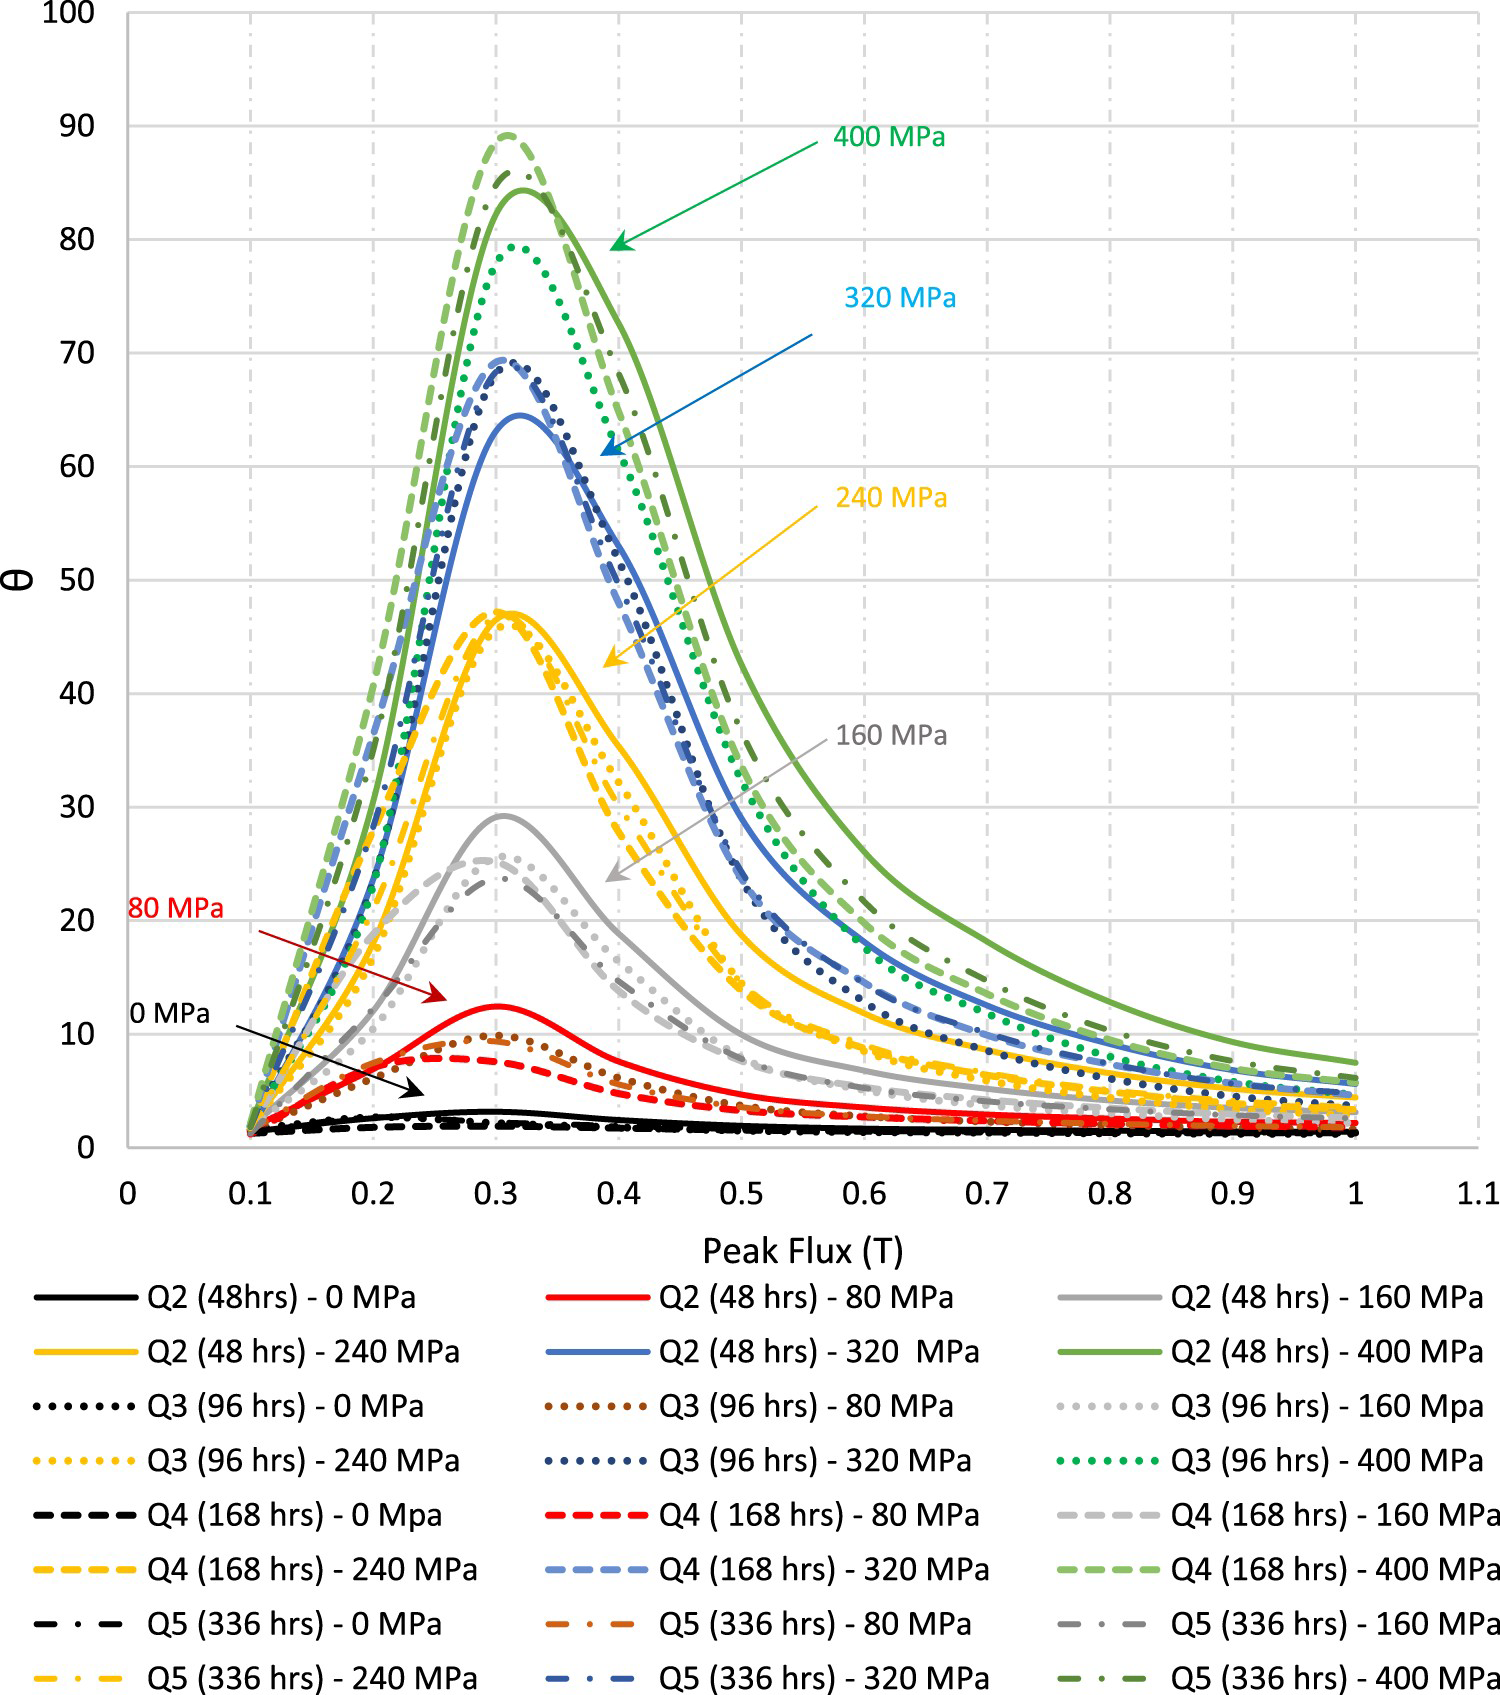
The proposed ratio (θ) may be interpreted as a relative change in magnetic properties in a direction parallel to the easy axis with respect to that perpendicular to it. Domain structure is modified by stress along RD (anisotropic effect) but is independent of the number of pinning sites. By dividing by MBN energy in TD, it is proposed that the isotropic pinning contribution is removed. This also increases the sensitivity to stress as MBN energy decreases with stress in TD. Based on the MO model [10,22], reduction in MBN energy along TD is due to the presence of compressive strain (stress) along this direction. This, in turn, results in a reduction in domain wall population (less interaction with pinning sites) along with TD and leads to a lower MBN energy.
In conclusion, it seems this parameter (θ) at 0.3 T (where MBN energy is almost entirely due to 180° DW motion) is an accurate indicator for investigating MBN signal sensitivity to stress in Q1N samples with different degrees of tempering (pinning sites). Therefore, the stress response can be decoupled from the microstructural response of Q1N samples using the θ parameter. Applying stress perpendicular to the easy axis also represents a potential application and would be investigated in further research.
It is worth mentioning that although in the present study the carbide precipitates are discussed as the main source of pinning site, other probable microstructural parameters such as retained austenite [52] and its decomposition [20] as well as grain boundary [53] and dislocation [54] could also alter the potential pinning site density. This could, subsequently, affect MBN signals. Having said that, it seems that the theta (θ) parameter is overall independent of all these interconnected microstructural changes (which normally happen during tempering) and appears to be solely a function of stress level.
Conclusion
Flux-controlled MBN measurements showed decreasing response with tempering time in Q1N samples, prepared by tempering at 525°C for 48, 96, 136 and 336 h, respectively. Greater tempering time reduces pinning site density in the matrix (grains) of Q1N steel, which in turn results in reduced MBN signal. This behaviour is attributed primarily to reduced interaction of 180° domain walls with a decrease in available pinning sites within the steel grains (matrix).
MBN energy increased with stress along the rolling direction (RD) and decreased along the transverse direction (TD) for the five samples examined (before and after tempering), but the rate with increasing flux density became lower with increased tempering time. Results were interpreted in terms of the increase of 180° domain walls in the direction of uniaxial tensile stress, which increases the MBN signal. The parameter θ, defined as the ratio of MBN energy in the RD to that in TD, at 0.3 T was strongly correlated with applied uniaxial stress level. It represents higher sensitivity to stress and independence of the degree of tempering (pinning site density) of Q1N samples. This result has implications for the determination of the presence of uniaxial tensile residual stress in Q1N steel independent of microstructural changes during high-temperature service of Q1N steel components.
Footnotes
Disclosure statement
No potential conflict of interest was reported by the author(s).