
Abstract
Present study deals with the comparative wear and corrosion behaviour of electrodeposited Ni-W-Ti3C2Tx composite coatings. The composite coatings were prepared by direct current electrodeposition method in bath with different amounts of Ti3C2Tx. Reciprocating friction was used to analyse the wear behaviour of the coating. The corrosion resistance of all coatings was examined by potential polarisation and electrochemical impedance spectroscopy. The results show that the wear rate and friction coefficient are the lowest for Ni-W-20Ti3C2Tx composite coating among all the coatings, which is attributed to the lubrication effect of Ti3C2Tx. Moreover, the Ti3C2Tx can effectively improve the corrosion resistance of Ni-W alloy coating, and the optimum addition of 20 mg/L is reached, which is determined by Ni (111) texture and surface quality.
Introduction
At present, surface treatment technology has been used in many fields [1-3], electrodeposition is widely used in surface treatment because of its low cost and simple operation. It is also an important method to prepare metal matrix composites with excellent wear resistance and corrosion resistance. The Ni-W alloy coating has good mechanical properties, excellent tribological properties and corrosion resistance. Wasekar et al. [4,5] manipulated the tungsten content and grain size to obtain Ni-W coatings with excellent corrosion resistance and wear resistance. Because of these excellent performance, it serves as an ideal substitute for hard chromium coatings and is widely used in harsh environments [6-9]. However, pure Ni-W alloy coatings have difficulty in adapting to complex environments. Therefore, the modification of pure Ni-W alloy coatings becomes extremely important. An important method to prepare composite coatings with excellent properties is the addition of nanoparticles [10-14]. The nanoparticles affect the microstructure of the Ni-W matrix composite coating, including the grain size, texture and internal stress. In recent years, various particles have been added to Ni-W alloy coatings, e.g. Ni-W-SiC [15], Ni-W-GO [16], Ni-W-Al2O3 [17] and Ni-W-TiO2 [18] composite coatings have been successfully prepared and have good properties.
Mxenes, which compose an emerging family of two-dimensional layered materials, are transition metal carbides and nitrides. They are usually obtained by the selective etching of ternaries of carbides or nitride compounds with hydrofluoric acid. Due to their graphene-like structure, Mxenes have attracted great attention and have been widely used in energy storage, electromagnetic shielding, lubrication and other fields [19-23]. Naguib et al. [19] first produced Ti3C2Tx (T = OH and F) by etching Al from Ti3AlC2 in concentrated HF. Sinnott et al. [24] predicted that by calculation and research the coefficient of friction (COF) was 0.24–0.27 for Ti3C2Tx with a normal load of less than 1.2 GPa. Murat et al. [25] used the first principles to calculate that the elastic moduli of Ti3C2Tx was approximately 300 GPa. Furthermore, Ti3C2Tx has good stability and electrical properties [26-30]. Due to its excellent physical and chemical properties, Ti3C2Tx has been widely applied in composite materials. In recent years, it has been found that Ti3C2Tx can significantly improve the mechanical properties of materials by combining with many polymer materials (such as PVA [31], PDDA [31], PEI [32] and UHMWPE [33]). Zhang et al. [33] found that the tensile strength, fracture strength, creep properties and friction reduction properties of Ti3C2/UHMWPE nanocomposites were significantly improved. Nie et al. [34] hybridised two-dimensional MXene (Ti3C2) sheets with the γ-glycidoxypropyl trimethoxysilane (γ-GPS) film on AA2024 aluminium alloy surface to improve the anticorrosion property. The Ti3C2Tx/silane composite designed by Cao et al. greatly improves the corrosion performance through the protective effect of Ti3C2Tx [35]. The disadvantages of polymer materials are insecure and poor wear resistance, Ti3C2Tx-doped metal matrix composites can avoid these problems and the electrodeposition method can make it more widely used in industry. It is reasonable to believe that the properties of Ti3C2Tx can also bring potential applications of metal matrix composites in the fields of wear resistance and corrosion resistance. However, there are few reports on the fabrication and characterisation of Ti3C2Tx-doped metal matrix composites.
In this work, Ni-W-Ti3C2Tx composite coatings with a low amount of Ti3C2Tx addition were first designed and synthesised by composite electrodeposition. Then, the relationships between the properties and structures of the Ni-W-Ti3C2Tx coatings were studied.
Experiment
Preparation of the Ti3C2Tx nanosheets and Ni-W-Ti3C2Tx composite coatings
With magnetic stirring, Ti3AlC2 (Figure 1(a)) was etched by self-prepared HF (10 M HCl + 2 M LiF) at 40 °C for 24 h, and a 3-g/L Ti3C2Tx suspension was obtained by centrifugation to prepare the composite coatings. The Ti3C2Tx nanosheets obtained by freeze-drying exhibit the morphology of a 2D material, as shown in Figure 1(b). Under DC power supplying and magnetic stirring, Ti3C2Tx, Ni+ and WO42− compound formed a Ni-W-Ti3C2Tx coating. The specific schematic diagram is shown in Figure 1(c).
(a) SEM images of the typical morphologies of Ti3AlC2; (b) SEM images of the typical morphologies of Ti3C2Tx; (c) schematic diagram of the electrodeposition mechanism.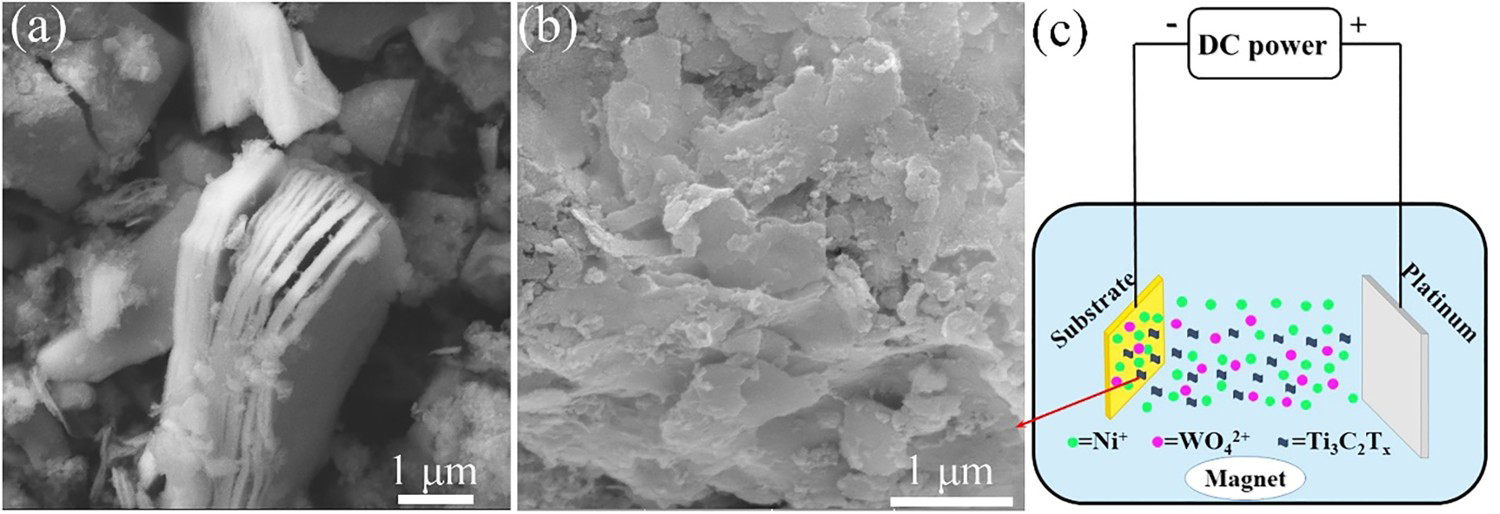
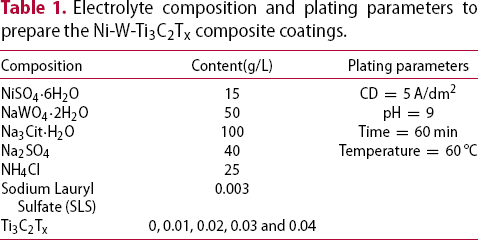
Electrolyte composition and plating parameters to prepare the Ni-W-Ti3C2Tx composite coatings.
Characterisation of the Ni-W-Ti3C2Tx composite coatings
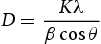
X-ray diffractometer (X'Pert PRO PANalytical) with Cu-Kα radiation source (40 kV, 40 mA) was used to identify the phases of all the coatings. The scanning rate was 5° per minute in the 2θ range of 10–90°. The crystallite diameter of all the coatings was calculated by using the Debye-Scherrer formula from the X-ray diffraction spectrum. The calculation formula is as follows:
 is the grain size,
  is Scherer constant (typical value is 0.89),
  is the incident radiation of Cu (1.5418 Å),
  is the full-width half-maximum (FWHM) and
  is the diffraction angle.
The morphologies and compositions of all the coatings were measured by field-emission scanning electron microscopy (FESEM, MIRA3 LMH) with energy dispersive spectroscopy (EDS). The acceleration voltage selected by EDS was 20 keV, the beam spot size was approximately 4.44 nm, the emission current was 2 × 10⁻⁴ A and the dwell time was 1 × 10⁻⁵ s. Cross-sections of the coated samples were also analysed to clarify the effect of the Ti3C2Tx additive on the coating thickness. For repeatability, each test was performed on multiple areas of the sample. The corrosion products after electrochemical corrosion and immersion corrosion were analysed by X-ray photoelectron spectroscopy (XPS, Thermo Scientific K-Alpha) measurements and FESEM.
The microhardness of the Ni-W-Ti3C2Tx composite coatings under a 0.49-N load for 10 s was measured by a Vickers hardness tester (HV-1000). The microhardness is the average value of each sample in five different areas. The tribology of the composite coating was studied using a universal microtribotester (UMT-2). The friction dual ball was an Si3N4 ball with a diameter of 10 mm. Under the load of 3N, the reciprocating friction velocity was 25 mm/s, the reciprocating friction distance was 5 mm and the sliding motion was 60 min. The surface morphology and profile of the specimen after wear were observed via FESEM and confocal laser scanning microscopy (CLSM).
The electrochemical behaviour of the composite coating in 3.5 wt. % NaCl solution was tested using a CHI-760E electrochemical system. The working electrode, counter electrode and reference electrode are the composite coating, platinum electrode and saturated calomel electrode (SCE), respectively. Before the experiment, the electroplating sample was soaked in the electrolyte for 1000 s to obtain a steady open circuit potential (EOCP). The corresponding corrosion current density and potential were collected from the galvanic potential polarisation curve in the sweeping range of −1 to 1 V. Electrochemical impedance spectroscopy (EIS) was measured on an EOCP with an AC amplitude of 5 mV in the frequency range of 100 kHz to 10 MHz.
Results and discussion
Microstructure and morphology of the Ni-W-Ti3C2Tx composite coatings
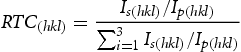
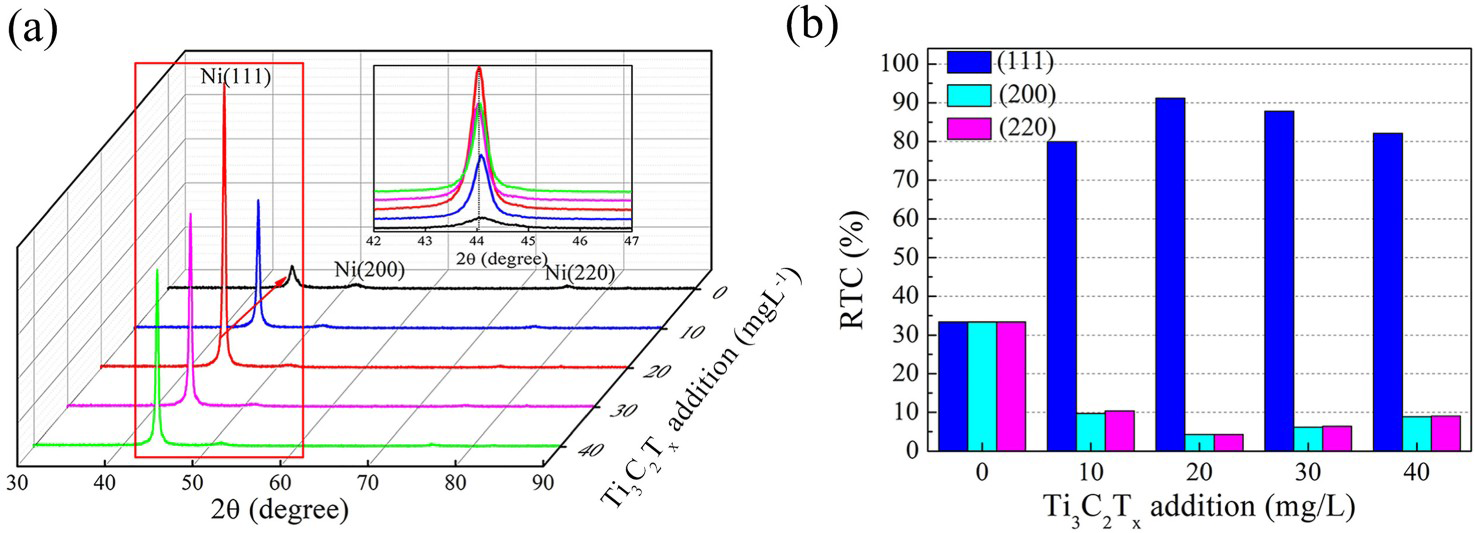
Figure 2 shows the XRD profiles of all the coatings. The relative texture coefficient (a) X-ray diffraction profiles of the Ni-W-Ti3C2Tx composite coatings with various additions of Ti3C2Tx; (b) RTC of the hkl planes in all the coatings. was calculated by evaluating the orientation mass as follows:
 and
and  are the diffraction intensities of the (hkl) plane, which correspond to the Ni-W-Ti3C2Tx and Ni-W coatings, respectively.
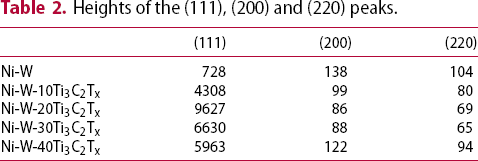
Heights of the (111), (200) and (220) peaks.
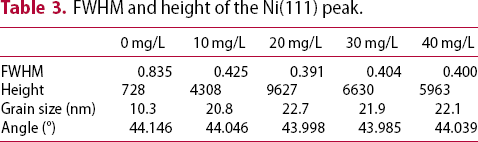
FWHM and height of the Ni(111) peak.
As shown in Figure 2(b),  of the Ni-W coating was 33.33%, which represents the free orientation of the coating. The Ni-W-Ti3C2Tx coating had a much larger
  than the Ni-W alloy coating. Furthermore,
  first increased and subsequently decreased, which indicates that the addition of Ti3C2Tx made the Ni-W-Ti3C2Tx composite coating have a strong (111) fibre texture. The texture of thin films and coating materials is usually strongly controlled by their surface energies [36]. For fcc metals, the (111) texture is generally formed because it is a dense arrangement with the lowest surface energy compared to other textures. Thus, the addition of Ti3C2Tx may minimise the surface energy. Additionally, the Ti3C2Tx lattice can adsorb Ni atoms. When the maximum number of Ni atoms is adsorbed, they naturally appear in a dense arrangement. Although there was a slight mismatch in lattice constants, it was easy to observe this densely arranged structure during the deposition process, which inevitably caused the selective growth of crystal surfaces during metal growth. Therefore, Ti3C2Tx can promote Ni atoms to form a similar line in the structure, which provides a basis for the subsequent deposition of Ni atoms to suppress the (111) surface structure. Since the (111) plane was formed by electrodeposition, excess Ti3C2Tx agglomerated, and the closure of Ti3C2Tx nanocrystals affected the growth of the metal matrix; thus, the preferred growth was weakened.
The SEM analysis of the as-obtained Ni-W coatings without Ti3C2Tx nanosheets shows that the microstructure of the coating was nodular (see Figure 3(a)). All the coatings had crystal structures, and there are obvious diffraction peaks in the XRD pattern, which indicates that the addition of Ti3C2Tx did not affect the crystal structure of the coating. In contrast, the coatings containing Ti3C2Tx showed uniform and smooth surfaces (Figure 3(b,d)). Additionally, Ti3C2Tx exhibited a uniform distribution. The coating with 20 mg/L Ti3C2Tx had larger grain sizes than those with 0 and 40 mg/L Ti3C2Tx. The high magnification of the Ni-W-20Ti3C2Tx deposit and EDS spectrum of the appointed area are shown in Figure 3(c,f). The surface of the Ni-W-40Ti3C2Tx sample had nanosheet agglomeration, which is typical of Ti3C2Tx. The Ti3C2Tx nanosheets of the Ni-W-20Ti3C2Tx composite coatings were uniformly distributed, but the content was low.
Surface micrographs of the composite coatings: (a) Ni-W; (b) Ni-W-20Ti3C2Tx; (c) higher magnification of (b); (d) Ni-W-40Ti3C2Tx; (e) higher magnification of (d); (f) EDS spectrum of the appointed area in (c).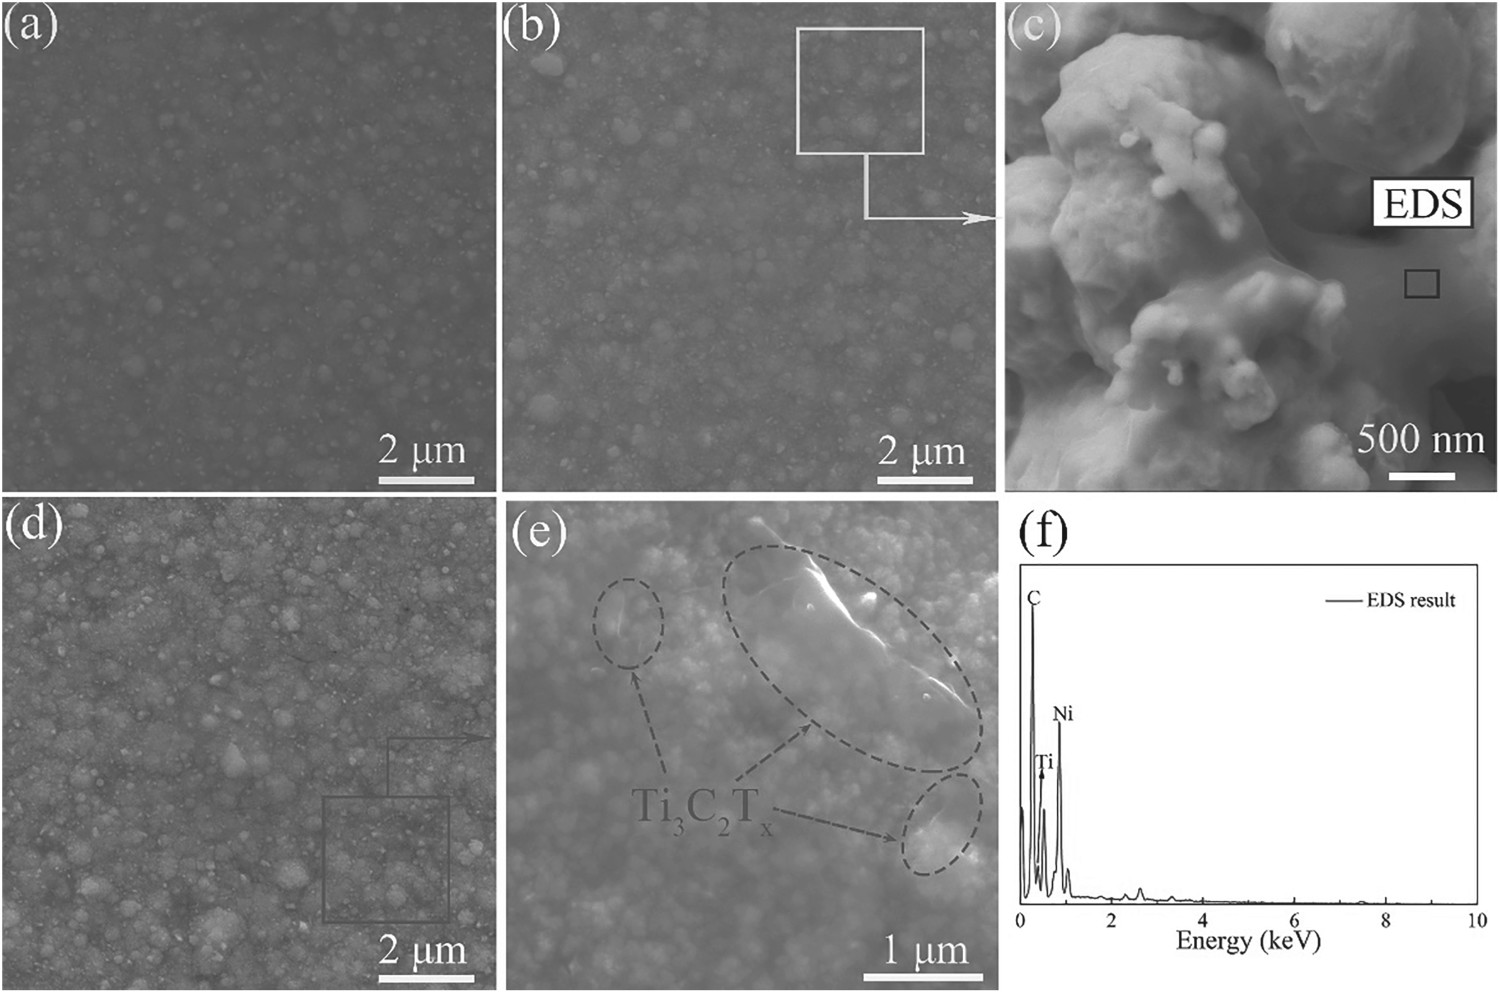
Figure 4 shows the cross-sectional morphology and linear EDS results of all deposits. The analysis shows that the interface between all the coatings and substrates was clear and tightly bonded. The coating thickness shows that the addition of an appropriate amount of Ti3C2Tx had no negative impact on the deposition efficiency. When more than 40 mg/L Ti3C2Tx was added, the coating thickness decreased due to the negative impact of Ti3C2Tx agglomeration on the electrodeposition efficiency, which indicates a particle saturation limit in the bath. Furthermore, the linear EDS analysis implies that Ni and W were the main elements in the Ni-W-Ti3C2Tx coatings.
SEM images of the cross-section and linear EDS of all the coatings: (a) Ni-W, (b) Ni-W-10Ti3C2Tx, (c) Ni-W-20Ti3C2Tx, (d) Ni-W-30Ti3C2Tx and (e) Ni-W-40Ti3C2Tx.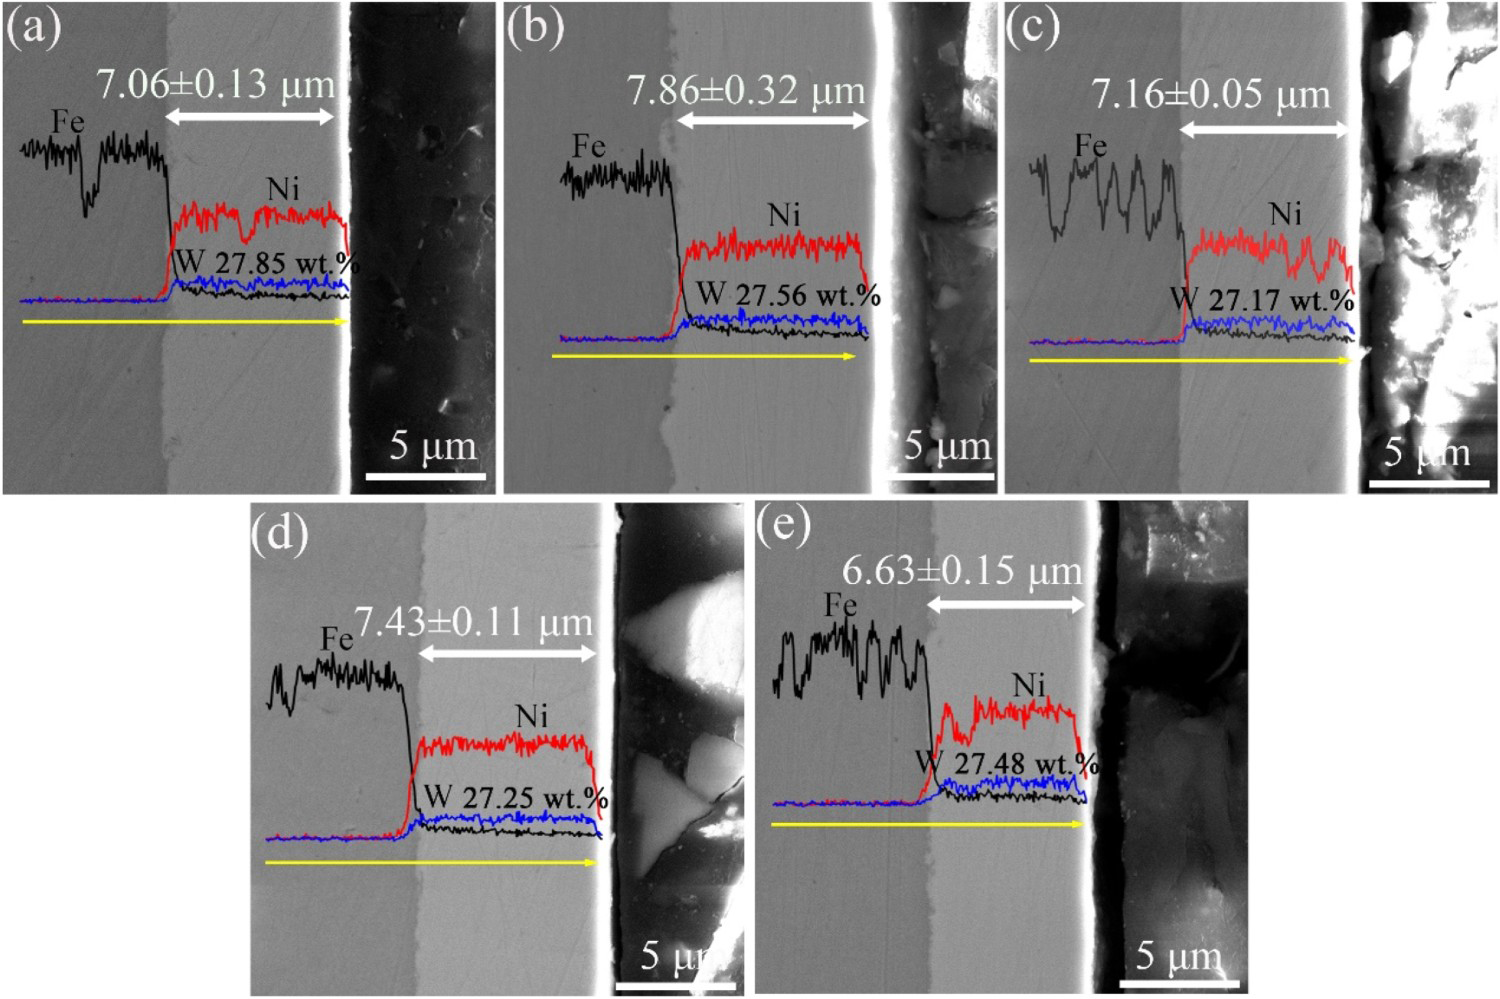
Effect of the Ti3C2Tx addition on the hardness
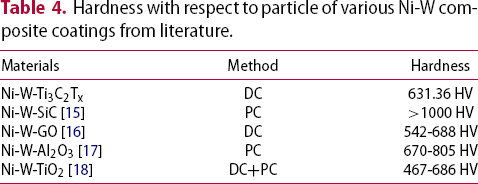
The effect of the Ti3C2Tx addition on the hardness of all the coatings is shown in Figure 5. Compared to the coating without Ti3C2Tx, adding Ti3C2Tx can significantly improve the microhardness of the deposit. In detail, the microhardness of the Ni-W-Ti3C2Tx sample was 631.36 HV, when the addition amount was 20 mg/L. The nucleation and growth kinetics of the Ni-W matrix were changed by adding different amounts of Ti3C2Tx nanosheets into the Ni-W matrix; this addition was expected to cause lattice distortion and increase the hardness of the matrix. The hard particles in the matrix are usually beneficial to improve the overall microhardness of the composites [37]. As a hard phase, Ti3C2Tx was added into the alloy coating to prevent the dislocation slip and achieve dispersion strengthening. However, when the addition amount of Ti3C2Tx was too high, some agglomeration might occur and affect the deposition efficiency, which reduced the combination between Ti3C2Tx and the matrix metal, and consequently reduced the microhardness, Singh et al. prepared the Ni-TiC composite coating to have the similar situation [37]. The hardness data shown in Table 4 are related to the addition of various inert particles to Ni-W alloy coatings. It can be observed that these composite coatings usually have hardness values ranging from 500 to 1000 HV. For better wear resistance, the hardness of the coating is best in the 600–1000 HV range, which corresponds to the hardness of a typical hard chromium coating. Although the addition of Ti3C2Tx has no outstanding strengthening effect, its two-dimensional structure has an important effect on the composite coating.
Microhardness of the Ni-W-Ti3C2Tx composite coatings Hardness with respect to particle of various Ni-W composite coatings from literature.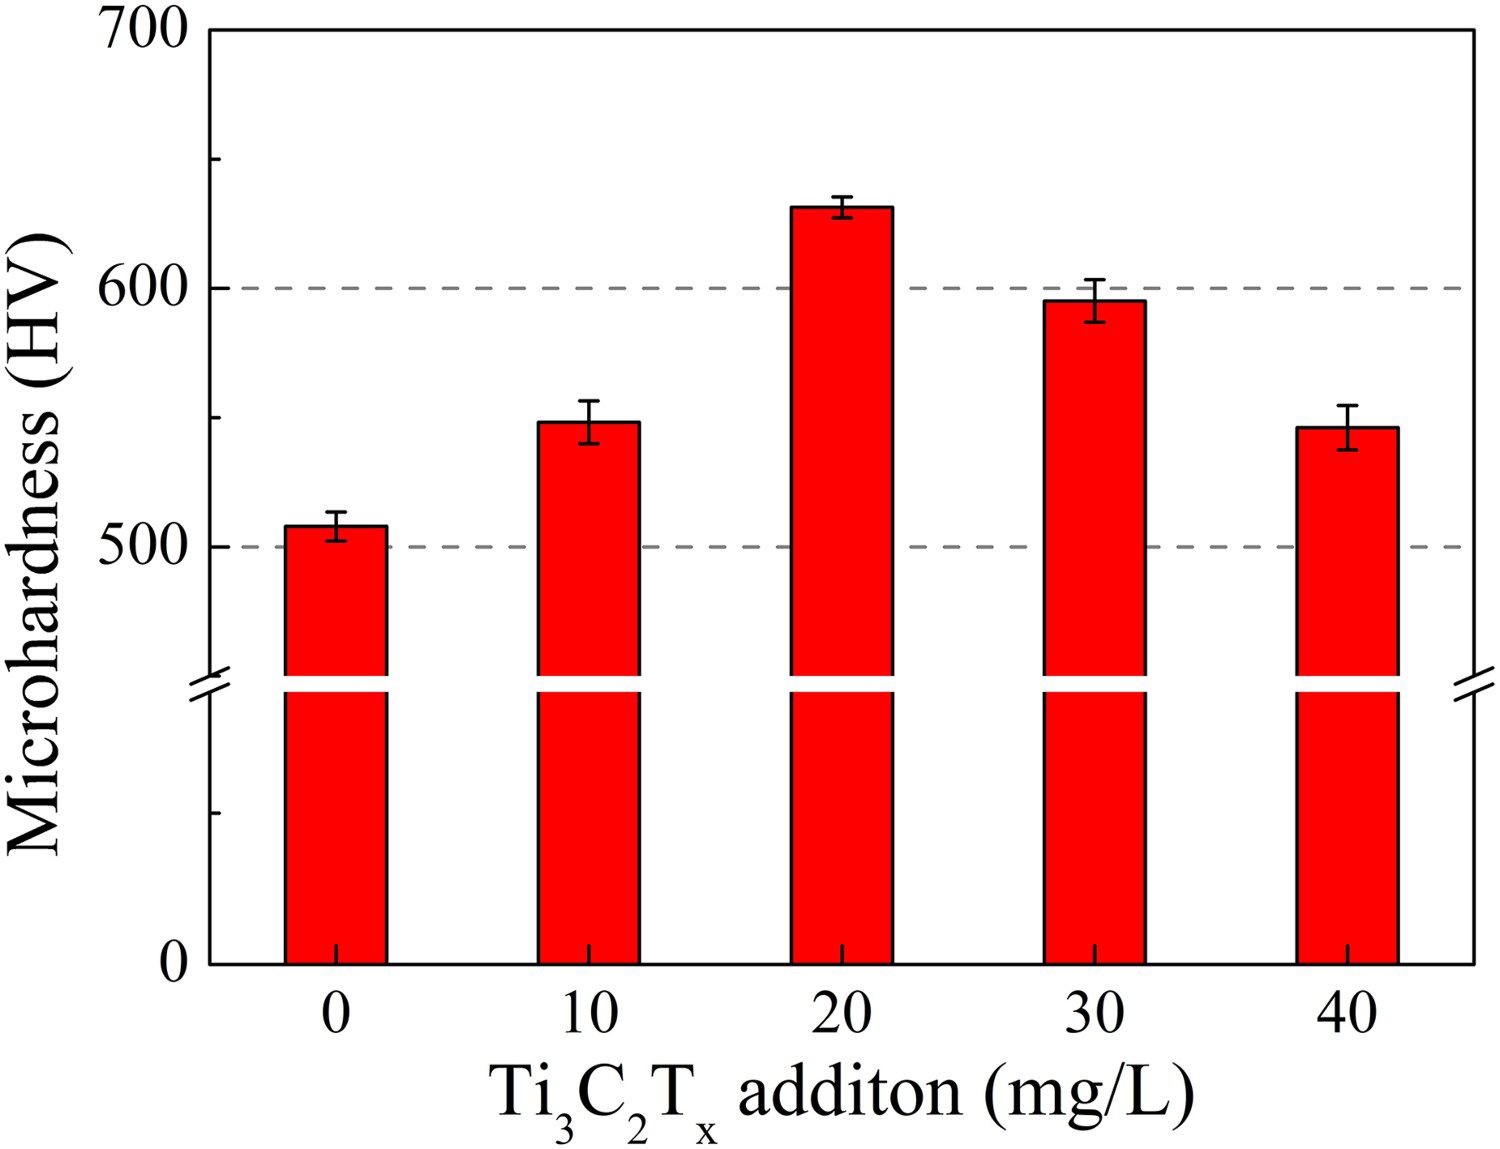
Tribological performances of the Ni-W-Ti3C2Tx composite coatings
Figure 6 shows the COF curve and average COF of all the coatings under a 3-N load at 25 °C. In the beginning, the COF of all the coatings was low. After 10 min, the COF of the coating remained relatively stable until the end of the test. Figure 6 shows that the addition of Ti3C2Tx could effectively reduce the COF of the coating. Figure 6(a) shows that the Ni-W coating had the largest COF, while the composite coating prepared by adding 20 mg/L Ti3C2Tx had the smallest COF. The wear rate of all coatings are shown in Figure 6(c). Ni-W alloy coatings have the highest wear rate of 2.293 × 10⁻⁶•mm3•N−1•m−1. The Ni-W-Ti3C2Tx composite coatings with 20 mg/L Ti3C2Tx addition has the lowest wear rate (0.865 × 10⁻⁶•mm3•N−1•m−1), which is only 37.72% that of Ni-W alloy coating.
COF of all the composite coatings: (a) COF curve, (b) average COF and (c) Wear rate.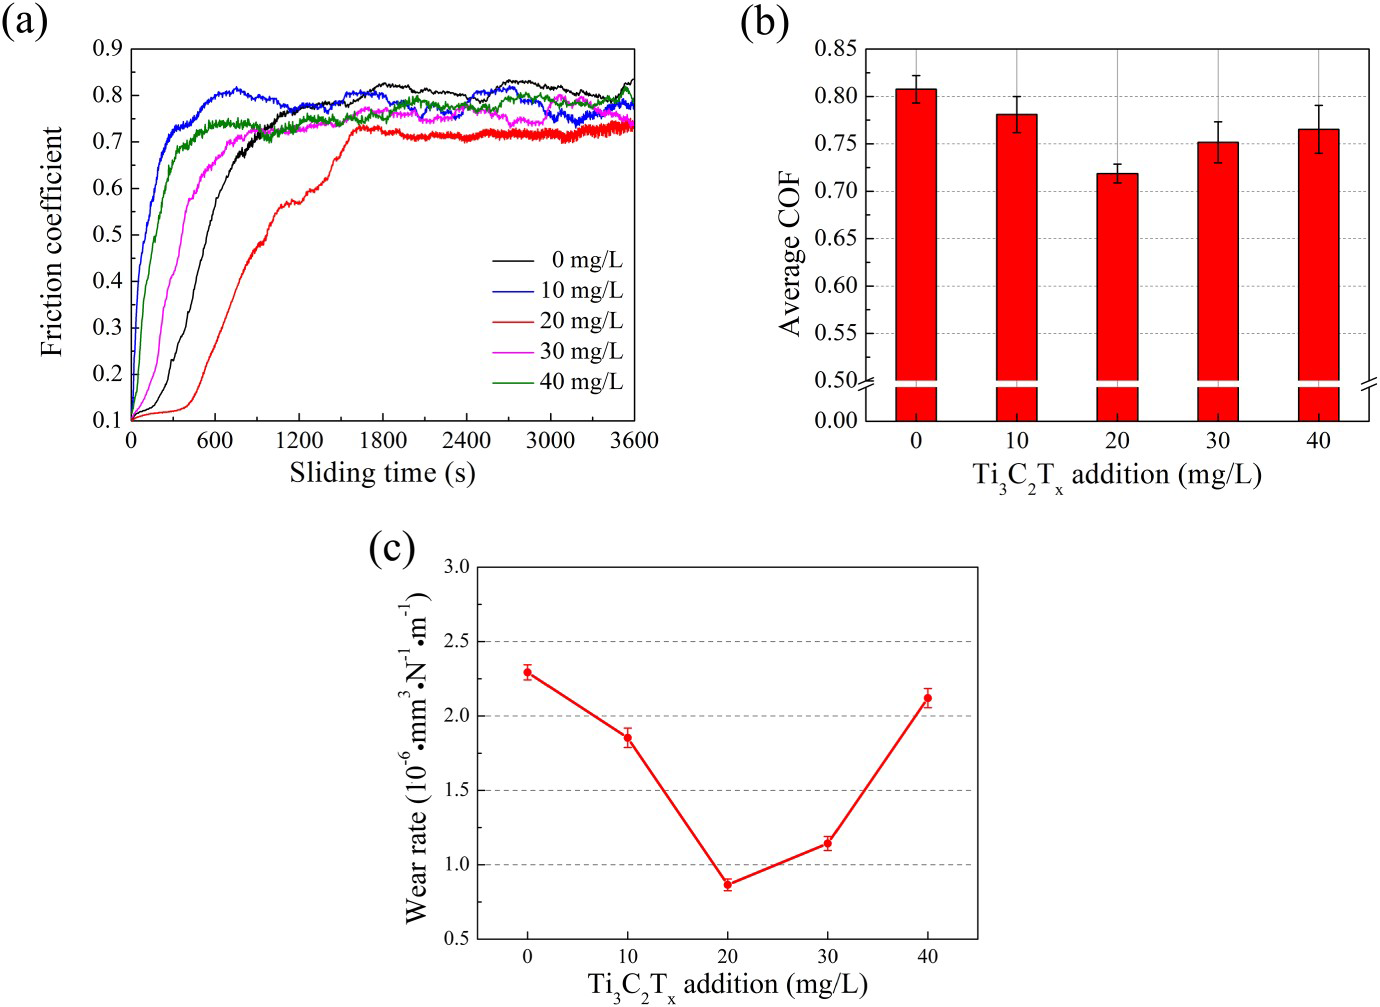
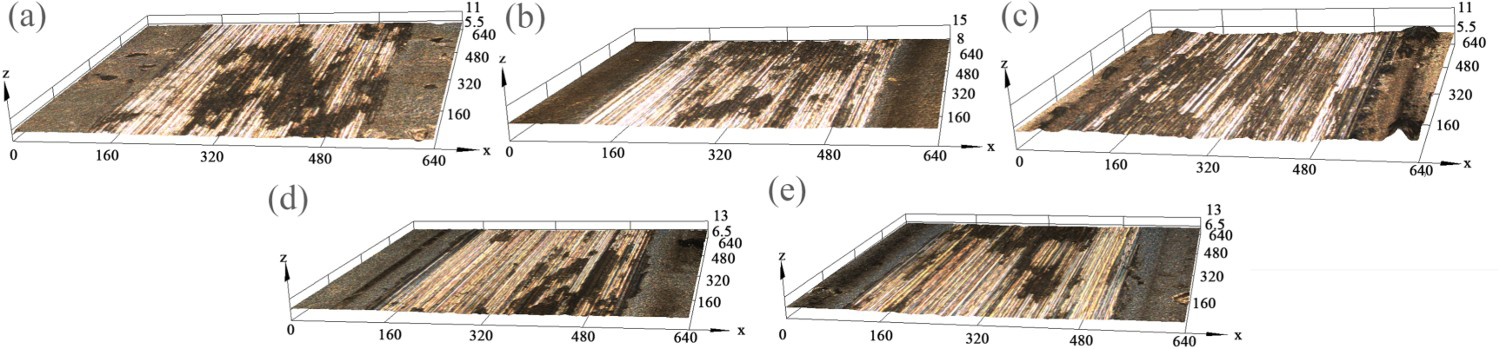
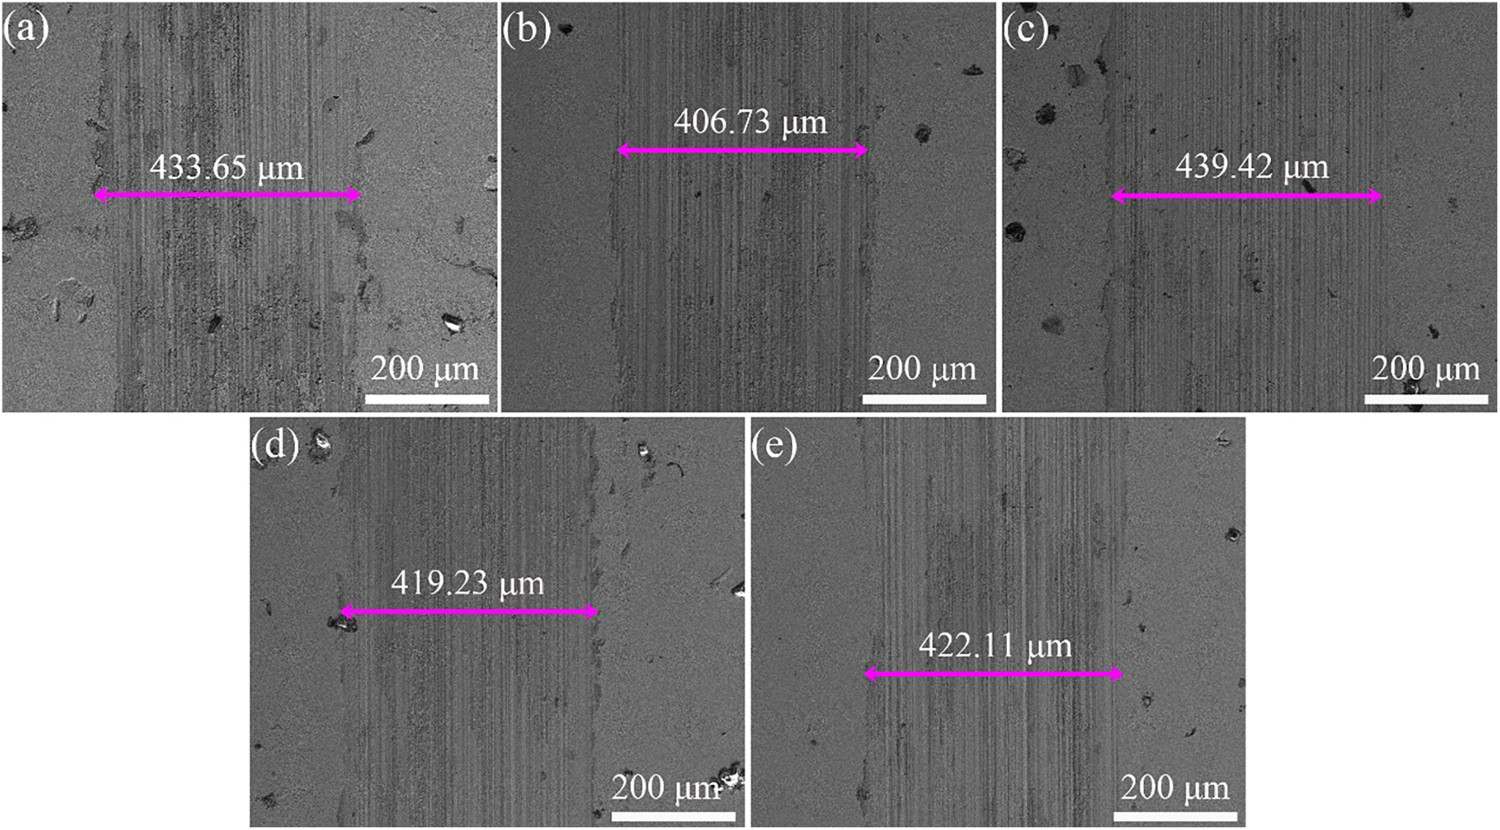
To further reveal the wear condition, the morphologies of the 2D and 3D wear marks are shown in Figures 7 and 8, respectively. Under identical experimental conditions, the widths of the grinding cracks on all the coatings were approximately identical. However, Figure 10(a) shows obvious cracks and many chips on the worn surface of the Ni-W deposit. The addition of Ti3C2Tx improved the deposition, especially the worn surface of the Ni-W-20Ti3C2Tx and Ni-W-30Ti3C2Tx deposits, which contained little wear debris and showed a shallow groove (Figures 9 and 10).
Profile of the wear track on all the coatings. 3D profiles of the wear track on all the coatings: (a) Ni-W, (b) Ni-W-10Ti3C2Tx, (c) Ni-W-20Ti3C2Tx, (d) Ni-W-30Ti3C2Tx, and (e) Ni-W-40Ti3C2Tx. SEM images of the worn surface morphologies of all the coatings: (a) 0 mg/L, (b) 10 mg/L, (c) 20 mg/L, (d) 30 mg/L, and (e) 40 mg/L. Morphology of the wear track on all the coatings: (a) 0 mg/L, (b) 10 mg/L, (c) 20 mg/L, (d) 30 mg/L, and (e) 40 mg/L.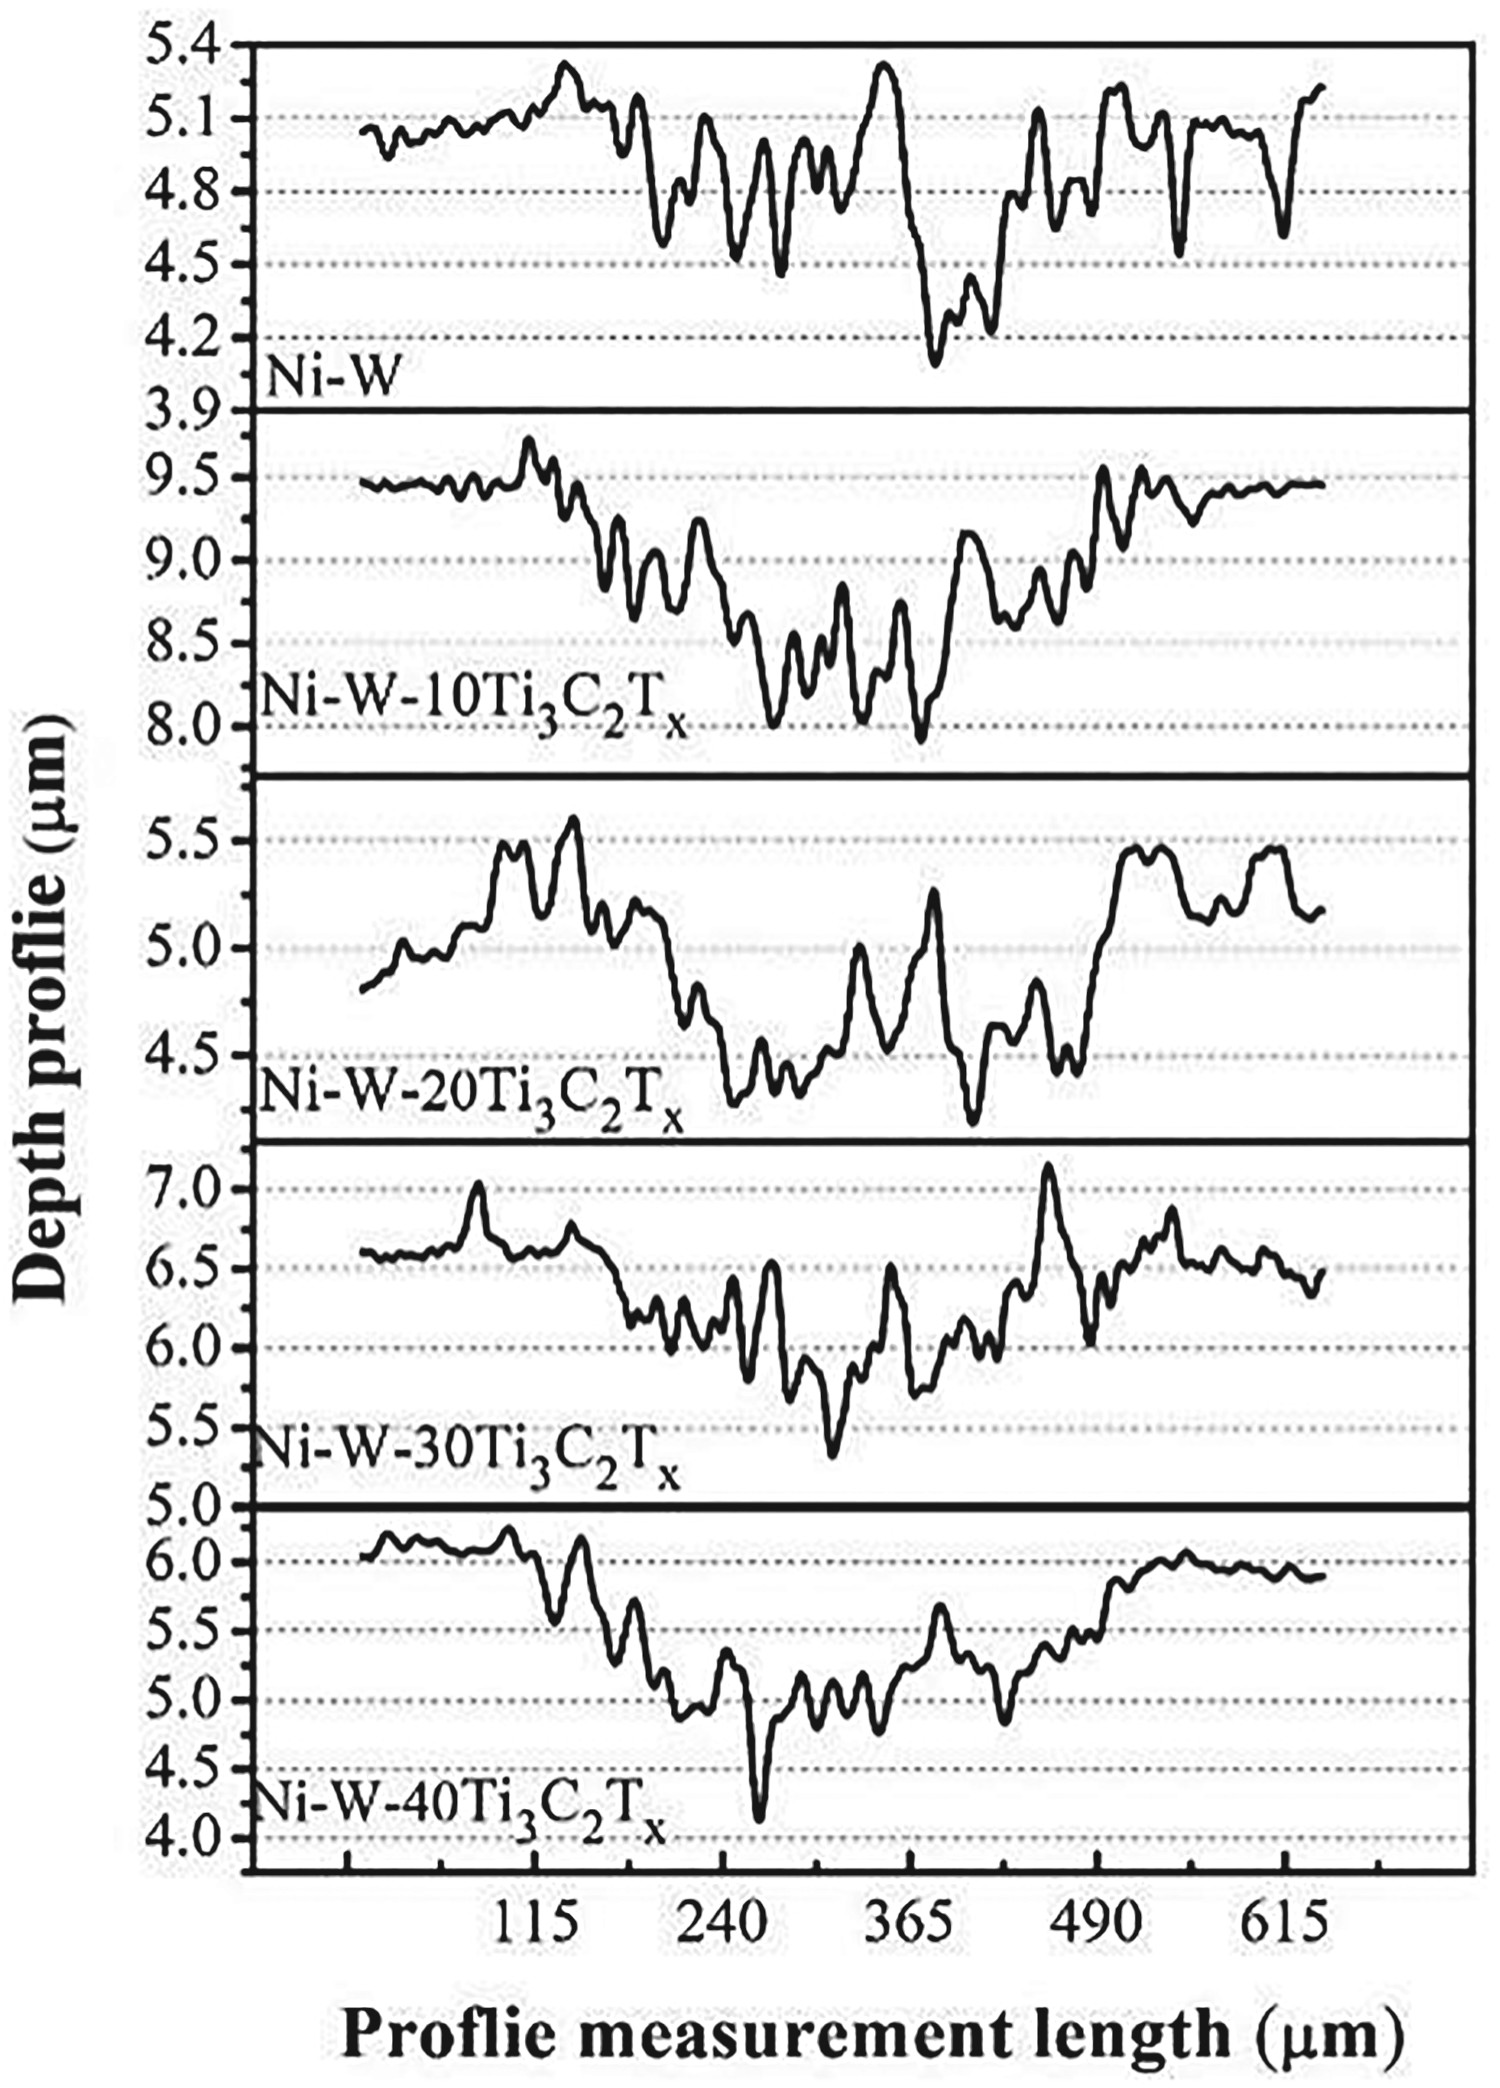
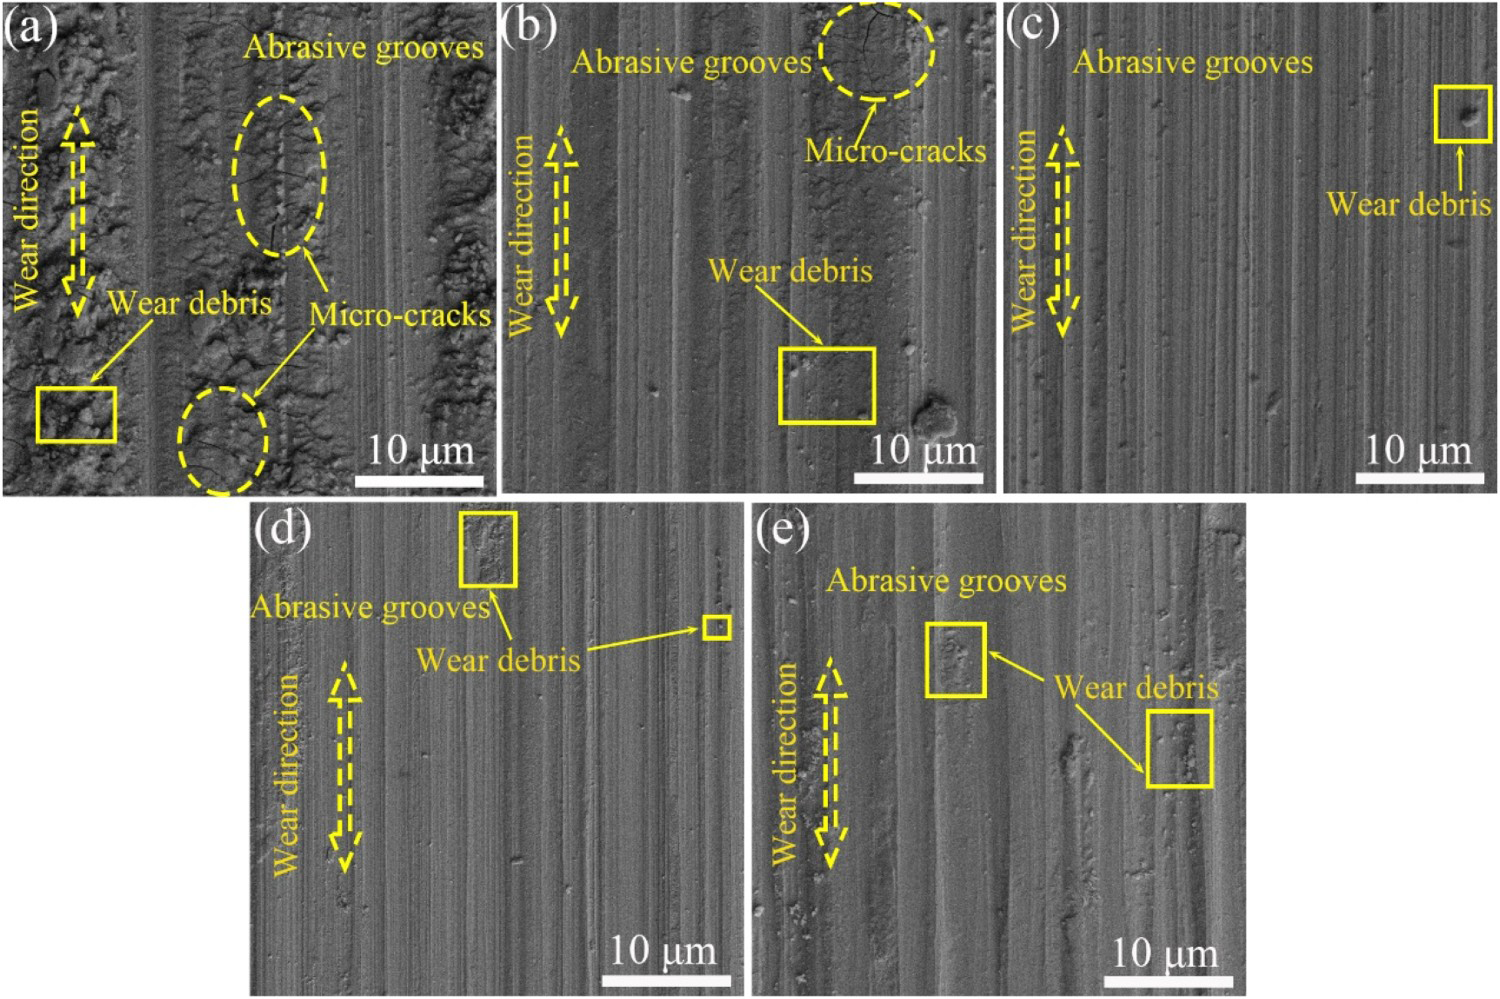
The above analysis shows that the dominant abrasion mechanisms were adhesive. Ti3C2Tx has the excellent wearability and self-lubrication. Ti3C2Tx plays the role of solid lubricant in the separation from the matrix and reduces the direct contact between the friction pair and the matrix, which decreases the COF. Additionally, the embedded Ti3C2Tx in the Ni-W coating can provide a second-phase enhancement to harden the coating. According to Archard theory, the tribological property of composites is proportional to the hardness [38]. In conclusion, the addition of Ti3C2Tx can provide the composite coating with excellent wear resistance and good self-lubricating effect.
Corrosion behaviour of composite coatings
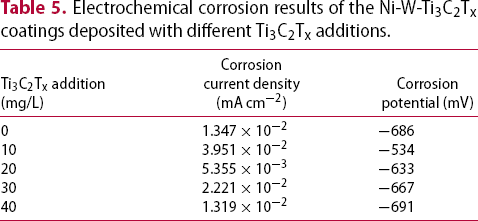
Nyquist and polarisation curves were used to evaluate the effect of Ti3C2Tx on the corrosion performance of all deposits. The Tafel patterns of all deposits in the 3.5 wt.% NaCl solution are shown in Figure 11(a). The similarity of the potentiodynamic polarization (PDP) curves of the two deposits indicates the same corrosion protection mechanism. The deposits (the Ti3C2Tx addition is 10, 20 and 30 mg/L) had higher corrosion potential than those without Ti3C2Tx but lower corrosion potential than the composite coating with a higher Ti3C2Tx content (40 mg/L) due to the agglomeration of Ti3C2Tx. Therefore, the information in Table 5 confirms that the minimum corrosion current density (5.355 × 10⁻³ mA/cm2) of the Ni-W-20Ti3C2Tx deposit indicates good corrosion resistance.
(a) PDP, (b) EIS and (c) Bode curves of all the coatings in a 3.5 wt.% NaCl solution. Electrochemical corrosion results of the Ni-W-Ti3C2Tx coatings deposited with different Ti3C2Tx additions.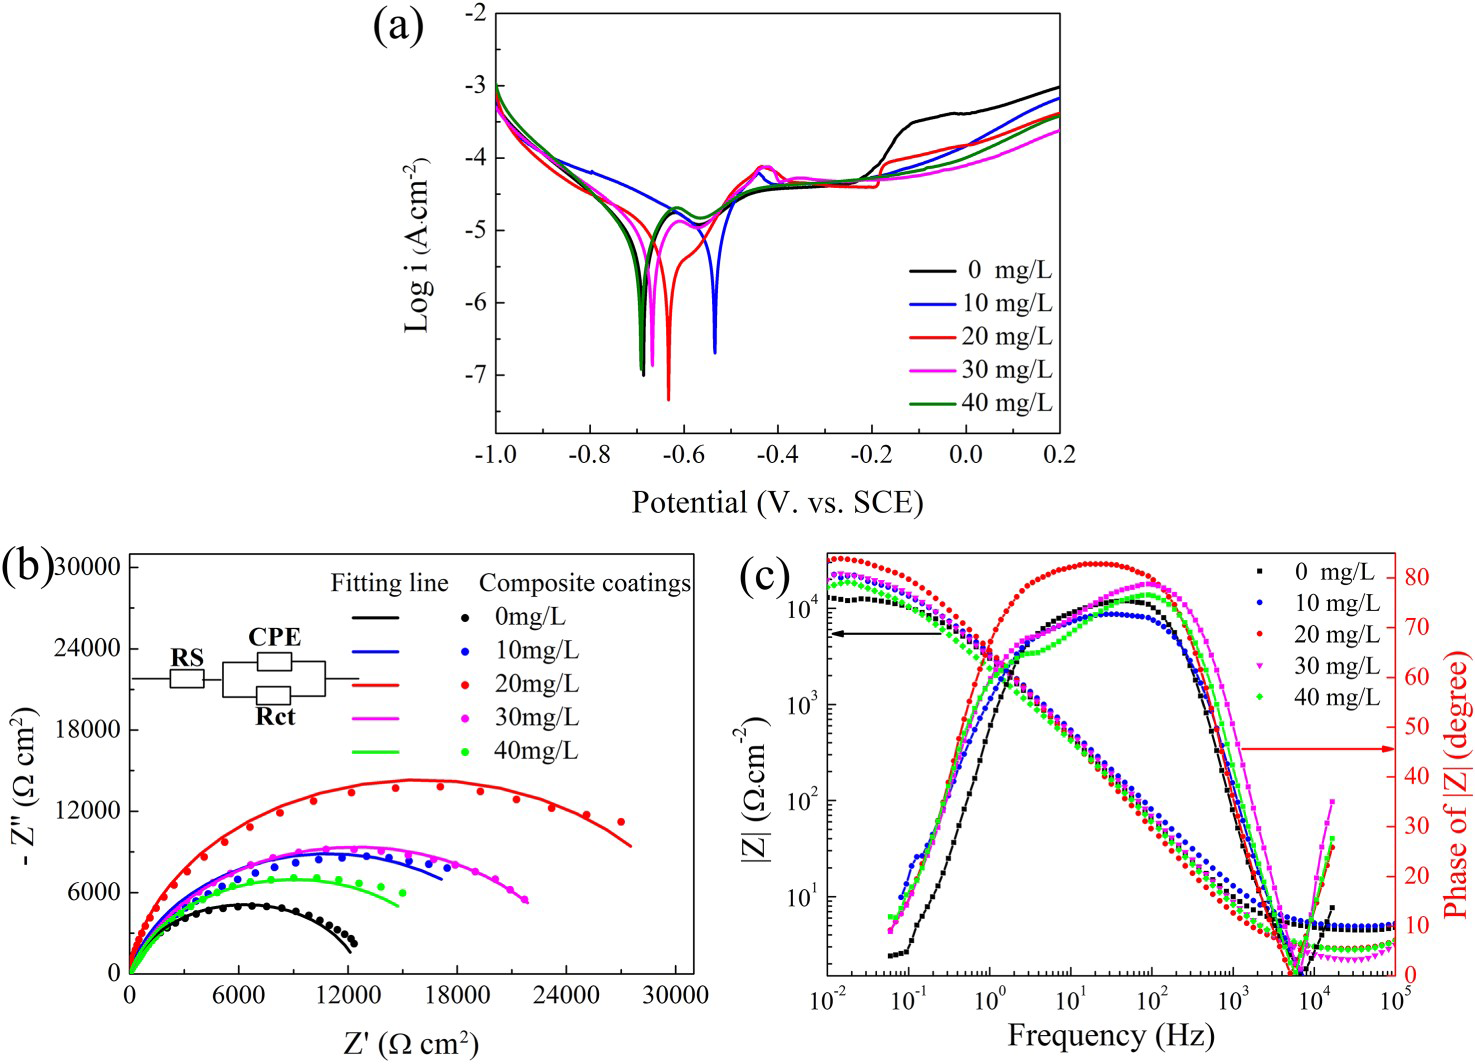

 is the CPE index,
  is the admittance constant, and
  is the imaginary corner frequency
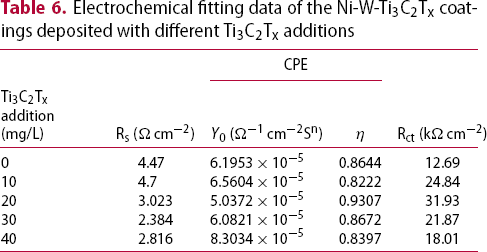
  . When the Ti3C2Tx addition increased from 0 to 20 mg/L, Rct significantly increased from 12.69 to 31.93 kΩ cm2, while
  increased from 0.8644 to 0.9307, which indicates the enhanced corrosion resistance. Furthermore, in the phase angle diagram (Figure 11(c)), the Ni-W-20Ti3C2Tx deposit showed a wider platform in the high to medium frequency range. The phase angle of Ni-W-20Ti3C2Tx deposit increased significantly, which indicated that the deposits exhibited a smaller capacitance value. These results indicate that the Ni-W-20Ti3C2Tx deposit gave a much better corrosion resistance than other coatings.
Electrochemical fitting data of the Ni-W-Ti3C2Tx coatings deposited with different Ti3C2Tx additions

SEM and EDS were used to clearly analyse the corrosion products of the deposits. The microstructures of the Ni-W, Ni-W-20Ti3C2Tx and Ni-W-40Ti3C2Tx deposits after polarisation in 3.5 wt.% NaCl electrolyte were recorded (Figure 12). The main morphological feature of the Ni-W coating was the uneven local corrosion. Corrosion might start from pitting, which made the corrosion uneven and produces defects in the corrosion product film. Due to the precipitation of hydrogen, the uneven surface could be the dominating cause of pitting corrosion, and it easily dissolved during pitting corrosion. Thus, the corrosion products would continue to penetrate and spread. In the Ni-W-20Ti3C2Tx composite coating, fewer corrosion pits were observed. The composition analysis of the corrosion pits shows that the Ni-W deposit and Ni-W-40Ti3C2Tx deposit were electrochemically corroded to the bare substrate, while the main composition of the Ni-W-20Ti3C2Tx composite coating was nickel and tungsten. This result indicates that the passivation film formed by the Ni-W-20Ti3C2Tx composite coating was uniform and compact.
Surface morphologies of Ni-W (a), Ni-W-20Ti3C2Tx (d) and Ni-W-40Ti3C2Tx (e). The corresponding EDS results (h) in the embedded table contain the EDS results (wt.%).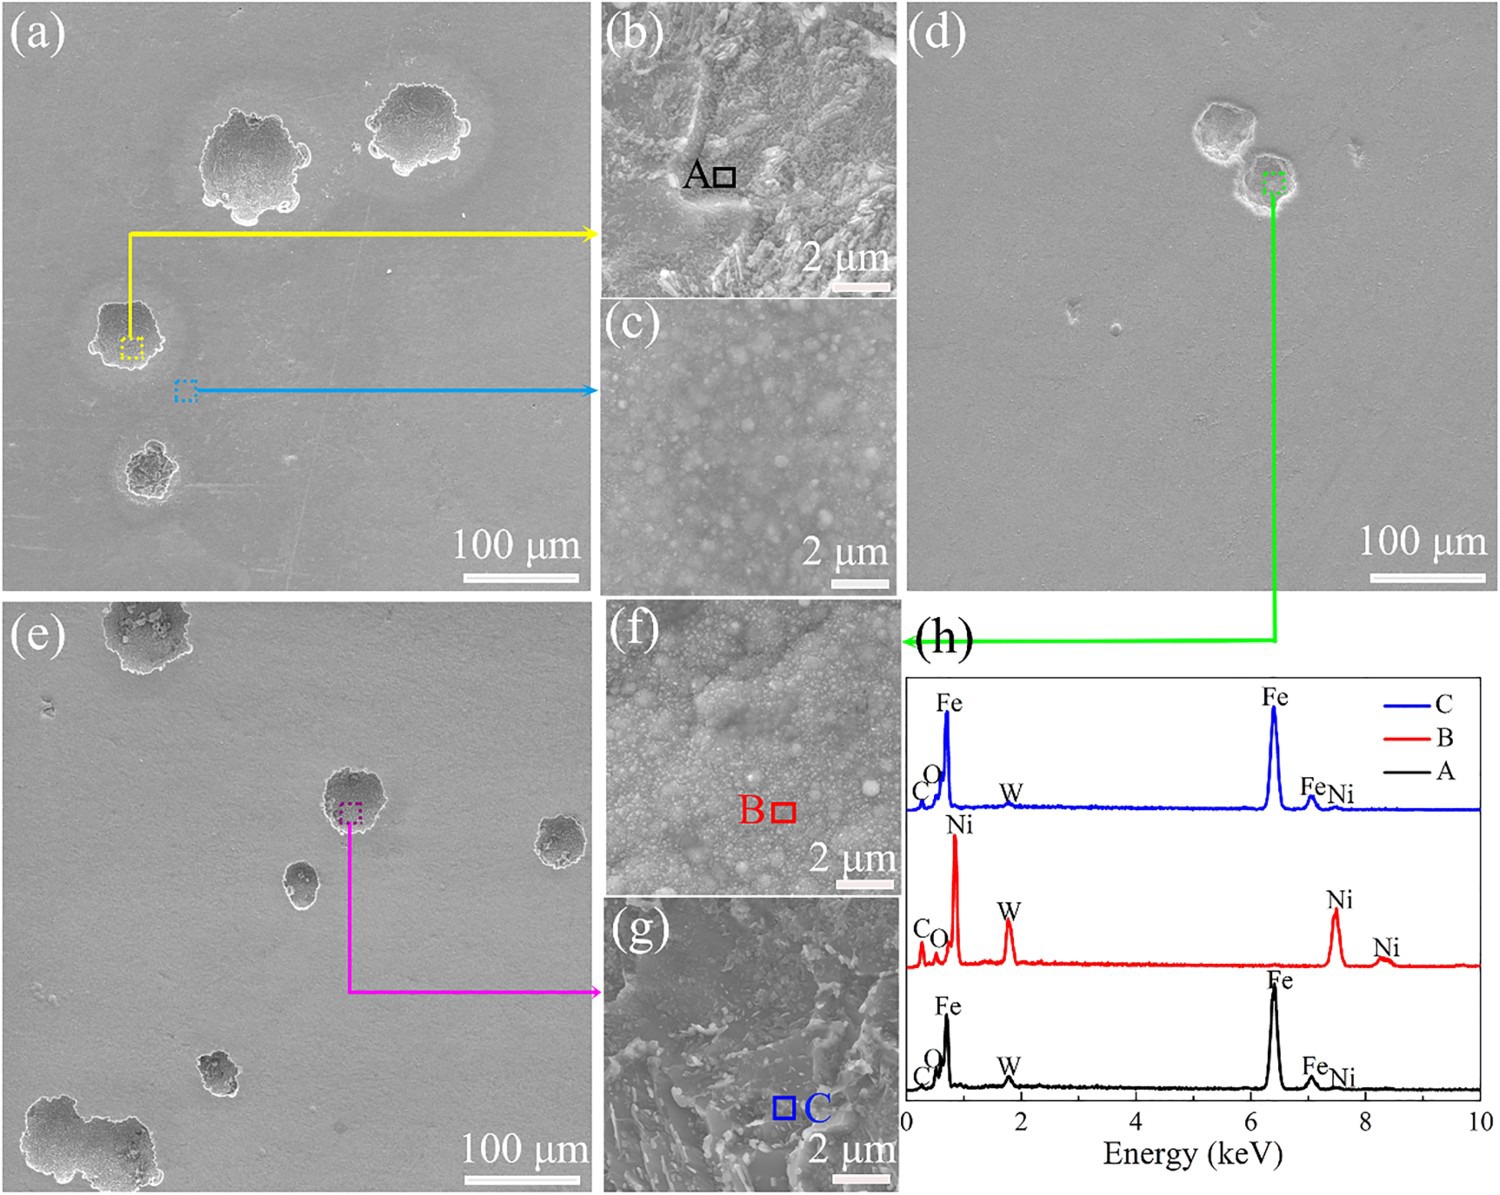
Immersion corrosion behaviour of the composite coatings
Figure 13 shows the surface morphologies and EDS analysis of the Ni-W and Ni-W-20Ti3C2Tx coatings soaked in 3.5 wt.% NaCl electrolyte for 240 h. The corrosion products of the pure Ni-W alloy coating were loose, thick and even peeled off, which resulted in an exposed substrate (Figure 13(a)). The corrosion products of the Ni-W-20Ti3C2Tx composite coating were relatively thin and compact (Figure 13(d,e)), which were beneficial for protecting the substrate. This result suggests that Ti3C2Tx obviously affected the surface microstructure of the corrosion products.
SEM images and EDS results of the Ni-W (a, b and c) coating and Ni-W-20Ti3C2Tx (d, e) composite coating after immersion in a 3.5 wt.% NaCl solution for 10 days.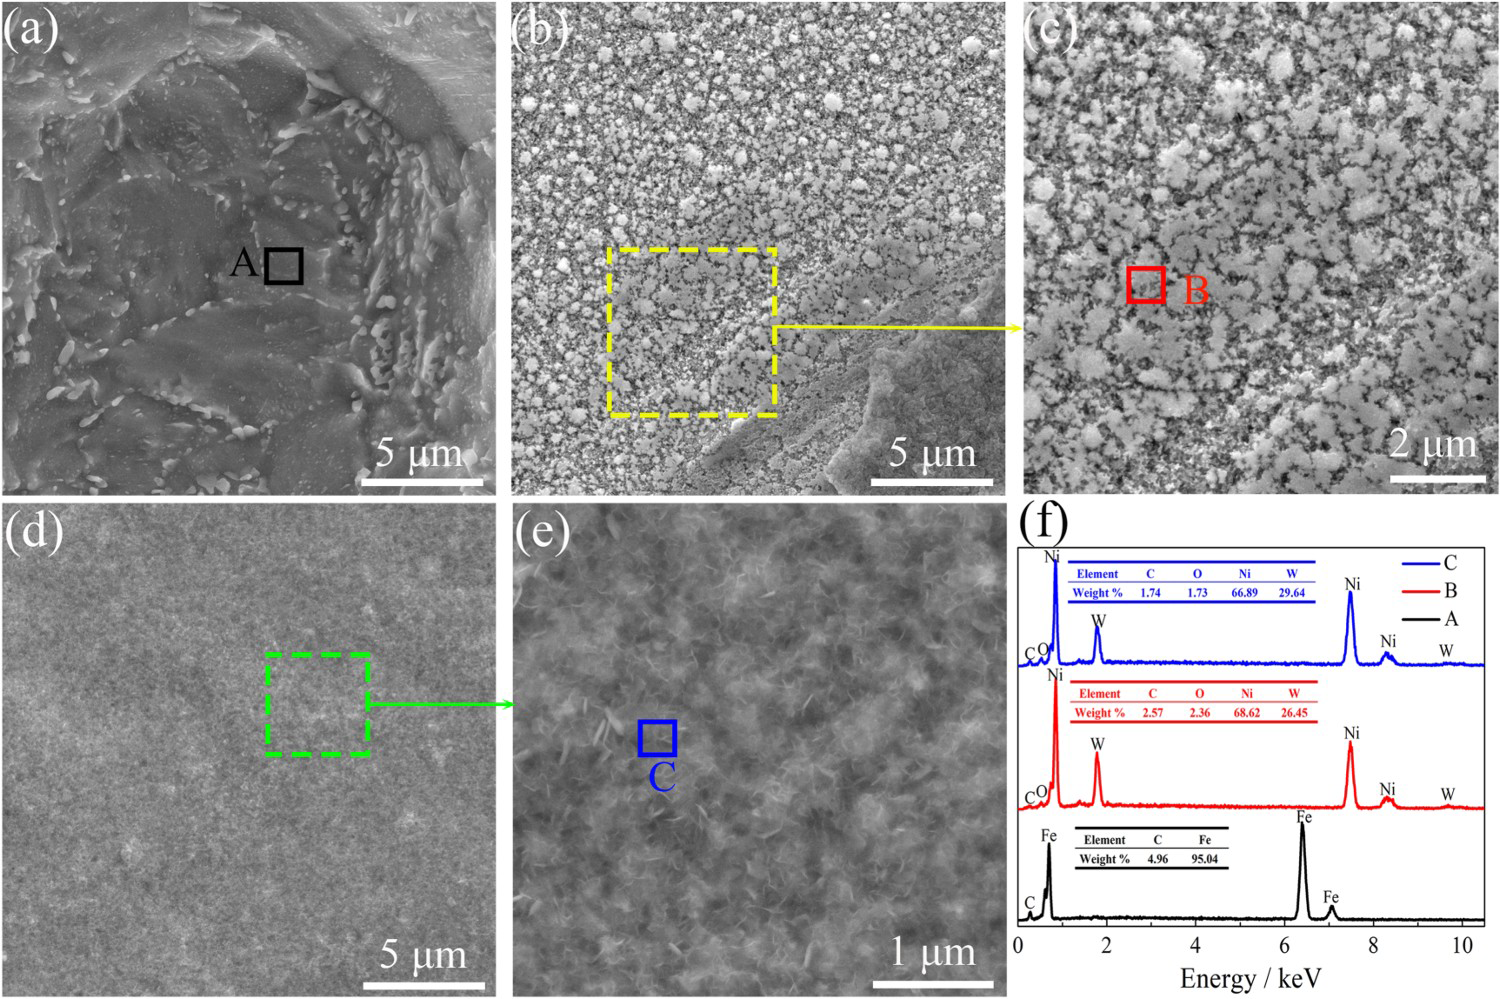
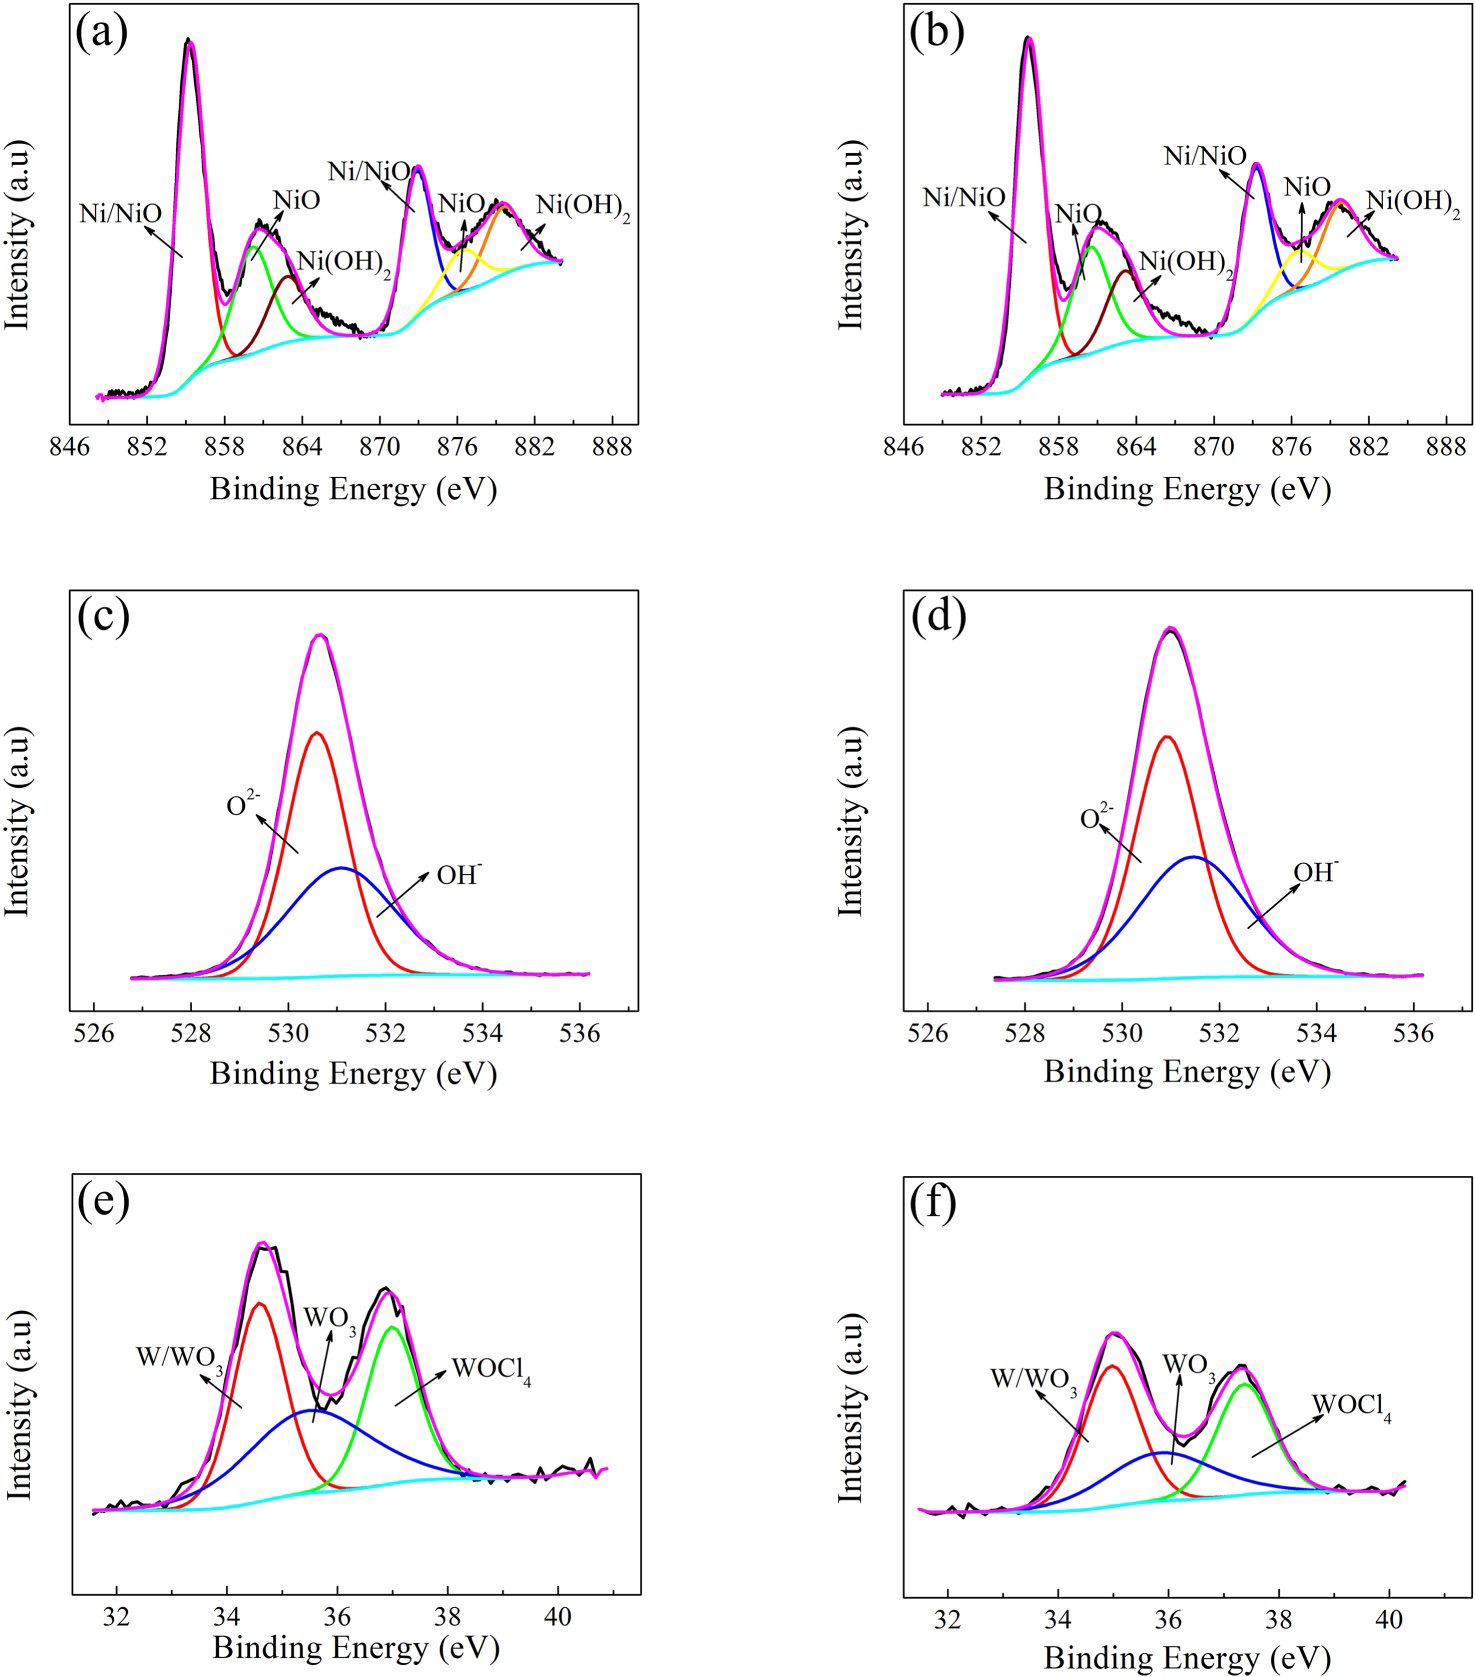
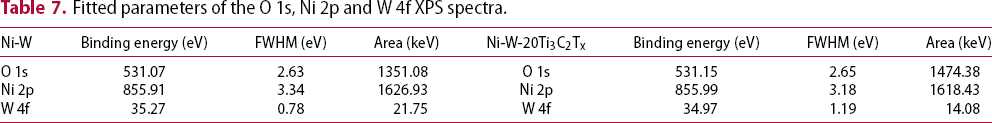
Figure 14 summarises the complete XPS spectra of the Ni-W and Ni-W-20Ti3C2Tx coatings soaked in 3.5 wt.% NaCl electrolyte for 240 h. The fitting results show that the dominant elemental compositions of the passive films were O, W and Ni. Table 6 shows that the Ni-W-20Ti3C2Tx composite coating had weaker Ni and W signals than the single Ni-W coating, which illustrates that the corrosion degree of Ni-W-20Ti3C2Tx was weakened. Figure 15(a,b) shows the Ni 2p spectra of the corrosion product layer, and the corrosion products were Ni(OH)2 and NiO. Thus, Ni could be transformed to NiO and Ni(OH)2 during erosion, and two layers were produced on the etched surface, where the inner layer was NiO, and the outer layer was Ni(OH)2. The data in Table 7 show that the Ni and W contents in the Ni-W-20Ti3C2Tx composite coating decreased, which indicates that the corrosion degree decreased, and a thick and dense oxide film was produced on the surface.
Full XPS spectra of the surfaces of the Ni-W coating and Ni-W-20Ti3C2Tx composite coating after immersion in a 3.5 wt.% NaCl solution for 10 days. XPS spectra of the (a, b) Ni 2p, (c, d) O 1s and (e, f) W 4f peaks of the passive films formed on the (a, c, e) Ni-W coating and (b, d, f) Ni-W-20Ti3C2Tx composite coating in a 3.5 wt.% NaCl solution. Fitted parameters of the O 1s, Ni 2p and W 4f XPS spectra.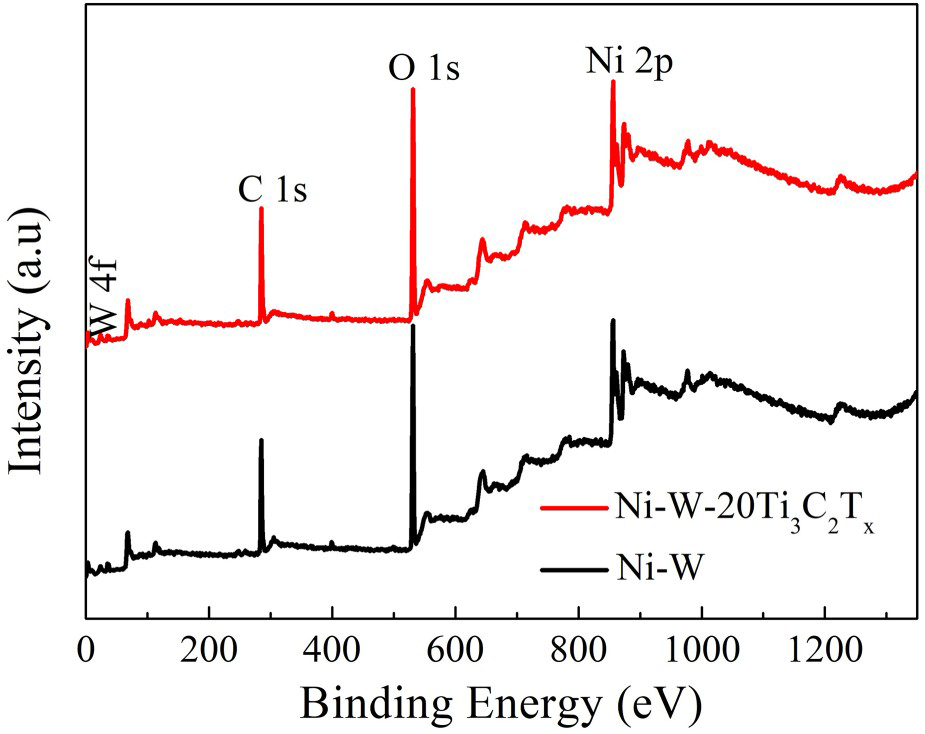
The corrosion resistance of the deposit was improved after 20 mg/L Ti3C2Tx was added, which corresponded to the quality of the corrosion product film. Although the Ni-W-20Ti3C2Tx composite coating had a larger crystallite dimension than the pure Ni-W coating, the surface was more uniform. An increase in grain size can also reduce the resistance to intergranular corrosion. Based on these results, excellent corrosion properties were obtained.
To illuminate the effect of the grain size on the oxidation rate, the effective diffusion coefficient can be calculated as follows [42]:
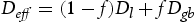

 is the lattice diffusion coefficient,
  is the grain boundary diffusion coefficient,
  is the grain boundary area percentage,
  is the grain boundary width (0.5 nm) and
  is the mean crystallite size of the coating. According to a report, the grain boundary activation energy is much larger than the crystal lattice activation energy. In other words,
  is much larger than
  ; in general,
 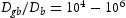 [42].
[42].
The metal oxidation process is often controlled by the diffusion process of oxide films. Diffusion occurred due to various defects in the oxide, and diffusion along the grain boundaries was faster than the lattice diffusion. Additionally, the grain boundaries easily formed galvanic corrosion cells with the grains. The above formula shows that the proportion of diffusion along grain boundaries significantly decreased when the grain size increased; therefore, the corrosion rate decreased, and a compact oxidation film was formed. Similarly, due to the accelerated corrosion rate and thinner coating thickness of the Ni-W coating, the oxidation film was loose and thin, and some areas even corroded the matrix.
According to this discussion, the oxidation mechanism of the Ni-W and Ni-W-20Ti3C2Tx coatings was established. The two coatings showed identical oxidation behaviours, and corrosion preferably occurred at the grain boundaries. When the final corrosion product of Ni(OH)2 was formed, a passivation film was generated on the surface. Schematic models of the oxidation mechanisms of the Ni-W coating and Ni-W-20Ti3C2Tx composite coatings with coarse and fine grain sizes are shown in Figure 16.
Schematic models of the oxidation mechanisms of the Ni-W coating and Ni-W-20Ti3C2Tx composite coating with coarse and fine grain sizes.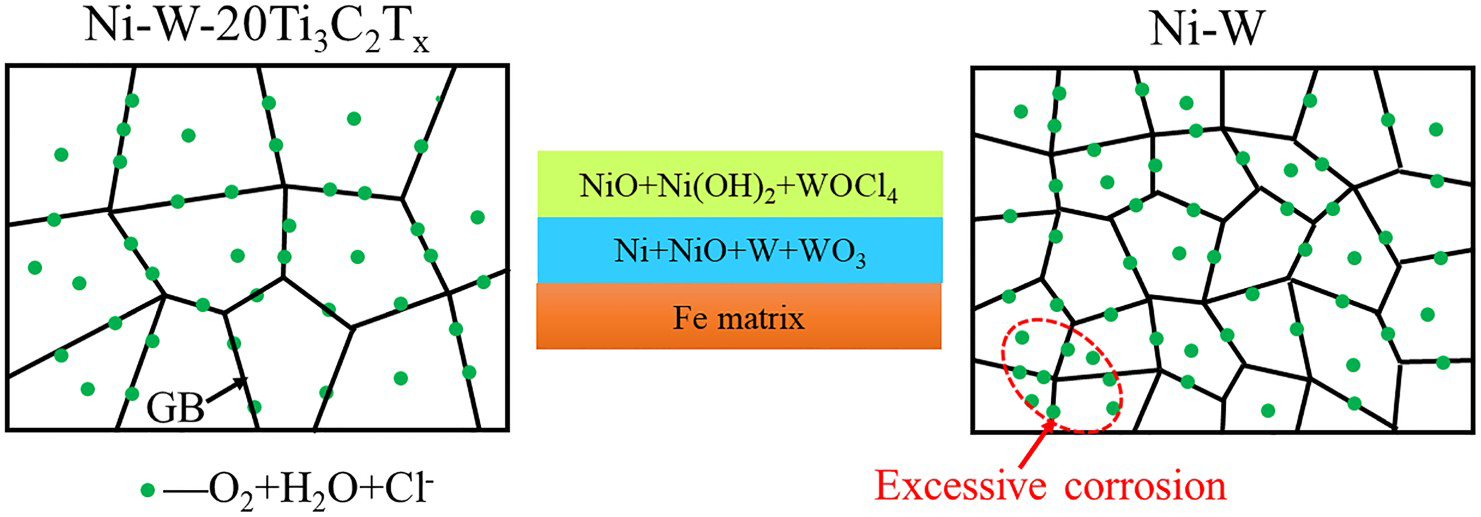
In addition to the grain size, the effect of the preferred orientation on the oxidation and corrosion resistance of metals could not be ignored. Lu et al. found that the Ni(111) crystal surface had significantly lower corrosion rate than Ni(200) [43]. Zhang et al. found that the addition of ZrC affected the texture of Ni plating [44]. The intergranular corrosion properties of the coatings were enhanced by changing the texture of the coatings, and the percentage of low-energy grain boundaries was increased by adding Ti3C2Tx. One of the main theories to explain the corrosion behaviour depends on the crystal orientation due to the density of atoms accumulated on the crystal surface. In other words, a higher atomic density on the surface corresponds to higher atomic coordination; thus, with stronger atomic bonding, the surface is more resistant to corrosion in a corrosive medium. Ni(111) had a greater surface atom density than Ni(200) and Ni(220), so Ni(111) also had a lower corrosion rate than these two crystal surfaces. Ti3C2Tx was used to enhance the texture of Ni(111), and the densest (111) plane had the lowest surface energy; therefore, the surface became denser. Figure 2(b) shows that the Ni-W-20Ti3C2Tx composite coating has the strongest Ni (111) preferred orientation.
Through the above analysis, crystal plane orientation, surface quality and grain size have a decisive effect on the corrosion resistance of coatings. Therefore, Ni-W-20Ti3C2Tx composite coating has the best corrosion resistance.
In this experiment, the microstructure of the composite coating was affected by adding Ti3C2Tx nanosheets. With the addition of Ti3C2Tx nanosheets, the surface of the coating became smoother, grain size increased, and the texture of Ni(111) was enhanced, which provided conditions to improve the corrosion resistance of the composite coating. Compared to the pure Ni-W coating, the hardness of the composite coating increased by 123.48 HV due to dispersion strengthening and solid solution strengthening. The COF and wear rate of the composite coating decreased due to the self-lubricating effect and strengthening effect of the Ti3C2Tx nanosheets.
Conclusion
In the present work, Ni-W-Ti3C2Tx composite coatings with different Ti3C2Tx additions were deposited by direct current electrodeposition method, and their mechanical, tribological and corrosion properties were systematically evaluated. The main conclusions drawn from the current survey are
Compared with Ni-W alloy coating, the hardness, wear resistance and corrosion resistance of Ni-W-Ti3C2Tx composite coatings are obviously improved. Among all the coatings, Ni-W-20Ti3C2Tx composite coating has the lowest friction coefficient and wear rate, which is consistent with the highest hardness of Ni-W-20Ti3C2Tx composite coatings. Friction reduction mechanism is mainly Ti3C2Tx as a solid lubricant to prevent the metal matrix and friction pair contact. Ni-W-20Ti3C2Tx composite coating has the lowest corrosion current density and the largest impedance arc radius, which depends on the enhancement of Ni(111) texture and the uniform distribution of Ti3C2Tx, forming a uniform and dense passivation film on the surface of the coating.
Footnotes
Disclosure statement
No potential conflict of interest was reported by the authors.