
Abstract
To further clarify the characteristics of plasma-cladded Ni60A coating on copper, the microstructure and wear behavior were analyzed layer by layer. Along the depth direction, the coating can be divided into three regions according to the difference of microstructure: upper, middle and bottom. The phase composition in different regions was the same (including γ-(Cu, Fe, Ni), Cr23C6, CrB and Ni3Si), and there was no obvious difference in the volume fraction of strengthening phases (Cr23C6 and CrB). Due to the stronger load-bearing capacity of larger-size strengthening phases, the wear resistance of middle region was slightly higher than that of upper region. However, the high copper content in bottom region led to a decrease in hardness and resistance to plastic shear, which significantly reduced the wear resistance (2.3 times lower than upper region). Chemical composition had a greater impact on the wear resistance than size and distribution uniformity of strengthening phases.
Introduction
Owing to high electrical and thermal conductivity, copper materials are widely used in metallurgy and electrical industries [1-3]. However, copper also has drawbacks of low hardness and poor wear resistance, which causes it to be easily damaged in some abrasion environments [4]. Preparing a protective coating on copper by cladding technology is a classical method to improve its surface properties. There are various surface cladding technologies, such as laser cladding and plasma cladding [5,6], which can obtain metallurgical bonding coatings.
Ni-based alloys are very popular cladding materials because of its excellent wear resistance and corrosion resistance [7]. Among the various Ni-based alloys, Ni–Cr–B–Si series self-fluxing alloy seems to have more application prospects in metal surface repair and additive manufacturing [8]. They have a lower melting point and better fusion characteristics, which make it easier to achieve good metallurgical bonding with the substrate [9,10]. It has been reported that Ni–Cr–B–Si coatings generally contain a large amount of chromium carbide (Cr23C6 or Cr7C3) and boride phases (CrB or Cr5B3) to play a role of dispersion strengthening, which can significantly improve the wear resistance of the coating [11-13]. Furthermore, many researchers have discussed the influence of cladding process on the wear resistance of Ni–Cr–B–Si coatings. Results showed that different process conditions can cause different degrees of substrate dilution, which led to the change in chemical composition of the alloy coating and the change in the number and size of some strengthening phases, thereby resulting in the evolution of wear resistance [14-17].
In our previous research, our group has developed plasma cladding coupled with induction preheating technology [18] and swing arc plasma cladding technology [19] for copper surface strengthening. These technologies have high efficiency and can prepare Ni–Cr–B–Si (Ni60A) coatings with excellent performance on copper. However, as mentioned in reference [18], the Ni60A coating has a phenomenon similar to ‘layered’ along the depth direction even under a constant cladding process parameter. Furthermore, Li et al. [20] also obtained similar results when using laser cladding to prepare a Ni–Cr–B–Si alloy coating on copper surface. However, the impact of this difference in internal microstructure on the wear resistance of the coating was often ignored. When evaluating the wear resistance, researchers were more concerned about the surface of coatings [14-17,18,20]. Actually, the complete service process of a coating is to wear along its depth direction until the coating is exhausted. For example, the coating used to strengthen the blast furnace tuyere is subject to the scouring of high-speed moving coke and coal for a long time until the coating material is completely worn and then loses its protective effect [4]. Therefore, analyzing the wear behaviour of the coating layer by layer is essential, which has a great significance for judging whether this ‘layered’ structure will affect the application of the coating.
In this study, based on previous research results [18,19], the microstructure and wear behaviour of Ni60A coating prepared by plasma cladding on copper were further analyzed layer by layer. The wear mechanism in different regions was discussed, aiming to further clarify the characteristics of Ni60A coating.
Materials and methods
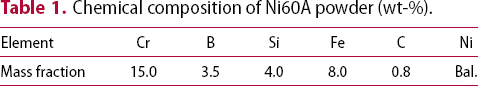
Chemical composition of Ni60A powder (wt-%).
After cladding, the coating samples were cut to the required size for microscopic characterisation and performance testing. The cross sections of samples were polished with sandpaper (400 mesh, 800 mesh, 1200 mesh, 2000 mesh) and diamond polishing paste (5000 mesh) in turn. Then, the cross-sectional microstructure was observed by a Field Emission scanning electron microscope (SEM, FEI-Nova Nano SEM 450, U.S.A.) equipped with energy dispersive spectrometer (EDS, EDAX-OCTANE SUPER, U.S.A.). All SEM observations are performed on polished samples using the backscattered electron (BSE) mode. BSE mode can generate contrast based on the atomic number, so that the phases in the sample can be intuitively distinguished without a metallographic etching process [21]. The SEM images were analyzed using commercial software named ‘Image-Pro Plus 6.0’ to estimate the size and the volume fraction of various phases (based on the contrast). To determine the phase composition of the different regions, the coating was polished with sandpaper to the positions of upper, middle and bottom along its depth direction. During this process, a digital display vernier calliper with an accuracy of 0.01 mm is used for positioning. The phase composition of each region was identified by X-ray diffraction (XRD, Bruker-AXS D8 Advance, Germany) using Cu Kα diffraction (λ = 1.54056 Å) with scanning angle ranging from 10° to 90° and scanning speed of 6°/min.
A Vickers hardness tester (HVS-1000M) was used to measure the hardness value of the coating with a load of 100 g and a dwelling time of 10 s. As shown in Figure 1(a), to make the test results representative, the hardness value was measured according to the following two methods: (1) every 100 µm along the depth of the coating; (2) every 200 µm along the direction perpendicular to the depth of the coating in the upper, middle and bottom regions (total 10 points in each region), respectively. Finally, the hardness distribution law in different regions and different directions was depicted using the Origin software.
(a) Schematic diagram of microhardness test; (b) schematic diagram of wear test; (c) photo of friction and wear tester.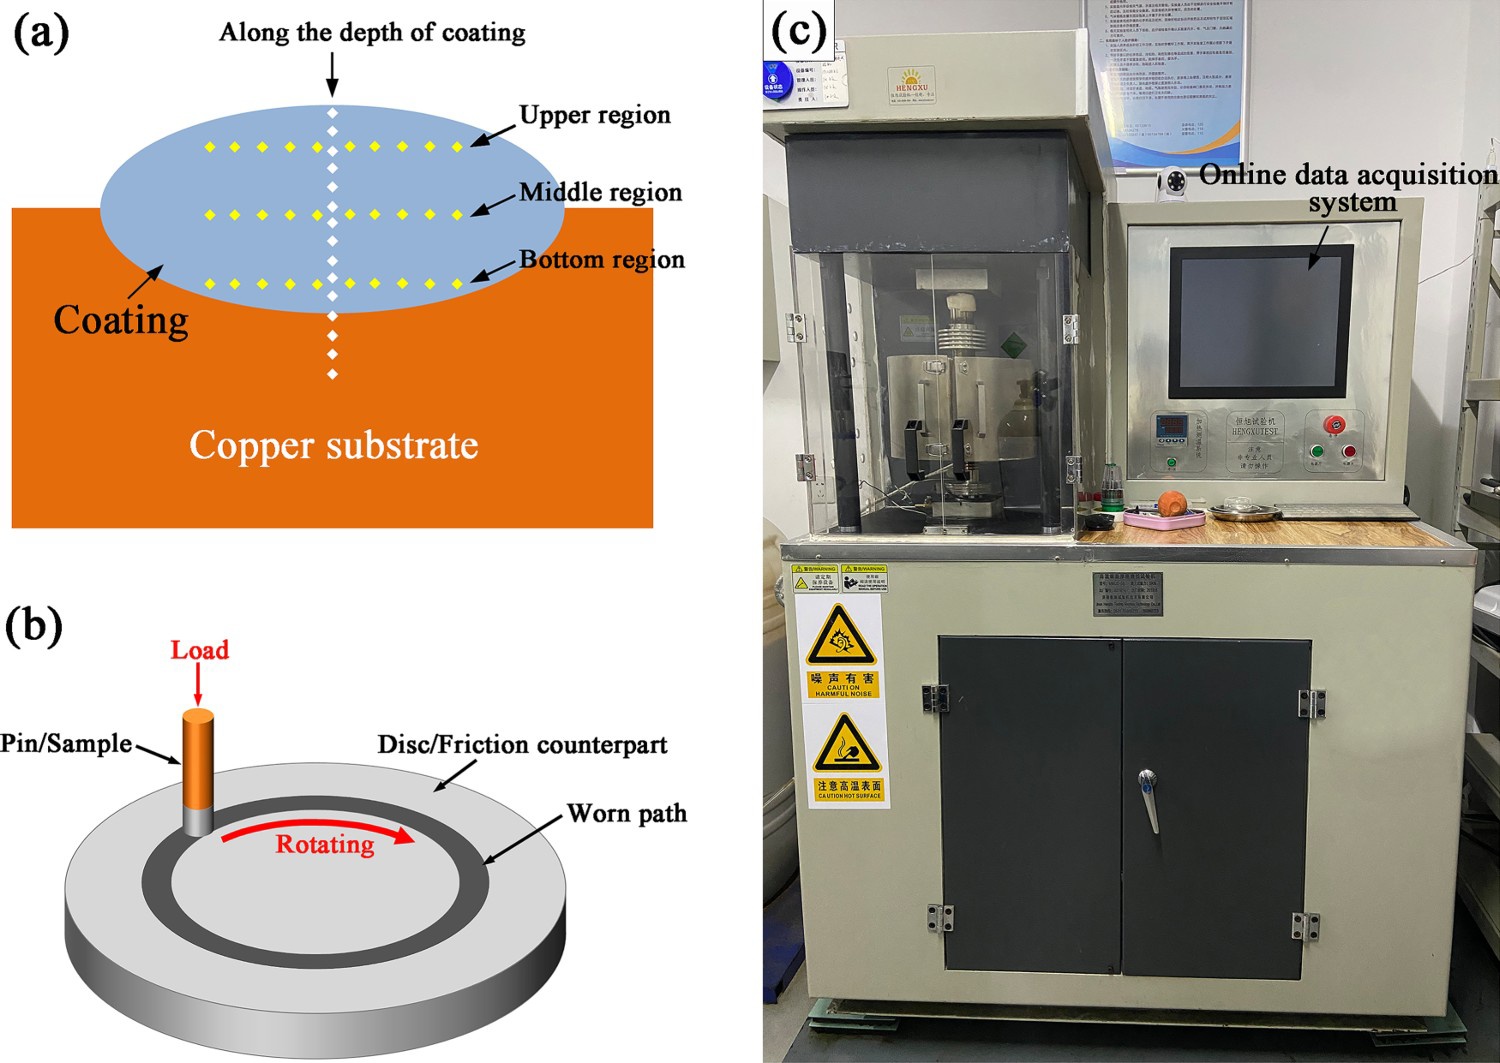
Wear tests were carried out on a friction and wear tester (MMUD-5B) in a pin (sample)-on-disc (304 stainless steel, Ra 0.8) configuration at room temperature, as shown in Figure 1(b). Before the wear test, the coating sample was pre-ground to the corresponding positions of different regions along the depth direction. The digital display vernier calliper was also used for positioning. Meanwhile, the microscope equipped with the microhardness tester was used to observe whether the microstructure of coating met the characteristics of the corresponding positions, thus ensuring that the corresponding positions were exactly reached. Then, the samples were all polished with 2000 mesh sandpaper to maintain the same roughness. The wear conditions were as follows: 50 N load, 100 r min−1 rotating speed and 15 min test time. The selection of wear conditions is based on previous exploration and literature research [18]. Mass loss of samples was used to evaluate the wear resistance, which was quantified by an electronic balance with an accuracy of 0.1 mg (take the average of the three experimental results as the final result). The friction coefficient was recorded by the online data acquisition system. The sensor type was S-type pressure sensor and the sampling frequency was 10 Hz. The worn morphologies of each region of the coating were observed by SEM to analyze the wear mechanism.
Results and discussion
Figure 2(a) shows the SEM image of the cross section of Ni60A coating. The thickness of the coating is about 2 mm. According to the difference in microstructure, the coating can be divided into three regions along the depth direction: upper (700 µm), middle (700 µm) and bottom (600 µm). From the XRD analysis results in Figure 2(e), it can be seen that there is no obvious difference in the phase composition of three regions, mainly including γ-(Cu, Fe, Ni), Cr23C6, CrB and Ni3Si phases. Only the main diffraction peak of the bottom region shifts to the left, which may be related to the dilution of the copper substrate. The magnified SEM images (Figure 2(b–d)) indicate that the difference between the three regions is mainly reflected in the size and shape of various strengthening phases (CrB and Cr23C6). This difference is related to the temperature gradient during the solidification process of the coating, which has been explained in previous research [18]. To determine the chemical composition of different regions in the coating, EDS area-scanning analysis was performed, as shown in Table 2. It can be seen that the average content of all elements in the upper region and the middle region are basically the same, only the bottom region has a much higher copper content. However, it is worth mentioning that compared with the other regions, the relative atomic ratios between other elements (Ni, Cr, B, Si, Fe and C) in the bottom region remain basically unchanged, which further indicates that the chemical composition of different regions mainly differs in copper content. EDS line scan results in Figure 2(f) indicate that the Cu element at the interface between copper substrate and coating is distributed in a gradient, while its distribution inside the coating is basically at the same level, which is consistent with the area-scanning results.
(a) SEM image of the cross section; (b) magnified SEM images of upper region; (c) magnified SEM images of middle region; (d) magnified SEM images of bottom region; (e) XRD pattern; (f) EDS line scan result corresponding to Figure 2(a). EDS area-scanning results of different regions inside the Ni60A coating (at.-%).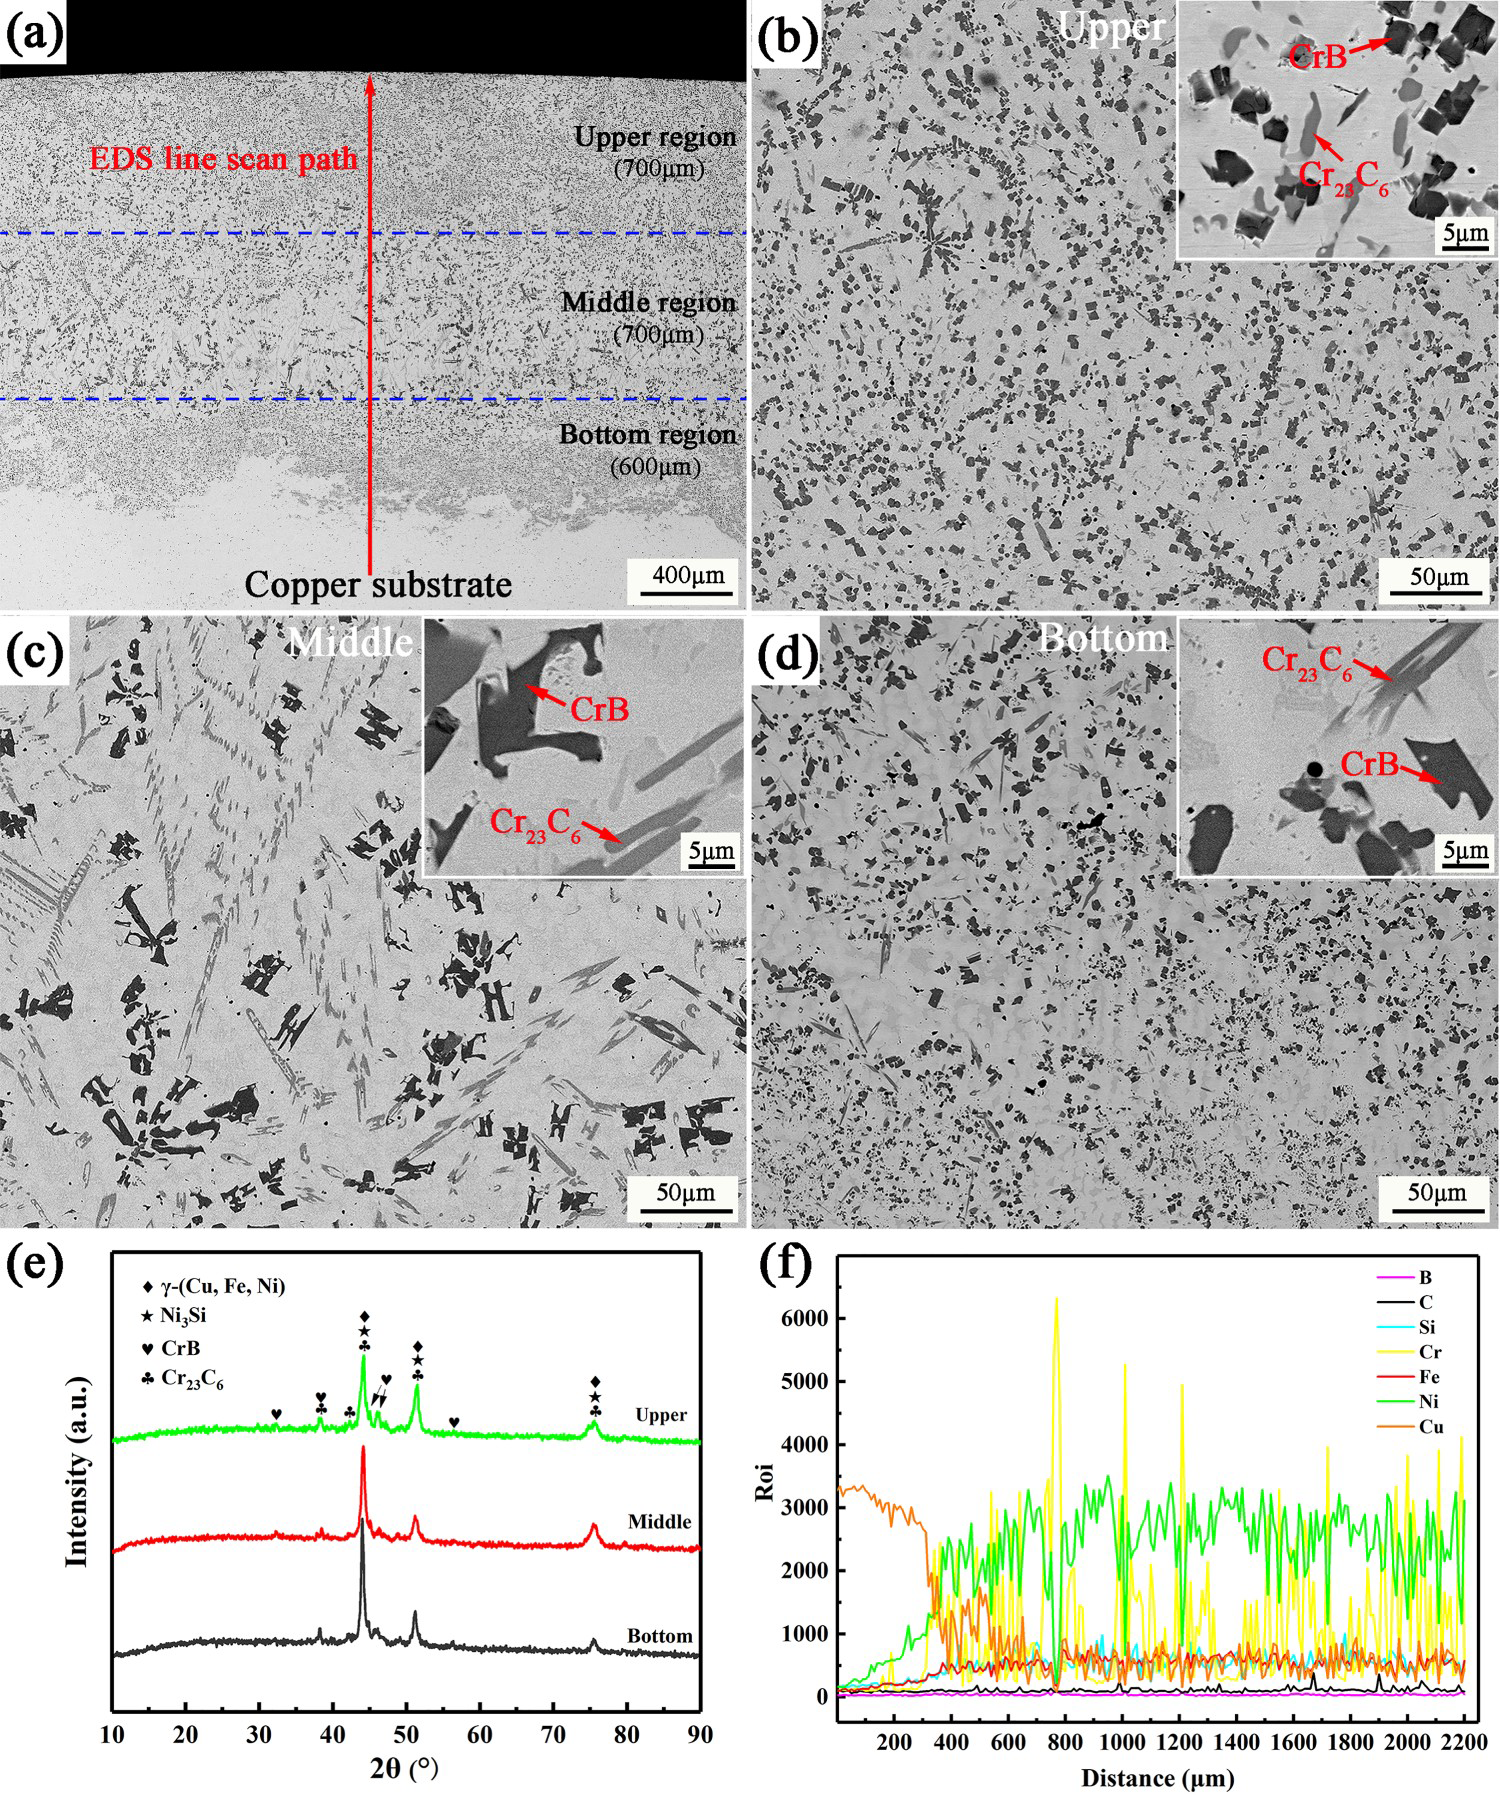
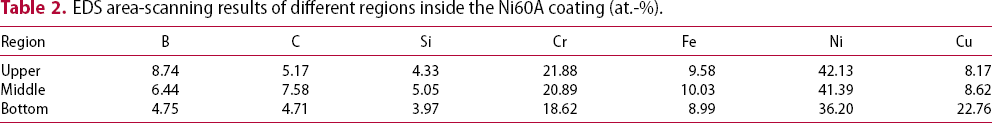
Figure 3(a,b) show the statistical results of the size and volume fraction of phases in different regions. To make the statistical results more representative, low-magnification SEM images are selected as the statistical objects. The statistical principle is based on the contrasts of various phases. The phases of γ-(Cu, Fe, Ni) and Ni3Si are regarded as a whole due to the low contrast, which are defined as ‘other phases’. It can be seen that the size and uniformity of the strengthening phases (CrB and Cr23C6) are quite different in different regions, but their volume fraction seems to have no obvious difference. First, the chemical compositions of the upper and middle regions are essentially the same, resulting in no significant difference in phase composition. Second, although the copper content in the bottom region is higher, Cu element only participates in the formation of γ-(Cu, Fe, Ni) solid solution. Owing to the infinite solubility of Cu and Ni [20], the change of copper content only affects the ratio of Cu atoms in the γ-(Cu, Fe, Ni) solid solution, but does not affect the formation of the strengthening phases (CrB and Cr23C6). Therefore, the volume fraction of strengthening phases in the bottom region has no obvious change compared with other regions.
Statistical results of average size (a) and volume fraction (b) of each phase in different regions.
Figure 4(a) depicts the microhardness distribution along the surface of the coating to the copper substrate. The microhardness value in the middle region has large fluctuations, which is attributed to its uneven microstructure. Conversely, due to the uniform phase distribution, the upper region has less fluctuation. Nevertheless, the average hardness of the middle region and the upper region has no obvious difference (around 600 HV), which is close to the hardness results of Ni–Cr–B–Si alloy coatings in literature [22,23]. However, the microhardness of bottom region is relatively lower than that of other regions due to the high copper content, especially near the interface between the coating and the substrate (Figure 4(b)). As a result, the chemical composition of the coating has a greater impact on the hardness than the uniformity of the strengthening phase distribution in our coating system.
(a) Microhardness distribution along the depth of the coating; (b) average hardness of different regions inside the coating.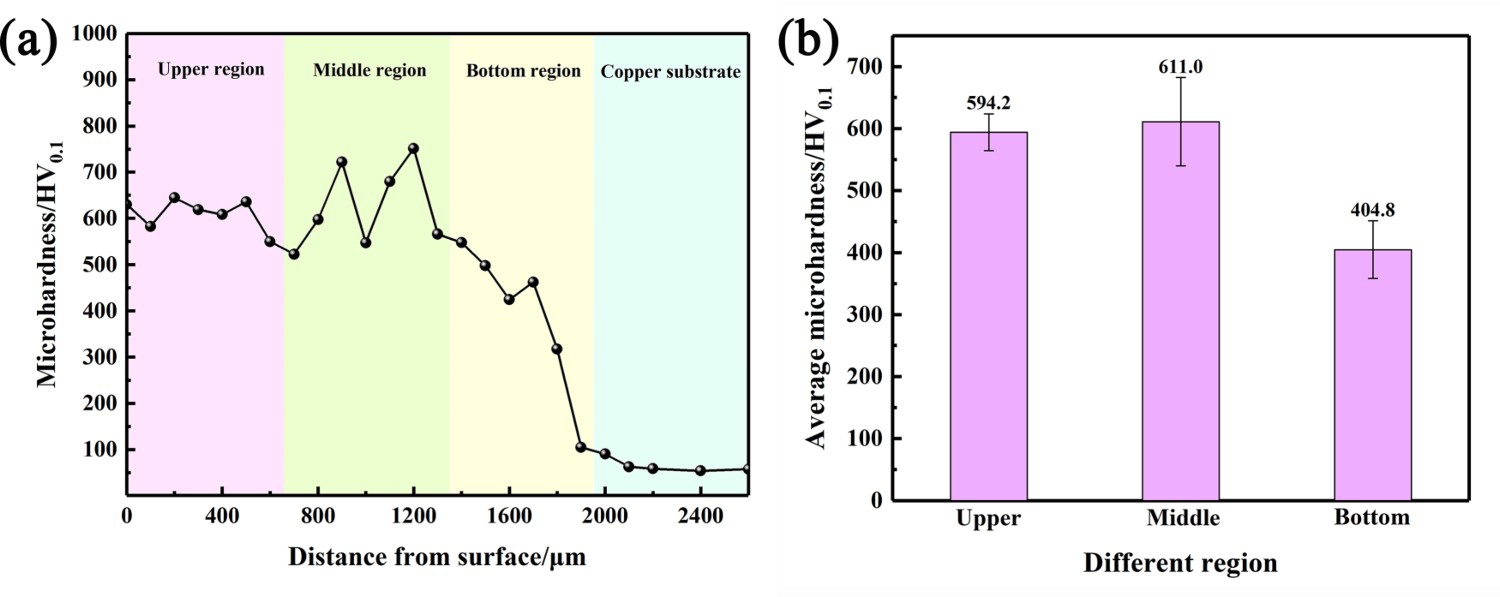
Figure 5 shows the friction coefficient and wear loss of different regions inside the coating. From Figure 5(a), it can be seen that the friction coefficient of the bottom region (about 0.16) is significantly higher than that of the upper (about 0.12) and middle (about 0.11) regions. Generally, lower friction coefficient indicates better wear resistance. The violent fluctuation of the friction coefficient in the upper region may be attributed to the occurrence of adhesive wear. The softer material is susceptible to the smearing effect of the friction counterpart, leading to an increase in the friction coefficient value in a short time [24]. As shown in Figure 5(b), the wear loss of middle region is slightly lower than that of the upper region. In terms of the wear loss, the results are close to the research of Li et al. [20], proving its reliability. However, the bottom region shows the worst wear resistance, which is about 2.3 times lower than the upper region.
Wear test results: (a) friction coefficient and (b) wear loss.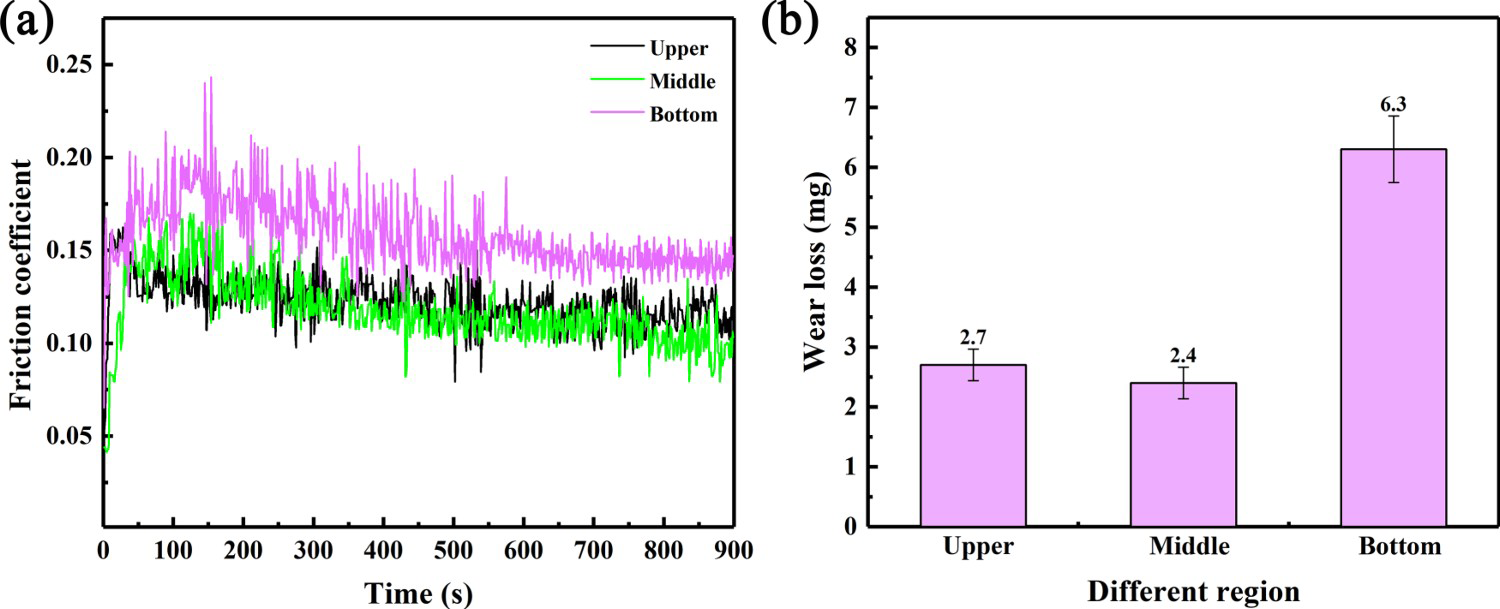
To further understand the wear mechanism, the worn surfaces of different regions in the coating were observed. The worn morphologies and mechanism of different regions are shown in Figure 6. It can be seen that only some furrows appear on the worn surfaces of the upper and middle regions, which is a typical abrasive wear mechanism (Figure 6(a,b)). During the friction process, the rough friction pair slides on the coating surface, causing cutting effect, thereby forming parallel grooves [25]. It is worth noting that the furrows in the middle region are shallower than those in the upper region. The large-size strengthening phase (Cr23C6 and CrB) in the middle region acts as a load-bearing area, reducing the contact between the γ-(Cu, Fe, Ni) matrix and the friction counterpart, thereby reducing the directional furrow wear mechanism [26]. Therefore, only micro-cutting occurs on the surface of the middle region, resulting in a lower wear loss (Figure 6(b)). However, as shown in Figure 6(c), a large number of deep furrows and some signs of tearing can be observed on the worn surface of the bottom region, which indicates that severe abrasive wear and adhesive wear have occurred. Owing to the low hardness in the bottom region, the friction counterpart can easily press into the matrix, causing severe cutting. Moreover, due to the decrease in hardness, the plastic shear ability of the soft surface to resist friction decreases, which increases the smearing effect of the friction counterpart on the coating surface. Then, the local part of the coating surface is easy to be pulled out as a whole, thus forming a tearing phenomenon. This also explains why the friction coefficient of the bottom region fluctuates greatly. In addition, it can also be seen that some spalling pits occur on the worn surface of the bottom region. The formation of spalling pits is attributed to the shedding of strengthening phase particles, possibly due to the mismatch of hardness between the softer coating matrix and the hard particles during the friction process. These shed hard particles may act as a kind of new abrasive on the coating surface, which aggravate the wear of the coating [27].
Worn morphologies and mechanism of different regions: (a) upper, (b) middle and (c) bottom.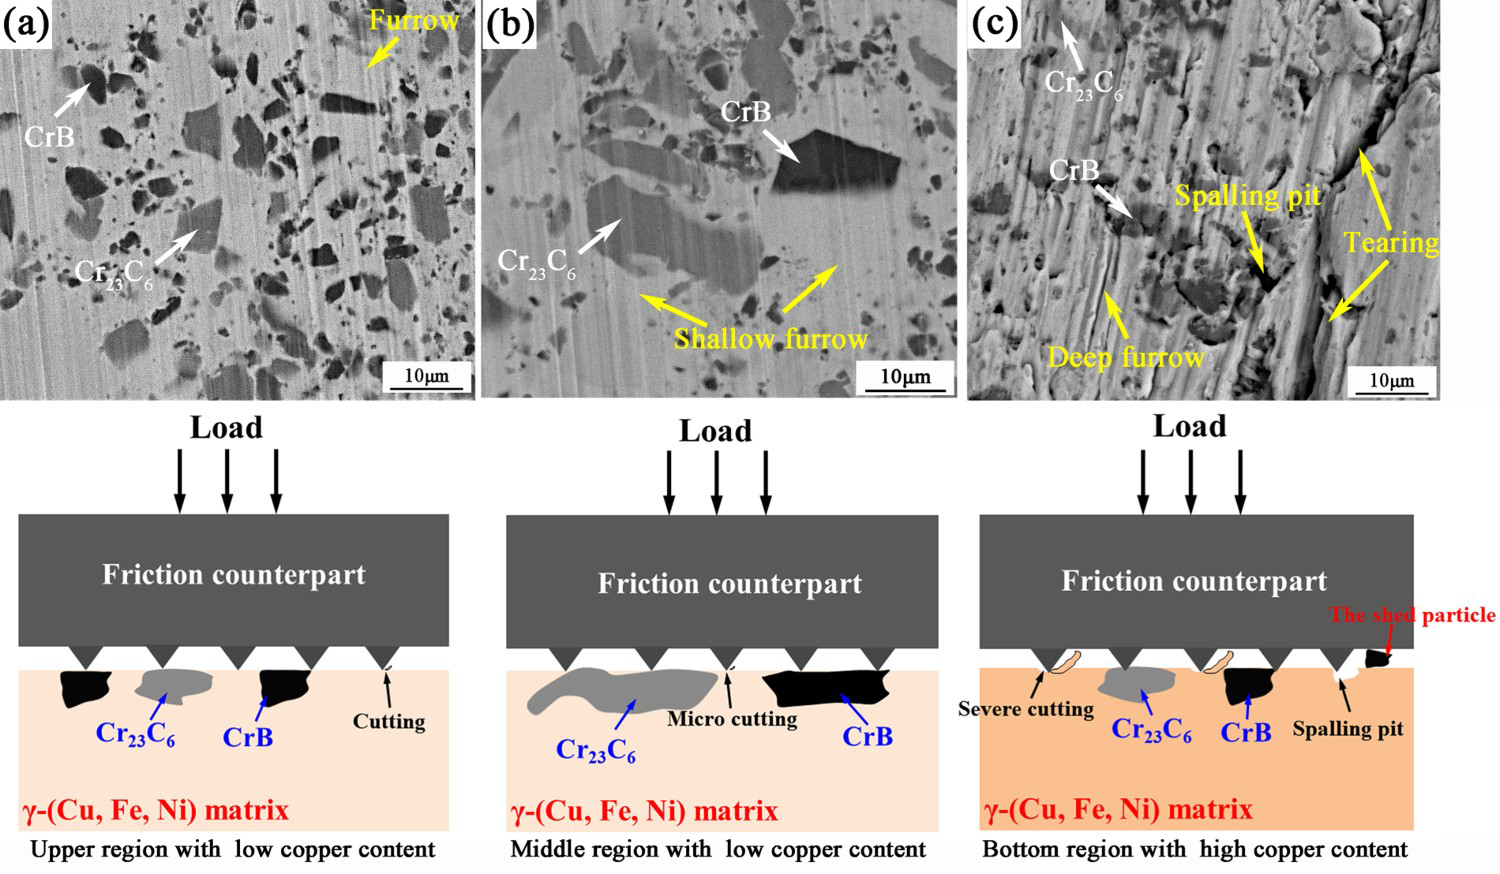
Conclusions
In this work, the microstructure and wear behaviour of Ni60A coating on copper were analyzed layer by layer. Along the depth, the coating can be divided into three regions: upper, middle and bottom. All regions in the coating are composed of γ-(Cu, Fe, Ni), Cr23C6, CrB and Ni3Si phases. Among them, the volume fraction of the strengthening phases (Cr23C6 and CrB) has no obvious difference in different regions, and the difference is mainly manifested in their shape and size. Owing to the stronger load-bearing capacity of the larger-size strengthening phases, the wear resistance of middle region was slightly higher than that of the upper region. For bottom region, the wear resistance is reduced by 2.3 times compared with the upper region due to its high copper content. From upper to bottom, the wear mechanisms are abrasive wear, slight abrasive wear and severe adhesive wear + abrasive wear, respectively. It can be concluded that the ‘layered’ structure in the Ni60A coating has little effect on its application, while the copper content is the dominant factor determining its wear resistance.
Footnotes
Disclosure statement
No potential conflict of interest was reported by the author(s).
Correction Statement
This article has been corrected with minor changes. These changes do not impact the academic content of the article.