
Abstract
In this paper, the crack initiation and propagation laws of GH4169 under thermal-shock load were investigated. It was found that the development of main cracks experienced three stages: accelerated growth in the small crack stage, decelerated growth in the long crack stage and finally discontinued growth. With the increase of temperature, the crack initiation life decreases and the propagation rate increases, the crack initiation life at 600°C is six times to that at 700°C. A thermal fatigue crack growth model was proposed to character the whole crack growth process, and a comparison was drawn with the Paris and Z-H model. The results show that the model is applicable to predict the whole process growth rate of thermal fatigue cracks.
Introduction
During the operation of aero-engine, such high-temperature components as flame tube and turbine blade will be subjected to thermal shock loading. Due to the change in temperature and the constraint of deformation, the thermal stress with temperature variation occurs to these high-temperature components. Under the action of thermal shock load, the high-temperature components will suffer fatigue damage, which leads to thermal fatigue cracks. Crack propagation can cause component failure and engine failure [1].
Since it is difficult and time-consuming to conduct the thermal shock experimental research of superalloys, there are few studies in this field, as is theoretical research [2]. By conducting thermal fatigue tests on GH230 specimens at different temperatures, Chen [3] analysed the relationship between fatigue cracks and the number of cycles. It was discovered that the crack growth rate increased with temperature rise, with a simple linear fitting carried out to the data. Han [4] explored how the thermal fatigue life of superalloys GH783 and GH1140 relates to the upper limit temperature. It was found out that the relationship between the crack length and the number of cycles at the higher experiment temperature is consistent with the change to power function. Marsh [5] investigated the crack initiation and propagation behaviour of 304 stainless steels under thermal shock loading. According to the investigative results, fatigue cracks will propagate to the centre along the surface of the specimen. Despite the studies on thermal fatigue behaviour of some alloy materials, most of the research methods are qualitative analysis or simply elaborating on the relationship between crack length and thermal fatigue cycle number. There is little research that applies mathematical model to explore the relationship between thermal fatigue crack growth rate and upper limit temperature, cooling rate and crack length.
In this paper, the thermal shock test of the GH4169 standard specimens was carried out at three upper limit temperatures and varying cycles, to explore the crack initiation and propagation laws under thermal shock load. On this basis, a multi-scale thermal fatigue crack growth model was established by considering thermal shock temperature, heating and cooling rates, and crack arrest.
Thermal shock experiment
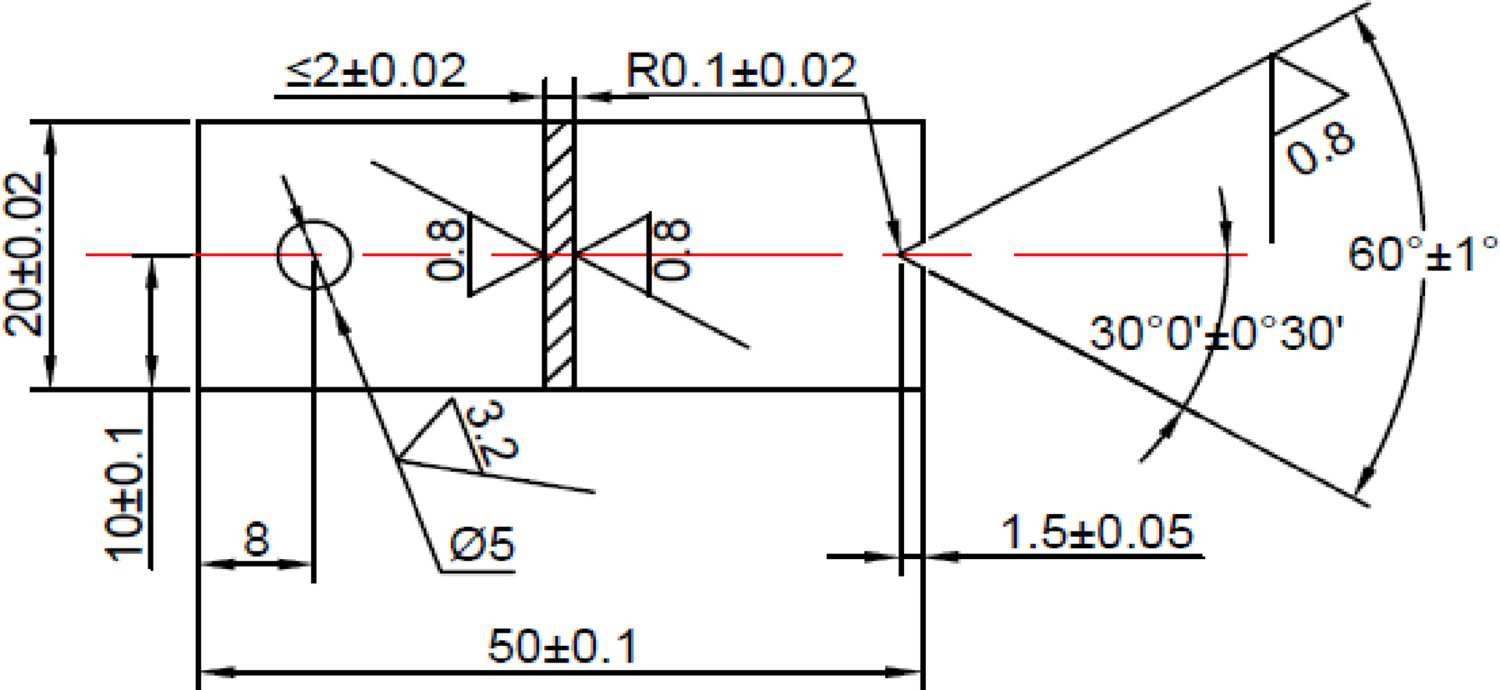
Material and specimen size
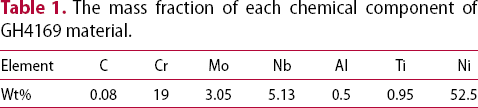
The mass fraction of each chemical component of GH4169 material.
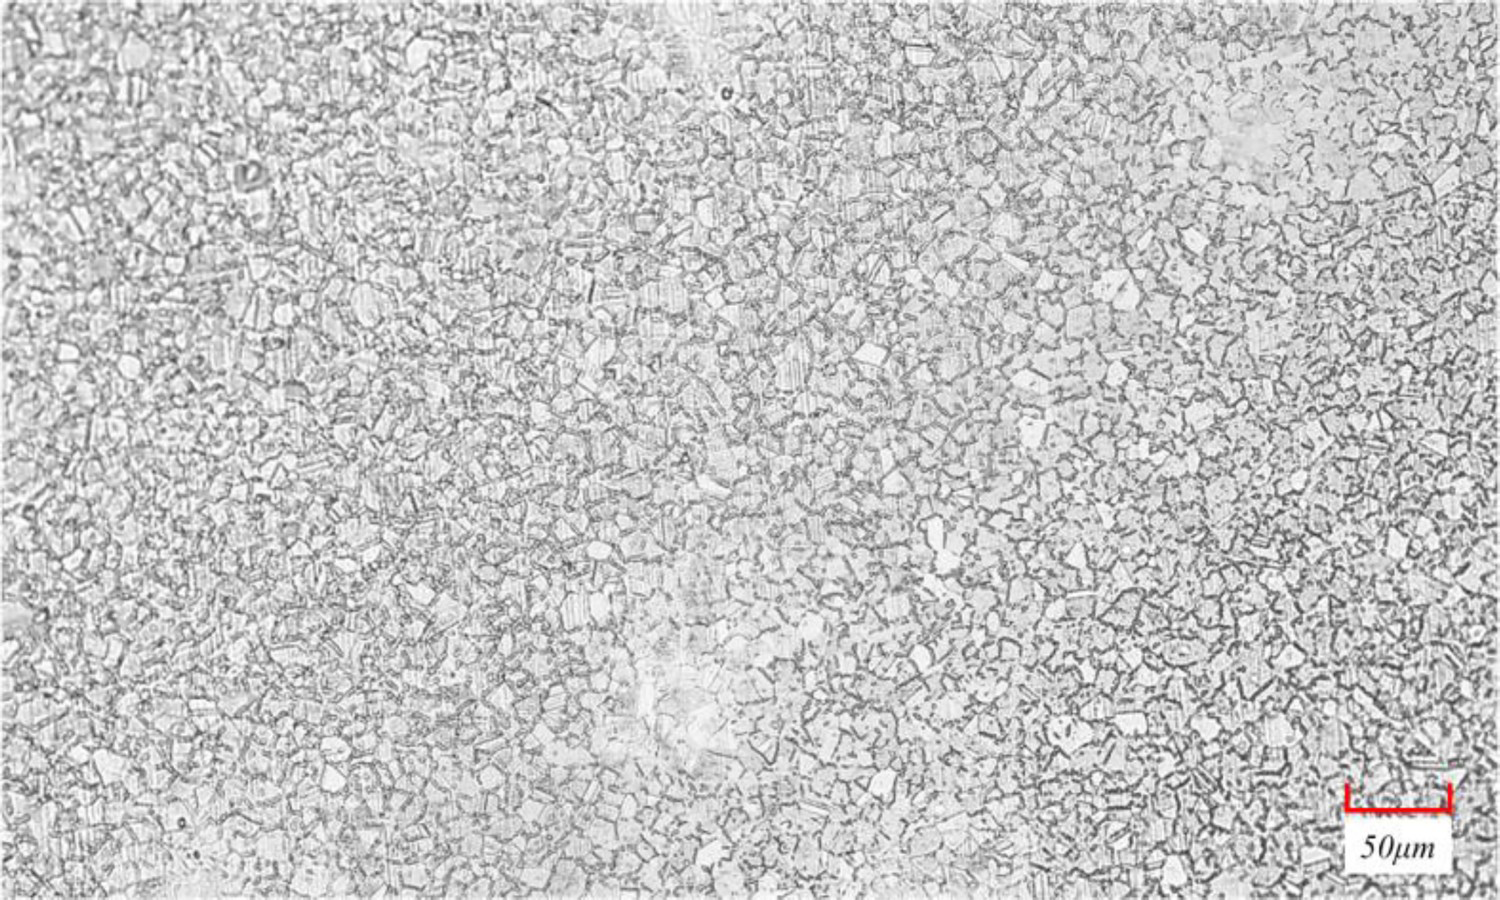
Metallographic microstructure of the material.
Experimental conditions
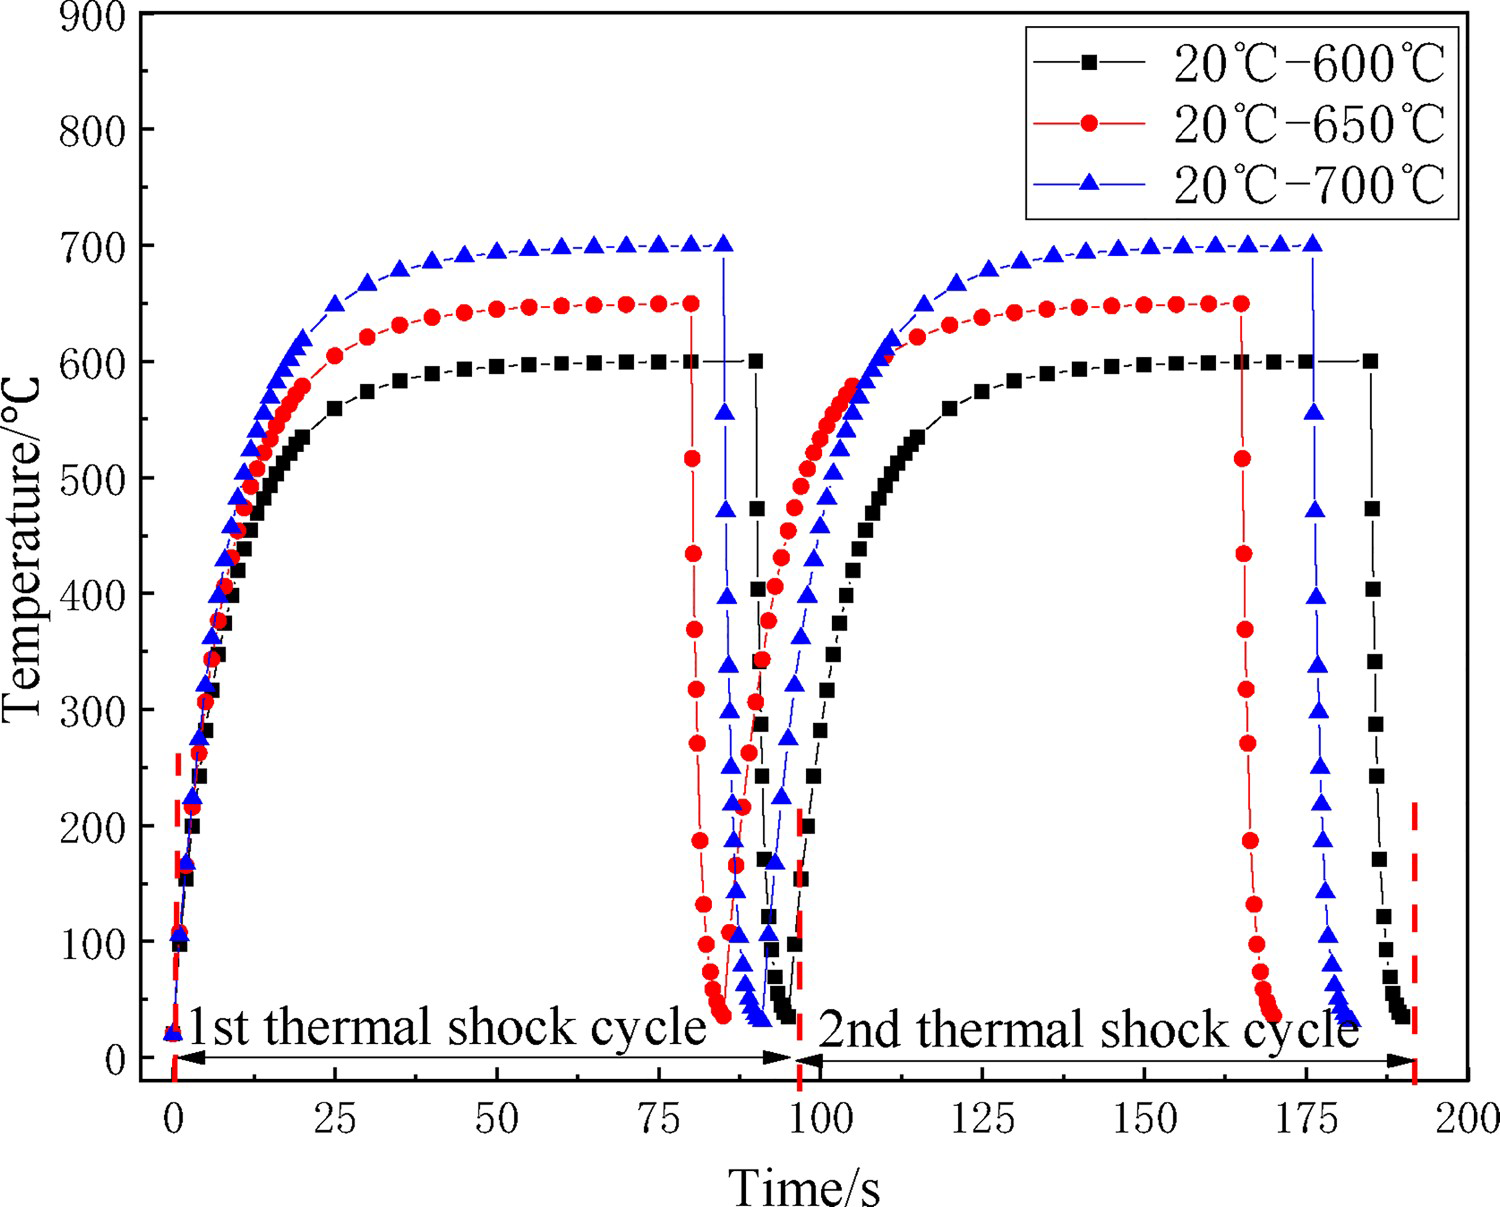
To conduct the experiment, radiant heating and water cooling were adopted. When thermal shock occurred, a 10 mm area from the notched end of the specimen was subjected to localised water cooling, with no restraint imposed on the notched end of the specimen. To ensure that the thermal stress is incurred from the self-restraint of the specimen under the thermal shock load, thermal shock tests were carried out within three different temperature ranges of 20°C–600°C, 20°C–650°C and 20°C–700°C and at varying cycles. Figure 3 shows the temperature change occurring at the notch of the sample.
Thermal fatigue crack growth model
The specimen will suffer a significant stress concentration at its notch, which will lead to fatigue cracks. The development of fatigue crack consists of three stages: crack initiation, crack propagation and fracture [6]. The process of crack propagation can be divided into microscopic small crack, physical small crack and long crack [7,8]. In the research of Li [9], the crack tip displacement
Thermal shock specimen. Temperature change at the notch of the sample. is defined as the driving force of fatigue cracks. On this basis, the macroscopic behaviour during crack propagation is associated with the microscopic mechanism. Therefore, the relationship between the crack growth rate and the crack tip displacement in the long crack stage is established [8,9], as shown in Equation (1):
 represents the long crack threshold of crack tip displacement. C and m are the constants.
In the process of crack propagation, the crack tip displacement
 is related to the plastic zone size
 at the crack tip [8], as shown in Equation (2):


 refers to the elastic modulus and
 denotes the Poisson's ratio.
In the course of cooling, tensile stress will arise in the crack tip, which facilitates the expansion of cracks [2,10]. Therefore, the relationship between the plastic zone size
 at the crack tip and the maximum stress intensity factor
 is established, as shown in Equation (4):
 represents the thermal stress ratio,
 indicates the ratio of the temperature rise and fall rate,
 refers to the stress intensity factor and
 stands for the yield stress.


 and
and
 represent the thermal stress in the course of heating and cooling process, respectively.
 and
and
 refer to the heating and cooling rate, respectively.
With Equations (1), (2) and (4) combined, the relationship between the crack growth rate and the stress intensity factor under thermal shock conditions can be expressed as Equation (7):
 represents the long crack threshold of stress intensity factor.
The relationship between stress intensity factor
 and crack length a can be expressed as Equation (8) [11]:
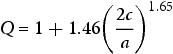
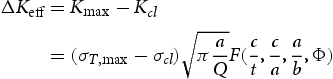
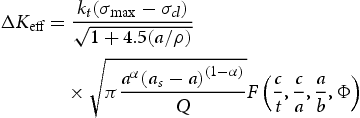
Q is the shape correction factor, as shown in Equation (9):
 represents the short crack threshold of stress intensity factor,
 indicates the limit of the microcrack size and
 denotes the fatigue limit of material.
In long crack stage, crack propagation will occur when the stress intensity factor
 exceeds the stress intensity threshold
 . Therefore, the relationship between the stress intensity factor threshold of the long crack and the stress intensity factor threshold of the small crack can be established [12,14], as shown in Equation (12):
 at the crack tip [15,16]. By taking into account Equation (8), the effective stress intensity factor considering crack closure can be expressed as Equation (13):
 represents the maximum thermal stress of unnotched specimen. The size of
 is determined by using finite element software.
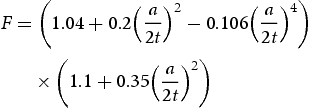
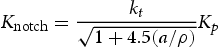
As the notch effect of a crack is closely related to the size of the notch, the calculation of the stress intensity factor for notched specimens can be performed using Equation (14) [17]:
 and
and
 represent the stress intensity factor of the notched and unnotched specimen, respectively,
 indicates stress concentration factor, and
 refers to notch root radius.
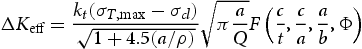
Taking Equations (13) and (14) into account, the effective stress intensity factor of notched specimens can be expressed as Equation (15):
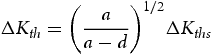
 is defined in this paper. At the time of thermal shock, crack arrest occurs when the crack size
 reaches
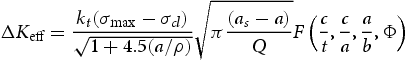
 . The driving force for crack propagation is:
Although the relationship between the crack growth rate and the crack length in the long crack stage can be well characterised by using Equations (7) and (16), it is still difficult to accurately indicate the crack growth rate in the small crack stage. Based on Hobson's theory [18], the microcrack structure influence coefficient
 is introduced in this paper into the established crack propagation model, and the small crack stress intensity factor threshold
 is applied to modify the long crack stress intensity factor threshold
 . In addition, a multi-scale thermal fatigue crack growth model is established to characterise the whole process of thermal fatigue crack propagation from small crack stage to long crack stage. The relationship between the effective stress intensity factor and the crack size is expressed as Equation (17):
 is the influencing factor for microcrack structure.
Taking into account Equations (7), (12) and (17), a multi-scale thermal fatigue crack growth model can be established to accurately predict the entire process of thermal fatigue crack growth.
Results and discussion
Thermal fatigue crack propagation
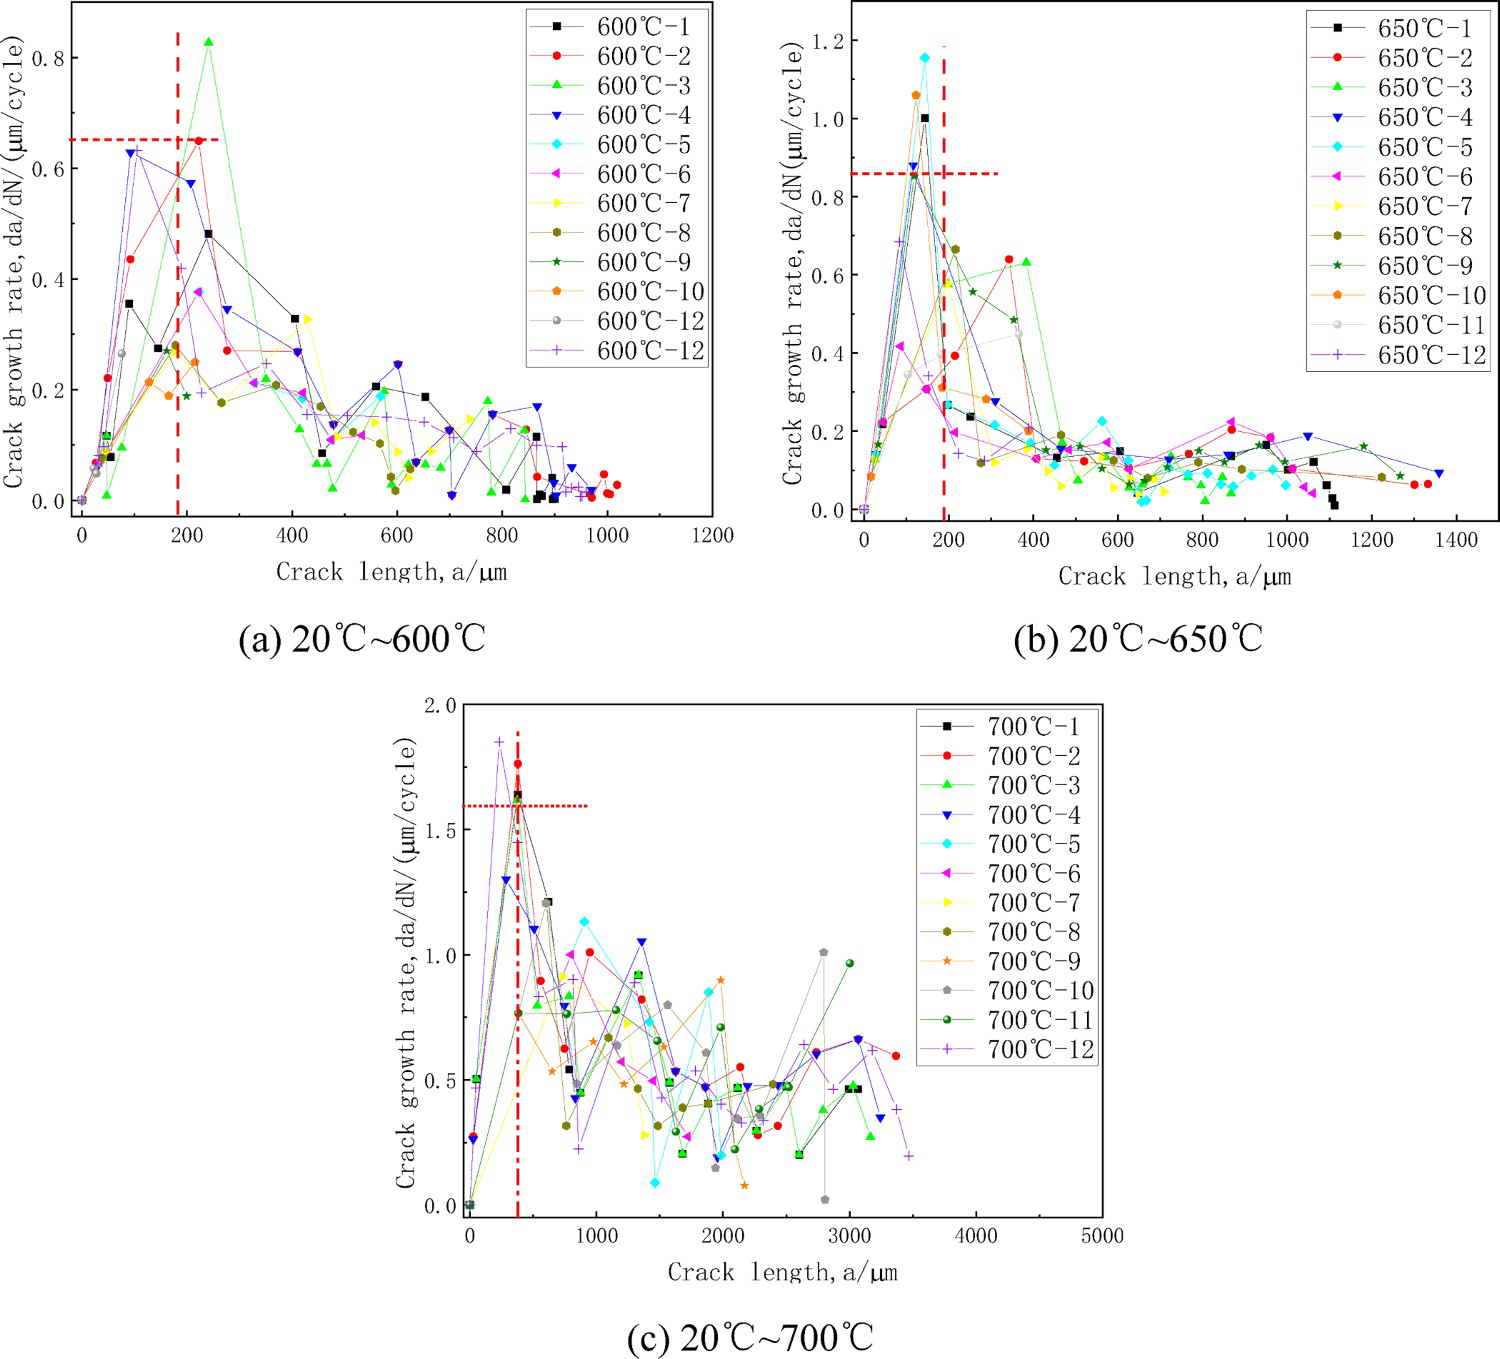
As revealed by the analysis of the experiment results, there are a large number of thermal fatigue cracks developing at the V-notch of the specimen, as shown in Figure 4. In this paper, the size of the main crack of the specimen under different thermal shock conditions was measured. On this basis, the main crack propagation curves under temperature cycle 20–600°C, 20–650°Cand 20–700°C were drawn, as shown in Figure 5. As illustrated in Figure 5, during the process of thermal shock experiment, the crack at the notch of the specimens will experience a brief accelerated growth. With the increase of the number of thermal shock cycles, the crack growth rate will slow down. The relationship between crack length and number of load cycles is typical ‘S-shaped’ curve. In order to facilitate the measurement of crack size, the cycle number reached when the fatigue crack length reaches three times the grain size (30 µm) of the material was taken as the crack initiation life [12]. In the process of thermal shock, the initiation and propagation of fatigue cracks are greatly affected by the upper limit temperature. When the lower limit temperature and the heating and cooling rate are the same, with the increase of the upper limit temperature, the initiation life of thermal fatigue cracks will decrease, and the crack growth rate will increase rapidly. As illustrated in Figure 5(a), when the upper temperature is 600°C, the average crack initiation life is 360. When the number of cycle is 9000 average crack length is 959 μm, the crack growth rate is approximately equal to 0, and crack arrest occurs. As illustrated in Figure 5(b), when the upper temperature is 650°C, the average crack initiation life is 200. When the number of cycle is 9000 average crack length is 1266 μm. As illustrated in Figure 5(c), when the upper temperature is 700°C, the average crack initiation life is 360. When the number of cycle is 6500 average crack length is 3468 μm.
Crack morphology at different thermal shock temperatures and number of cycles. Variation in main crack size with thermal shock cycle number.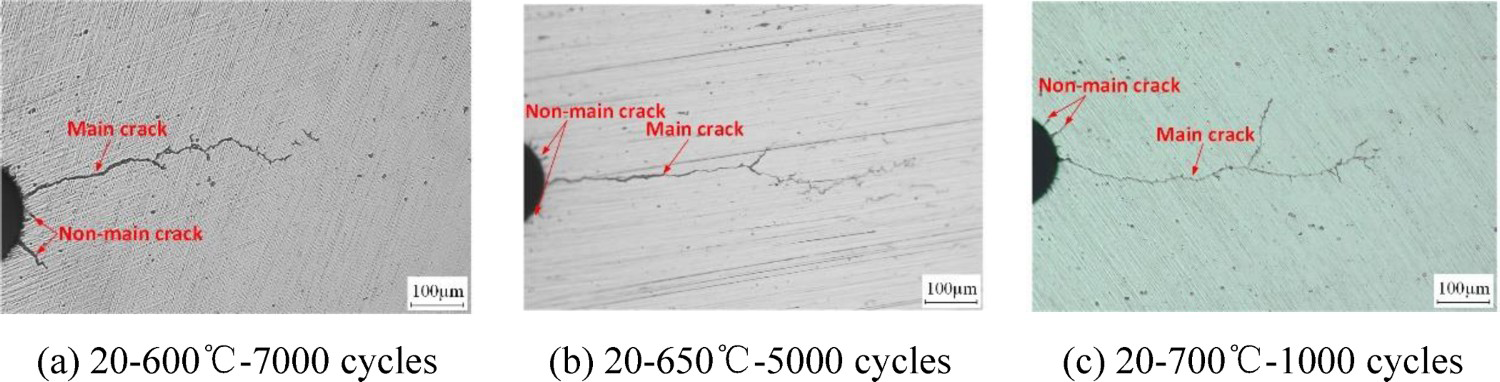
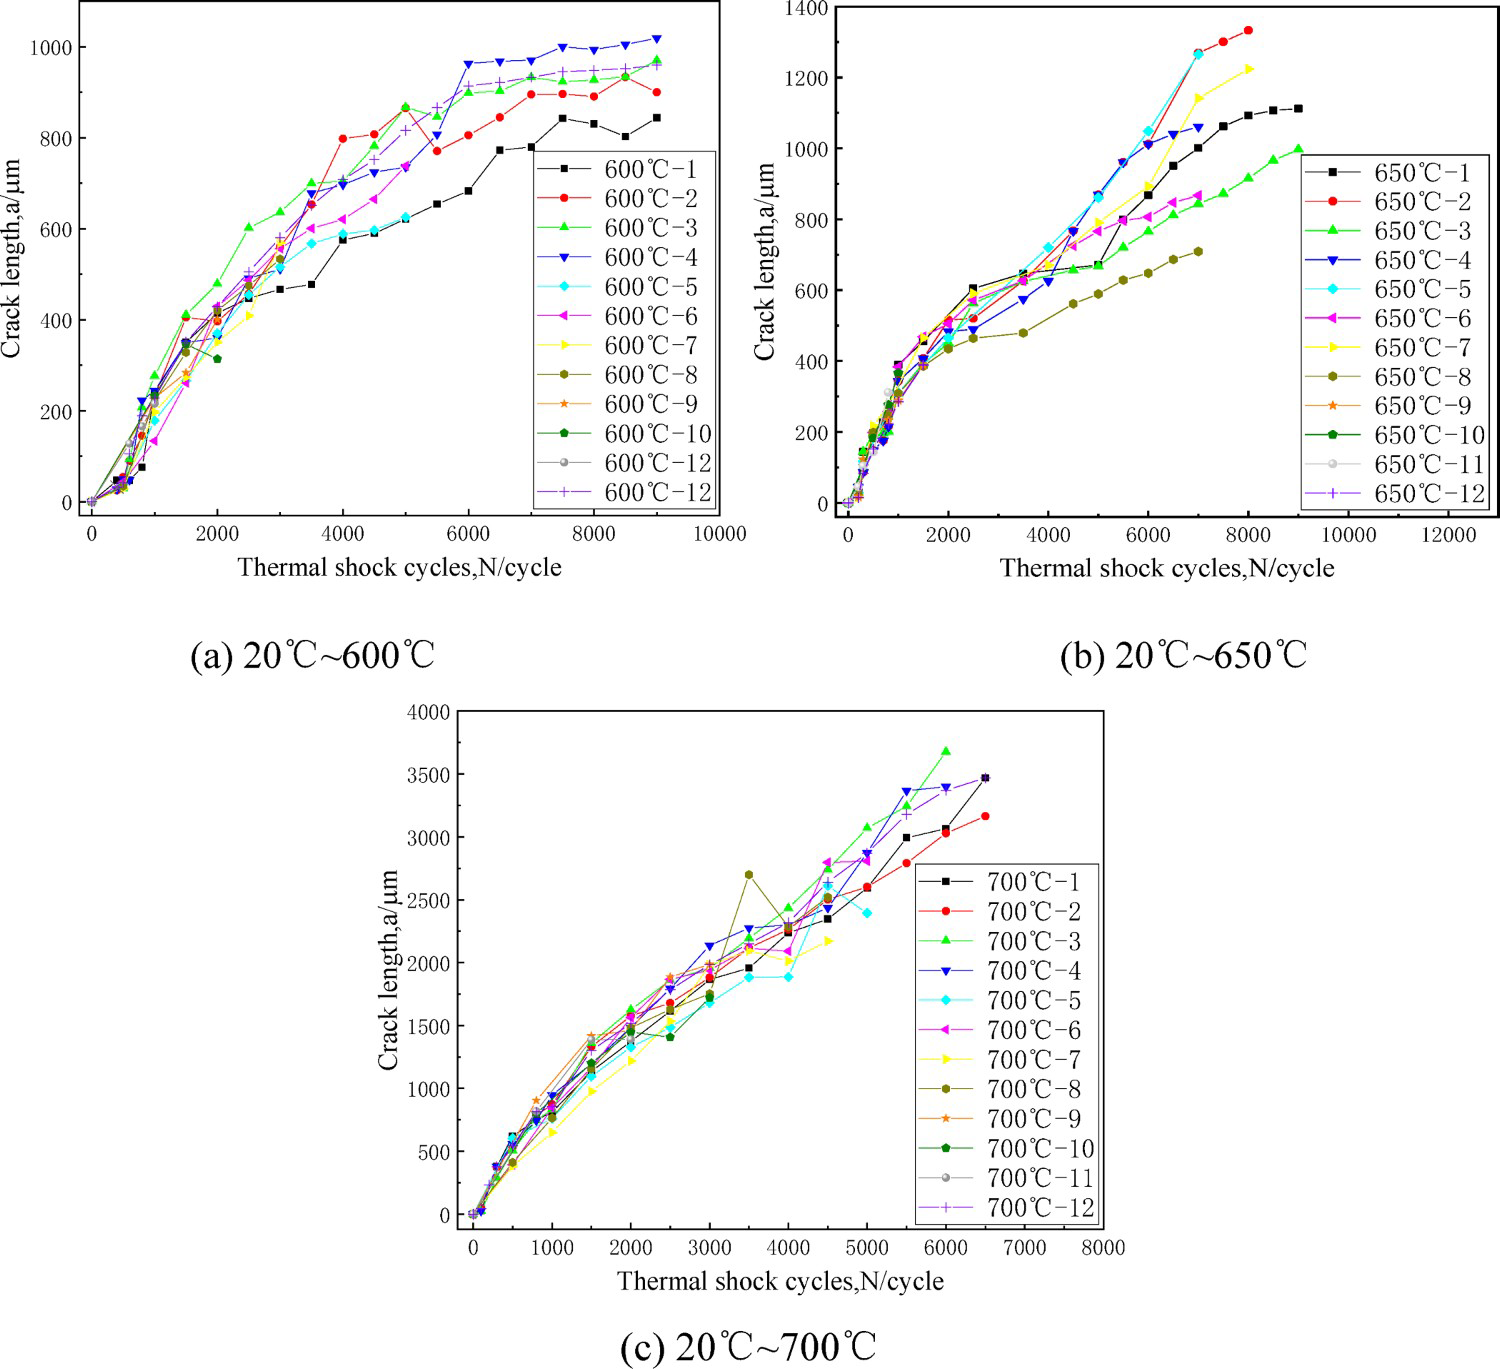
In the course of thermal shock, with the upper limit temperature increasing, the initiation life of thermal fatigue cracks will gradually decrease, and the growth rate of cracks will rise sharply. According to Figure 5, with the number of cycles increasing, there is a gradual decline in the change rates of all
 curves at the three thermal shock temperatures. This is attributed mainly to the fact that as crack grows, the crack tip shifts gradually away from the notch area of the specimen, the stress concentration effect diminishes at the tip, and the driving force of crack growth is reduced. When the thermal stress at the crack tip falls below the threshold stress of material, the main crack will stop growing, thus resulting in crack arrest. In the study of crack growth, the
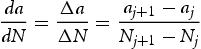
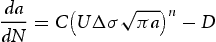
 relationship curve is usually used to characterise the relationship between the crack growth rate and the crack length. The crack growth rate was calculated using Equation (18) [19]:
 represents the difference in crack length,
 indicates the difference in the number of thermal shock cycles and
 refers to the crack length at the
 -th thermal shock.
The crack data measured by the test were calculated using Equation (18), and the
Variation in main crack growth rate with thermal shock cycles. curves at the three thermal shock temperature were drawn, as shown in Figure 6. It reveals that the crack growth experienced three stages: accelerated growth in the small crack stage, decelerated growth in the long crack stage and finally discontinued growth. When thermal shock occurs, there are two contributors to crack propagation. One is the thermal stress incurred by the temperature difference between the surface and the interior of the test area, and the other is the thermal stress caused by the restraint of the non-test area of the specimen to the test area. When there are no fatigue cracks initiated, the non-test area of the specimen constrains the test area the most, the thermal stress reaches its maximum. In this case, the stress concentration at the notch is high, and the driving force at the tip of the crack will be released rapidly after the initiation of the crack, which will accelerate the growth of the crack. According to the thermal shock test result with an upper limit temperature of 600°C shown in Figure 6(a), when the crack size is about 180 µm, the crack growth rate reaches its maximum, which is about 0.64 µm/cycle. Meanwhile, the crack growth rate gradually decreases with the number of thermal shock cycles and crack length increases. According to the thermal shock test result with an upper limit temperature of 650°C shown Figure 6(b), when the crack size is about 189 µm, the crack growth rate reaches its maximum, which is about0.84 µm/cycle. According to the thermal shock test result with an upper limit temperature of 700°C shown in Figure 6(c), when the crack size is about 375 µm, the crack growth rate reaches its maximum, which is about 1.56 µm/cycle.
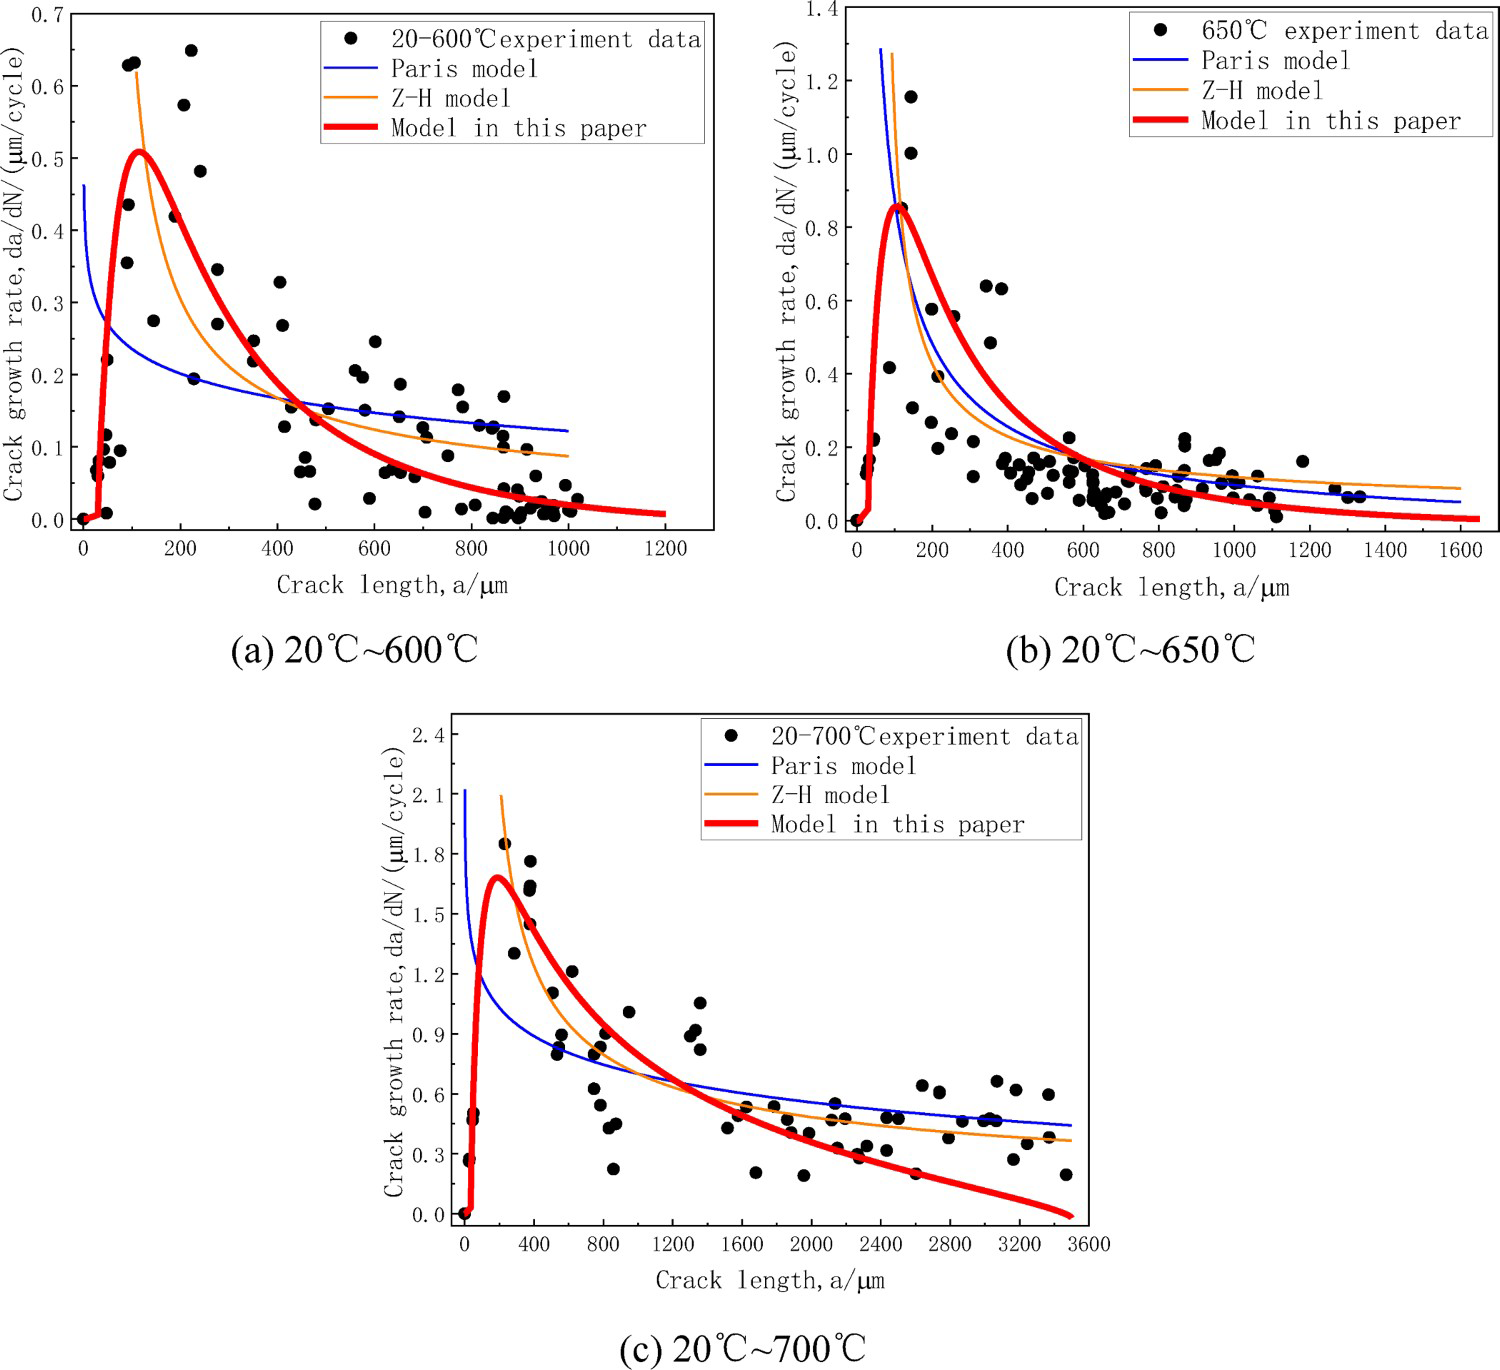
Thermal fatigue crack propagation model verification
For GH4169 alloy, its fatigue limit
Comparison in the prediction results of the impact crack growth rate of the model used in this paper, Paris and Z-H model. Thermal fatigue crack growth model parameters. is approximately 420 MPa [20]. The notch root radius
 is 100 µm and the stress concentration factor
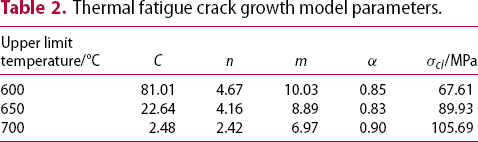
 is 4.2. The thermal stress at the notch of the specimen was calculated by using finite element software. When the upper limit temperature is 600°C, 650°C and 700°C, the maximum thermal stress reaches 722.56, 795.33 and 876.66 MPa, respectively. In this paper, Paris model, Z-H model and the thermal fatigue crack growth model were established to predict the crack growth rate at 20–600°C, 20–650°Cand 20–700°C, respectively, the results of which are shown in Figure 7. The set of all experiment data is shown as a black scatter plot. The parameters of the model in this paper are listed in Table 2.

 /MPa
/MPaParis model [21,22]:
 and
and
 are constants,
 indicates stress amplitude,
 denotes fatigue limit,
 is referred to as the influence factor of material microstructure and
 stands for the influencing factor of structure.
The red curves in Figure 7 represent the prediction curves of the model used in this paper. According to the figure, the Paris and the Z-H model produce relatively satisfactory prediction effects in the long crack stage, but the prediction effect is obviously distorted for the short crack. When the model established in this paper is adopted to predict the crack growth rate, under the experimental conditions of 20–600°C, 20–650°Cand 20–700°C, the correlation index between the predicted data and the experimental data is 0.91, 0.92 and 0.95, respectively. Therefore, the model is applicable to predict the growth rate of the thermal fatigue crack in the whole process.
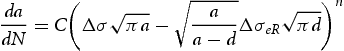
The model presented in this paper can predict the crack growth rate of thermal fatigue crack from small crack stage to long crack stage under thermal shock loading with good accuracy. The relationship between thermal fatigue crack length and cycle number can be obtained by integrating the crack growth rates at the small crack stage and the long crack stage, as illustrated in Figure 8. In the small crack stage, the prediction curve and the experimental result have a high degree of coincidence, which indicates that the model in this paper has a high prediction accuracy in the small crack stage. It can be seen from Figure 8(a,c) that, when the upper limit temperature is 600°C and 700°C, the predicted cycle number-crack length curve finds good agreement with the experiment result. As shown in Figure 8(b), although the prediction error of the test results with the thermal shock upper limit temperature of 650°C is relative large, the prediction curve is above the experiment results, and the prediction results are conservative.
Predicted crack length-cycle number curves compared to experimental data.
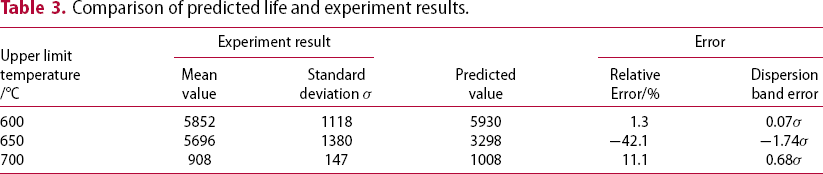
Comparison of predicted life and experiment results.
Conclusion
When the upper limit temperature of thermal shock reaches 600°C, 650°C and 700°C, the average initiation life of fatigue crack is 360 cycles, 200 cycles and 60 cycles, respectively. Besides, the initiation life of cracks at 600°C is about six times that at 700°C. During the course of thermal shock, the main crack at the notch experienced three different stages: accelerated growth in the small crack stage, decelerated growth in the long crack stage and finally discontinued growth. Accordingly, the respective maximum growth rate of main cracks is about 0.64 µm/cycle, 0.84 µm/cycle and 1.56 µm/cycle. The maximum crack growth rate at 700°C thermal shock is about 2.4 times that at 600°C. A multi-scale thermal fatigue crack growth model capable to characterise the whole process of crack propagation under thermal shock load is established and verified against experimental data. According to the research results, the prediction results of the crack growth rate are more accurate compared to the Paris and Z-H model, and it can be used to characterise the crack growth rate of components under thermal shock loads.
Footnotes
Acknowledgements
The author acknowledges the editors and reviewers for their valuable comments and suggestions, which is beneficial to improve the quality of the manuscript.
Disclosure statement
No potential conflict of interest was reported by the author(s).