
Abstract
Herein, an Mg–6Zn–2Ce–0.6Zr alloy was prepared via the extrusion–shear process. The dynamic compression mechanical performance and mechanism of microstructural evolution of the alloy in a strain rate range from 500 to 2500 s−1 were investigated. The dynamic compression performance of the alloy increased with the strain rate. The electron backscatter diffraction analyses revealed that the angle between the c-axis and the extrusion direction of most grains changed from 90° to 180° after dynamic compression. The deformation can be attributed to the extension twining, basal slip, and prismatic slip. The dynamic deformation mechanism was studied and the fracture mechanism under a high strain rate was determined by analysing the temperature rise and absorbed energy density.
Introduction
With the rapid advancement of science and technology, the development of new lightweight materials has significantly changed our daily life. Magnesium and magnesium alloys have attracted extensive attention due to advantages like easy processing, high specific strength, and excellent thermal conductivity. Magnesium alloys are among the lightest materials and are becoming an important area of research for electronics, aerospace, automotive, and biomedical applications [1-3].
Dynamic mechanical properties are the mechanical properties of materials at extremely high strain rates. Compared with the static state, the dynamic state of a material is characterised by a large load intensity and a short action time; thus, the inertial action of the material in the dynamic state cannot be ignored [4]. Li et al. [5] found that the yield strength of the alloy after dynamic compression was significantly higher than that measured after quasistatic compression. Zhang et al. [6] studied the dynamic compression behaviour of multilayer composite textured (MCT) AZ31B at a strain rate of 1326–5107 s−1. Their results showed that dynamic recrystallisation (DRX) occurred in the sample with increasing the strain rate, resulting in a very high absorption energy density of the sample. The fracture behaviour of the sample changed from brittle to ductile. This contrasts with the typical brittle fracture mode of magnesium alloys under quasistatic loading. Therefore, it has become urgent to study the mechanical properties, deformation, and fracture failure mechanism of magnesium alloys under dynamic loading.
The main dynamic deformation mechanisms of magnesium alloys are dislocation slip, twining and DRX. Watanabe et al. [7] observed deformation twins and prismatic slips in ZK60 1800 s−1. At the room temperature, only one slip plane and three slip systems were found, which cannot accommodate the strain along the c-axis direction due to the close-packed hexagonal structure of this alloy. The plastic deformation of ZK60 was found to predominantly depend on the coordinated action of slips and twins [8]. Since slip systems in magnesium alloys are very limited, and dislocations can easily accumulate; thus, the dislocation density required for recrystallisation is quickly reached. By contrast, the stacking fault energy of magnesium and magnesium alloys is lower, and it is difficult for extended dislocations to gather; therefore, it is difficult for the system to slip and climb, and the dynamic recovery (DRV) speed is low, which is conducive to recrystallisation. In addition, if the diffusion rate of grain boundaries is higher, it is easier for grain boundaries to absorb dislocations, thus, accelerating the DRX process. In contrast to slip and twinning, DRX generally occurs at high temperatures [9,10]. He et al. [11] used the Kocks-Meching model to analyse the DRX behaviour of the ZK60 alloy from the strain hardening behaviour and found that DRV occurred at the initial stage of thermal deformation, and the microstructure changed to the recrystallisation structure with increasing strain.
Mg–Zn–Zr alloys are widely used in industrial production due to their excellent strength, plasticity, and corrosion resistance [12]. However, since these alloys are affected by a high zinc content, high hot tearing tendency, and poor heat resistance, researchers have attempted to refine their grains and improve their creep resistance, and casting performance by adding a certain amount of rare-earth elements [13]. Ashrafizadeh et al. [14] pointed out that adding Y, Gd, La, and other rare-earth elements to a Mg alloy can improve its fluidity, heat resistance, creep resistance, corrosion resistance, and it can also easily undergo dehydrogenation and oxygenation. Yu et al. [15] found that the ZK60 alloy could easily crack during extrusion at a temperature higher than 300°C, while no hot cracks were found when the alloy was extruded at 400°C after the addition of Ce. The addition of Ce can result in the precipitation of a large number of second phases in the alloy, which generally has a higher melting point and can improve the high-temperature performance of the alloy. Huang et al. [16] found that the addition of the rare-earth element Gd to ZK60-series alloys could refine the alloy grains and reduce the coarse eutectic MgZn phase content, thus, effectively improving the casting properties and high-temperature performance of the alloys and enhancing their corrosion resistance.
In this study, an Mg–6Zn–2Ce–0.6Zr alloy was prepared via extrusion–shear (ES), combining the traditional extrusion and the equal diameter channel angular extrusion with route L. The dynamic compressive mechanical properties of the extruded Mg–6Zn–2Ce–0.6Zr alloy were tested along the extrusion direction (ED), using a split Hopkinson pressure bar (SHPB). In addition, the impact of different high strain rates on the dynamic compressive properties was investigated. To better understand the microstructural evolution and fracture mechanism, the temperature rise and absorption energy density caused by deformation at high strain rates were calculated. This provides the necessary data and design basis for the lightweight development of automobiles and spacecrafts.
Materials and experimental procedures
Materials
The Mg–6Zn–2Ce–0.6Zr alloy was prepared using an electronic resistance furnace equipped with a silicon temperature controller. First, pure Mg was melted at 680°C; then, pure Zn, Mg–30wt-%Ce, and Mg–30wt-%Zr master alloys were added to molten magnesium at 700°C. N2 + SF6 gas was introduced into the furnace to protect the alloy during the melting process, and alloy liquid was stirred mechanically for 5 min. Then, the molten alloy was cast in a permanent mould in N2 + SF6 atmosphere, and the as-cast alloy, with a diameter of 100 mm, was obtained after air cooling. Subsequently, the Mg–6Zn–2Ce–0.6Zr ingot was homogenised at 420°C for 16 h and cooled in air. The ingot was then cut into a cylinder with a diameter of 70 mm using a wire-cutting machine. The cylindrical ingot was extruded into a 20 mm-diameter bar using the ES mould. Before the ES process, the cylindrical ingot and the ES mould were heated to 450°C and held at this temperature for 2 h. The ES mould is characterised by an extrusion ratio of 12.5 and an extrusion angle of 90°. Figure 1 shows a schematic diagram of the ES mould. Finally, the sample for the dynamic compression tests, with dimensions of Φ8 × 6 mm, was cut along the ED of the extrusion rod using a wire cutter.
Schematic diagram of mould and sample cutting for the ES device.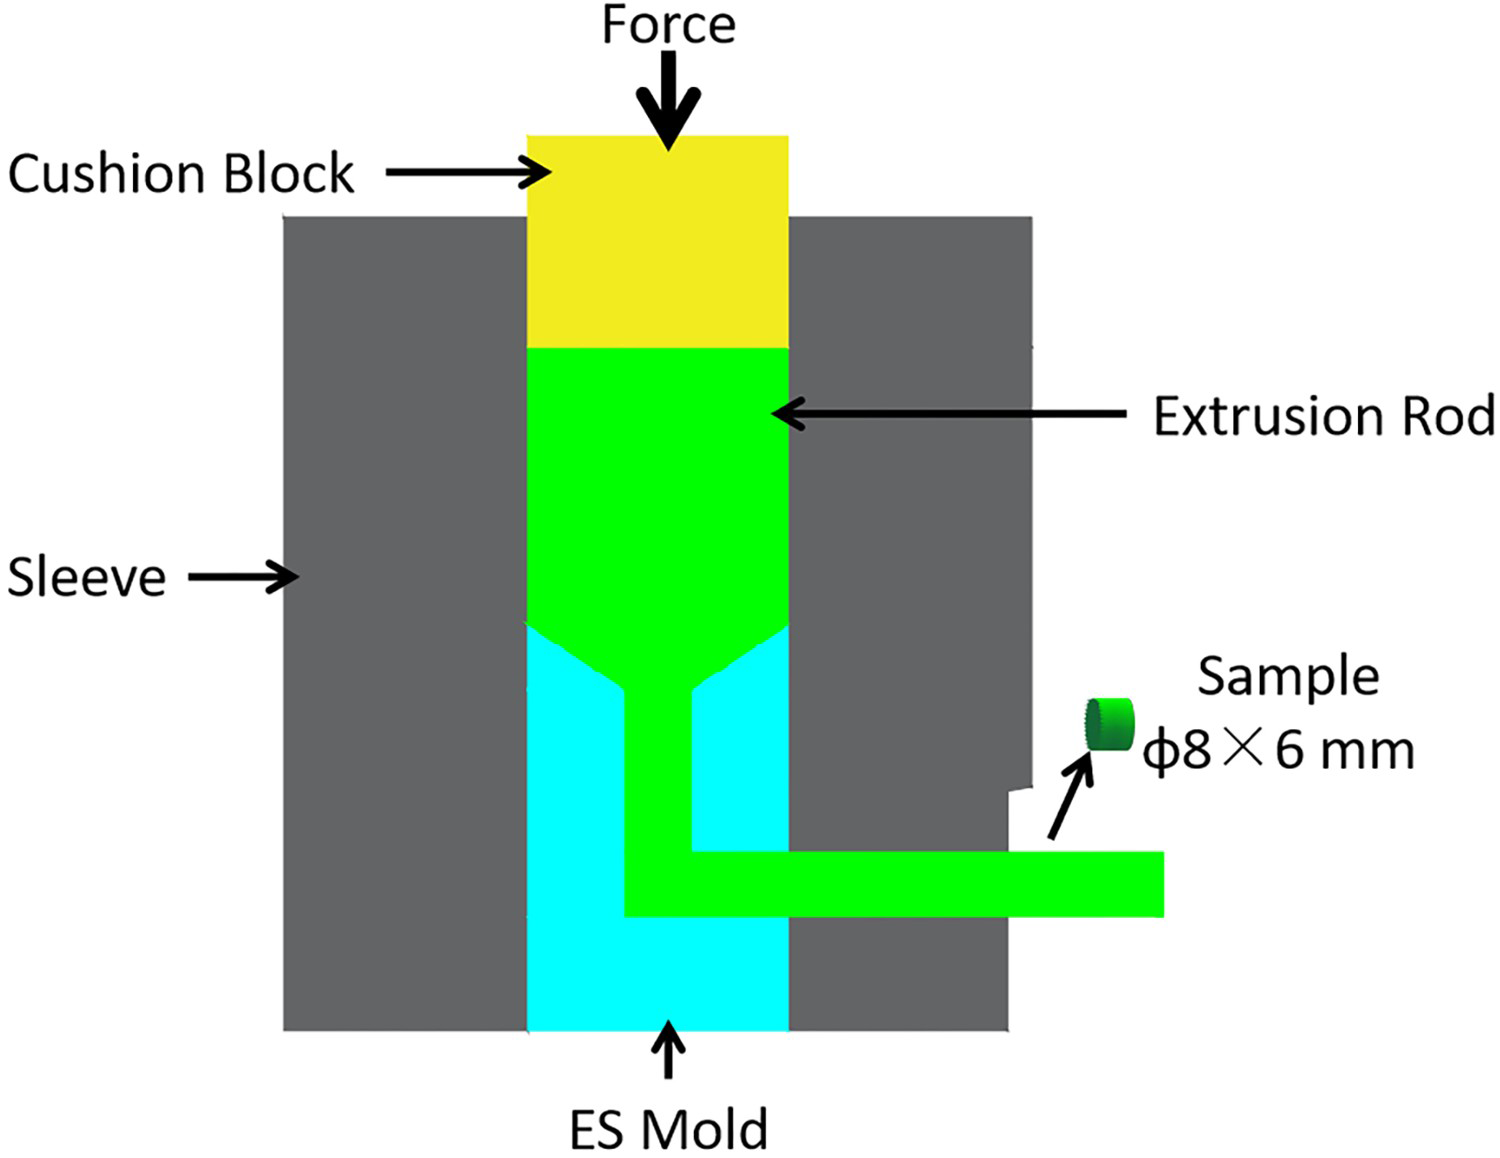
Dynamic compression tests
The dynamic compression of the Mg–6Zn–2Ce–0.6Zr alloy, along the ED, was measured using an SHPB device, as shown in Figure 2. All the bars were made of 35CrMnSi high-strength alloy steel, the incident bar and the transmission bar size was Φ12.5 × 900 mm and the impact bar size was Φ12.5 × 150 mm. A detailed description of the experimental setup and procedures can be found in previous work [17]. During the experiment, we connected BX120-3AA high-precision resistance strain gauge as a half-bridge circuit, different incident waves, reflected waves, and transmitted waves were sensed and transmitted with the strain gauge by controlling the depth and pressure of the impact bar. The incident waves, reflected waves, and transmitted waves were processed by the SHPB software to obtain the stress, strain and strain rate. SHPB software calculates the strain rate according to the following formula.
Schematic diagram of the SHPB apparatus.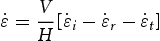
 is strain rate,
 ,
,
 , and
, and
 are pulse signal produced by incident wave, reflected wave, and transmitted wave, V is the elastic wave velocity of the bar, and H is the initial height of the sample. At room temperature, five groups of dynamic compression experiments were conducted at strain rates ranging from 500 to 2500 s−1.
Microstructural evolution analysis
Before the compression experiments, the microstructure of the alloy in the initial state and its impact fracture were investigated via scanning electron microscopy (SEM, S-3400N) and, X-ray diffraction (XRD, D/max III A). After the compression experiments, energy-dispersive spectroscopy (EDS; S-3400N) was performed to analyse the precipitation phase after adding Ce. The data were obtained via electron backscatter diffraction (EBSD, Oxford HKL) at a step size of 0.72 µm. The microstructure changes under dynamic loading were analysed using the Channel 5 software package. Additionally, transmission electron microscopy (TEM, JEM-2100) investigations were conducted to study the deformation mechanism of the samples after a high-speed impact.
Results and discussions
Initial microstructure
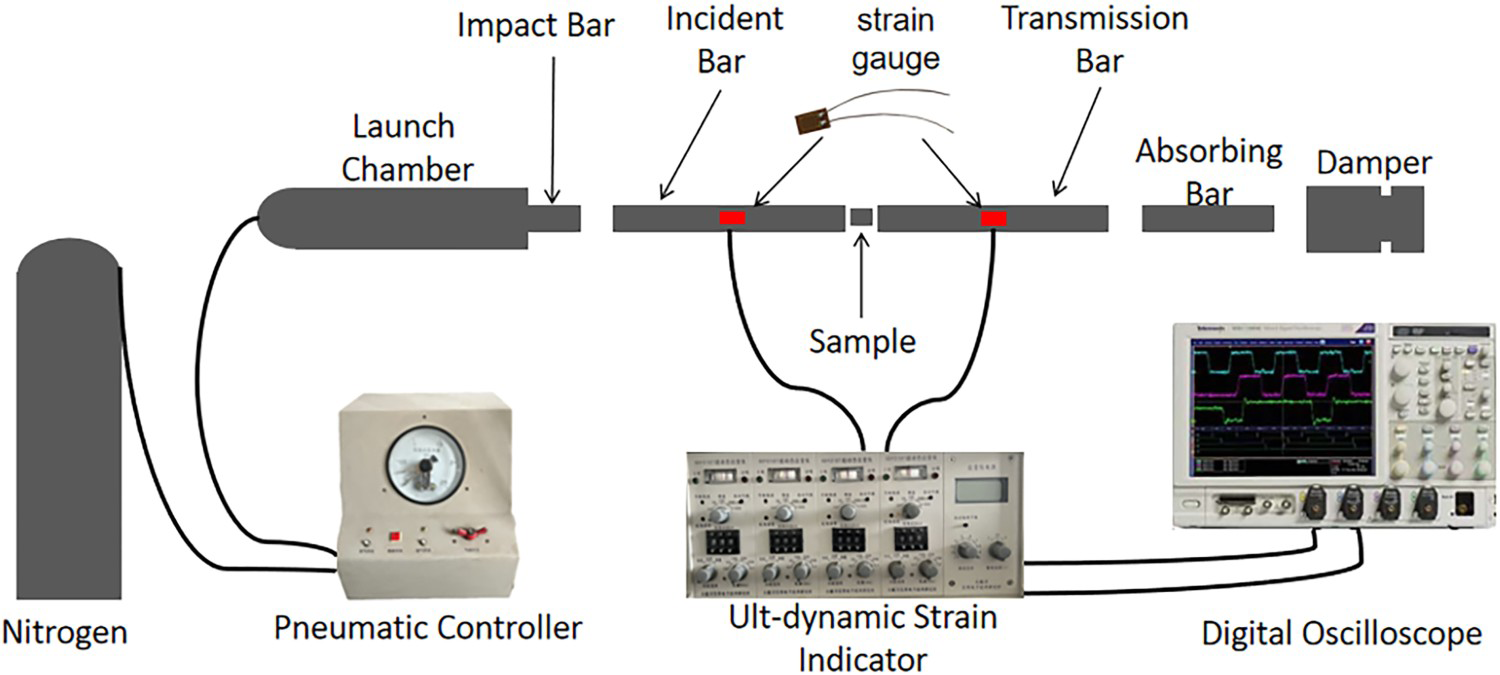
The SEM and XRD results of the ES Mg–6Zn–2Ce–0.6Zr alloy are shown in Figure 3. The white precipitates are arranged in continuous lines, which is parallel to the ED, as shown in Figure 3(a). There are two types of precipitated phases: one phase is characterised by small, white, bright dots, while the other phase features dots with a large, irregular shape. The EDS spectra show that the precipitated phases mainly consist of Mg, Zn and Ce, as shown in Figure 3(b,c). According to the XRD patterns (Figure 3(d)) and EDS spectra, these tiny white precipitates correspond to the (MgZn)11Ce phase. This is consistent with the results of Huang et al. [18] and Jeong et al. [19], who reported that the (MgZn)11Ce phase formed in the Mg–Zn alloy when Ce was added. These large white precipitates with an irregular shape are attributed to the Mg7Zn3 phase. Liang et al. [20] also identified the formation of the Mg7Zn3 phase in the Mg–6Zn–0.6Zr–1Y alloy.
(a) Initial microstructure, (b) and (c) EDS results and (d) XRD pattern of the precipitated particles.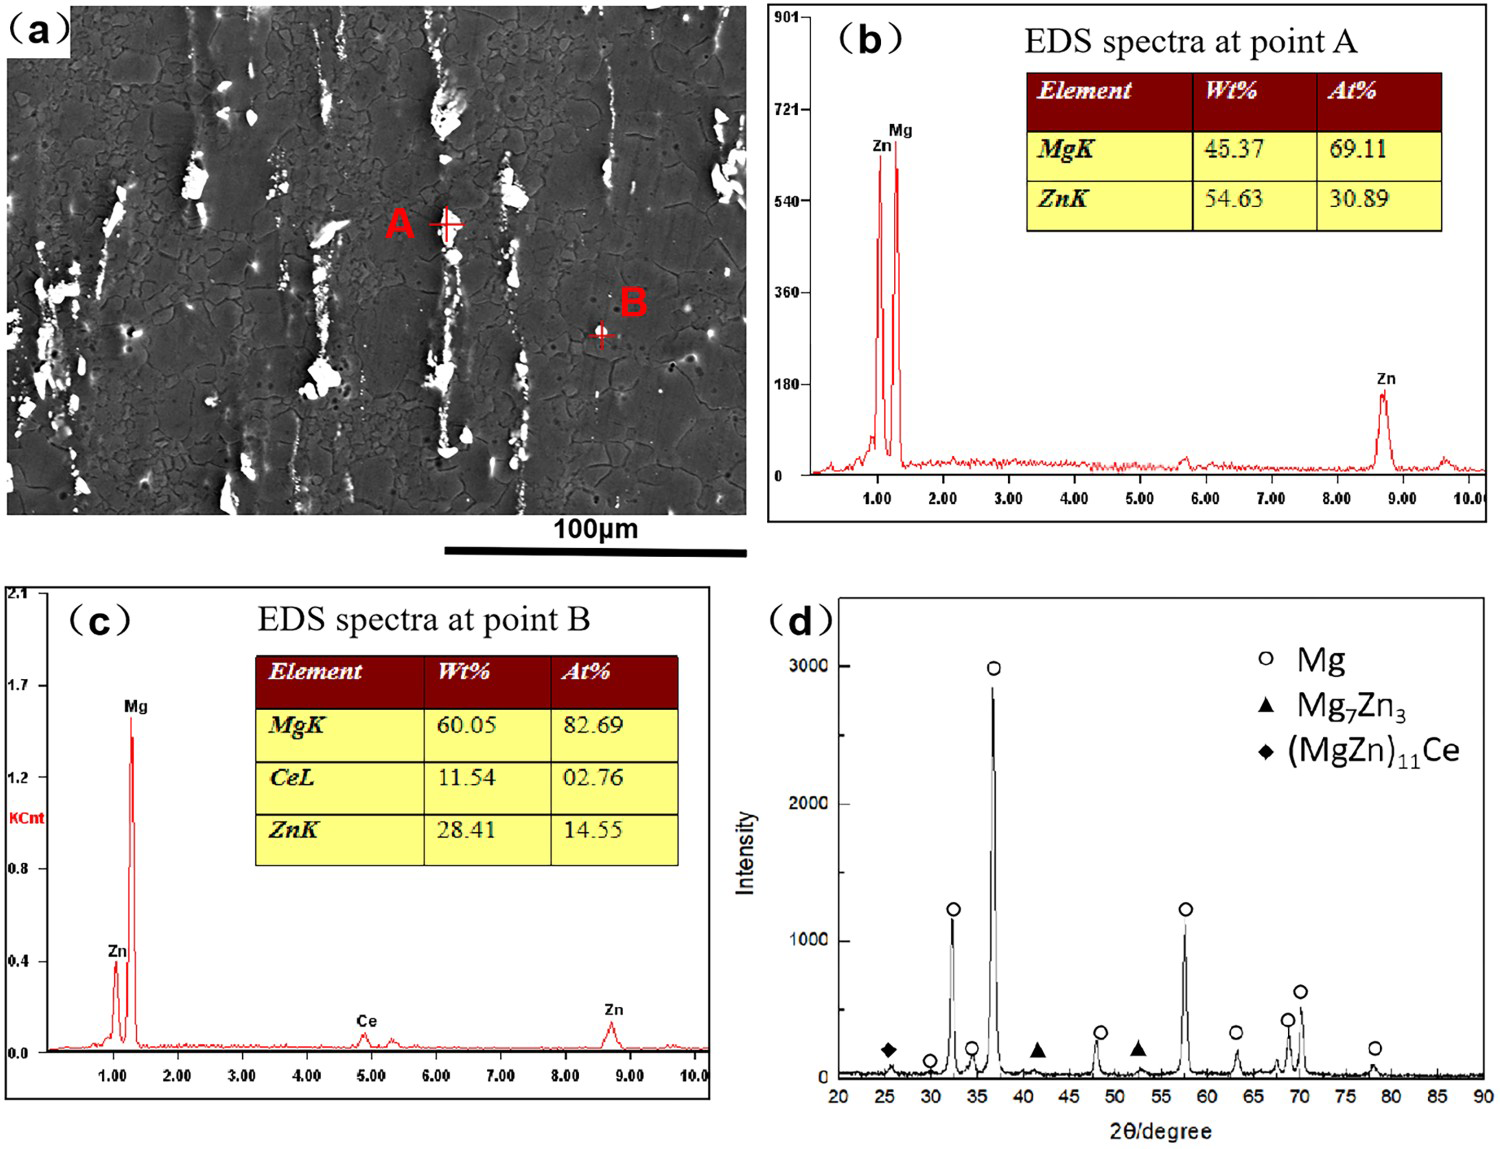
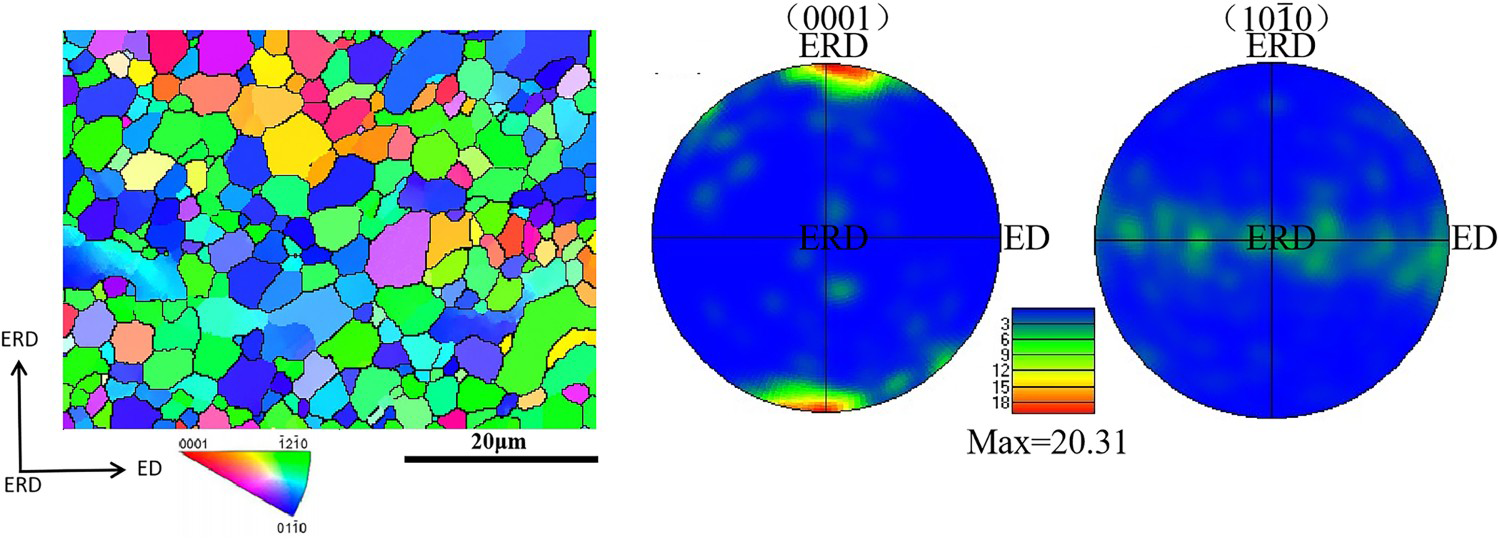
The inverse pole figure (IPF) map, as well as the (0001) and
IPF map and PFs texture composition of the initial sample. pole figures (PFs) obtained via EBSD, are shown in Figure 4. The Mg–6Zn–2Ce–0.6Zr alloy underwent a complete DRX during the ES process; so it shows fine equiaxed grains. The average grain size of the alloy is 3.04 µm. From the PFs of the initial extruded alloy, it can be found that the c-axis of most grains is in the ERD direction of the sample, i.e. the (0001) basal plane of the alloy is parallel to the ED.
Dynamic compression properties
Figure 5 shows the photographs of the samples after being subjected to different strain rates. The strain in the sample increased gradually with an increasing strain rate. Sample fragmentation occurs at a strain rate of 2500 s−1.
Photograph of samples after dynamic compression at different strain rates.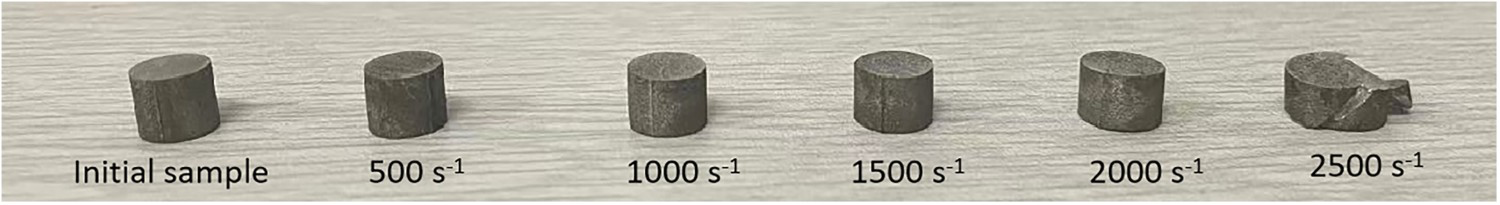
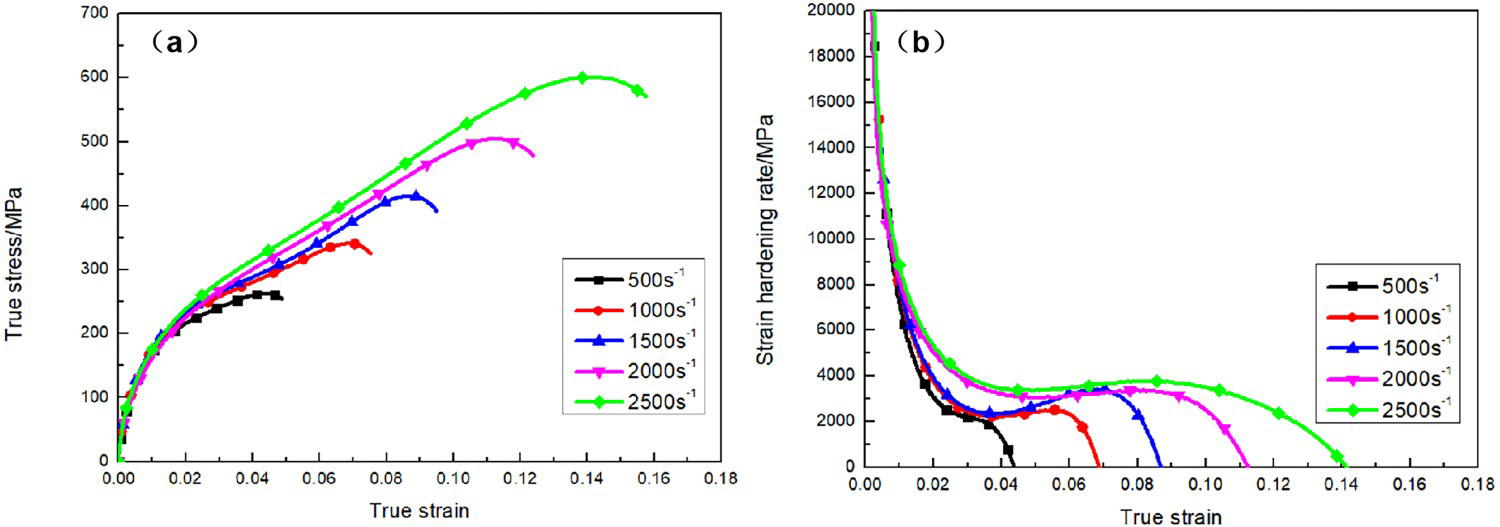
Figure 6 shows the compression performance curve of the experimental alloy at different strain rates. As shown in Figure 6(a), all the compression curves exhibit an S shape. Several studies have reported that this S shape is a typical feature of the texture of magnesium alloys due to the activation of the
True stress–strain curves and strain hardening curves of the Mg–6Zn–2Ce–0.6Zr sample at different strain rates. extension twining at the early deformation stage [21]. In the range of strain rates studied, yield stress and peak flow stress are positively correlated with the strain rate, reaching 232 and 601 MPa, respectively, at a strain rate of 2500 s−1. Figure 6(b) shows the strain hardening curves of the Mg–6Zn–2Ce–0.6Zr samples, which are obtained by derivation of stress–strain curves. The trends of the different strain hardening rate curves are pretty similar. Numerous studies have indicated that the strain hardening rate curve of magnesium alloys under dynamic load consists of three stages. In the first stage, the strain hardening rate decreases sharply due to the activation of the basal slips and the extension twins. In the second stage, the activated twining interactions and dislocation plugs cause the strain hardening rate to increase and reach a peak. In the third stage, due to the dislocation plug at the twin boundaries, the stress is highly concentrated, which results in the ability of twining to hinder dislocation movement; thus, the strain hardening rate declines slowly [22-24]. This indicates that extension twining and dislocation slip are the main factors affecting the mechanical properties of the alloy during dynamic compression deformation.
Microstructural evolution
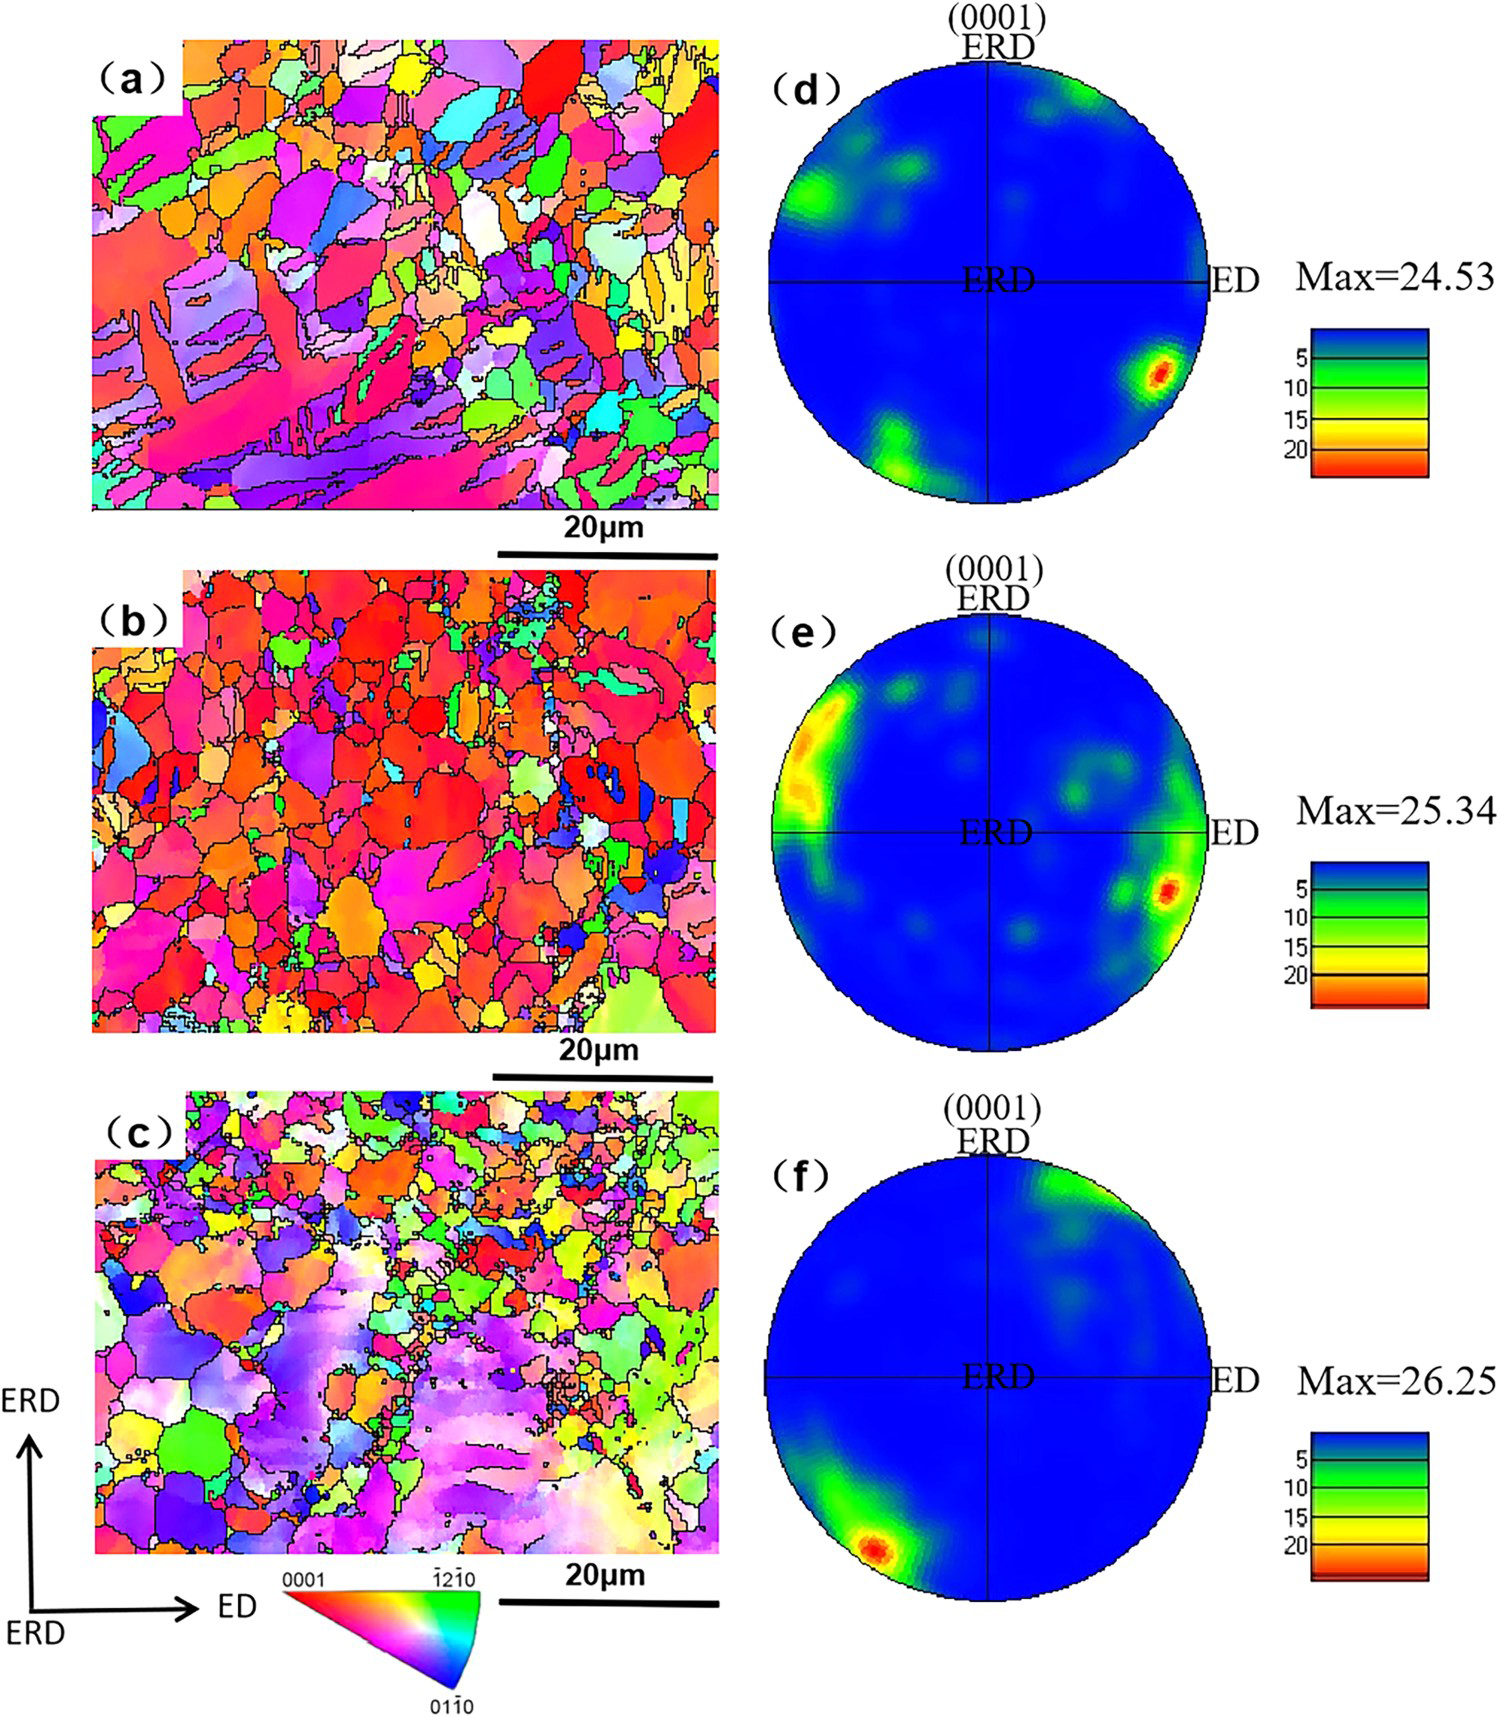
The microstructure evolution at different strain rates was explored via EBSD. Figure 7 shows the EBSD maps and (0001) PFs observed at different strain rates. Compared with the EBSD map and PFs of the initial sample, the texture changed significantly after the sample was subjected to dynamic compression deformation at high strain rates, and the c-axes of most grains rotated toward the ED as the strain rate increased. In other words, the c-axes of the alloy after dynamic compression are parallel to the ED, i.e. the (0001) texture is perpendicular to the ED, and the crystal structure undergoes a nearly 90° rotation after dynamic compression. Figure 7(a) shows that a large number of lamellar twins appear after dynamic loading of the sample at a strain rate of 500 s−1; these twins are identified as the
EBSD maps and (0001) polar figures (a) (d) 500 s−1, (b) (e) 1500 s−1, (c) (f) 2500 s−1. extension twins. In general, the
 extension twins are the main deformation mechanism of extruded magnesium alloys at compression along the ED [25,26]. However, the amount of twins decreases at strain rates of 1500 and 2500 s−1, only a few grains have small twins as the twins grow and almost envelope the entire magnesium alloy matrix, and some DRX grains were found, as shown in Figure 7(b,c). Thus, with the increase of the strain rate, the fraction of twins in the sample decreases, and fine DRX grains appear. Figure 7 also shows that the texture intensity increases with increasing strain rate.
The local misorientation of the Mg–6Zn–2Ce–0.6Zr alloy at different strain rates is shown in Figure 8. Figure 8(a) shows that there are very few obvious local misorientations in the equiaxed grains of the initial extruded alloy; this is due to the fact that the misorientations generated during the hot extrusion are almost completely eliminated by the DRV and the DRX [27]. Figure 8(b–d) shows the local misorientation of the Mg–6Zn–2Ce–0.6Zr alloy at different strain rates. The local misorientation becomes more pronounced with the increase in the strain rate. At the same time, due to the additional stress generated at the grain boundaries, the local misorientation rate at the grain boundaries is high [28]. The local misorientation can be used to assess the density of geometrically necessary dislocations (GNDs), calculated as follows [29]:
Local misorientation of Mg–6Zn–2Ce–0.6Zr samples for the (a),(e) initial sample, and at different strain rates: (b),(f) 500 s−1; (c),(g) 1500 s−1; and (d),(h) 2500 s−1. GND values of the Mg–6Zn–2Ce–0.6Zr sample at different strain rates.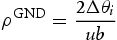
 is the angle of the local misorientation, u is the unit lengths of a point and b is the Burgers vector, in this study, u = 400 nm, b
Mg = 3.21 × 10⁻¹⁰ m. The
is the angle of the local misorientation, u is the unit lengths of a point and b is the Burgers vector, in this study, u = 400 nm, b
Mg = 3.21 × 10⁻¹⁰ m. The
 values of the initial extruded sample and the samples compressed at strain rates of 500, 1500, and 2500 s−1 were calculated to be 0.197, 0.530, 0.781, and 1.080, respectively. Figure 9 shows that the corresponding ρGND values are 3.07 × 10¹⁵, 8.26 × 10¹⁵, 1.22 × 10¹⁶, and 1.68 × 10¹⁶ m−2, respectively. The results indicate that the high strain rate and the large plastic deformation lead to the accumulation of dense dislocations in the material, which results in an improved strain hardening rate. This is consistent with the conclusion of Kundu et al. [29] that the rise in strain hardening rate in interstitial free steel at small plastic strains is caused by the increase in dislocation density.
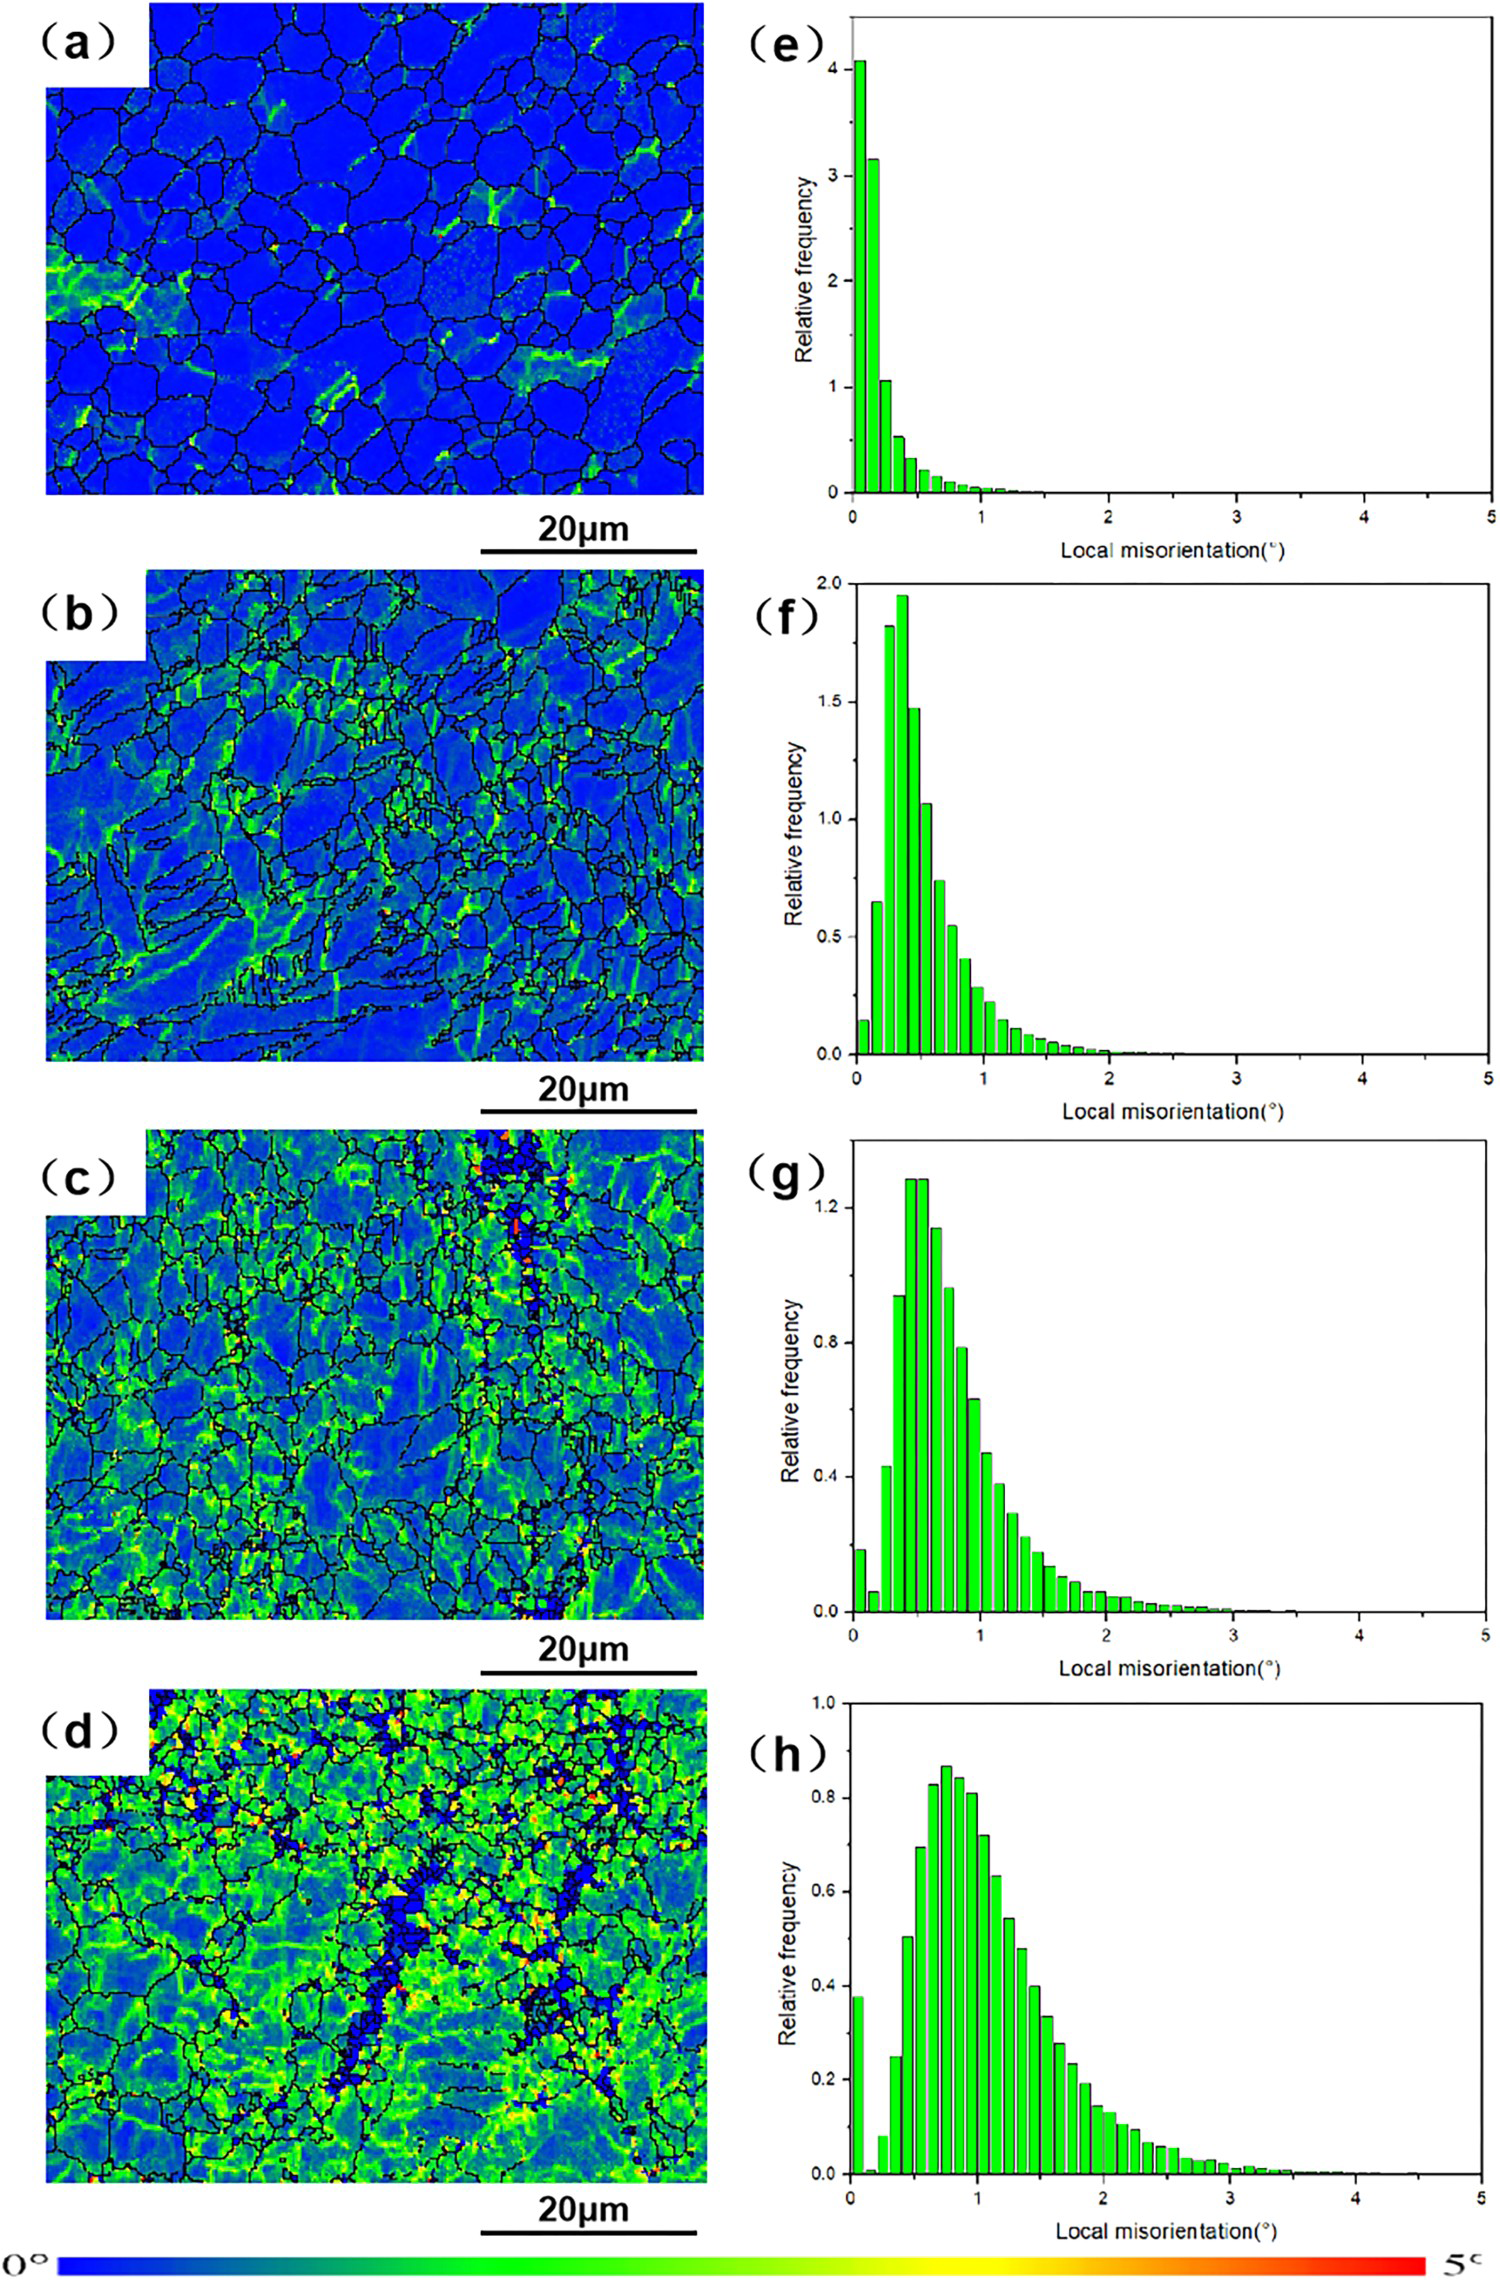
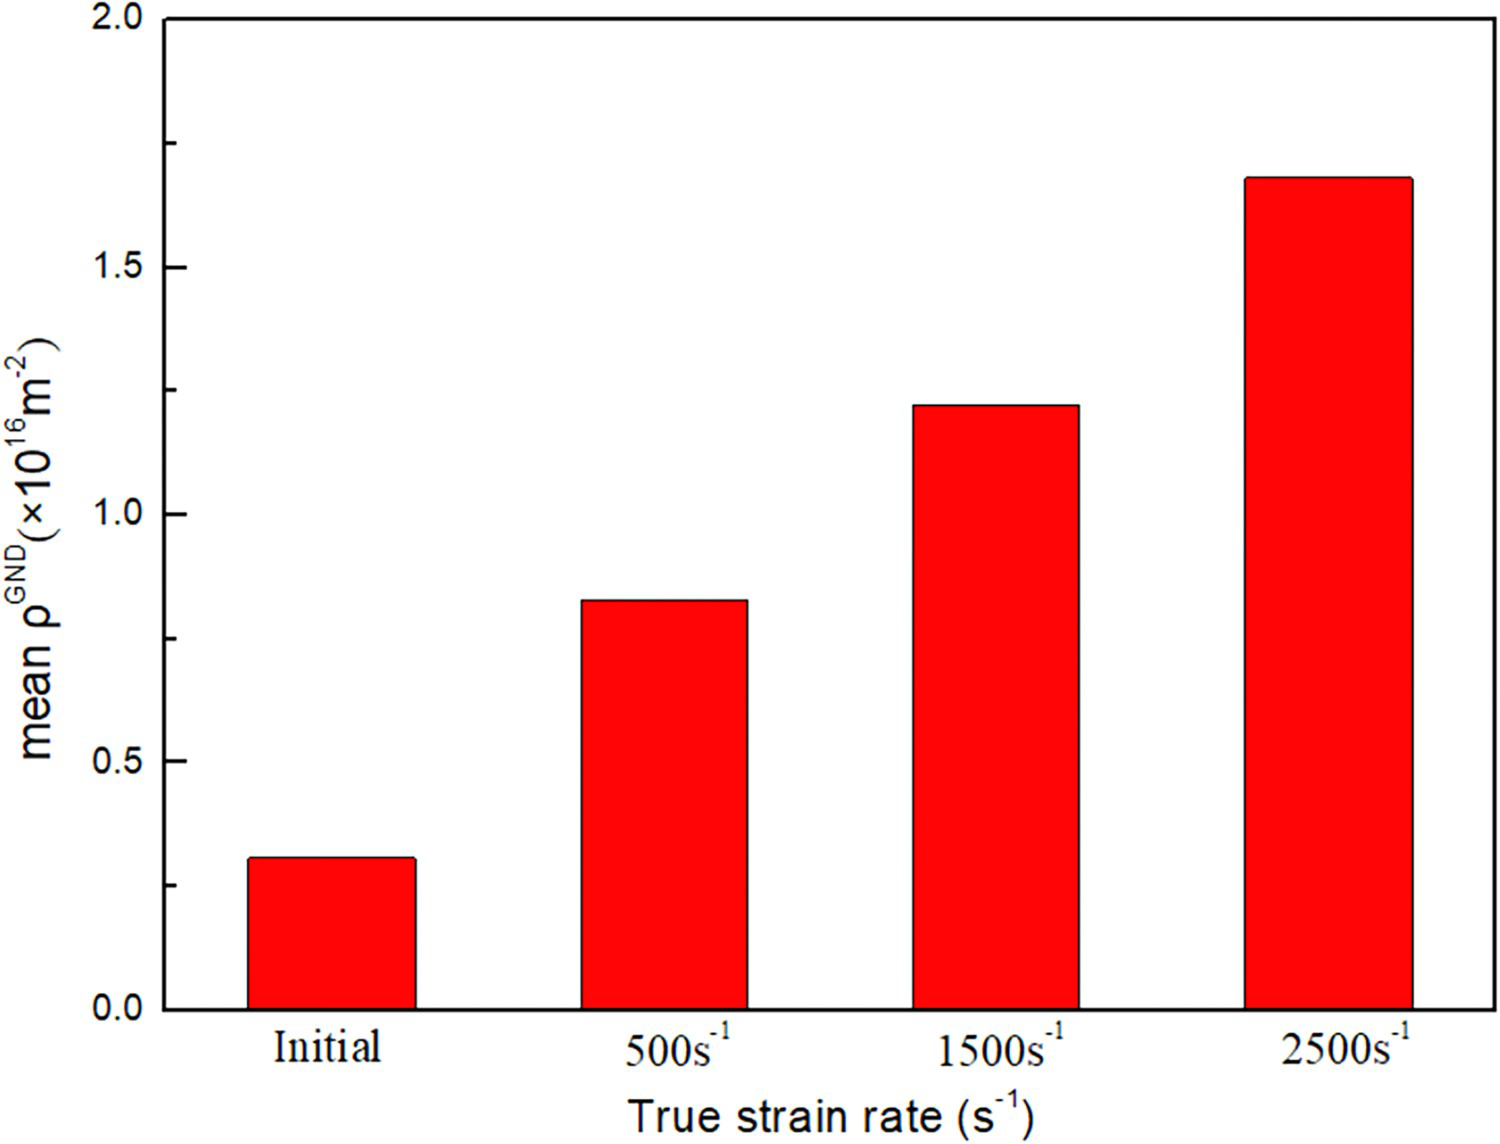
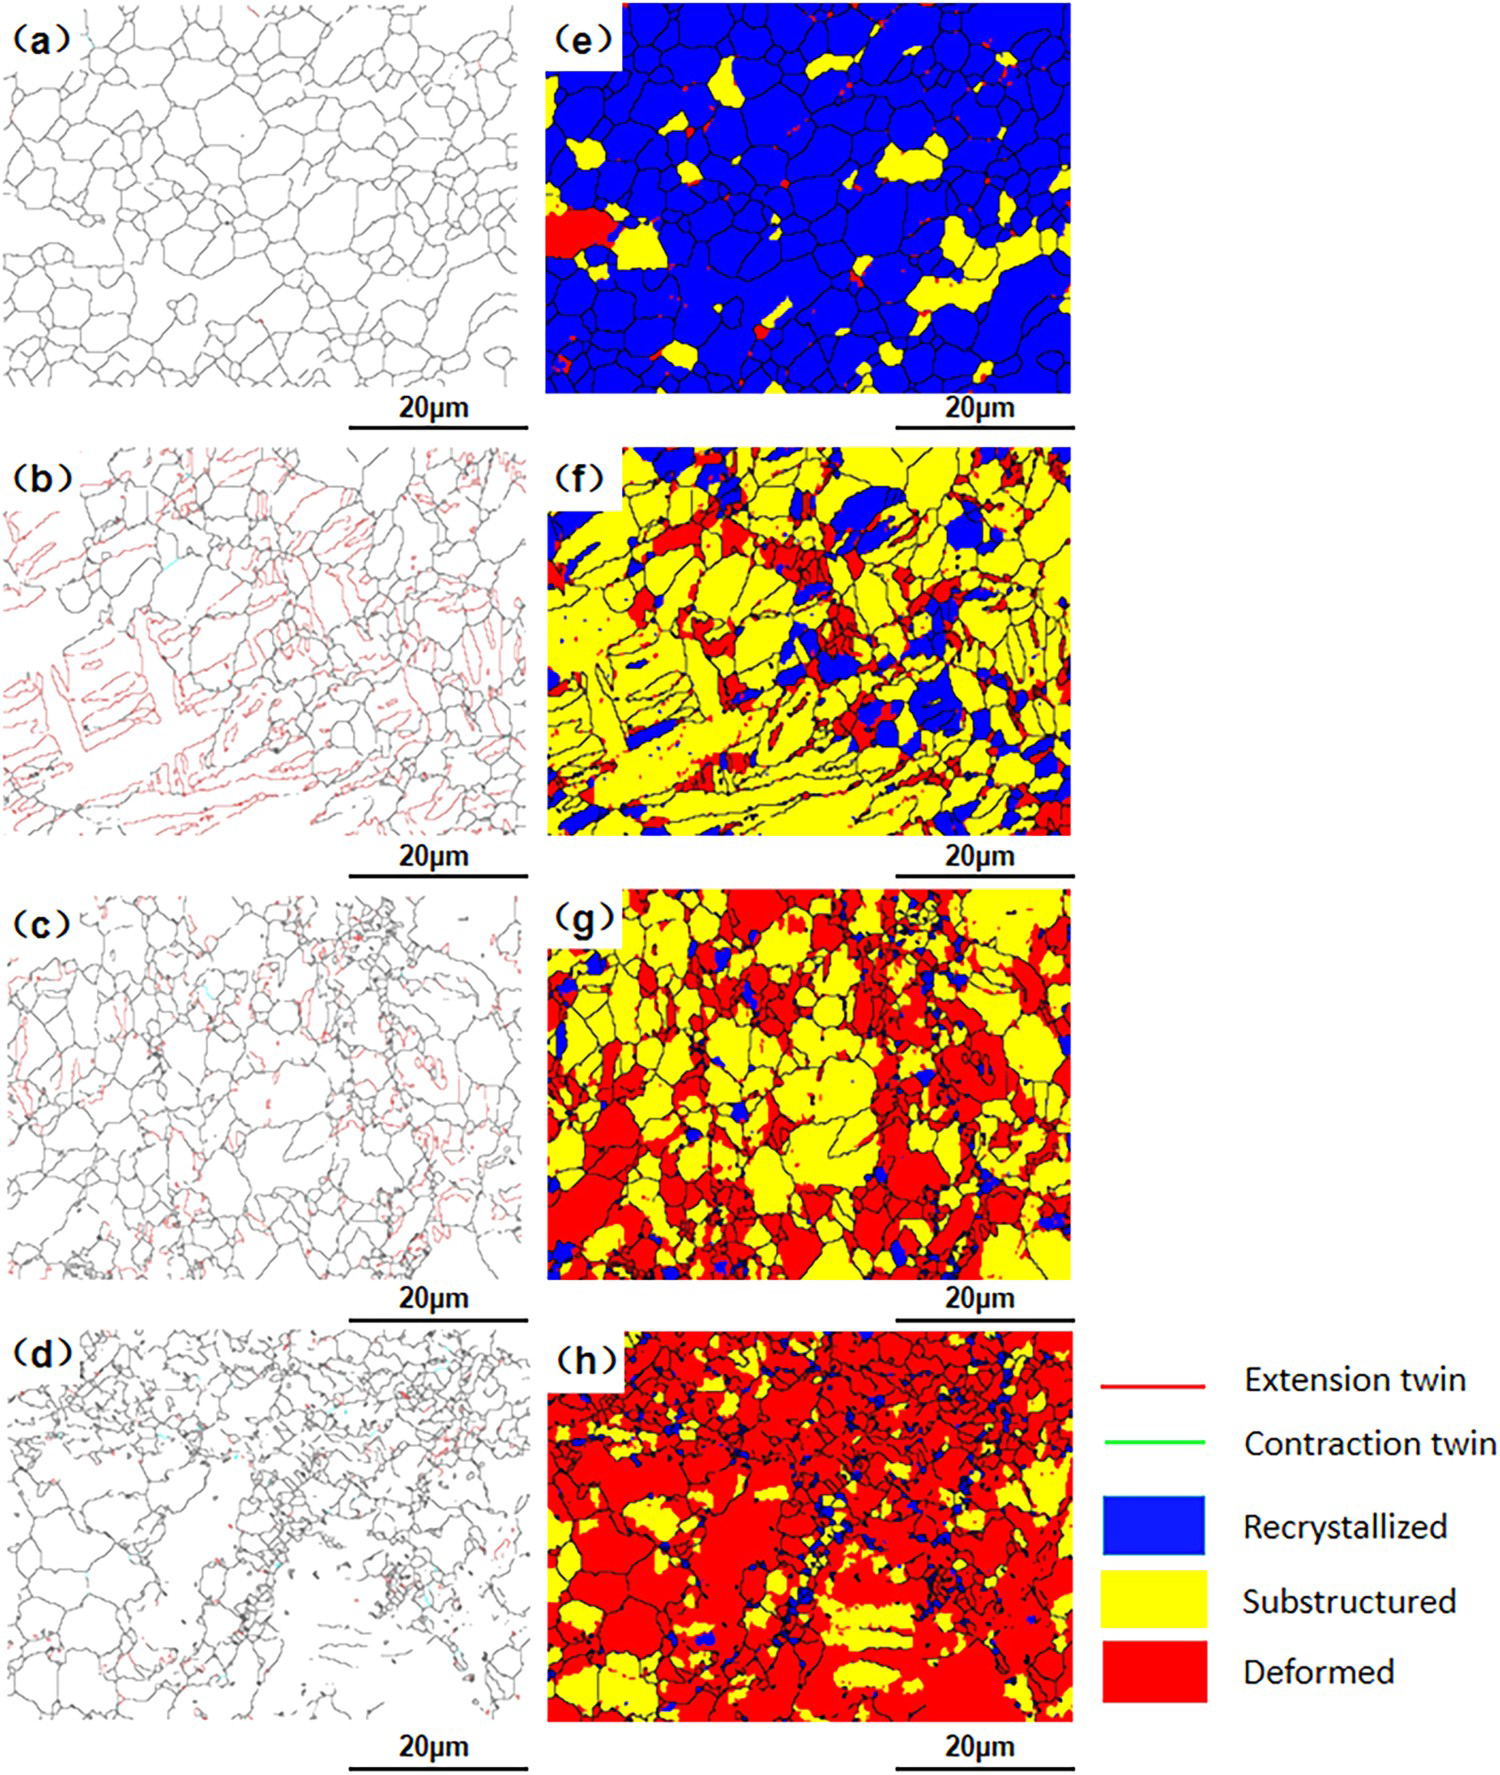
Figure 10 shows the twinning boundaries and the recrystallisation distribution of the different samples. Several
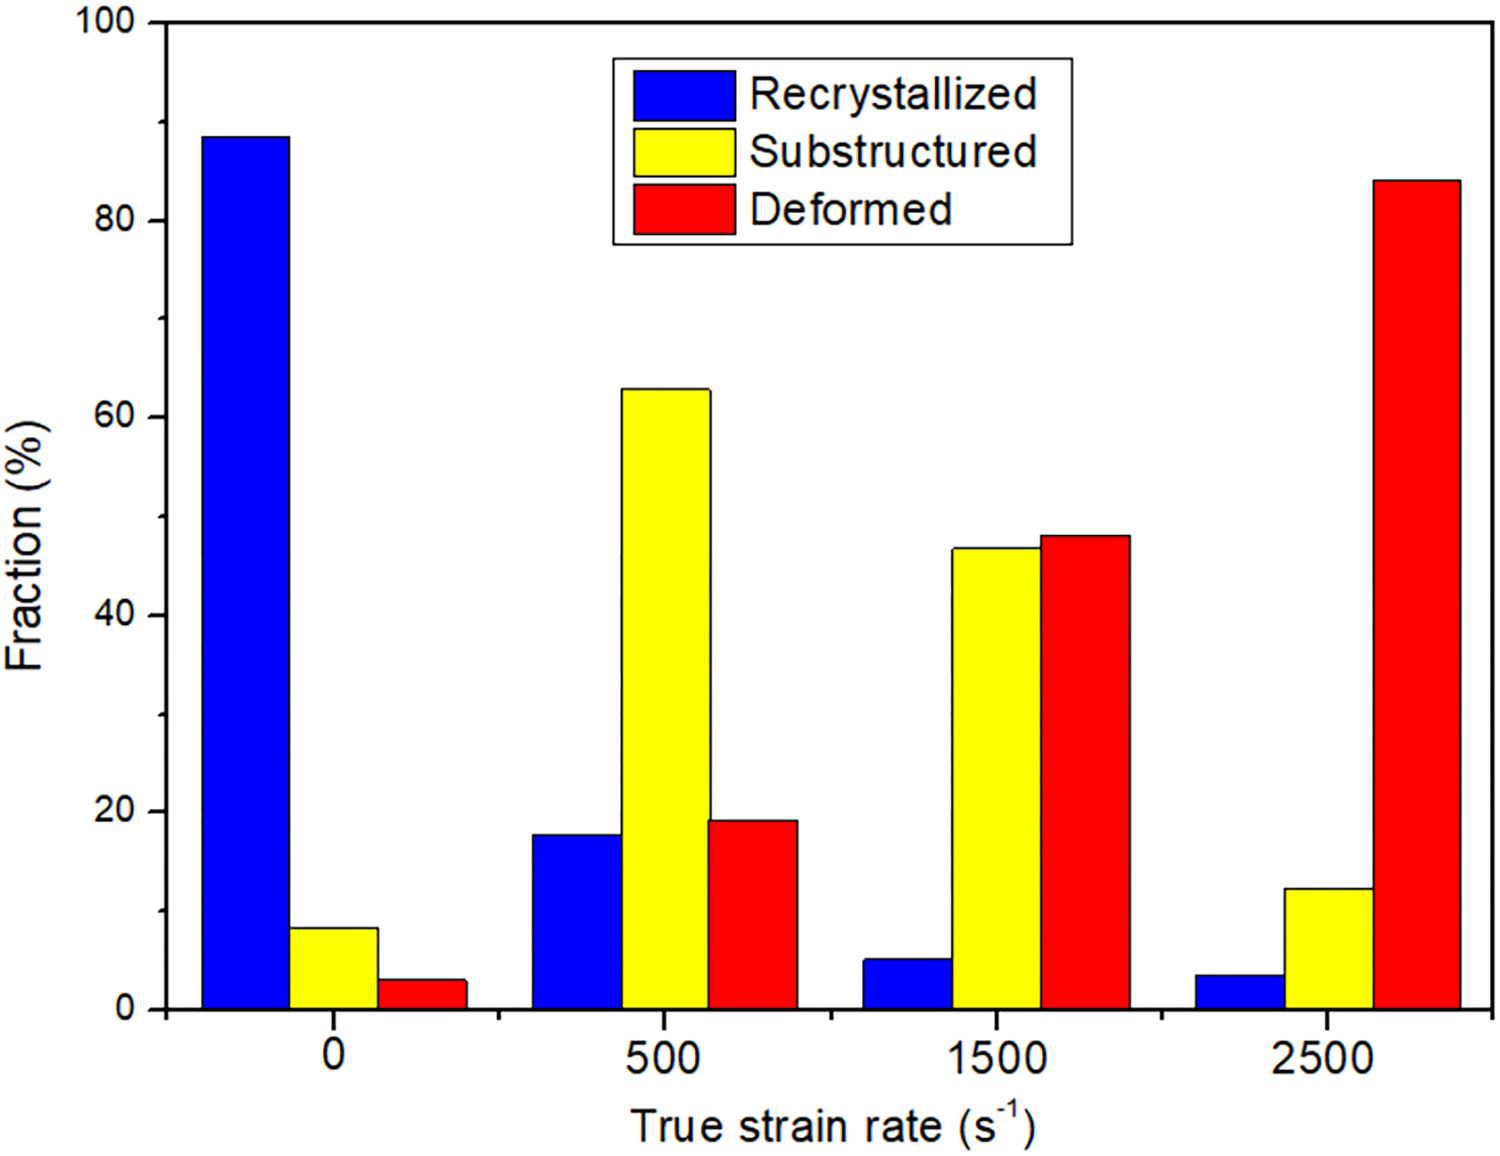
The twinning boundaries and recrystallisation distribution of the different compressed samples: (a) (e) initial sample, (b) (f) 500 s−1, (c) (g) 1500 s−1, (d) (h) 2500 s−1. The proportion of recrystallisation, substructure and deformation grains of Mg–6Zn–2Ce–0.6Zr samples with different rates. extension twins were found after impact at 500 s−1 (Figure 10(b)), as indicated by the red-coloured lines, and the misorientation angle is 86o. As the strain rate increases further, the number of
 extension twin boundaries decreases. Wang et al. [17] studied the microstructure of Mg-6Zn-1Cu-1Y-0.6Zr alloys at different strain rates, and found that the number of tensile twins in the sample at 1789 s−1 was less than that at 695 s−1, which is consistent with our observation. Figure 11 shows the recrystallisation, substructure, and grain deformation ratio of the samples subjected to different strain rates. Figure 11(a) shows that after the ES deformation, a large number of equiaxed grains are formed due to the occurrence of DRX. Under impact loading at a strain rate of 500 s−1, most subgrains and a small proportion of deformed grains appear. In addition, the amount of deformed grains increases with increasing strain rate. Furthermore, as shown in Figure 10(b–h), several new recrystallised grains form during dynamic loading; these grains form predominantly in the extension twinning region. According to the comprehensive analysis shown in Figure 8, the local misorientation value increases with the increase in the strain rate, indicating stress concentration in some grains. This leads to an increase in the number of deformed grains with an increasing strain rate. Additionally, the stress concentration within a short time and the high strain deformation cause the temperature to rise sharply in local areas and promote DRX [30].
TEM image of the alloy after compression loading at a strain rate of 500 s−1 is shown in Figure 12. Several dislocations and twins can be observed after the high-speed impact. The diffraction spots of the two clear twin boundaries were calibrated, as shown in Figure 12(a,b), respectively. The (0002) plane in the twin and the (0002) plane in the matrix are almost perpendicular to each other. It is worth noting that
TEM images of the Mg–6Zn–2Ce–0.6Zr alloy samples after dynamic compression at 500 s−1 strain rate. is basically parallel to the extension twin boundary in the TEM image shown in Figure 12(b). Many twins are formed during the dynamic compression process, which alter the orientation of polycrystals, thus, impeding the activation of the slip [31]. Thus, the accumulation of dislocations in these twins does not promote slip initiation. Figure 12(b) shows that the direction of the light-coloured twins is beneficial to slip initiation, while the direction of the dark-coloured twins is unfavourable for slip activation. Therefore, during deformation, the number of initial slips is limited, and a large number of dislocations accumulate at the twin boundaries and the grain boundaries under high-strain-rate loading [32].
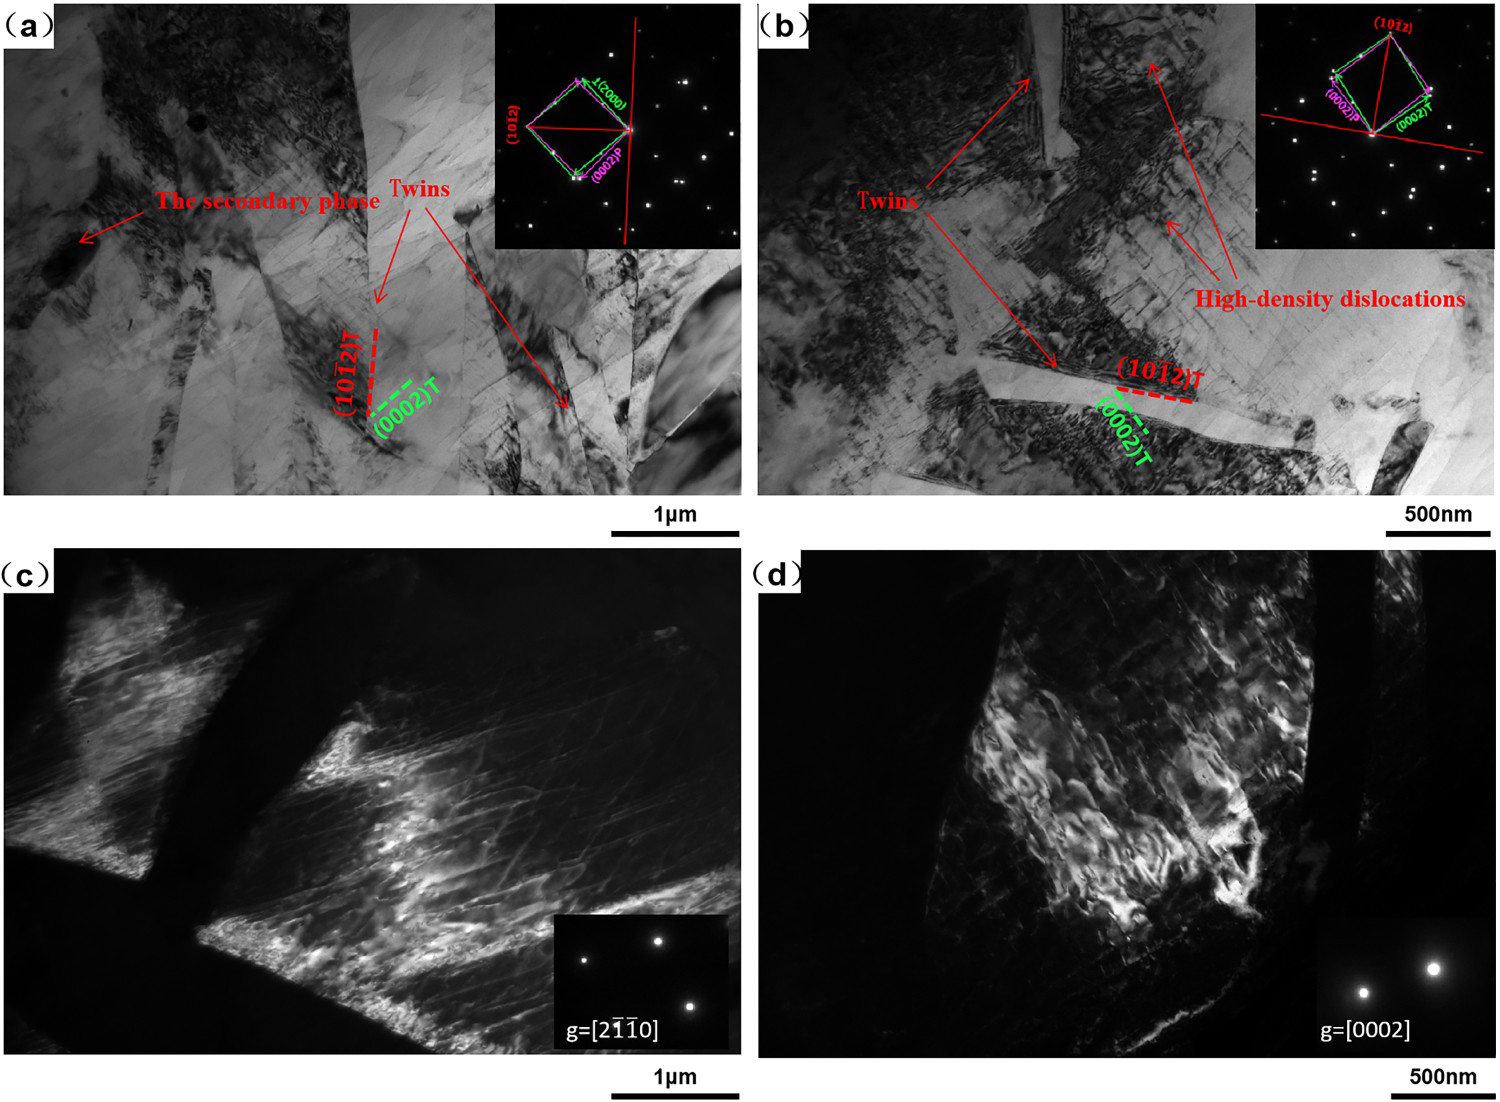
Figure 12(c,d) shows the accumulation of high-density dislocations after dynamic high-strain-rate loading. On the basis of the invisibility standard (g·b = 0), two dark-field images were acquired along the
 regional axis at g = [0002] and
 to detect the microstructure near the fault surface. Under these detection conditions, <a > and < c + a > dislocations can be observed [33]. A large number of torsional cross dislocations are observed, which exhibit dislocation entanglement. At the same time, the increase in the dislocation density increases the probability of dislocation accumulation or entanglement in front of obstacles, which eventually leads to the formation of dislocation forests [34].
Discussion
Absorption energy density and temperature rise
The absorption energy density (ΔE) and temperature rise (ΔT) during the dynamic compression process were calculated to further investigate the deformation behaviour of the alloy at different strain rates. These quantities are defined as follows [35]:
ΔE and deformation-induced ΔT at different strain rates.
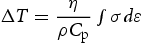
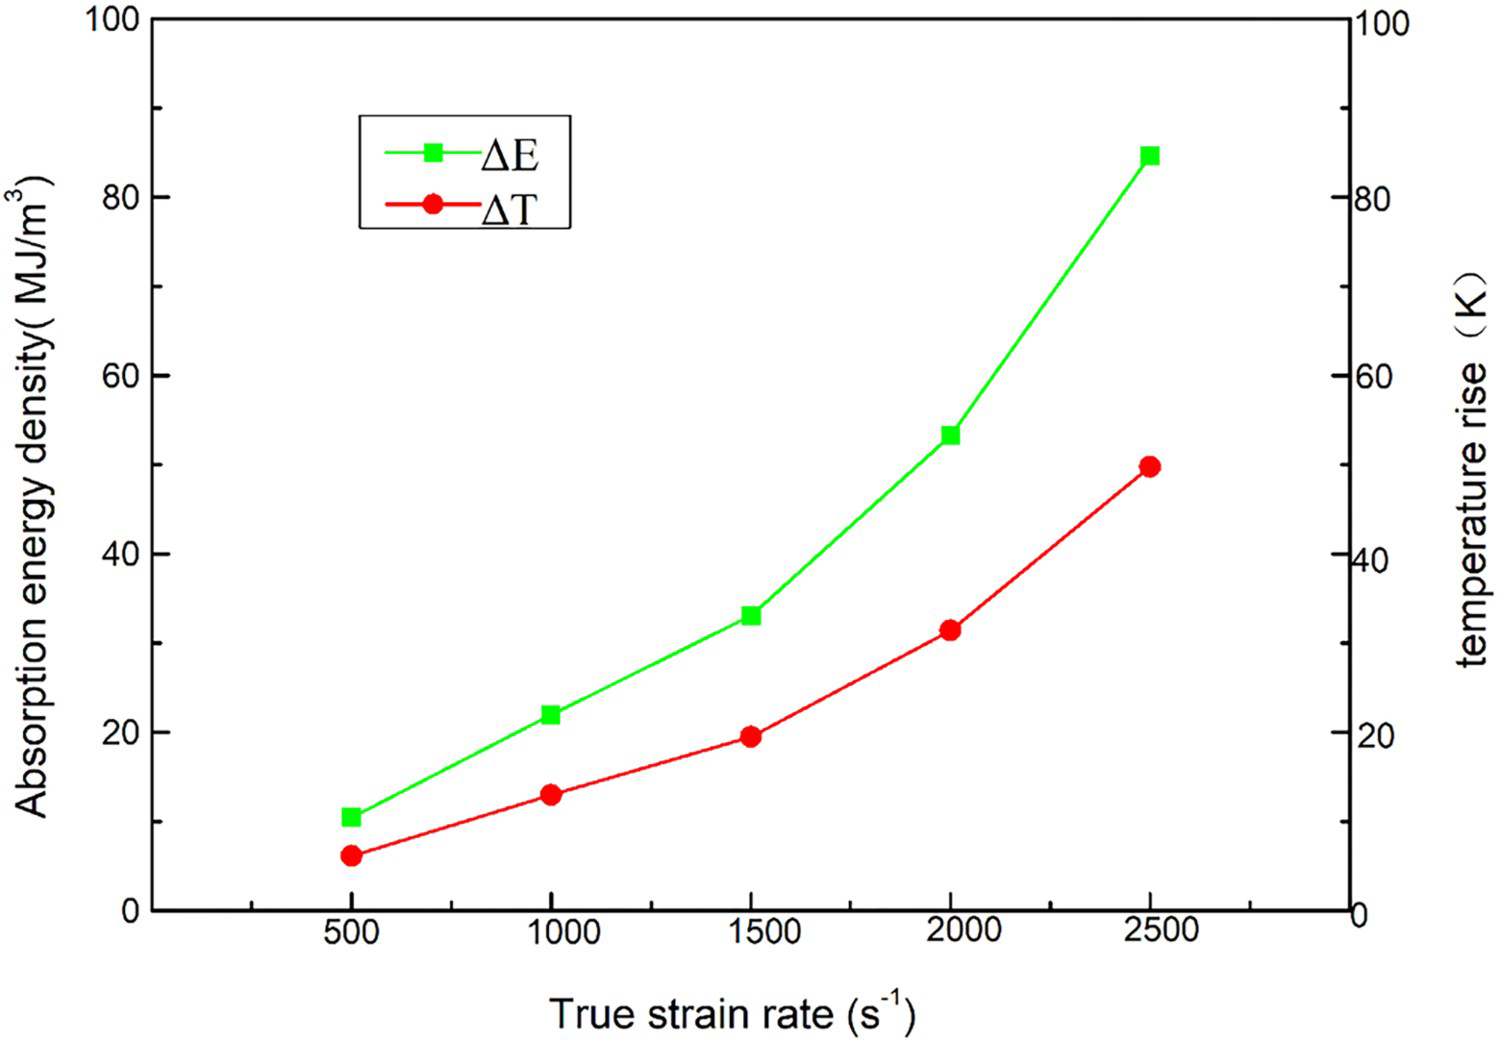
Equation (4) shows that the ΔT value refers to the average temperature rise of the entire sample during the deformation process at a high strain rate. Additionally, the ΔT value of the five investigated samples increases with increasing strain rate and reaches the maximum value of 50 K at a high strain rate of 2500 s−1. However, during the temperature rise caused by deformation, there is not enough time to release heat due to the short duration of deformation at a high strain rate, causing the temperature to rise only in a very localised area of the sample. Therefore, the temperature rise is so drastic that it causes local DRX and improves deformation abilities [36].
Dynamic compression fracture behaviour
Figure 14 shows the SEM image of the fracture morphology of the ED sample of the extruded Mg–6Zn–2Ce–0.6Zr alloy after dynamic compression at a strain rate of 2500 s−1. Several melting regions and numerous cleavage planes can be observed in Figure 14(a), indicating that the main fracture mode of the sample is brittle fracture accompanied by local melting [37]. In Figure 14(b), pronounced cracks and dimples can be clearly observed. Cracks are the manifestation of brittle fractures, while dimples are the manifestation of ductile fractures [38]. This indicates that the fracture mode of the Mg–6Zn–2Ce–0.6Zr alloy sample subjected to impact along the ED direction is a combination of brittle and ductile fractures. Zhang et al.[6] also found that the fracture mode of the MCT AZ31B magnesium alloy sample changed from brittle (cleavage plane) to ductile (dimpled) due to its high absorption energy density. This is consistent with the temperature rise and absorption energy density of the reaction shown in Figure 13. Therefore, the fracture behaviour of the Mg–6Zn–2Ce–0.6Zr alloy may also be related to its absorption energy density, temperature rise, and plasticity.
Fracture morphology of sample at a strain rate of 2500 s−1.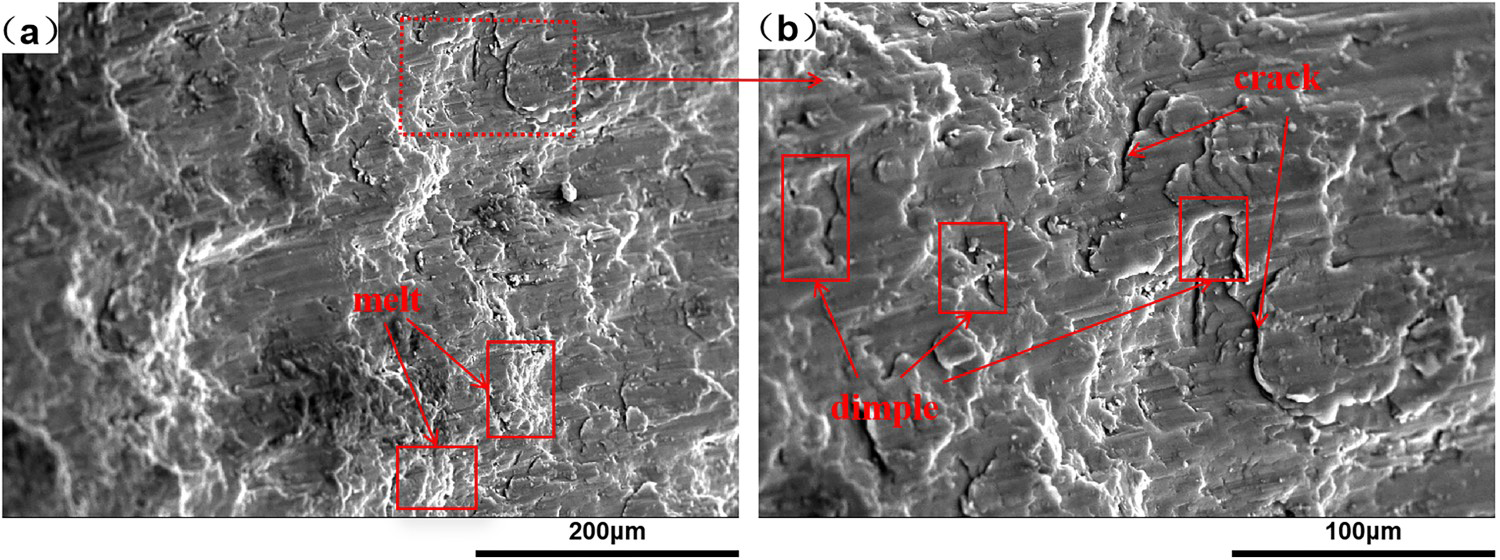
Dynamic deformation mechanism
Slips and twins are the primary deformation mechanisms of magnesium alloys. Twins can be analysed via the grain boundary misorientation diagram (Figure 15). As shown in Figure 15, when the sample is subjected to a strain rate of 500 s−1, the grain boundary misorientation of many grains is 85°–90°, which is in excellent agreement with the deviation angle of 86.3° for extension twins. Furthermore, the number of grain boundaries with a misorientation of 85°–90° decreases significantly upon increasing the strain rate. By contrast, the number of low-angle grain boundaries (with a misorientation of less than 10°) increases considerably, indicating the occurrence of slips, which further accommodate the deformation. As described in the previous section, some dislocations are also observed in the TEM images after dynamic compression, as shown in Figure 12.
Distribution of grain boundary misorientation for the (a) initial alloy, and at different strain rates: (b) 500 s−1, (c) 1500 s−1, and (d) 2500 s−1.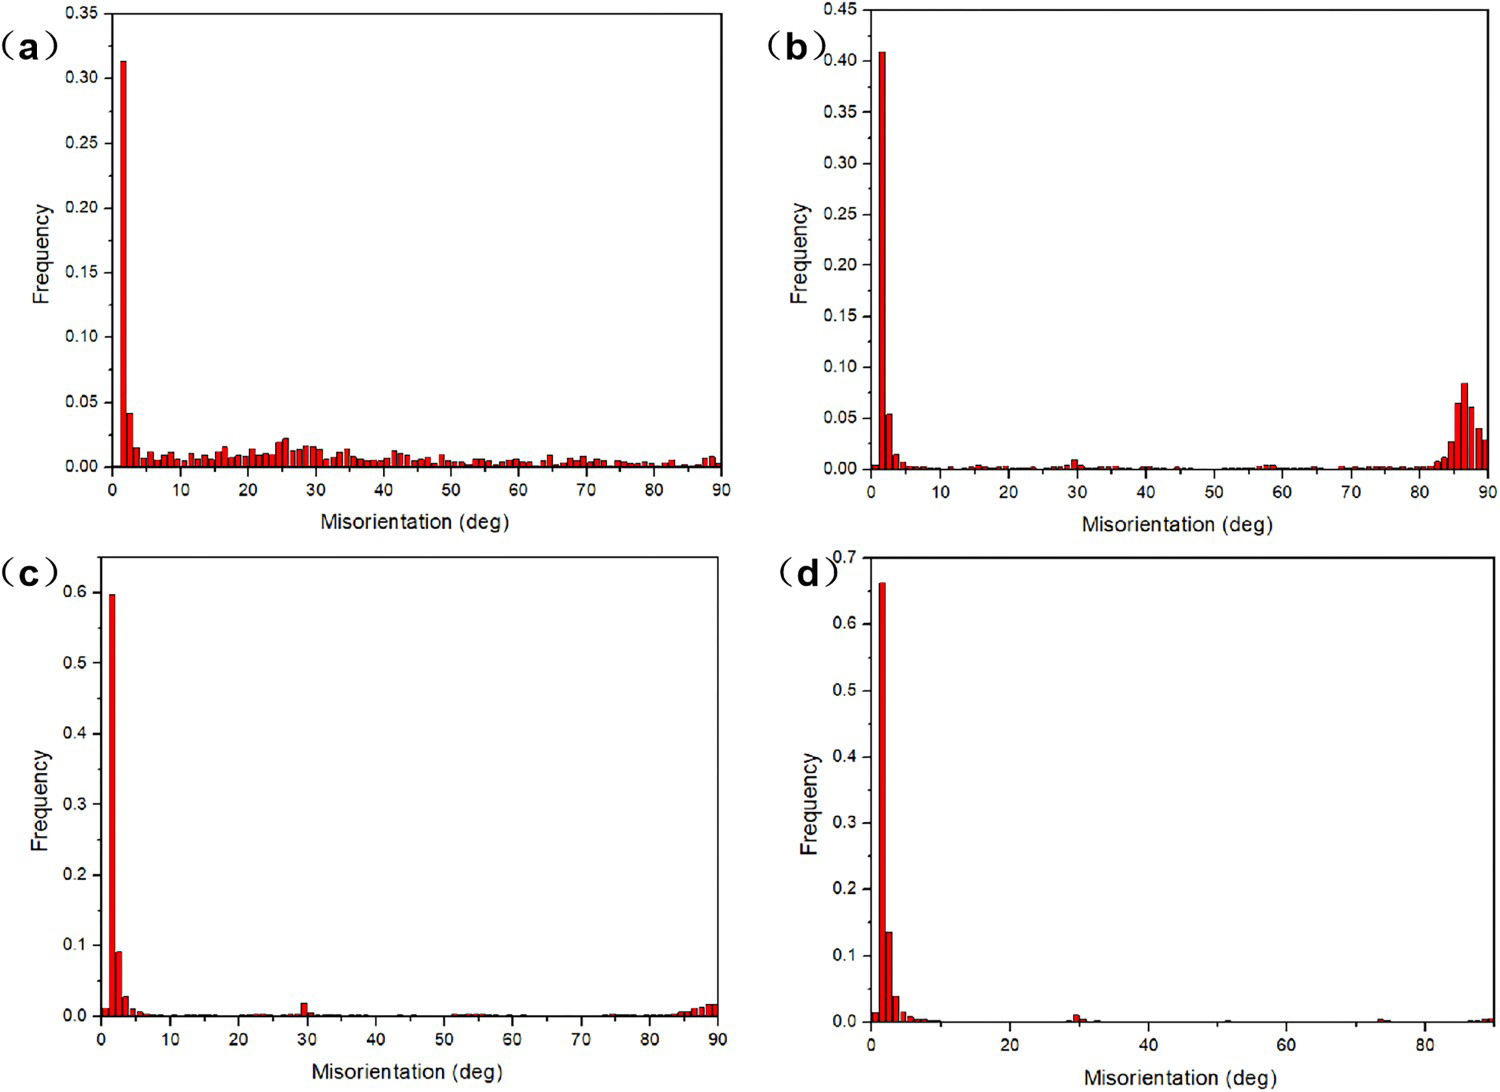
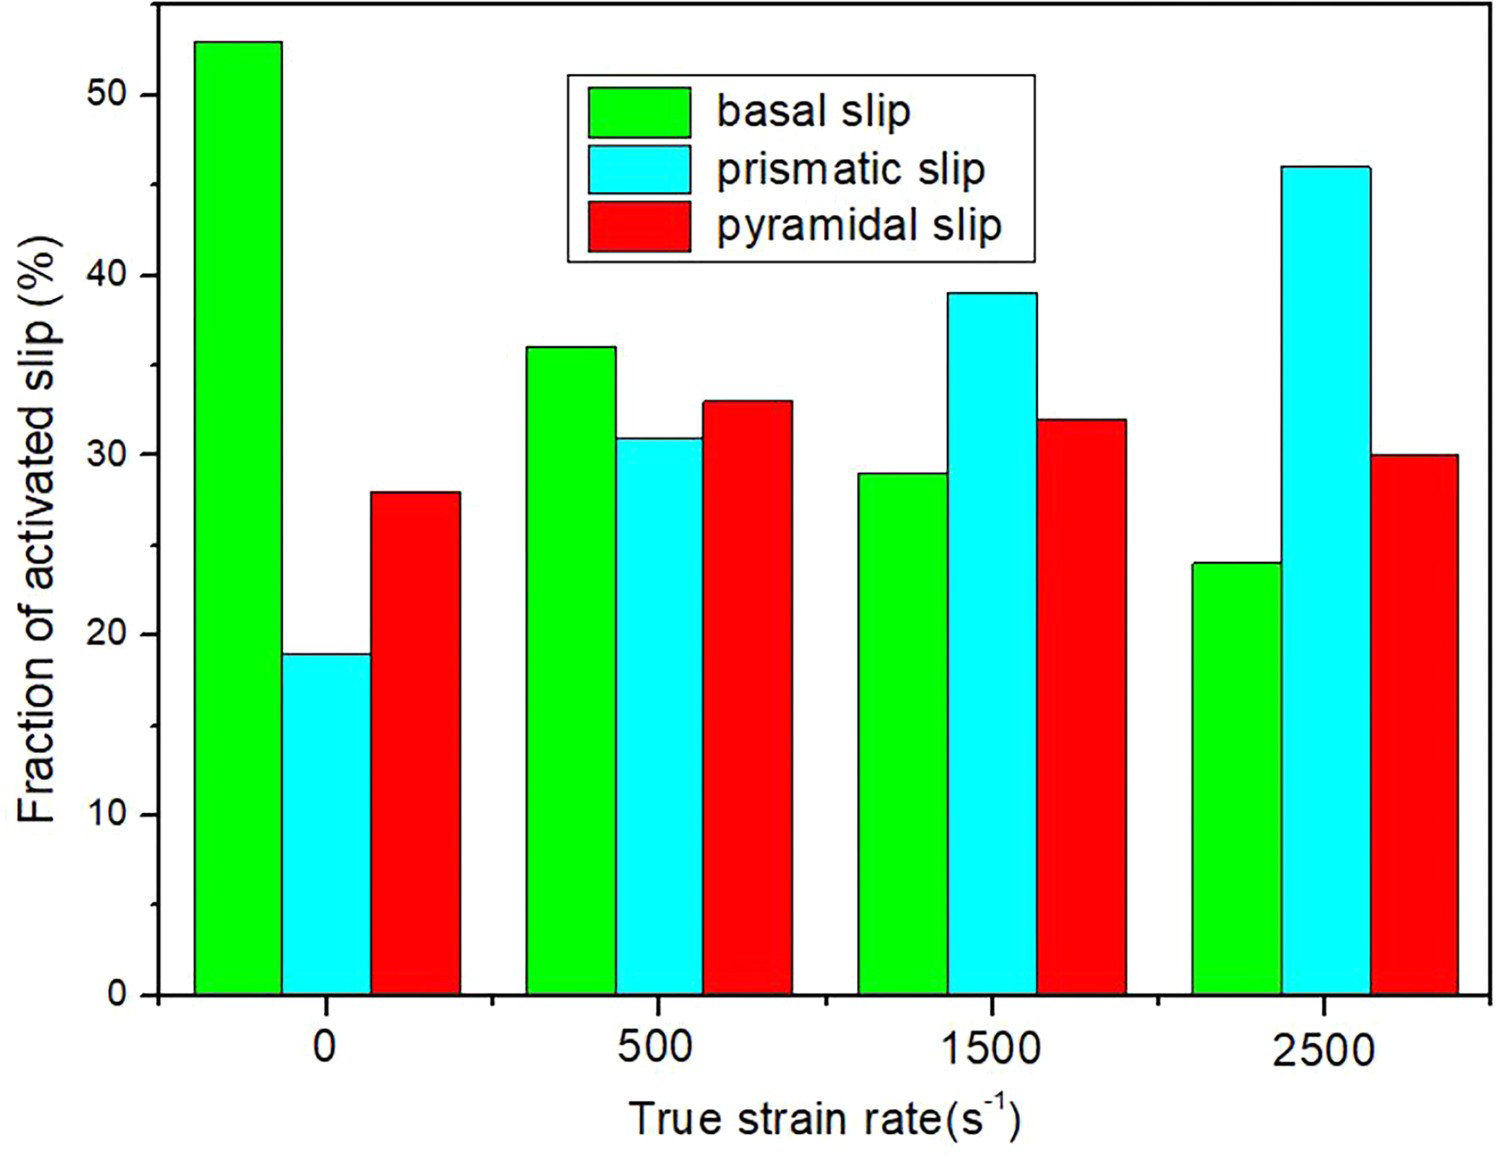
It is well known that the Schmid factor (SF) of each slip system closely determines whether it can be activated. Figure 16 shows the SF value of three slip systems for the ED sample at different strain rates. Furthermore, the proportion of each slip system at different strain rates is calculated, as shown in Figure 17. According to Schmid's law, the sliding system with the highest SF value is the most likely to be activated [39]. Based on the presence of an initial texture (see Figures 4 and 16(d)), it is possible to infer that the average SF value of prismatic slip is the highest at a strain rate of 2500 s−1 (Figure 16(d)), under compression loading along the ED. Thus, prismatic slips are activated during the deformation of the alloy, accounting for around 46% of the total number of activated slips, as shown in Figure 17. In the initial state (i.e. under compression shear), the deformation mainly consists of basal slips accompanied by several prismatic and pyramidal slips. As the strain rate increases, the proportion of prismatic and pyramidal slips increases, indicating that the dynamic compression deformation of the sample is dominated by prismatic slips at high strain rates. The activation of prismatic slips promotes dislocation climbing and cross slips, which lead to the accumulation of high-density dislocations [40]. Therefore, the true stress–strain curves of the samples at strain rates of 2000 and 2500 s−1 exhibit higher strain hardening rates than those at strain rates of 500, 1000, and 1500 s−1 (Figure 6).
Frequency distribution of the Schmid factor for the Mg–6Zn–2Ce–0.6Zr samples at different strain rates: (a) Initial alloy, (b) 500 s−1, (c) 1500 s−1, (d) 2500 s−1. The fraction of activated slip system in the Mg–6Zn–2Ce–0.6Zr samples under different strain rates.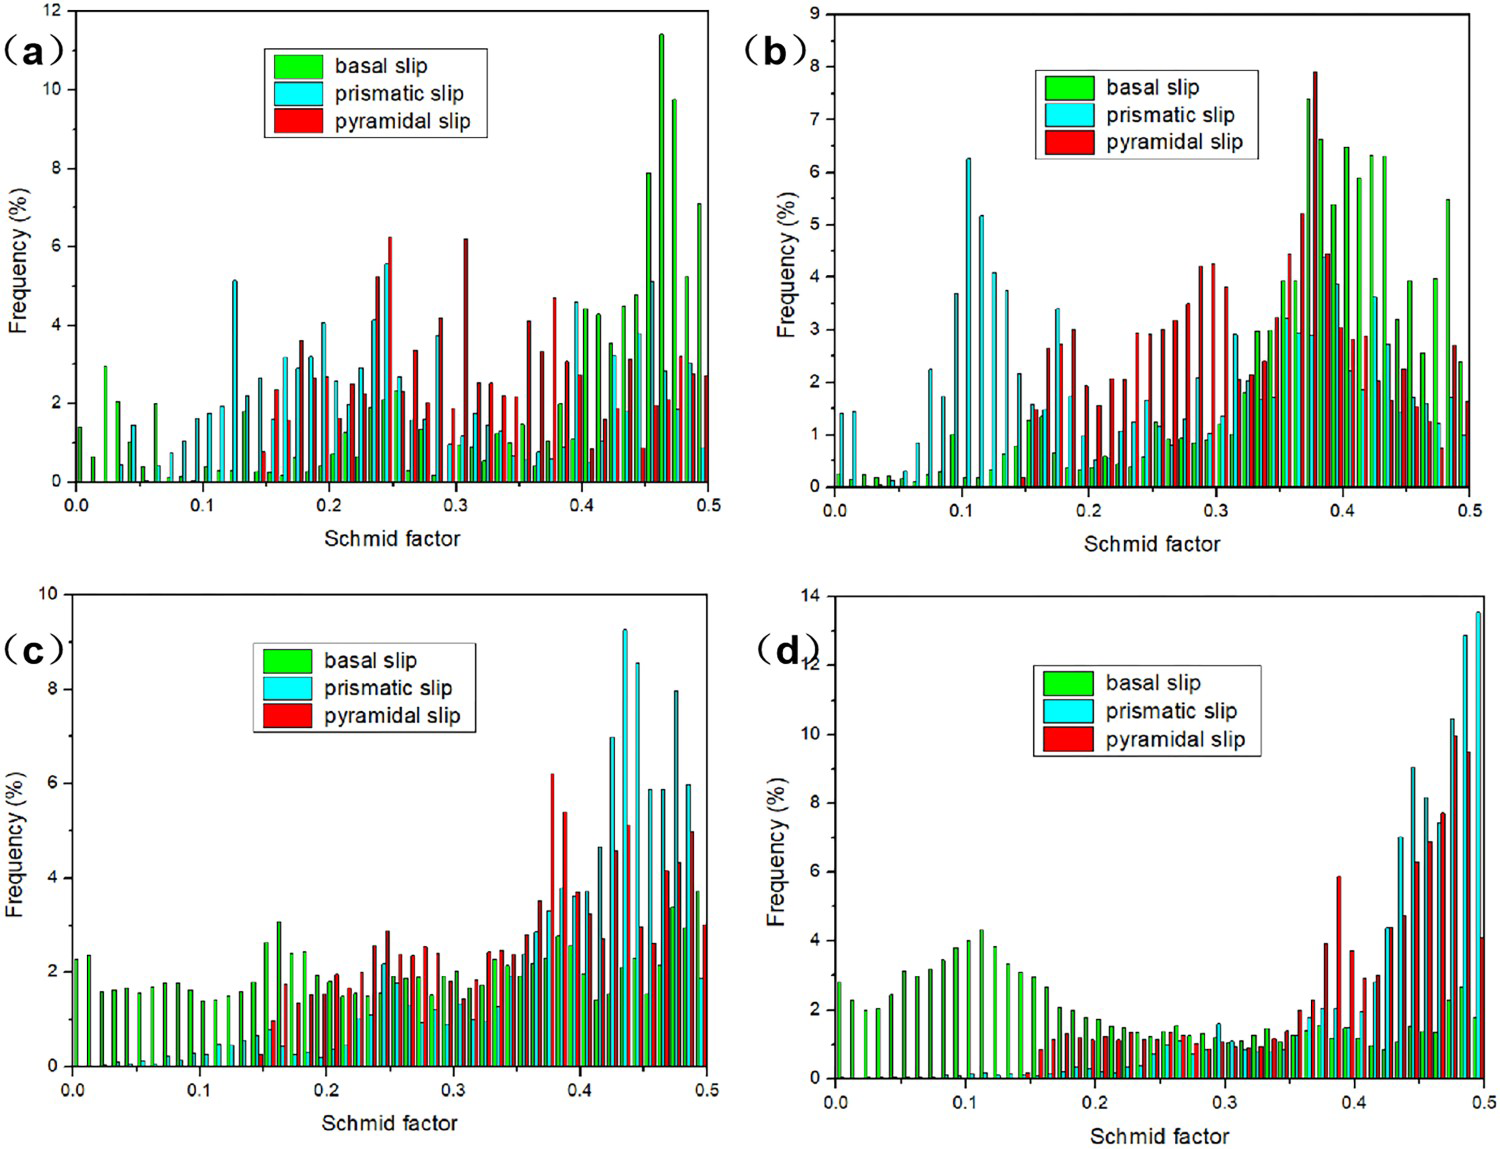
As shown in Figure 10, slip activation during deformation for the grains with a hard orientation for the basal slip system is difficult. However, a large number of extension twins appear at a strain rate of 500 s−1, which dominates the early stage of the deformation process. As the strain rate increases, the amount of extension twins gradually decreases due to the growth of deformation twins. Additionally, the grain orientation changes due to the extension twins, which can easily activate slips. With the further increase in the strain rate, the nucleation and propagation of the extension twins in the grains almost saturate, and prismatic slips are activated at the same time [41]. At this point, numerous DRX events tend to occur due to the high impact energy and the high adiabatic temperature rise, and the grain size decreases correspondingly. In addition, the number of dislocations tends to increase gradually, while the number of twins will decrease, indicating that the main deformation mode of the sample changes from twins to slips with increasing strain rate; this is consistent with the results shown in Figures 8 and 10.
The above discussion shows that the main deformation mode of the specimen consists of non-basal slips in the extrusion shear process. In the deformation process at strain rates in the range from 500 to 2500 s−1, the deformation mode changes from being dominated by extension twins to being dominated by non-basal plane slips. Slips and twin-controlled grain rotation result in texture changes (Figures 4 and 7). Therefore, with the gradual increase in the strain rate, the yield strength and compression strength of the sample also gradually increase.
Conclusions
The dynamic compression properties and microstructural evolution of the Mg–6Zn–2Ce–0.6Zr alloy were investigated via scanning electron microscopy, X-ray diffraction, energy-dispersive spectroscopy, electron backscatter diffraction and transmission electron microscopy. The main conclusions of this study can be summarised as follows:
The dynamic compression properties of the Mg–6Zn–2Ce–0.6Zr alloy show a clear positive strain rate strengthening effect in the strain rate range of 500–2500 s−1. The yield stress and the maximum flow stress reach the maximum values (232 and 601 MPa, respectively) at a strain rate of 2500 s−1. A large number of extension twins appear in the Mg–6Zn–2Ce–0.6Zr alloy at a strain rate of 500 s−1. However, while the proportion of twins significantly decreases under impact tests at strain rates of 1500 and 2500 s−1, the dislocation density increases. This is because the absorption energy density of the sample also increases at relatively high strain rates, resulting in dynamic recrystallisation and hindering the generation of twins. The texture of the Mg–6Zn–2Ce–0.6Zr alloy changes markedly after dynamic compression due to the appearance of a large number of extension twins. In addition, the deformation mode of the Mg–6Zn–2Ce–0.6Zr alloy changes from being dominated by
Cracks, dimples, and several melting areas in many cleavage planes are observed on the cleavage surface of the cleavage plane after compression loading. This indicates that the fracture mode is a combination of brittle and ductile fractures.
 extension twins to being dominated by prismatic slips with the increase in the strain rate. This is the primary reason why there are few twins in the sample at strain rates of 1500 and 2500 s−1.
Footnotes
Disclosure statement
No potential conflict of interest was reported by the author(s).