
Abstract
A novel Mg–Zn–Zr–Y–Cu alloy was fabricated, and its corrosion behaviour was investigated in the present work. The results showed that, compared with Mg–6Zn–0.5Zr (ZK60) alloy, Mg–6Zn–1Y–0.5Cu–0.5Zr (ZWCK6100) alloy exhibited finer recrystallised (DRXed) and unDRXed grains, more homogeneous microstructure, and contained CuMgZn and I phase (Mg3Zn6Y) in addition to α-Mg, Zn2Zr, MgZn2 precipitates. As a result, ZWCK6100 alloy had a lower corrosion rate and higher corrosion resistance, underwent slightly localised corrosion in 3.5 wt-% NaCl solution, implying that the combined addition of Y and Cu was conducive to improving the corrosion resistance of Mg alloys.
Introduction
Mg and its alloys have attracted more attention in aerospace, automobile, biomedical and other fields owing to their high specific strength, low density and good biocompatibility [1-3]. Just as many engineering materials often experience failure caused by corrosion that eventually affects their overall properties [4,5], Mg alloys used in industrial or biomedical fields are still limited by their poor mechanical properties and corrosion resistance [3,6,7].
As possible solutions to the mechanical and corrosion resistance of Mg alloys, several methods, including plastic deformation [2,8-13] and alloying [8,9] are provided. To a large extent, alloying elements have a significant impact on the properties of Mg alloys [14,15]. The addition of alloying elements to Mg alloys inevitably leads to the precipitation of second phases, having a controversial effect on their mechanical and corrosion behaviour. For example, those second phases generally improve the mechanical properties of Mg alloys by precipitation strengthening, but the potential differences between α-Mg matrix and second phases can cause different galvanic corrosion, accelerating or reducing the corrosion rate.
Numerous studies have suggested that Cu is one of the most important alloying elements for Mg alloys. On the one hand, Cu can improve the age hardening ability of Mg–Zn-based alloy by promoting the precipitation of MgZn2 phases, and the mechanical properties of Mg–Zn, Mg–Zn–Al and Mg–Zn–Zr alloys have been significantly elevated by Cu addition [9,16-18]. On the other hand, the eutectic temperature of Mg–Zn alloys can be enhanced by Cu, permitting the use of a higher solution treatment temperature [19]. Additionally, rare earth (RE) also has a great impact on the properties of Mg alloys [2,20-22]. For example, the quasicrystalline phases (W or I phase, which depends on the atomic ratio of Zn to Y in Mg–Zn alloy) can form in Mg–Zn alloys with Y addition, and I phase exhibits high strength, excellent thermal stability and is highly matched with α-Mg matrix, which can elevate the mechanical properties of Mg alloys as a strengthening phase [23,24]. Microalloying with multi-elements can dramatically improve the microstructure and properties of Mg alloys and is an effective method for designing novel Mg alloys with excellent performance.
Thus, a novel Mg–6Zn–1Y–0.5Cu–0.5Zr alloy (wt-%) with combined addition of Y and Cu was fabricated, and its microstructure and mechanical properties were studied in our previous study [25]. Results revealed that this novel Mg alloy exhibited excellent strength (tensile strength (σ b) was 351.3 MPa and yield strength (σ s) 320.3 MPa) and ductility (ϵ f was up to 19.8%), and the mechanical properties would be further optimised by heat treatment. In order to satisfy the need under real service conditions, the corrosion behaviour of the novel alloy should be evaluated and analysed. In the present work, the corrosion behaviour of Mg–6Zn–1Y–0.5Cu–0.5Zr alloy was investigated by electrochemical tests and immersion measurements to determine the effect of combined addition of Y and Cu, and tests were also performed on Mg–6Zn–0.5Zr alloy for comparison.
Experimental procedures
Materials preparation
Mg–6Zn–1Y–0.5Cu–0.5Zr (wt-%) alloy, named ZWCK6100, was melted using pure Mg, pure Cu, pure Zn, Mg-30Zr and Mg-30Y master alloys. The alloy was melted in a stainless-steel mould at 730°C in an electric resistance furnace under the protection of SF6 and CO2 mixed atmosphere. The melt was cooled to 715°C followed by immersing the mould in water to obtain the cast ingot. The ingot was cut into cylindrical samples (ϕ 95 × 200 mm), homogenised at 400°C for 24 h, then extruded at 350°C, the extrusion rate was set to 39:1. The detailed procedure of material preparation can refer to Ref. [25]. Mg–6Zn–0.5Zr alloy bar (named ZK60) was fabricated by the same process.
Microstructural characterisation
Samples for microstructural characterisation were cut from the extruded bars by electrical discharge wire parallel and perpendicular to extrusion direction (ED), respectively. Microstructure was analysed by the optical microscope (OM, ZEISS Axio Observe.Z1m). Samples for OM observations were prepared by standard technique, ground and polished, then etched with a picric acid-based etchant, which was composed of 10 mL acetic acid, 70 mL ethanol, 20 mL distilled water and 5 g picric acid. Metallographic processing software (SISCIAS 8.0) was adopted to analyse the grain size. Data were taken from 10 different regions for each sample and then averaged. X-ray diffraction (XRD, Philips PW170X) was used to analyse the phase constitutes, in which Cu Kα radiation with the 2θ range of 20°–90° was set.
Corrosion measurements
Corrosion behaviour of ZWCK6100 alloy was investigated by electrochemical tests and immersion measurements. Samples used for corrosion measurements were cut parallel to ED, then mounted with epoxy resin, polished and cleaned by ethyl alcohol. The exposed areas of the samples were measured and an averaged value was calculated for each sample.
All the electrochemical measurements were performed on a DH 7001 electrochemical workstation in 3.5 wt-% NaCl solution. A standard three-electrode system was used, and a saturated calomel electrode was taken as the reference electrode, the tested alloys as the working electrode and a platinum plate as the counter electrode. The open circuit potential (OCP) was measured for 20 min to obtain a stable state. The polarisation curves were scanned from −400 mV vs OCP to 400 mV vs OCP and the scanning rate was set to 0.1667 mV s−1. The electrochemical impedance spectroscopy (EIS) was recorded in the frequency range from 100 kHz to 10 mHz, and the potential signal amplitude was 10 mV vs OCP. To ensure the reliability of experimental results, each electrochemical measurement was repeated three times. The averaged exposed areas were 1.82 and 1.89 cm2 for ZK60 and ZWCK6100 alloys, respectively, to evaluate the corrosion rate.
The immersion tests were carried out for 48 h in 3.5 wt-% NaCl solution, the ratio of sample surface areas (cm2) to solution volume (mL) was set to 1:100, and funnels matched with burets were used to record the volume of generated H2 during the immersion time. Before the immersion tests, the samples were ground, dried and weighed by an electrical balance with an accuracy of 0.01 mg. After the immersion measurements, the corrosion products were collected carefully and the constitutes were analysed by XRD, the corroded surface was cleaned with chromic acid (200 g L−1 CrO3) at 75°C for 5 min. Then the samples were reweighed and the weight loss was calculated. The morphology of the corroded surface was characterised by SEM with an accelerating voltage of 20 kV. To ensure the reliability, each test was repeated at least three times. The averaged exposed areas were 1.81 and 1.91 cm2 for ZK60 and ZWCK6100 alloys, respectively, to assess the corrosion rate.
Results
Microstructure
The microstructures of ZWCK6100 and ZK60 alloys after extrusion are displayed in Figure 1. Typical hot extruded structures and bimodal microstructures can be clearly observed in both alloys, which contain dynamically recrystallised (DRXed) grains and elongated unDRXed grains indicated by red arrows. It is evident that, for ZK60 alloy, very coarse unDRXed regions (19.65 µm) and fine DRXed grains (1.67 µm) are elongated along the extrusion streamline, as shown in Figure 1(a,b). While for ZWCK6100 alloy, the sizes of unDRXed regions (4.72 µm) and DRXed grains (0.95 µm) are much refined, as shown in Figure 1(c,d), and the grain refinement is not caused by the as-cast microstructure, which has been confirmed in our previous study [25]. It can be concluded that the combined additions of Y and Cu can simultaneously achieve grain refinement and microstructural homogeneity.
Microstructures of extruded (a, b) ZK60 alloy and (c, d) ZWCK6100 alloy, (a, c) parallel to ED and (b, d) perpendicular to ED.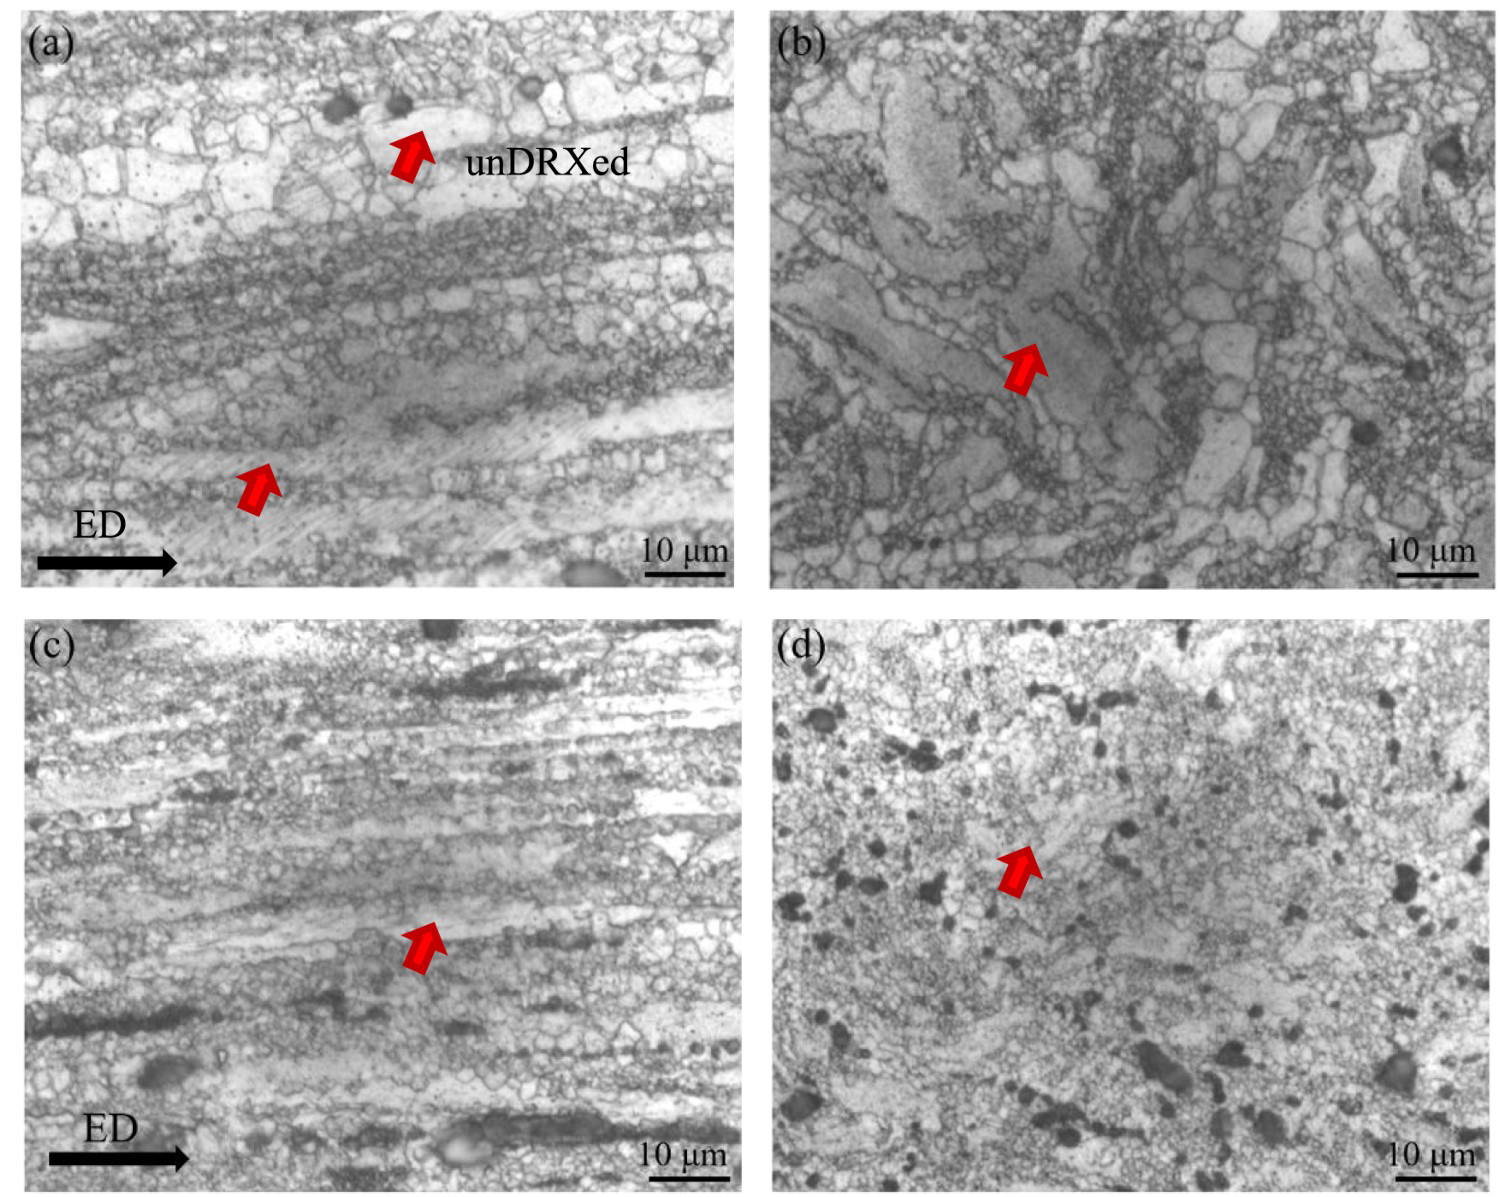
The XRD patterns of ZWCK6100 and ZK60 alloys are represented in Figure 2, and it indicates that compared with ZK60 alloy, ZWCK6100 alloy with combined addition of Y and Cu contains CuMgZn and I phase (Mg3Zn6Y) in addition to α-Mg, MgZn2 and Zn2Zr phases. The distribution of elements and morphology of second phases have been characterised by SEM equipped with energy dispersive spectrometry (EDS) and transmission electron microscopy (TEM) in our previous study [25].
XRD patterns of ZWCK6100 and ZK60 alloys.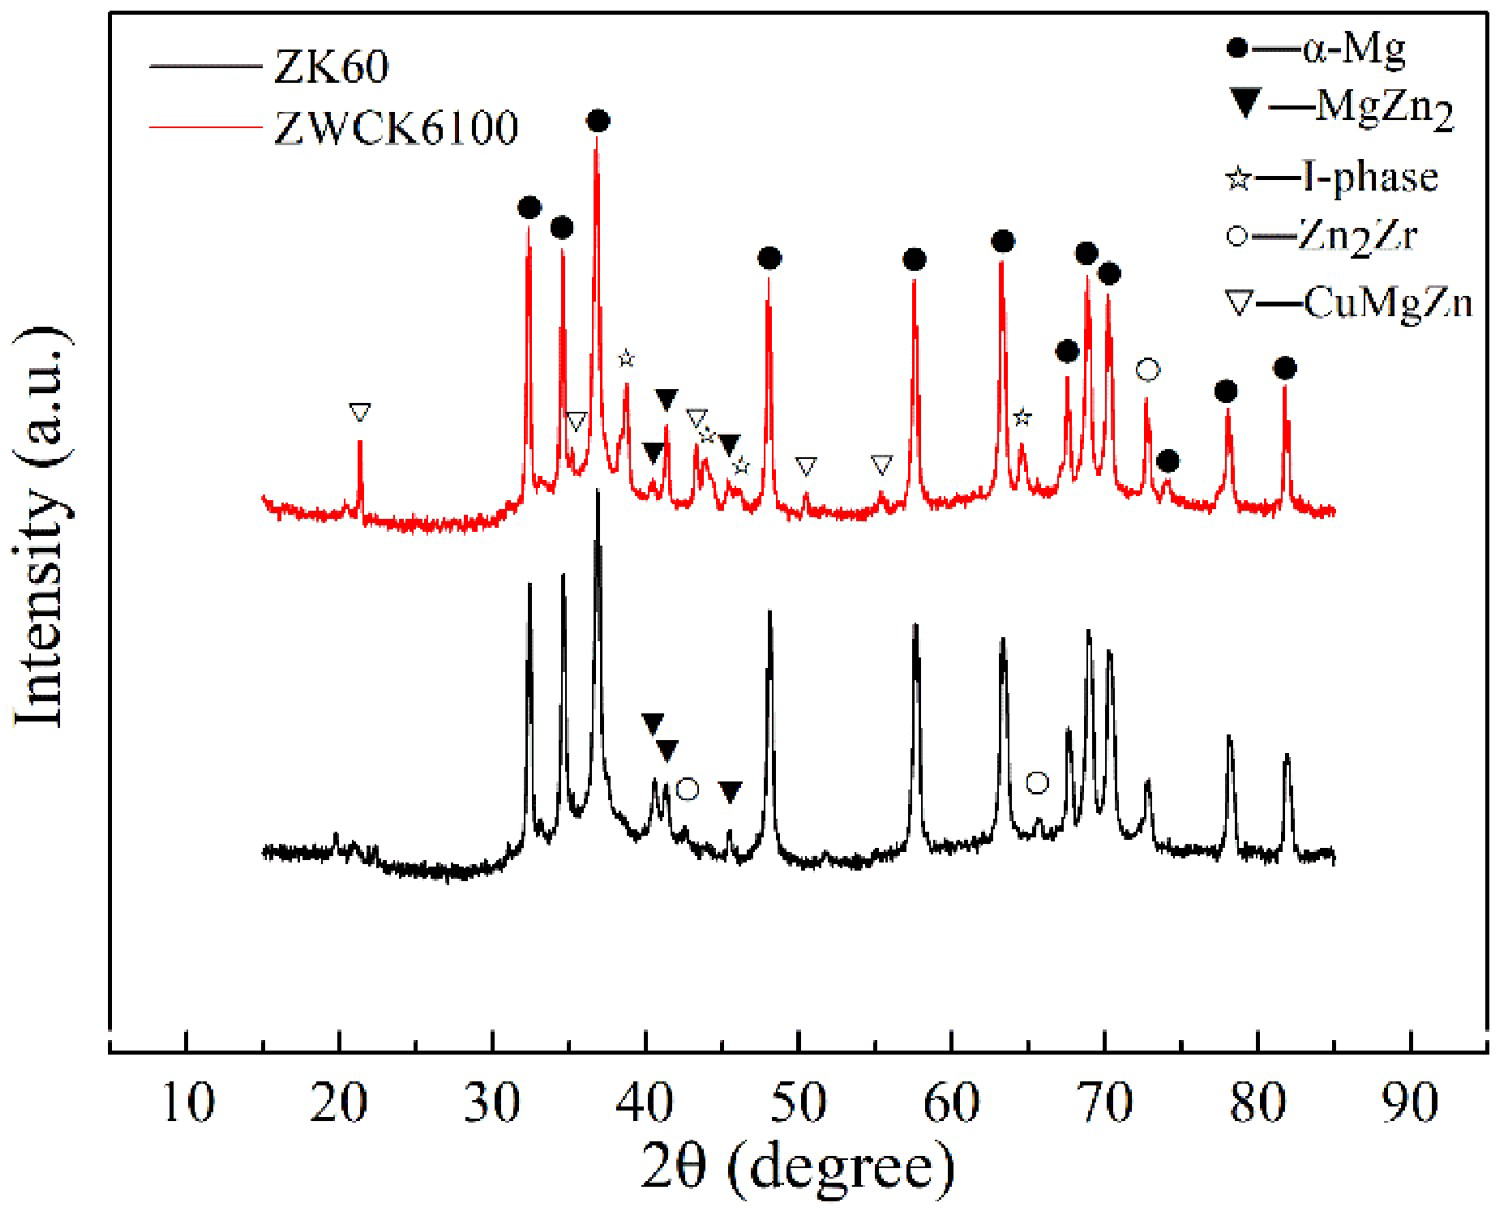
The textures of the studied alloys were described in length in our previous work by XRD and electron backscatter diffraction (EBSD) [25], the result revealed that both the tested alloys exhibited basal texture, and the maximum texture intensity of ZWCK6100 alloy (2.95) was higher than that of ZK60 alloy (1.80).
Electrochemical behaviour
Open circuit potential (OCP)
The representative OCP curves of ZWCK6100 and ZK60 alloys in 3.5 wt-% NaCl solution are displayed in Figure 3. It can be observed that the OCP curve of ZK60 alloy shifts positively at the initial stage and then reaches a relatively stable value, while the curve of ZWCK6100 alloy almost shows a stable value. OCP values of ZWCK6100 and ZK60 alloys are −1.531 and −1.558 VSCE, respectively, suggesting that a more protective film layer was formed on the surface of ZWCK6100 alloy.
OCP curves of ZWCK6100 and ZK60 alloys in 3.5 wt-% NaCl solution.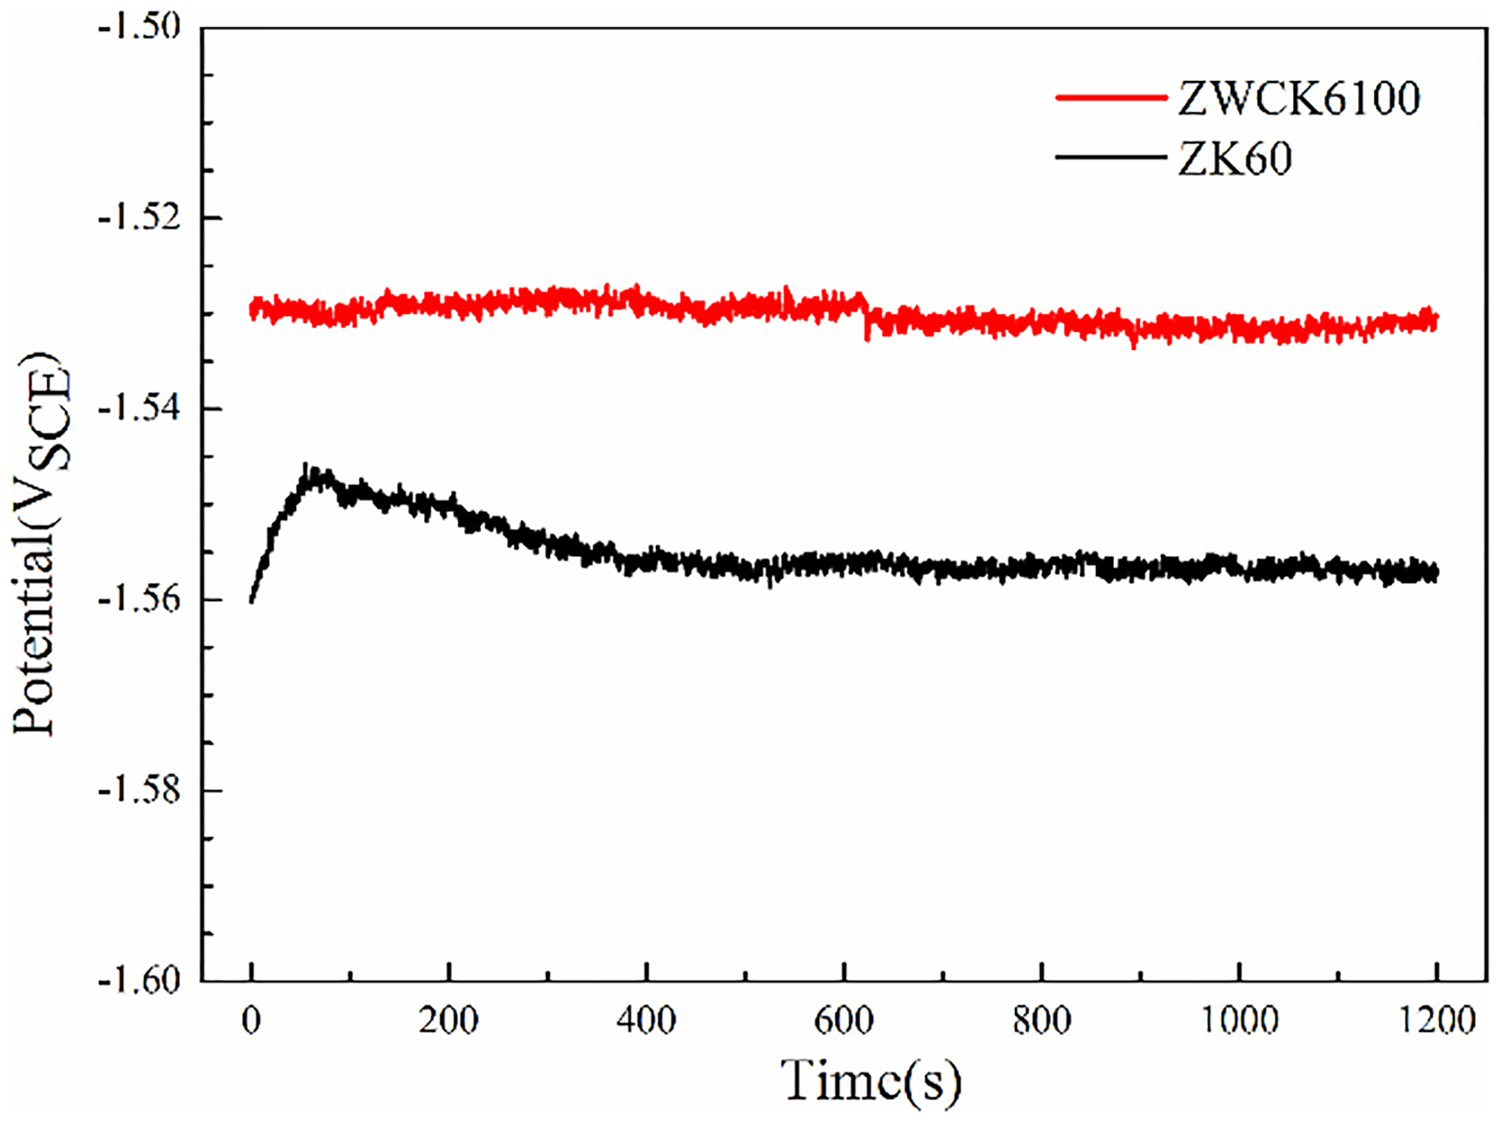
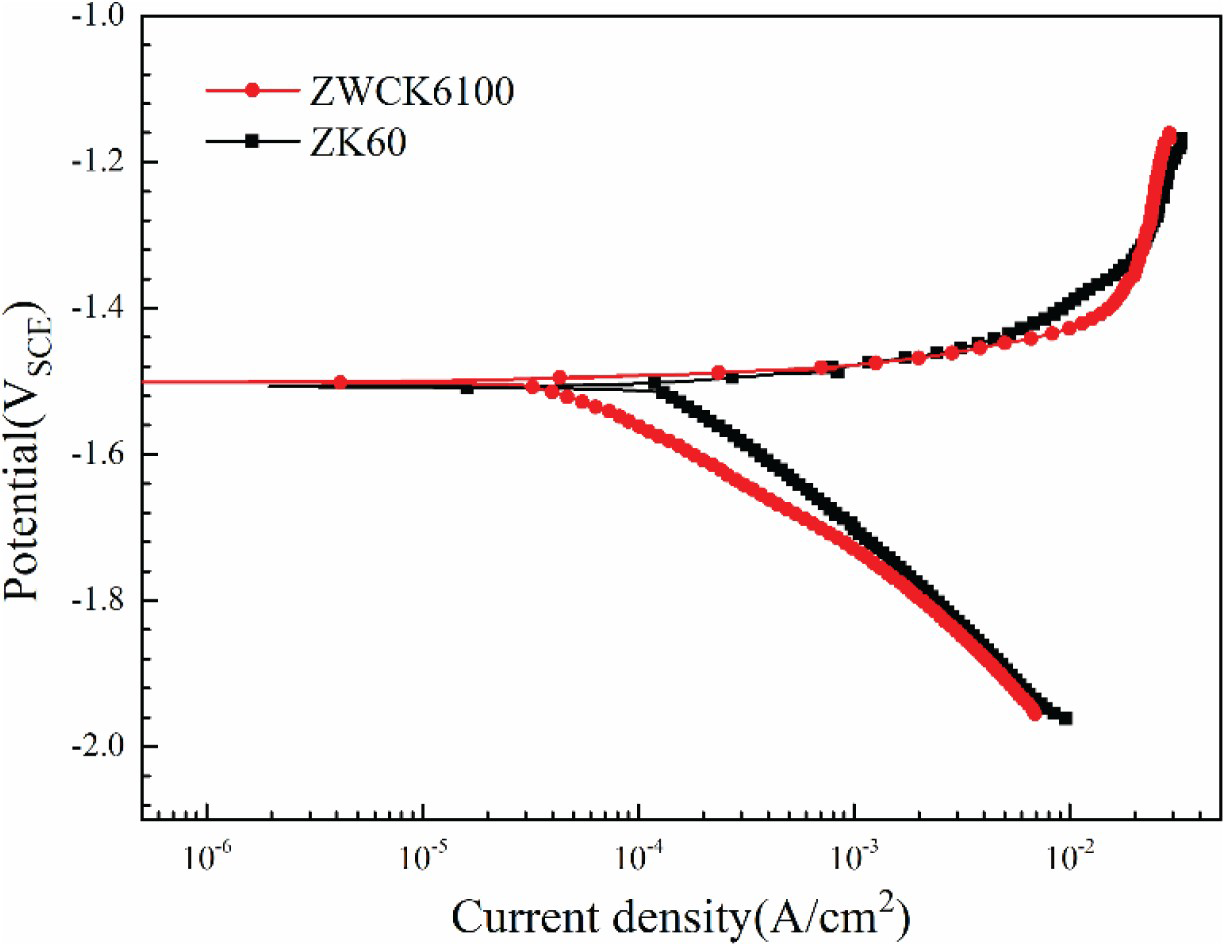
Potentiodynamic polarisation
Figure 4 presents the polarisation curves of ZWCK6100 and ZK60 alloys in 3.5 wt-% NaCl solution. The polarisation behaviour of the two tested alloys is similar that the anode branches are related to the dissolution of Mg, and cathode branches are associated with hydrogen evolution. Values of corrosion current density (i
corr) and corrosion potential (E
corr) can be obtained from the polarisation curves based on Tafel extrapolation method, where i
corr is estimated by Tafel extrapolation of the cathode branch of the polarisation curve, and the zero-current-density potential of the E-log(i) curve equals nearly to E
corr. Values of E
corr for ZWCK6100 and ZK60 alloys are −1.504 and −1.510 VSCE, respectively, indicating that there is no significant difference in corrosion driving force for the two tested alloys. However, the i
corr of the two alloys varies greatly, the values of ZWCK6100 and ZK60 alloys are 5.59 × 10⁻⁵ and 1.54 × 10⁻⁴ A cm−2, respectively. Equation (1) establishes the relationship between i
corr (mA cm−2) and corrosion rate (Pi
, mm y−1) [26], and the calculated values of Pi
are 1.28 and 3.52 mm y−1 for ZWCK6100 and ZK60 alloys, respectively. These parameters are listed in Table 1. Values of i
corr and Pi
suggest that ZWCK6100 alloy exhibits a lower corrosion rate, and the combined addition of Cu and Y can improve the corrosion resistance of Mg alloys.
Polarisation curves of ZWCK6100 and ZK60 alloys in 3.5 wt-% NaCl solution. Electrochemical parameters of ZWCK6100 and ZK60 alloys in 3.5 wt-% NaCl solution.
Electrochemical impedance spectroscopy (EIS)
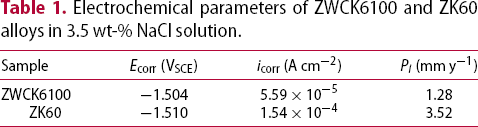
EIS measurements were performed to further analyse the corrosion behaviour of ZWCK6100 alloy, as displayed in Figure 5, and the fitting results as solid lines are also plotted in the figures. The Nyquist curves of the two alloys hold three loops, namely two capacitive loops at high and medium frequencies and one inductive loop at low frequency, which are indicated by Figure 5(a). The plot of phase angle-frequency containing two crests and one trough is shown in Figure 5(b), which is in accordance with the Nyquist plot. The plots of
EIS plots of ZK60 and ZWCK6100 alloys in 3.5 wt-% NaCl solution. (a) Nyquist plots, (b) phase angle-frequency plots, (c)
EIS fitting results of ZK60 and ZWCK6100 alloys in 3.5 wt-% NaCl solution. Z
Z
 -frequency in Figure 5(c) show that the impedance values of ZWCK6100 alloy are larger. The equivalent circuit of EIS plots is displayed in Figure 5(d), and the fitting results are listed in Table 2. R
s is the solution resistance, R
ct and CPE
dl refer to the charge transfer resistance and double electric layer, respectively. R
f and CPF
f represent the resistance and capacity of the corrosion products film, respectively. The inductive resistance (R
L) and inductance (L) are related to the corrosion products dissolve and localised corrosion occurrence. According to the fitting results, ZWCK6100 alloy exhibits a larger value of R
ct, suggesting that ZWCK6100 alloy has a higher corrosion resistance to dissolve in NaCl solution, which is consistent with the lower Pi
from polarisation curves, the larger R
f suggests that the corrosion products on the surface of ZWCK6100 alloy have a better ability to protect the Mg matrix against corrosion, which is consistent with the result of OCP.
-frequency in Figure 5(c) show that the impedance values of ZWCK6100 alloy are larger. The equivalent circuit of EIS plots is displayed in Figure 5(d), and the fitting results are listed in Table 2. R
s is the solution resistance, R
ct and CPE
dl refer to the charge transfer resistance and double electric layer, respectively. R
f and CPF
f represent the resistance and capacity of the corrosion products film, respectively. The inductive resistance (R
L) and inductance (L) are related to the corrosion products dissolve and localised corrosion occurrence. According to the fitting results, ZWCK6100 alloy exhibits a larger value of R
ct, suggesting that ZWCK6100 alloy has a higher corrosion resistance to dissolve in NaCl solution, which is consistent with the lower Pi
from polarisation curves, the larger R
f suggests that the corrosion products on the surface of ZWCK6100 alloy have a better ability to protect the Mg matrix against corrosion, which is consistent with the result of OCP.
 Z
Z
 -frequency plots and (d) equivalent circuit model.
Immersion behaviour
Figure 6 shows H2 volume of the two tested alloys immersed in 3.5 wt-% NaCl solution for 48 h. The volume of H2 increases with the immersion time, and differences in H2 volume between ZK60 and ZWCK6100 alloys appear at the initial stage and become larger with the increase of time. After immersion for 48 h, H2 volume of ZWCK6100 alloy is lower than that of ZK60 alloy.
H2 volume of ZK60 and ZWCK6100 alloys with immersion time in 3.5 wt-% NaCl solution.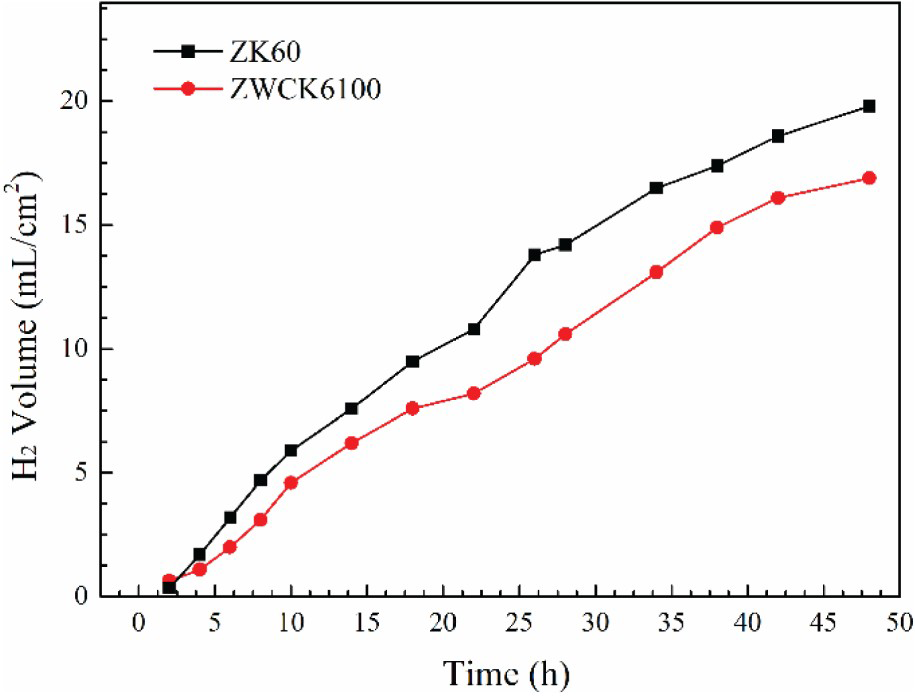
Additionally, corresponding weight losses (ΔW) of ZWCK6100 and ZK60 alloys after 48 h were calculated, and there were 1.818 and 2.143 mg cm−2, respectively. The corrosion rate Pw
(mm y−1) based on weight loss (mg cm−2 d−1) can be determined by Equation (2) [26]. The values of Pw
are 1.91 and 2.25 mm y−1 for ZWCK6100 and ZK60 alloys, respectively, implying that ZWCK6100 alloy shows a lower corrosion rate. The results of immersion measurements are in accord with the those determined by electrochemical tests.
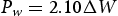
The corroded morphologies of the two alloys after immersion in 3.5 wt-% NaCl solution for 48 h are displayed in Figure 7. Figure 7(a) indicates evident localised corrosion occurring on the surface of ZK60 alloy, and larger corrosion pits can be observed at high magnification (Figure 7(b)). In contrast, ZWCK6100 alloy shows less corrosion destruction and the corrosion pits are smaller, as shown in Figure 7(c,d). The morphologies of the corroded surface demonstrate that ZWCK6100 alloy with combined addition of Y and Cu exhibits higher corrosion resistance.
Corroded morphologies of the tested alloys immersed for 48 h in 3.5 wt-% NaCl solution (a, b) ZK60 and (c, d) ZWCK6100, (a, c) low magnification and (b, d) high magnification.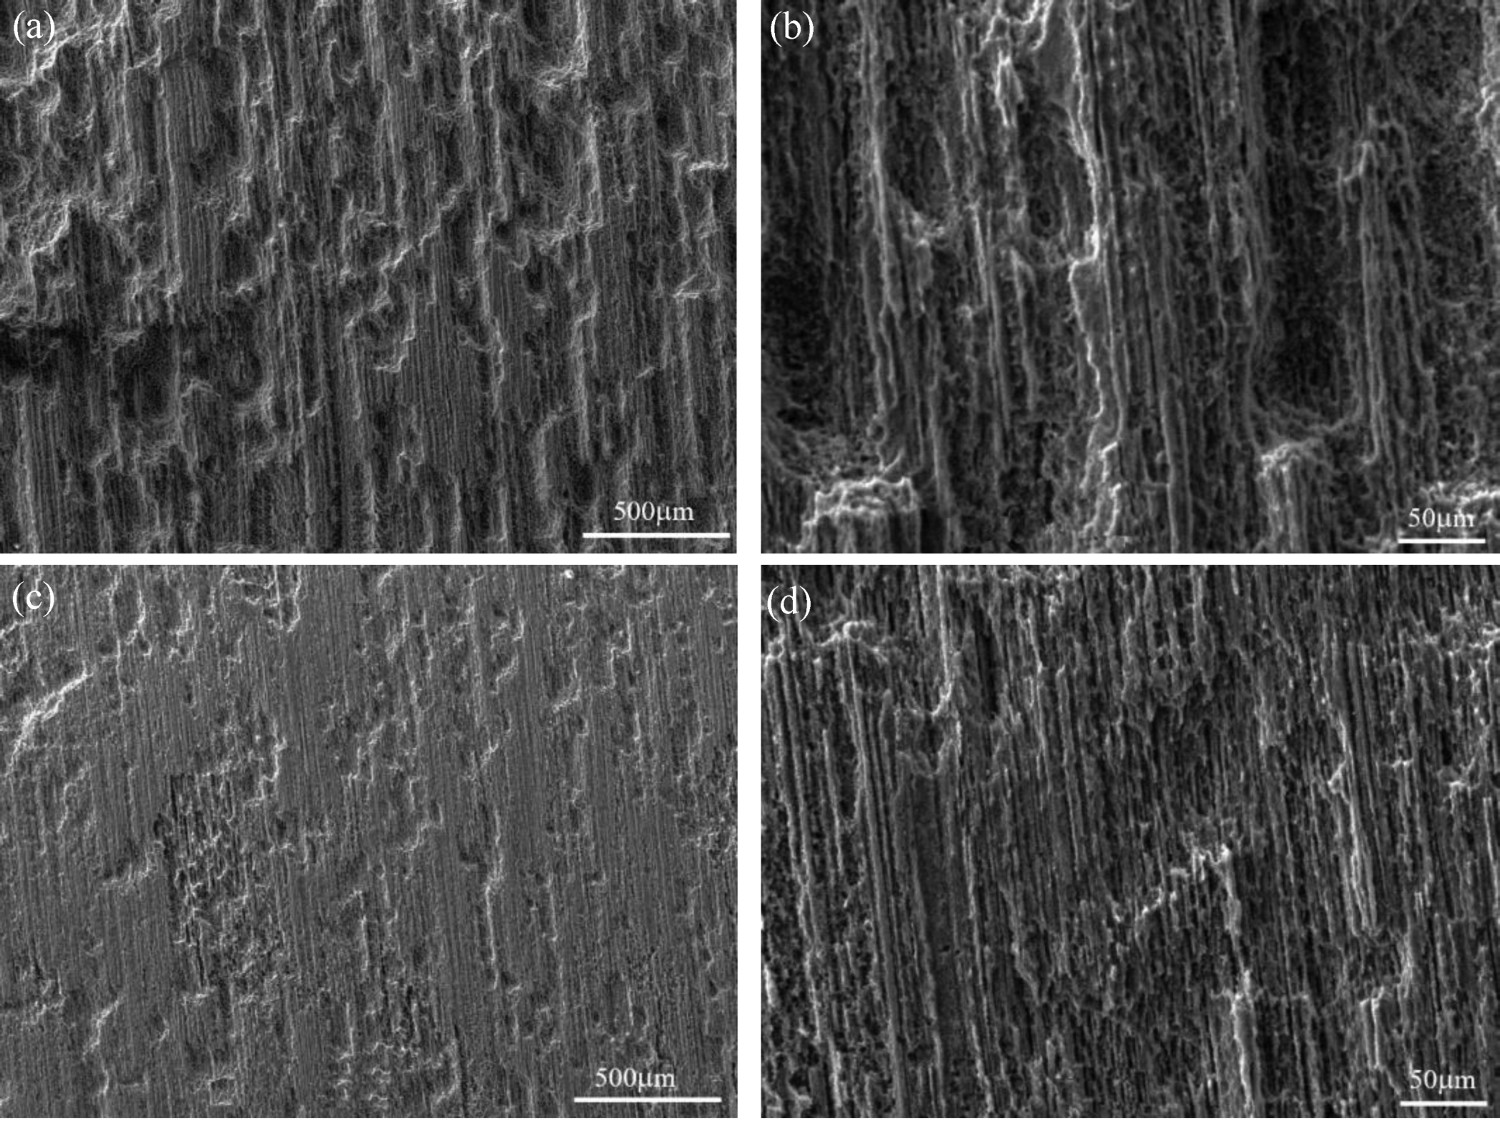
Discussion
Corrosion rates evaluated from polarisation curves Pi and weight loss Pw , corrosion resistance fitted by EIS, and corroded surface morphologies show a similar trend that ZWCK6100 alloy has superior corrosion resistance to ZK60 alloy in 3.5 wt-% NaCl solution.
Figure 1 reveals that ZK60 alloy exhibits very coarse unDRXed regions, and the size of unDRXed grain (19.65 µm) is 11.8 times that of DRXed grains (1.67 µm), resulting in larger averaged grain size and high inhomogeneity of microstructure. Meanwhile, the microstructure of ZWCK6100 is finer and more homogeneous than that of ZK60 alloy. Numerous studies have investigated the effect of grain refinement on the corrosion resistance of Mg alloys, and the results indicated that the finer the grain size, the higher the corrosion resistance [27-29]. A large number of grain boundaries generated by fine grains not only provide nucleation sites for the passivation film, but also act as the physical corrosion barriers to hinder corrosion, thus slowing down the corrosion rate. Additionally, grains with different sizes make the corrosion products produce more micro-cracks during the corrosion process and cannot form a uniform and dense corrosion product layer, which weakens the protective effect on Mg matrix. Fine grains most likely relieve the stress generated by the mismatch between MgO/Mg(OH)2 layers and Mg matrix. Based on the results of microstructure analysis, the fine grains and homogenous microstructure of ZWCK6100 alloy are conducive to slowing down the corrosion rate and improving the protective capability of the corrosion film. The calculated values of Pi and Pw and results of OCP (Figure 3) and EIS (Figure 5) have the same tendency as the grain sizes and can verify this conclusion.
Additionally, due to the high intrinsic reactivity of Mg, the potential difference between the second phases and α-Mg matrix will cause galvanic corrosion. These second phases formed in ZWCK6100 alloy with combined addition of Cu and Y, such as CuMgZn and I (Mg3Zn6Y) phases, are nobler than α-Mg matrix [16] and will act as cathodes and accelerate the corrosion rate. The volume fraction of CuMnZn phase is very low, because the addition amount of Cu is 0.5 wt-%, combustion loss is inevitable in the smelting process, and some Cu atoms replace Mg atoms in I phase [25]. Therefore, the effect of CuMnZn phase on the corrosion resistance of ZWCK6100 alloy is limited. I phase formed in situ as a second phase in Mg alloy has attracted much attention. Luo [28] reported that I phase exhibited superior corrosion resistance. Shi [30] studied the effect of I phase on the corrosion behaviour of Mg-Zn alloy and reported that the icorr
of Mg-Zn alloy decreased by one order of magnitude due to the existence of I phase, resulting from Y2O3 formed in the oxide film. Figure 8 presents the XRD spectra of the oxide products on the surface of the two tested alloys after immersion measurements. It discloses that Y2O3 and Y(OH)3 are formed on the surface of ZWCK6100 alloy, in addition to Mg(OH)2. It has been reported that the Polling-Bedworth ratio of Y2O3 is 1.39 [31], suggesting that the protective ability of oxide film and diffusion resistance to the corrosive solution can be improved by Y2O3. Therefore, OCP and Rf values of ZWCK6100 alloy are larger, and the surface morphology is even and less corroded.
XRD patterns of corrosion products of ZK60 and ZWCK6100 alloys in 3.5 wt-% NaCl solution.
Furthermore, texture also has an important effect on the corrosion resistance of Mg alloys. On the one hand, the corrosion rate is related to the strength of chemical bonding, which varies with the packed density. Atoms in planes with higher packed density are more difficult to corrode in a corrosive solution due to the stronger atomic bonding [32-34]. For Mg and its alloys, {0001} plane has the highest atomic density (1.13 × 10¹⁹ atoms m−2) and the lowest surface energy (15.4 kJ mol−1). Therefore, {0001} basal plane gets the lowest corrosion rate. The stronger basal texture of ZWCK6100 alloy indicates that there are more {0001} planes aligned parallel to ED, resulting in a higher value of R ct (Table 2) and lower corrosion rate (Pi and Pw ). On the other hand, the textural intensity also affects the formation of oxide layers, and the value of R f will increase with the atomic density [33]. It is consistent with the results that ZWCK6100 alloy with stronger basal texture has a higher R f value.
It can be concluded that the corrosion behaviour of ZWCK6100 alloy with combined additions of Y and Cu is affected by several factors, including grain size, microstructural homogeneity, second phase and texture.
Conclusions
A novel ZWCK6100 (Mg–6Zn–0.5Zr–1.0Y–0.5Cu) alloy was fabricated, and its corrosion behaviour was investigated by electrochemical tests and immersion measurements in 3.5 wt-% NaCl solution. The main conclusions are summarised as follows:
Both the tested alloys exhibit bimodal microstructures with DRXed and elongated unDRXed grains, and extrusion texture, while ZWCK6100 alloy has a finer grain size, more homogeneous microstructure and a stronger basal texture. Compared with ZK60 alloy, ZWCK6100 alloy with combined addition of Y and Cu contains CuMgZn and I phase (Mg3Zn6Y) in addition to α-Mg, MgZn2 and Zn2Zr phases. The corrosion rates evaluated from electrochemical tests and immersion measurements show the same trend that ZWCK6100 alloy has a lower corrosion rate (P
i and P
w) in 3.5 wt-% NaCl solution. It can be attributed to its refined grain, more homogeneous microstructure, stronger basal texture and the formation of Y2O3/Y(OH)3 in corrosion products film.
Footnotes
Disclosure statement
No potential conflict of interest was reported by the author(s).