
Abstract
In this paper, the effect of cooling rate on solidification behaviour, microstructure evolution and mechanical properties of Al-refined Mg-9Gd-4Y-1Zn was studied. As cooling rate decreased, grain size increased and when cooling rate was 32.5°C/s, grain size was the smallest (30.57 µm). The second phases included lamellar LPSO, block-like Mg3 (Zn, RE), granular Al2RE and acicular Al2RE. As cooling rate decreased, the content of granular Al2RE increased, while that of other phases decreased. As cooling rate decreased, ultimate tensile strength (UTS), yield strength (YS) and elongation all decreased. When cooling rate was 32.5°C/s, the mechanical properties were the best, and UTS, YS and elongation were 228.2 MPa, 158.2 MPa and 8.8%, respectively.
Introduction
At present, magnesium alloys have been widely applied in the national economy [1,2]. However, due to the low strength, the application of magnesium alloys in aerospace and other important fields is limited [3,4]. Therefore, how to develop high-strength magnesium alloys has become the target pursued by many researchers. It has been found that Mg-RE phase can pin dislocations effectively during loading process and play a significant role in strengthening [5]. Although commercial Mg-RE alloys have been applied, for example, WE alloys [6,7], they are far from adequate for current engineering application. In recent years, because of good solid solution and precipitation strengthening effect [8-10], Gd and Y have attracted extensive attention and Mg-Gd-Y alloys have been a research hotspot. Adding Zn to Mg-Gd-Y alloys can form LPSO phase [11,12], and then achieve enhanced effect. In industrial production, gravity casting is an important way to prepare components with complex geometric dimensions. The grain size of casting alloys is quite coarse, and Zr is often used as a refiner [13,14], which is usually added in form of Mg-Zr intermediate alloy, but Zr refinement has the disadvantage of high cost and low utilisation [15,16]. These limit its extensive application. Therefore, on the basis of ensuring refinement effect, how to reduce the cost has become the pursuit of industrial production. Al is also an effective refiner [17]. Adding Al to Mg-Gd-Y alloys can form Al2RE phase in situ [18], and achieve remarkable refinement effect [19]. The refining effect of Al is better than that of Zr, and Al-refined grains do not grow easily in solution process [20]. In addition, Al can not only refine Mg-RE alloys but also regulate phase composition [21], while Zr has only a single refining function [22]. Therefore, the development of high-strength Mg-Gd-Y-Zn-Al alloys has broad application prospects.
The wall thickness of complex castings is different, which means that there are different cooling rates, resulting in different as-cast microstructures. Therefore, cooling rate can significantly affect mechanical properties [23]. Based on this, cooling rate has become the focus of the majority of researchers. Sun et al. [24] found grain size decreased at first and then increased with the increase of cooling rate. Pang et al. [25] found that as cooling rate increased, α-Mg nucleation temperature increased and eutectic reaction temperature decreased. In Mg-Gd-Y-Al alloy, Dai [26] found cooling rate could significantly change the quantity density and distribution of nucleating particle Al2RE. Adding Al to Mg-4Y-3Nd, Wang [27] found refining effect was affected by Al2RE particles. The faster cooling rate, the smaller grain size. As cooling rate increased, the content of second phases increased dramatically. Under the condition of adding different RE elements to AZ91 and increasing cooling rate, Cai et al. [28] found not only the size and content of Mg17Al12 phase decreased, but also grain size decreased significantly. Although lots of research work has been done on cooling rate in Mg-RE alloys and many research results have been achieved, the research on cooling rate is mainly focused on refinement and solidification behaviour in Zr refined Mg-RE alloys. So far, it is uncommon to report the effect of cooling rate on mechanical properties of Al-refined Mg-Gd-Y-Zn alloys and effect mechanism of cooling rate has not been clear. The research results are all obtained under the premise of constant cooling rate, which are prepared by metal moulds [29-31]. Sand moulds are usually adopted in industrial production. As is known to all, the cooling rate of sand moulds is much lower than that of metal moulds. So the research results obtained on the Mg-RE alloys prepared with metal moulds, have limited reference significance. Therefore, it is of great significance to research cooling rate in Al-refined Mg-9Gd-4Y-1Zn alloy prepared with sand moulds.
Experimental methodology
In this article, self-made Mg-9Gd-4Y-1Zn-1Al (named GY9411) alloy was used as research object, and raw materials were Mg-RE intermediate alloys including Mg-30Gd and Mg-30Y, pure Zn, pure Al and pure Mg. Resistance furnace and steel crucible were used for smelting. Smelting was carried out in protective atmosphere (0.5 vol.% SF6 + 99.5 vol.% CO2) and the melting temperature was 780°C. The feeding sequence was Mg, Mg-RE intermediate alloys, Zn and Al, respectively. It took about 30 min for the raw materials to melt. Stirring for 1 min and holding for 5 min were the next necessary procedures. Slag removal was carried out before melt poured into a preheated sand mould. Schematic diagram of the sand mould was shown in Figure 1. Temperature of solidification process was recorded by thermocouples attached to a computer equipped with a data acquisition system. The temperature measurement positions of thermocouples were also shown in Figure 1. The sample was cooled in the air.
Schematic diagram of sand mould and temperature measurement positions of thermocouples.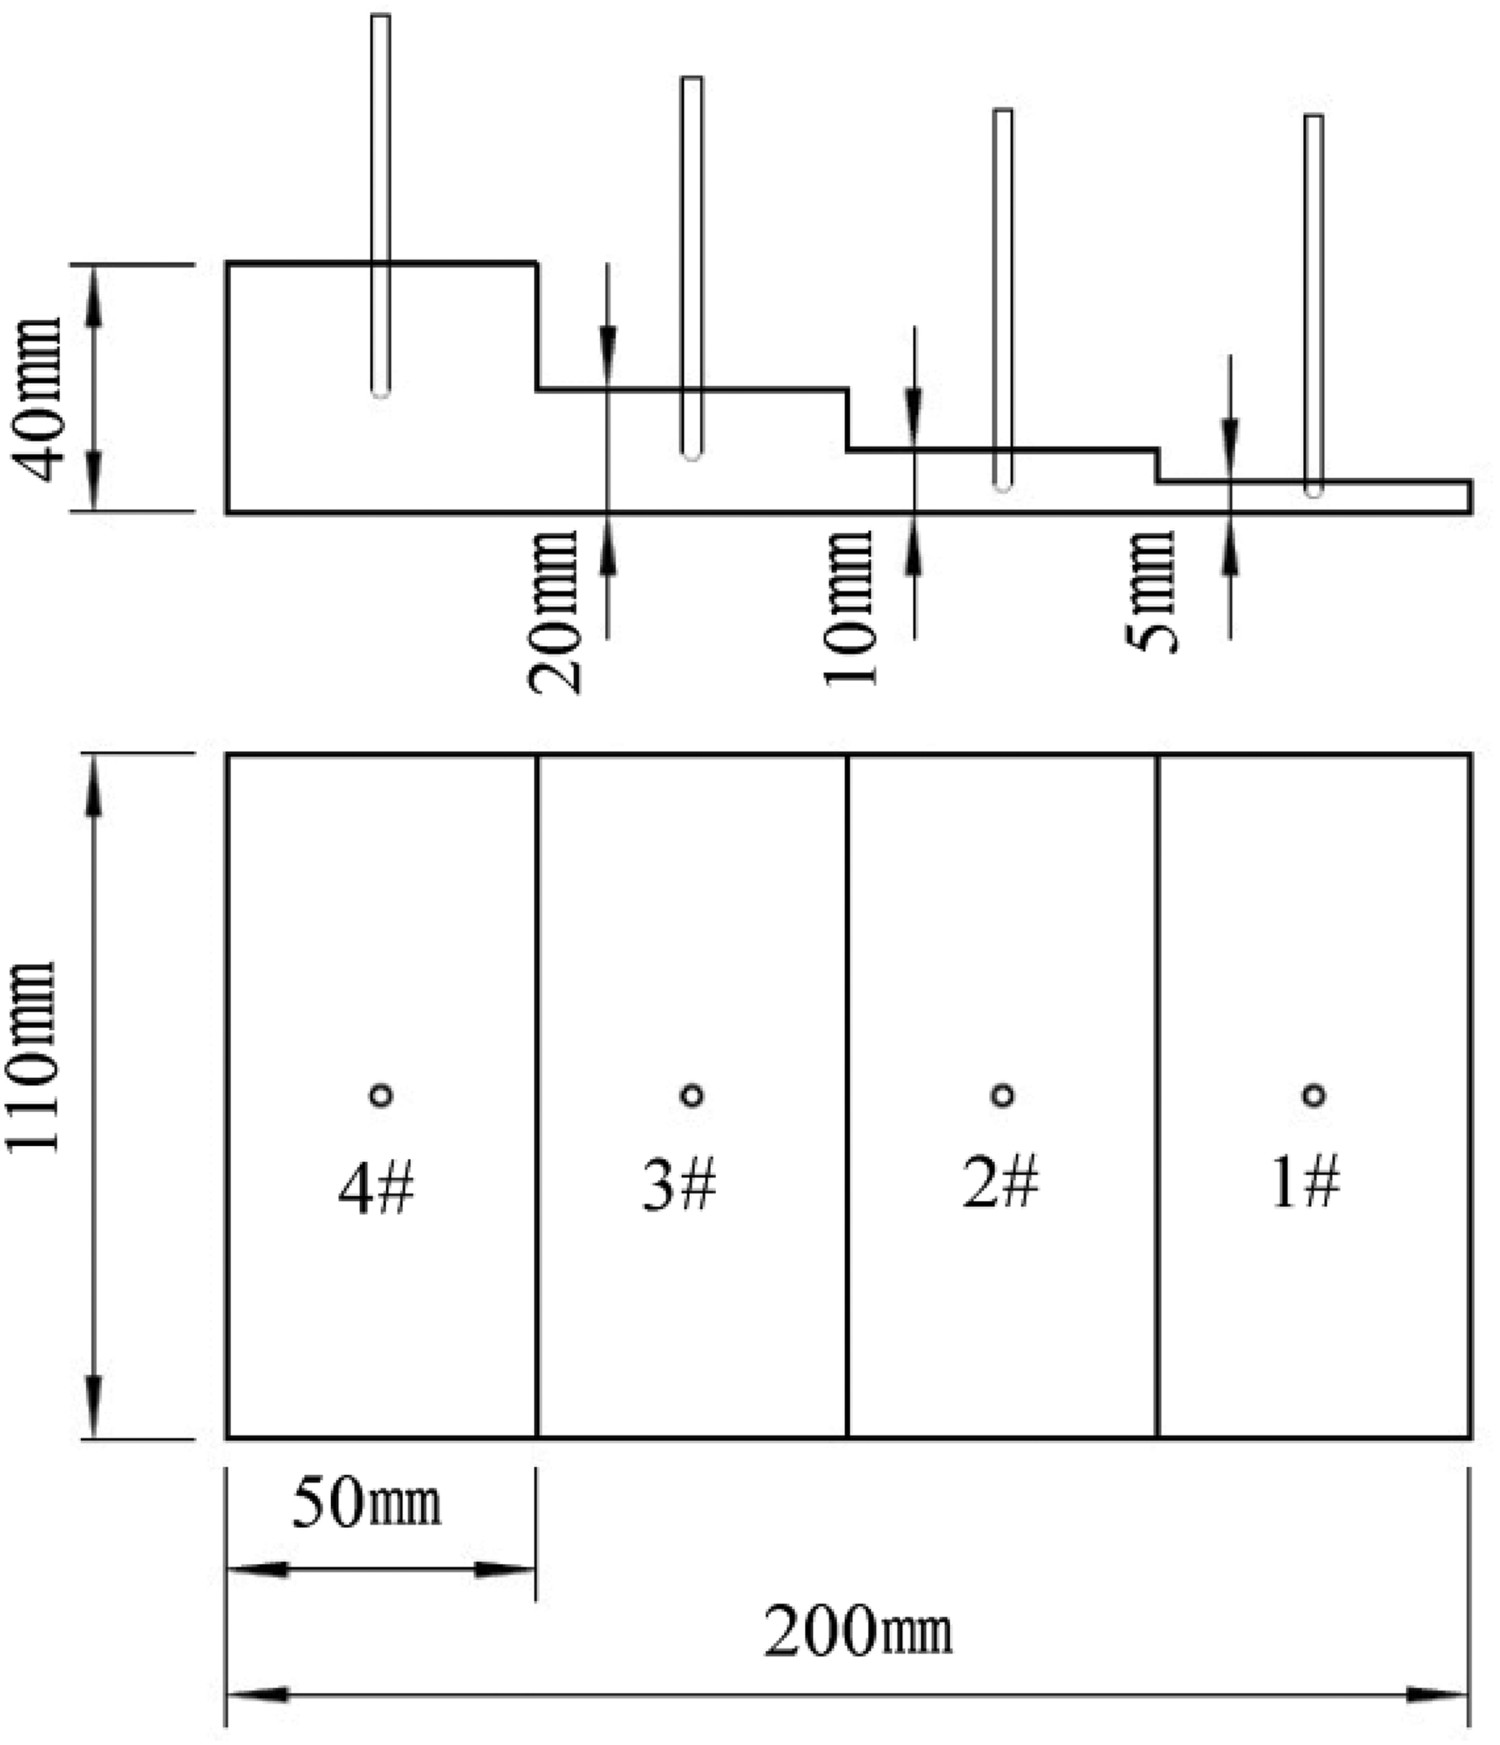
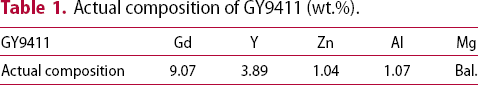
Actual composition of GY9411 (wt.%).
Results and discussion
Solidification behaviour of GY9411 alloy
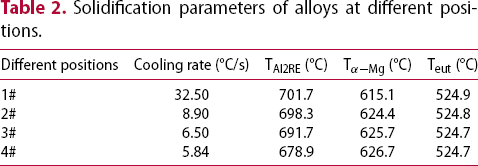
Cooling curves of GY9411 alloy are presented in Figure 2(a). Melting temperature decreases gradually with the prolongation of time. The larger the slope of cooling curve, the faster cooling rate. Therefore, cooling rate of 1# is the fastest and that of 4# is the slowest. In addition, there is a platform on each cooling curve, which means there is a precipitated phase. Cooling curve only reflects variation of temperature with time, so it is necessary to carry out other means to characterise solidification behaviour, such as the first derivative curve. Cooling curve and the first derivative curve of 4# are shown in Figure 2(b). Cooling rate is characterised by the slope of cooling curve in liquid region. The inflection point on the first derivative curve and the slope variation of cooling curve, indicate there is a new phase and the temperature corresponding to the inflection point is the precipitation temperature of this phase. Combined with phase composition of Mg-RE-Zn-Al [29], the solidification parameters of GY9411 alloy are determined, as shown in Figure 2(b). TAl2RE, Tα-Mg and Teut represent the precipitation temperature of Al2RE, α-Mg and eutectic phase, respectively. The same method is used to 1#, 2# and 3#, and the specific results are presented in Table 2. It can be seen, as cooling rate increases, precipitation temperature of Al2RE increases and that of Mg decreases, while that of eutectic phase changes little.
Curves of GY9411 alloy (a) Cooling curves; (b) Cooling curve and the first derivative curve of 4#. Solidification parameters of alloys at different positions.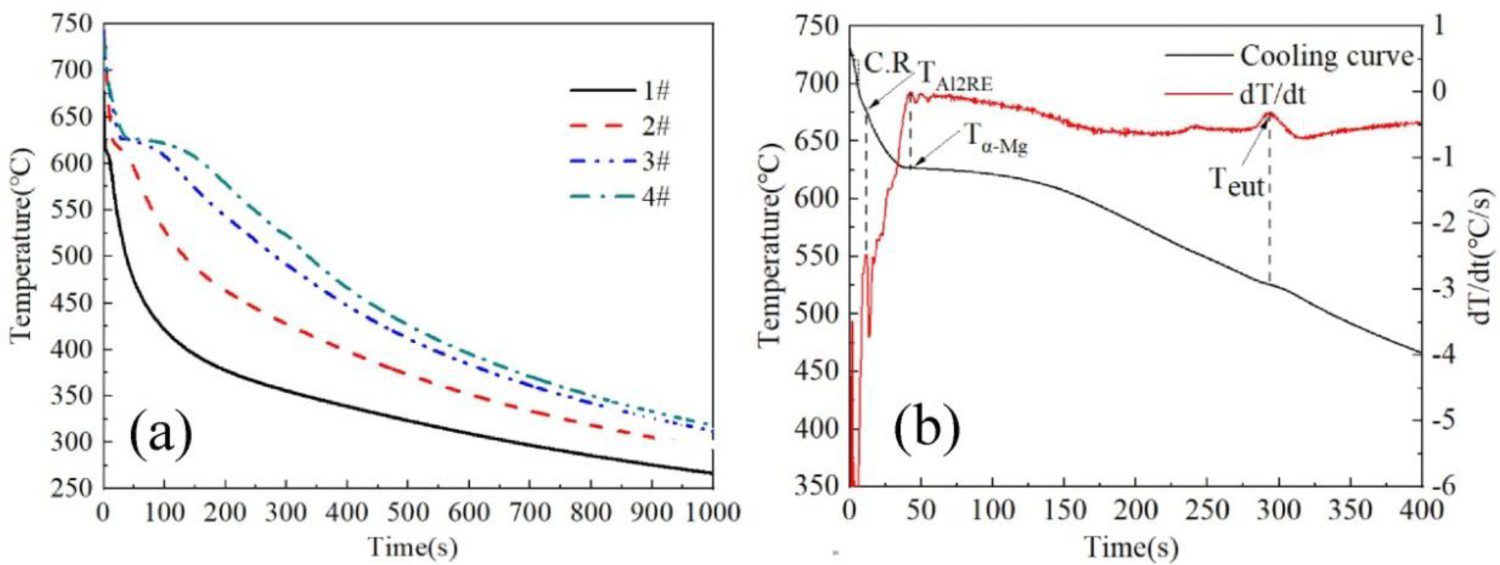
Microstructures of as-cast GY9411 alloy
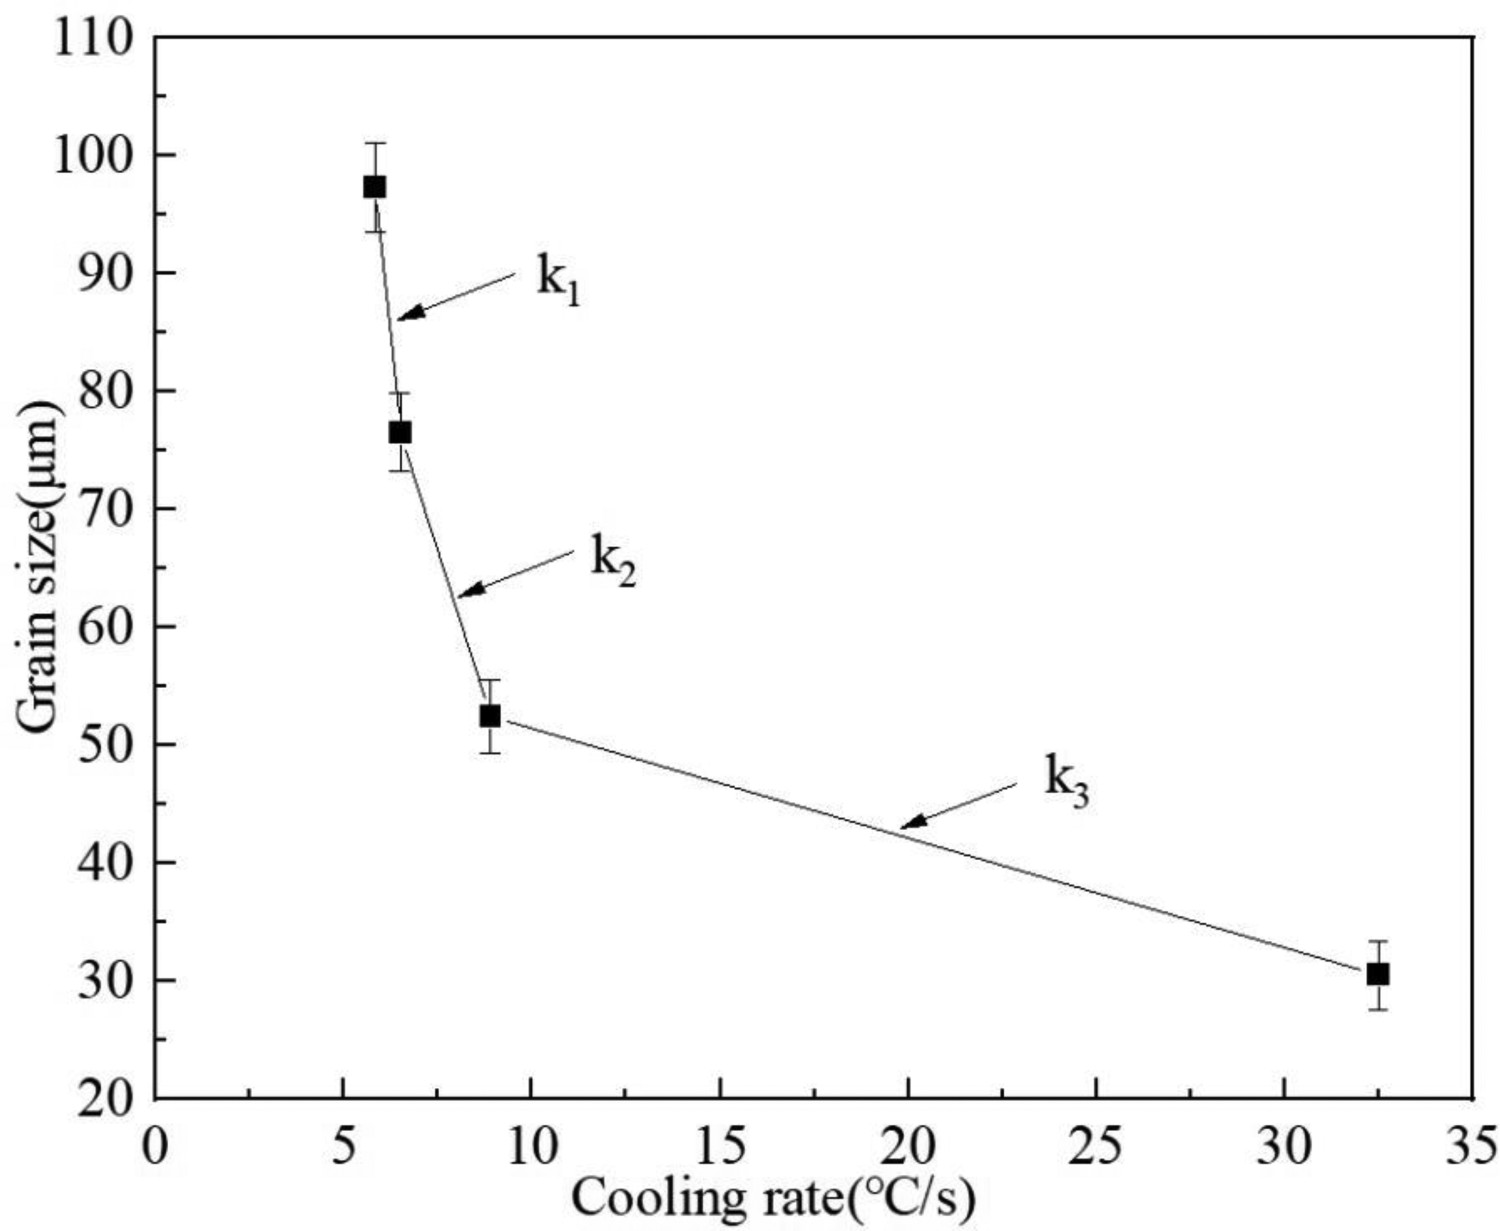
Polarising microstructures of GY9411 alloy are presented in Figure 3. It can be seen cooling rate can alter grain size significantly. Grain size is measured with linear intercept method and the results are presented in Figure 4. As cooling rate increases, grain size continues to decrease and when cooling rate is 32.5°C/s, grain size reaches the minimum value (30.57 µm). The decreasing rate of grain size can be characterised by the slope of the straight line between cooling rates. The slopes are denoted by k
1, k
2 and k
3 (Figure 4), respectively. The slope of the line can be determined from the coordinates of two points. So k
1, k
2 and k
3 are determined 31.56, 10.03 and 0.93, respectively. Because k
1, k
2 and k
3 decrease in turn, the decreasing rate of grain size slows down gradually.
Polarised microstructure of GY9411 alloy at different cooling rates (a) 32.50°C/s; (b) 8.90°C/s; (c) 6.50°C/s; (d) 5.84°C/s. Effect of cooling rate on grain size of GY9411 alloy.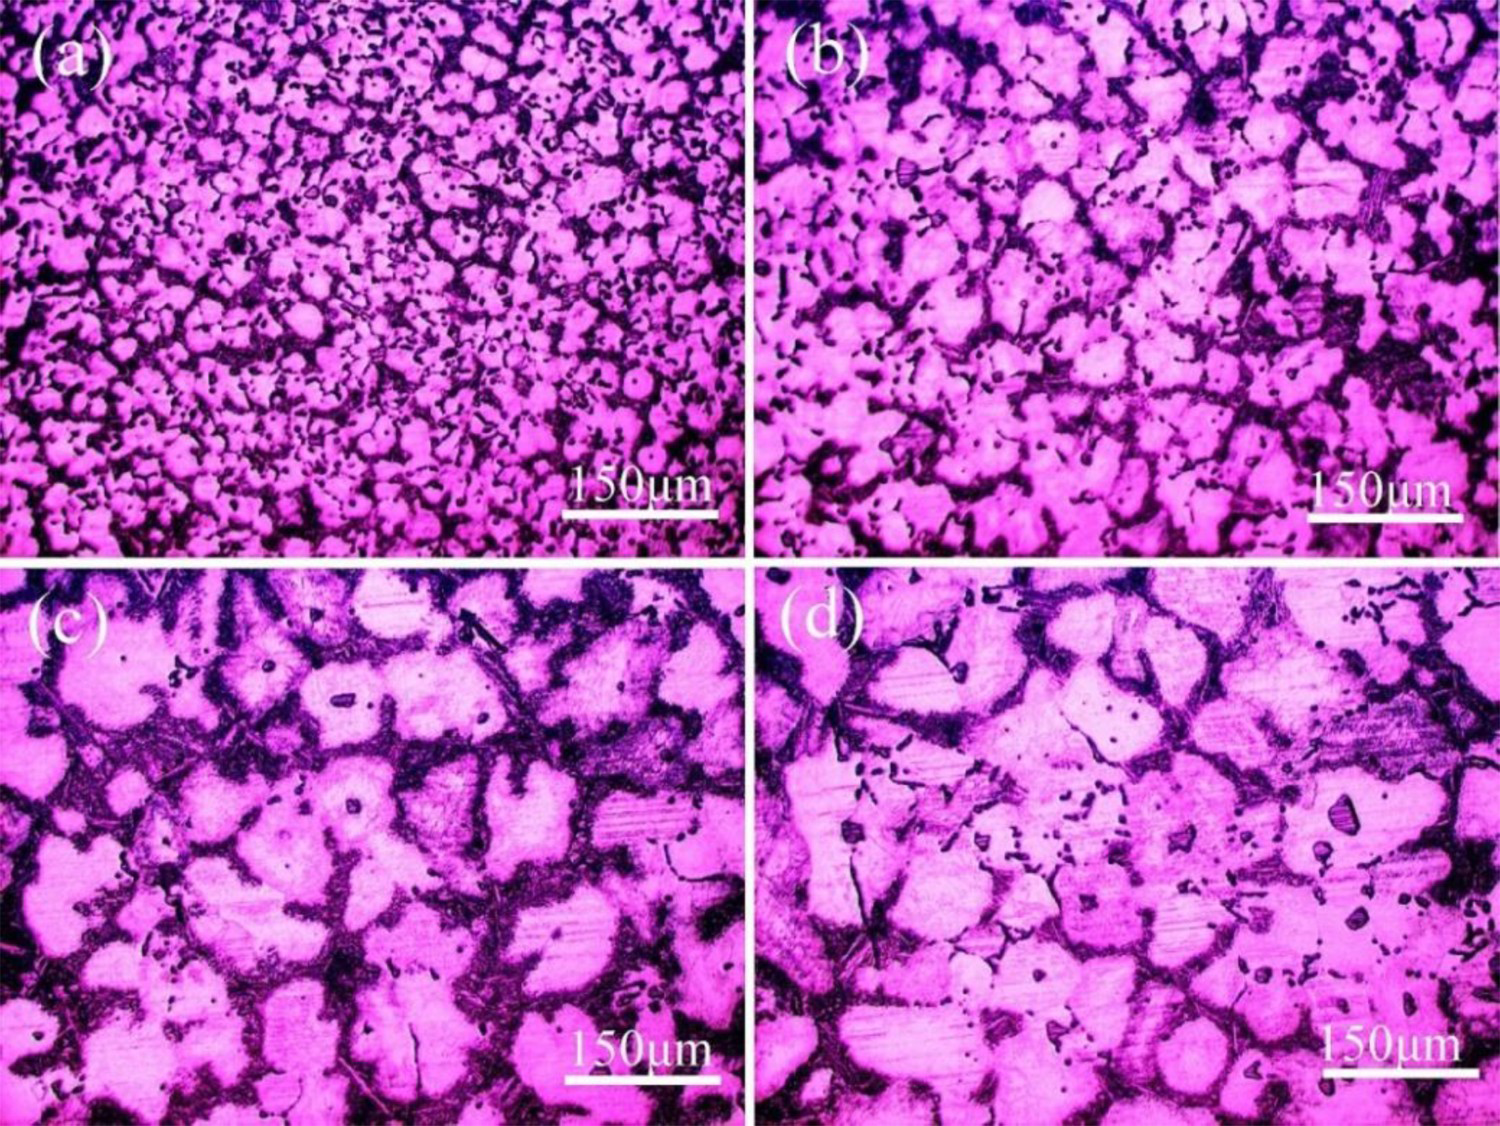
XRD patterns of GY9411 alloy are presented in Figure 5. As can be seen there are four kinds of phases and those of the phases are the same at different cooling rates. The four phases are α-Mg, Al2RE, Mg12ZnRE (LPSO) and Mg3(Zn, RE), which is consistent with the research results of Fu [32]. This indicates cooling rate does not alter phase composition. As we all know, the second phases strengthening is the most important in as-cast Mg-RE alloys, so it is necessary to characterise the second phases in detail, especially LPSO phase and Mg3(Zn, RE) phase.
XRD patterns of GY9411 alloy at different cooling rates.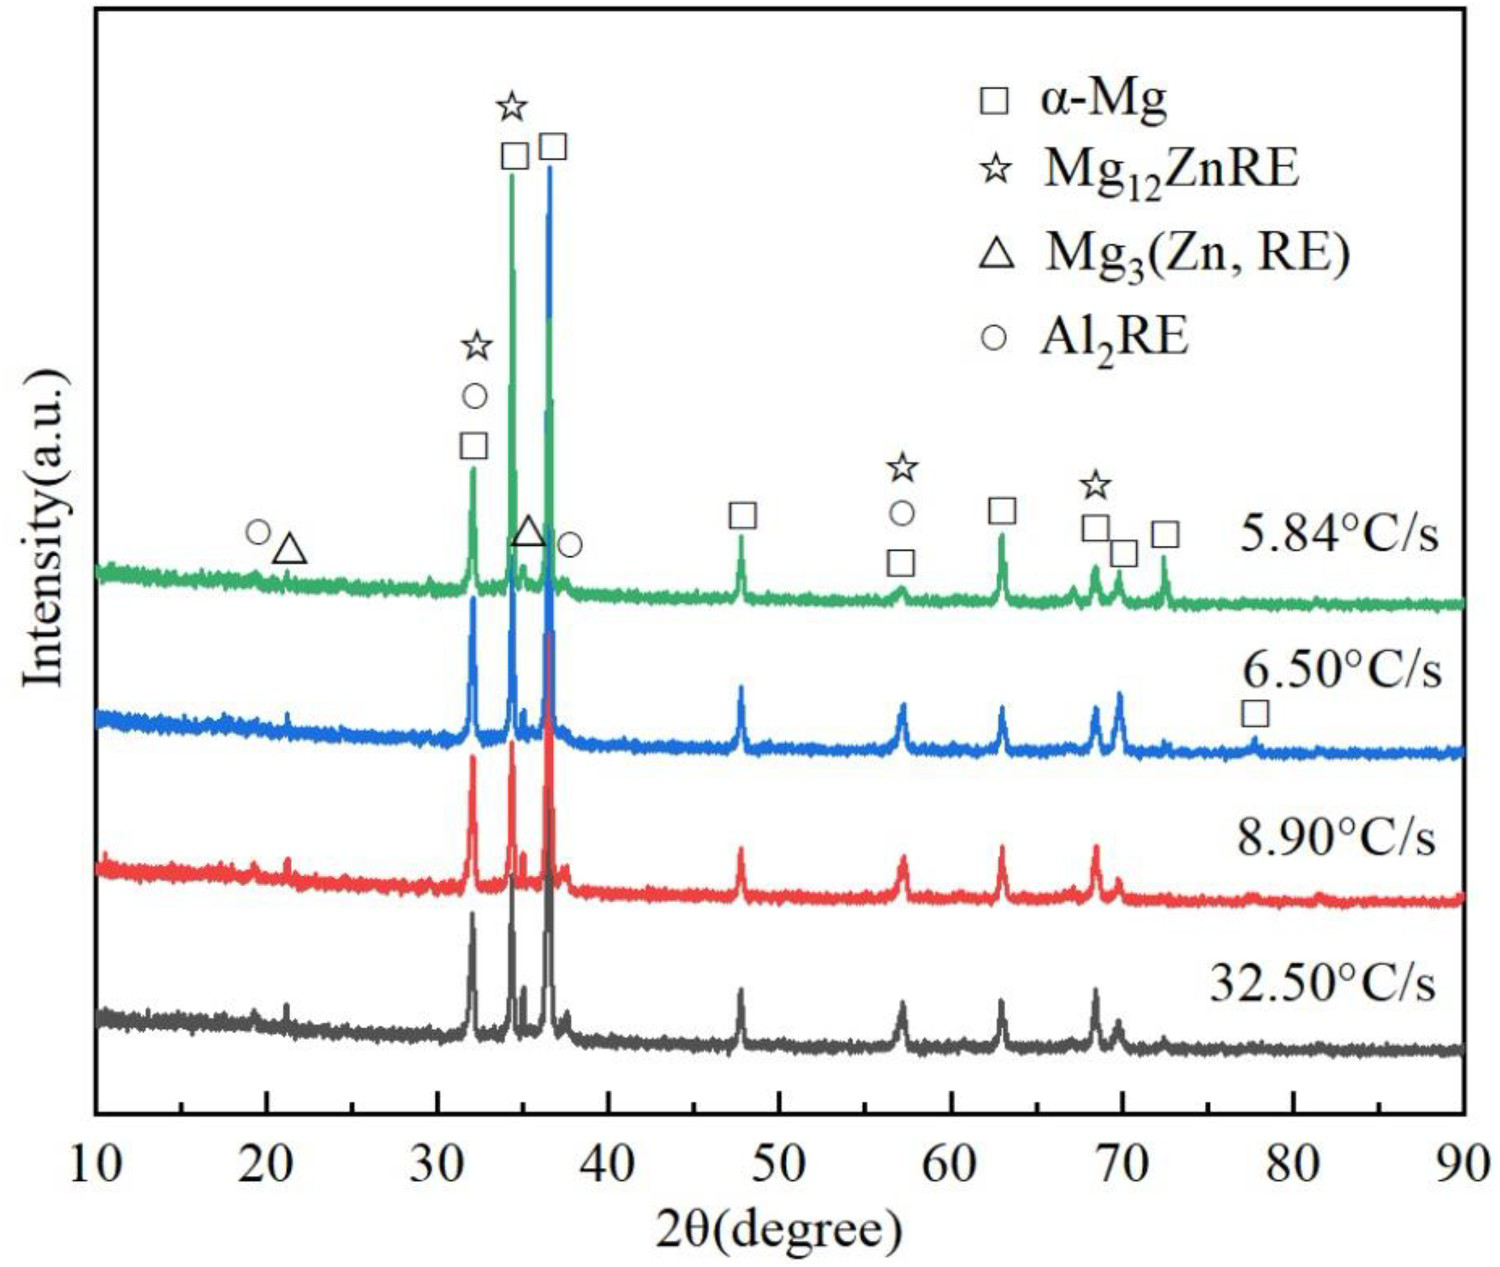
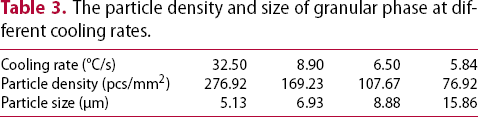
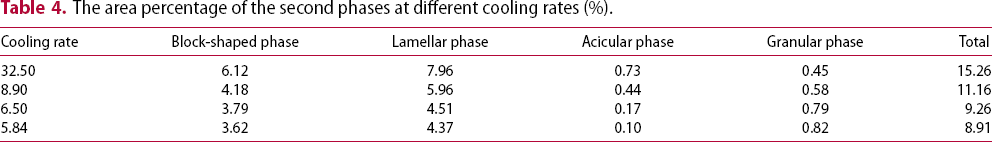
Metallographic microstructures of GY9411 alloy are presented in Figure 6. The second phases in each microstructure consist of four morphological phases, which include granular phase, acicular phase, lamellar phase and block-shaped phase. Granular phase is inside α-Mg grains, and the other three phases exist near or at the grain boundaries. As cooling rate decreases, the size of all second phases increases dramatically. Particle density and size of granular phase are measured by counting method and linear intercept method, respectively, and the results are presented in Table 3. It can be seen, as cooling rate decreases, particle density of granular phase decreases significantly, while the size increases obviously. The content of the second phases is determined by Image Pro Plus 6.0 and Photoshop (after colouring the second phases with Photoshop, Image Pro Plus 6.0 is used to calculate the phase content by colour comparison), and the results are presented in Table 4, which show total content of the second phases decreases with the decrease of cooling rate. It is also worth noting that the content of granular phase increases, while the contents of the others all decrease.
Metallographic microstructures of GY9411 alloy at different cooling rates (a) 32.50°C/s; (b) 8.90°C/s; (c) 6.50°C/s; (d) 5.84°C/s. The particle density and size of granular phase at different cooling rates. The area percentage of the second phases at different cooling rates (%).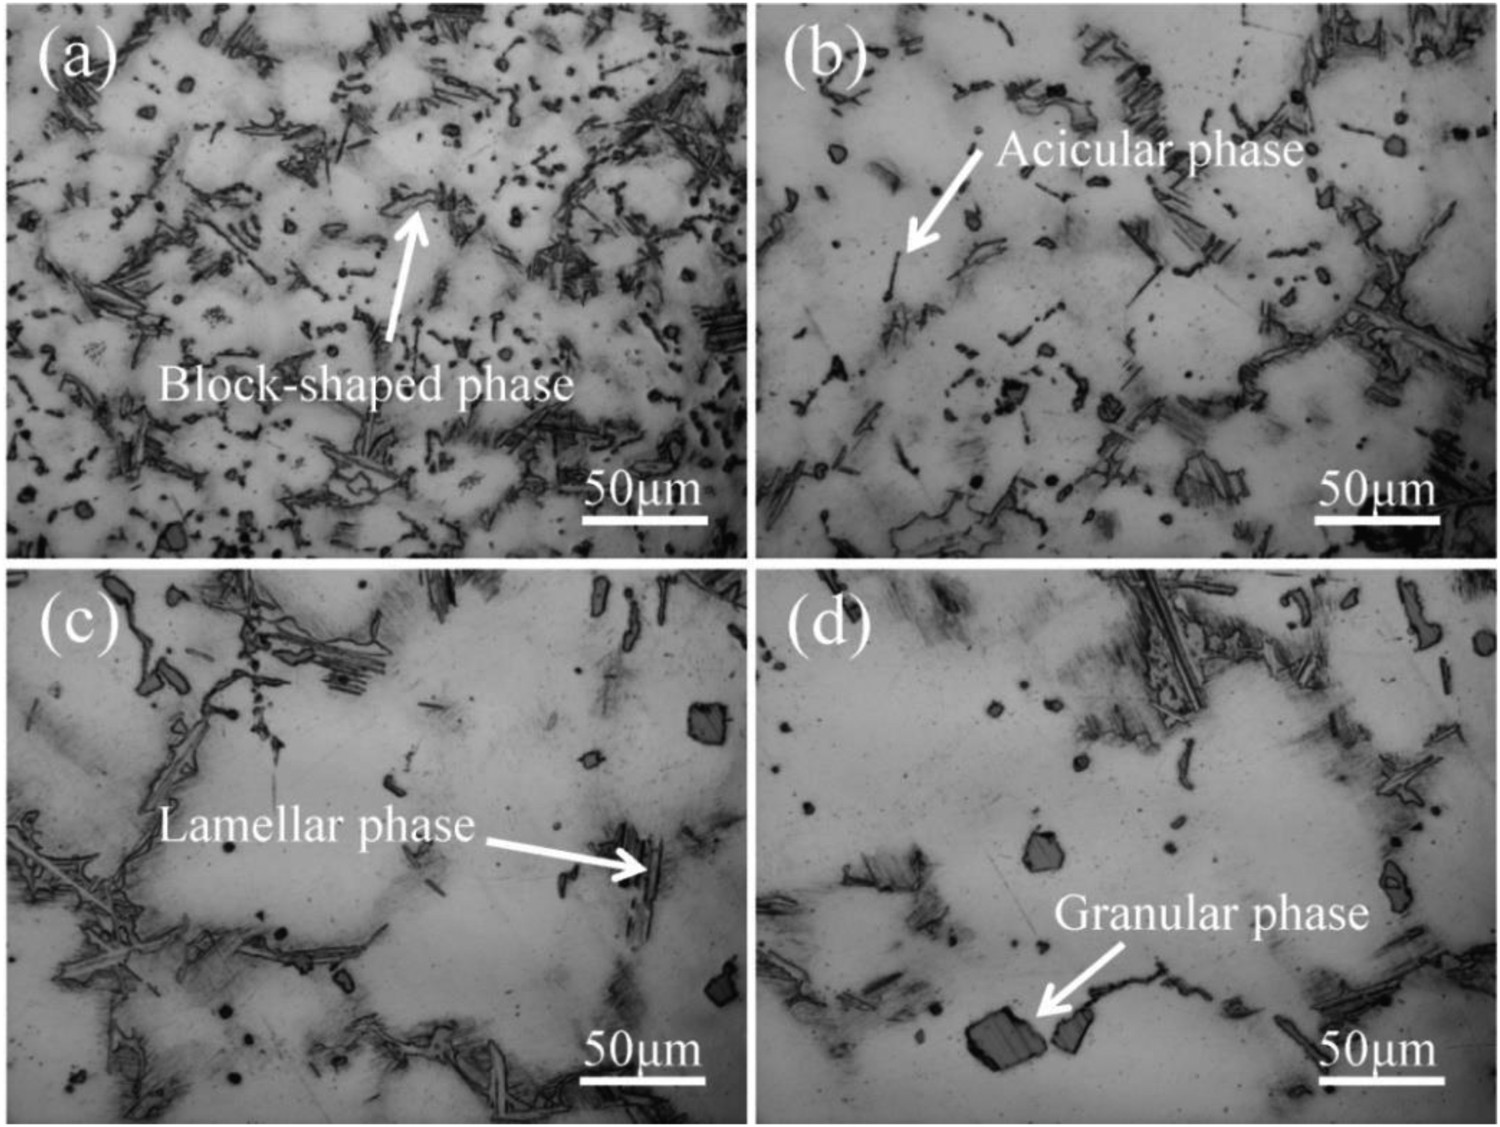
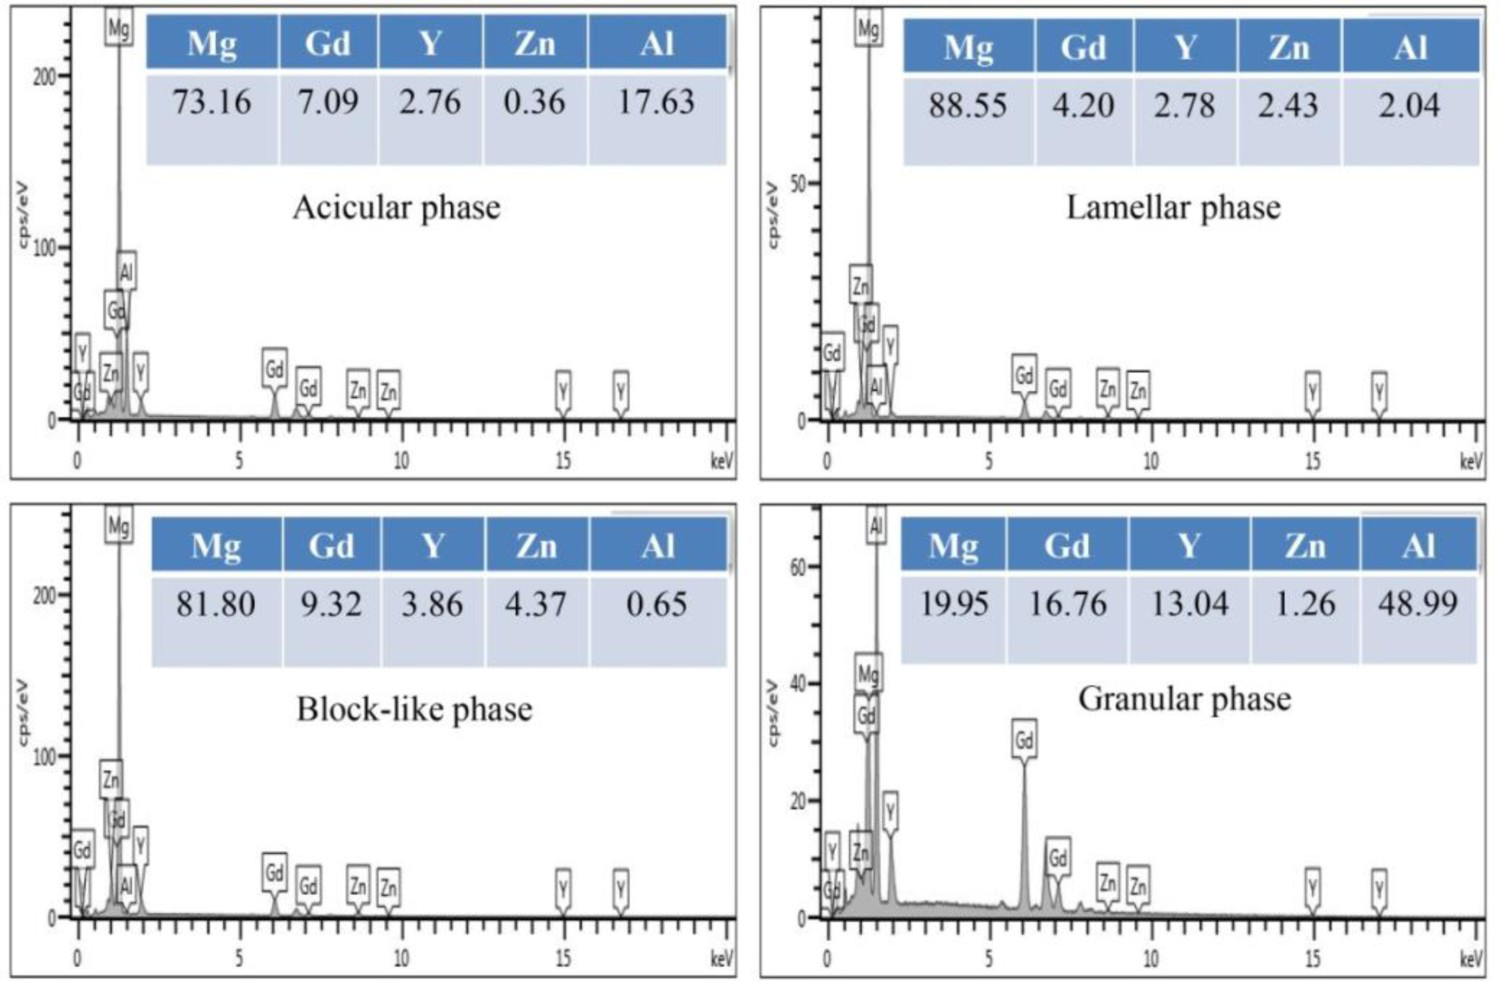
SEM images of GY9411 alloy are presented in Figure 7. SEM image corresponding to each cooling rate is composed of five morphological phases, as shown by the arrows. The five morphologic phases consist of acicular phase marked as A, lamellar phase marked as B, block-like phase marked as C, granular phase marked as D and black matrix phase marked as E. The energy spectrum results of five morphologic phases are shown in Figure 8. It can be seen from Figure 7 that black matrix phase accounts for the majority of the whole SEM microstructure, so it can be inferred that the black matrix phase is α-Mg. The atomic ratio of Al to RE in granular phase is approximately equal to 2:1, as is that in acicular phase. So it can be inferred that granular phase and acicular phase are both Al2RE. According to the XRD results above, there are four types of phases including α-Mg, Al2RE, Mg12ZnRE (LPSO) and Mg3(Zn, RE). So lamellar phase and block-like phase consist of Mg12ZnRE (LPSO) and Mg3(Zn, RE). The atomic ratio of Mg to RE and Zn in lamellar phase is approximately equal to 10:1, while the atomic ratio of Mg to RE and Zn in block-like phase is approximately equal to 4.7:1. Block-like phase has higher solute content than that of lamellar phase (Figure 8) and solute content of Mg3(Zn, RE) is higher than that of Mg12ZnRE (LPSO), so it is identified that lamellar phase is LPSO, and block-like phase is Mg3(Zn, RE). There is a deviation in atomic ratio here, which may be caused by uneven microstructure.
SEM images of GY9411 alloy at different cooling rates (a) 32.50°C/s; (b) 8.90°C/s; (c) 6.50°C/s; (d) 5.84°C/s. The energy spectrum results of the second phases (at.%).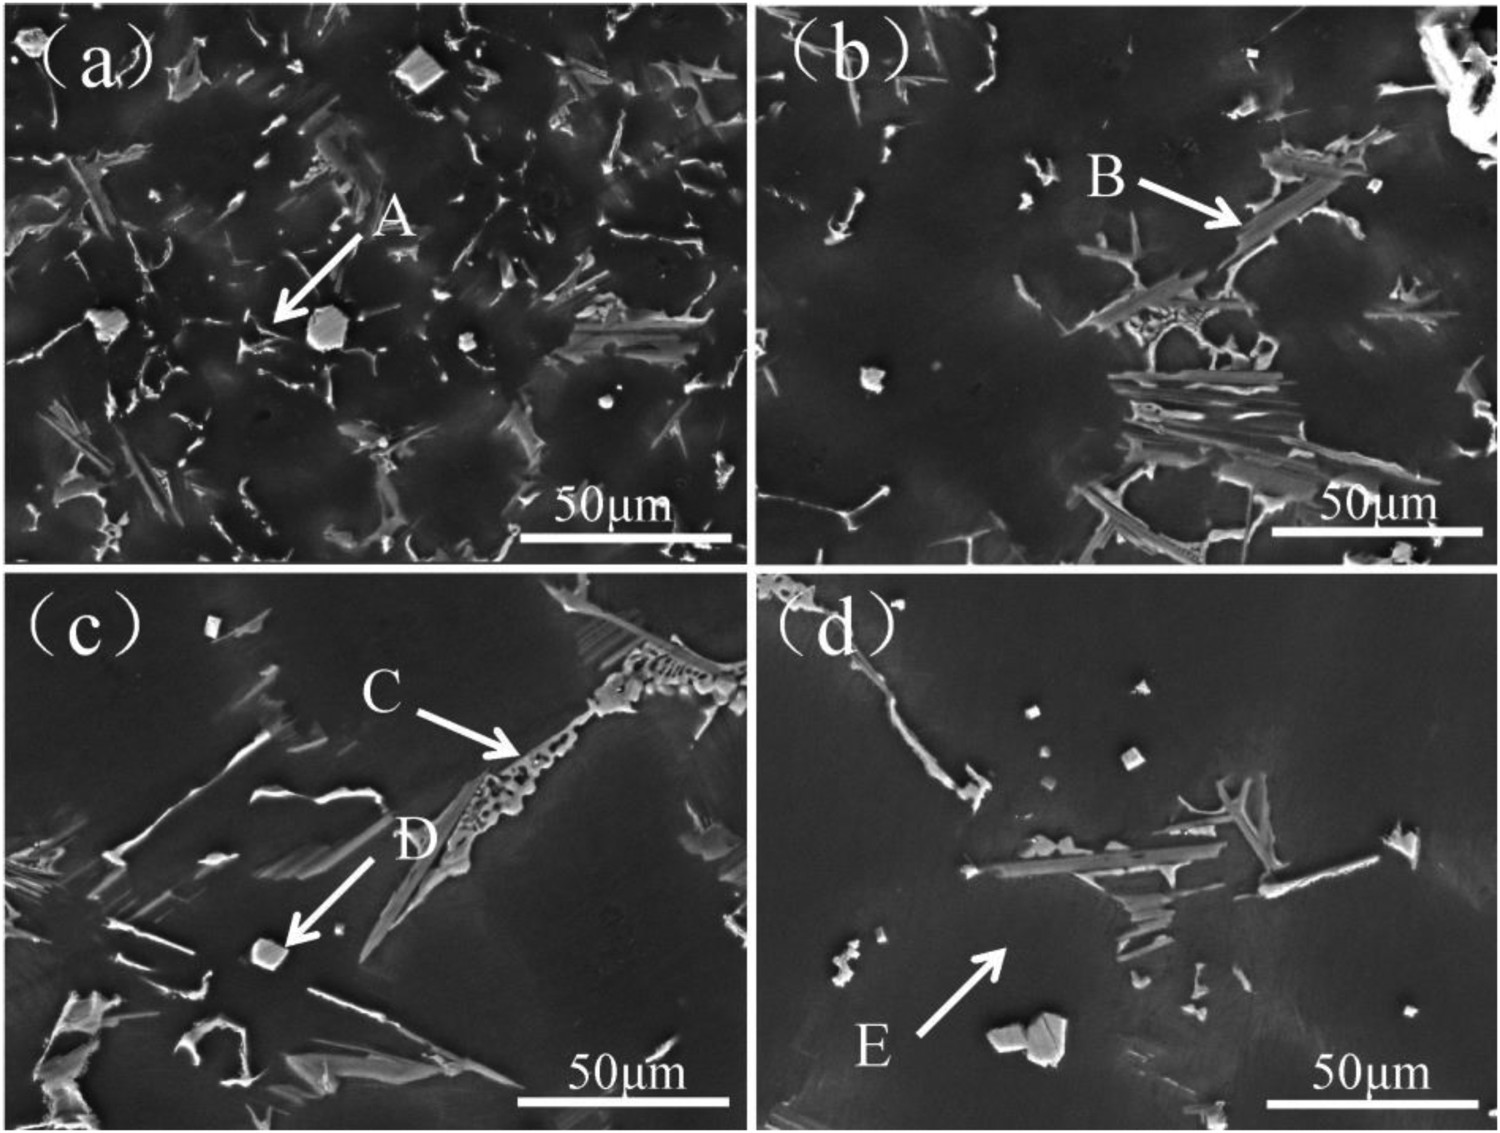
Effect of cooling rate on the mechanical properties of GY9411 alloy
The mechanical properties of GY9411 alloy are presented in Figure 9. As cooling rate decreases, ultimate tensile strength (UTS), yield strength (YS) and elongation all decrease monotonically. When cooling rate is 32.50°C/s, UTS, YS and elongation all reach the maximum value, which are 228.2, 158.2 MPa and 8.8%, respectively. According to the same method above, the decreasing rates of UTS, YS and elongation in each cooling rate interval can be successively determined, and the results are presented in Table 5. As cooling rate decreases, the decreasing rates of UTS, YS and elongation increase significantly, which shows the lower cooling rate, the greater the effect of its variation on UTS, YS and elongation.
Effect of cooling rate on the mechanical properties of GY9411 alloy. The decreasing rates of UTS, YS and elongation in each cooling rate interval.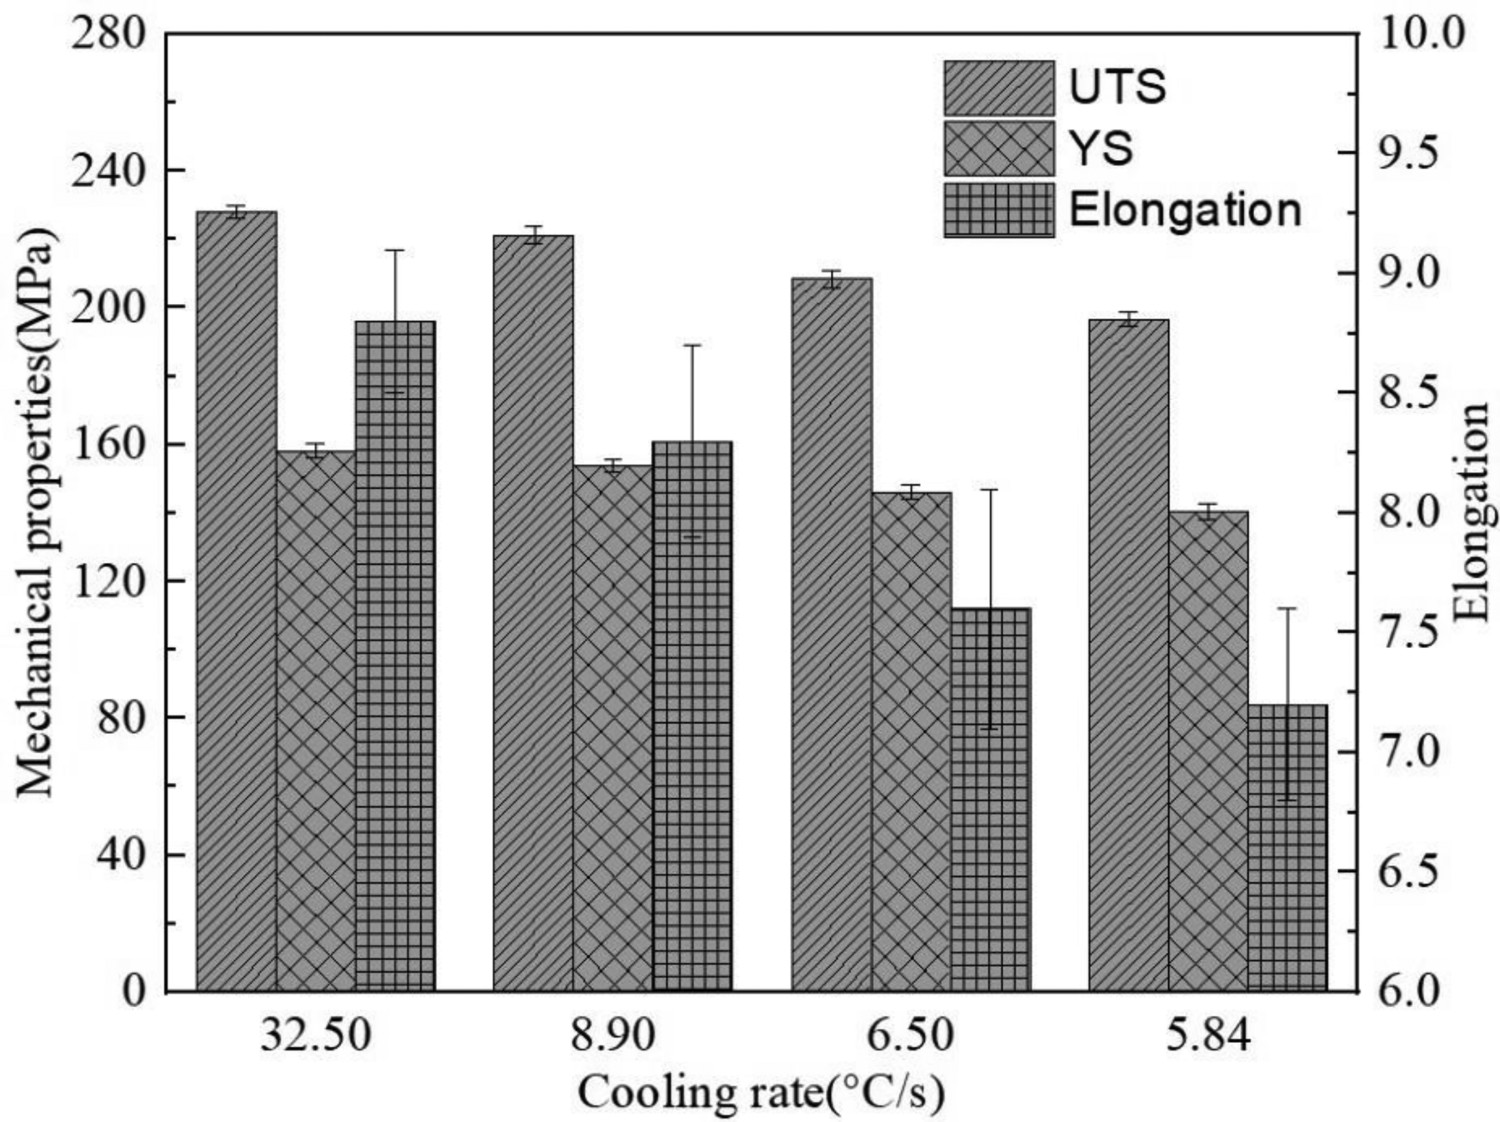
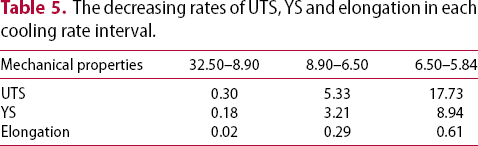
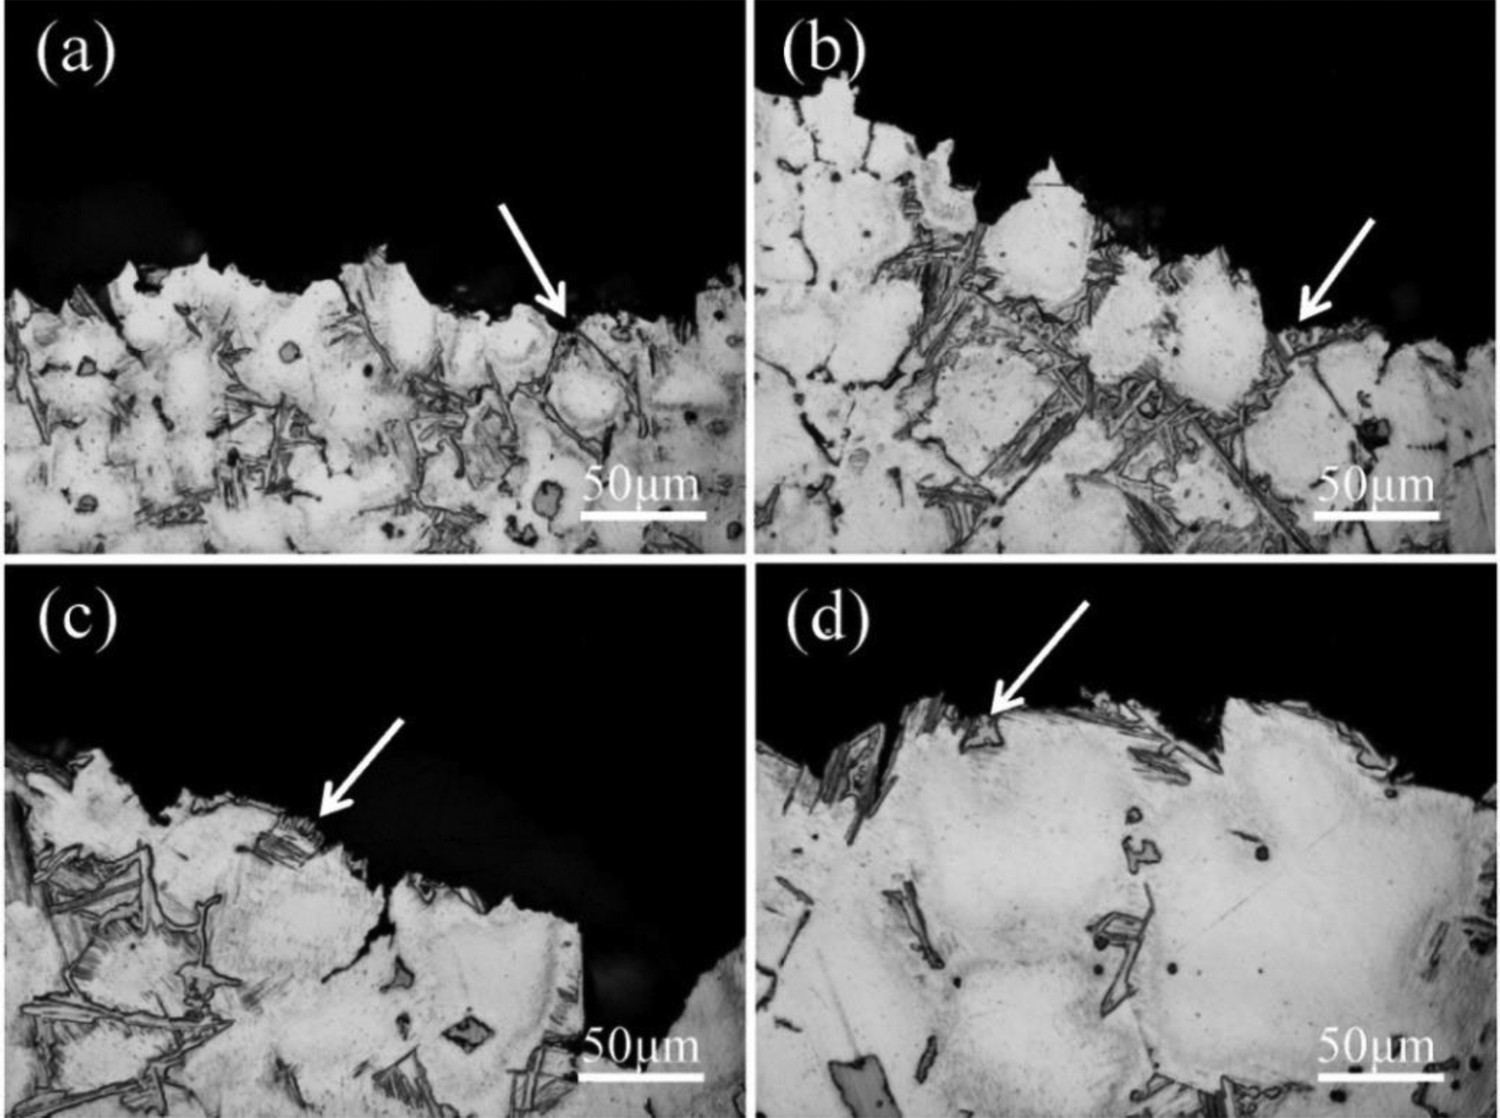
Effect of cooling rate on fracture morphologies and metallographic microstructures near the fracture is presented in Figures 10 and 11, respectively. It can be seen that cracks indicated by arrows can be seen obviously on fracture in Figure 10. Fracture mainly occurs on and near the second phases (shown by the arrows in Figure 11), which leads to the mixed fracture of intergranular fracture and transgranular fracture. When cooling rate is 32.50°C/s, there are small tearing edges on fracture surface, and fine granular Al2RE can be seen (Figure 10(a)). Fracture mainly along grain boundaries, especially triangular grain boundaries (Figure 11(a)). When cooling rate decreases to 8.90°C/s, large cleavage planes appear on fracture surface (Figure 10(b)). The lower cooling rate is, the larger cleavage planes are (Figure 10). When cooling rate decreases to 5.84°C/s, the size of cleavage planes is the largest, and cleavage planes occupy almost half of fracture surface (Figure 10(d)).
Effect of cooling rate on fracture morphologies of GY9411 alloy (a) 32.50°C/s; (b) 8.90°C/s; (c) 6.50°C/s; (d) 5.84°C/s. Effect of cooling rate on metallographic microstructures near the fracture of GY9411 alloy (a) 32.50°C/s; (b) 8.90°C/s; (c) 6.50°C/s; (d) 5.84°C/s.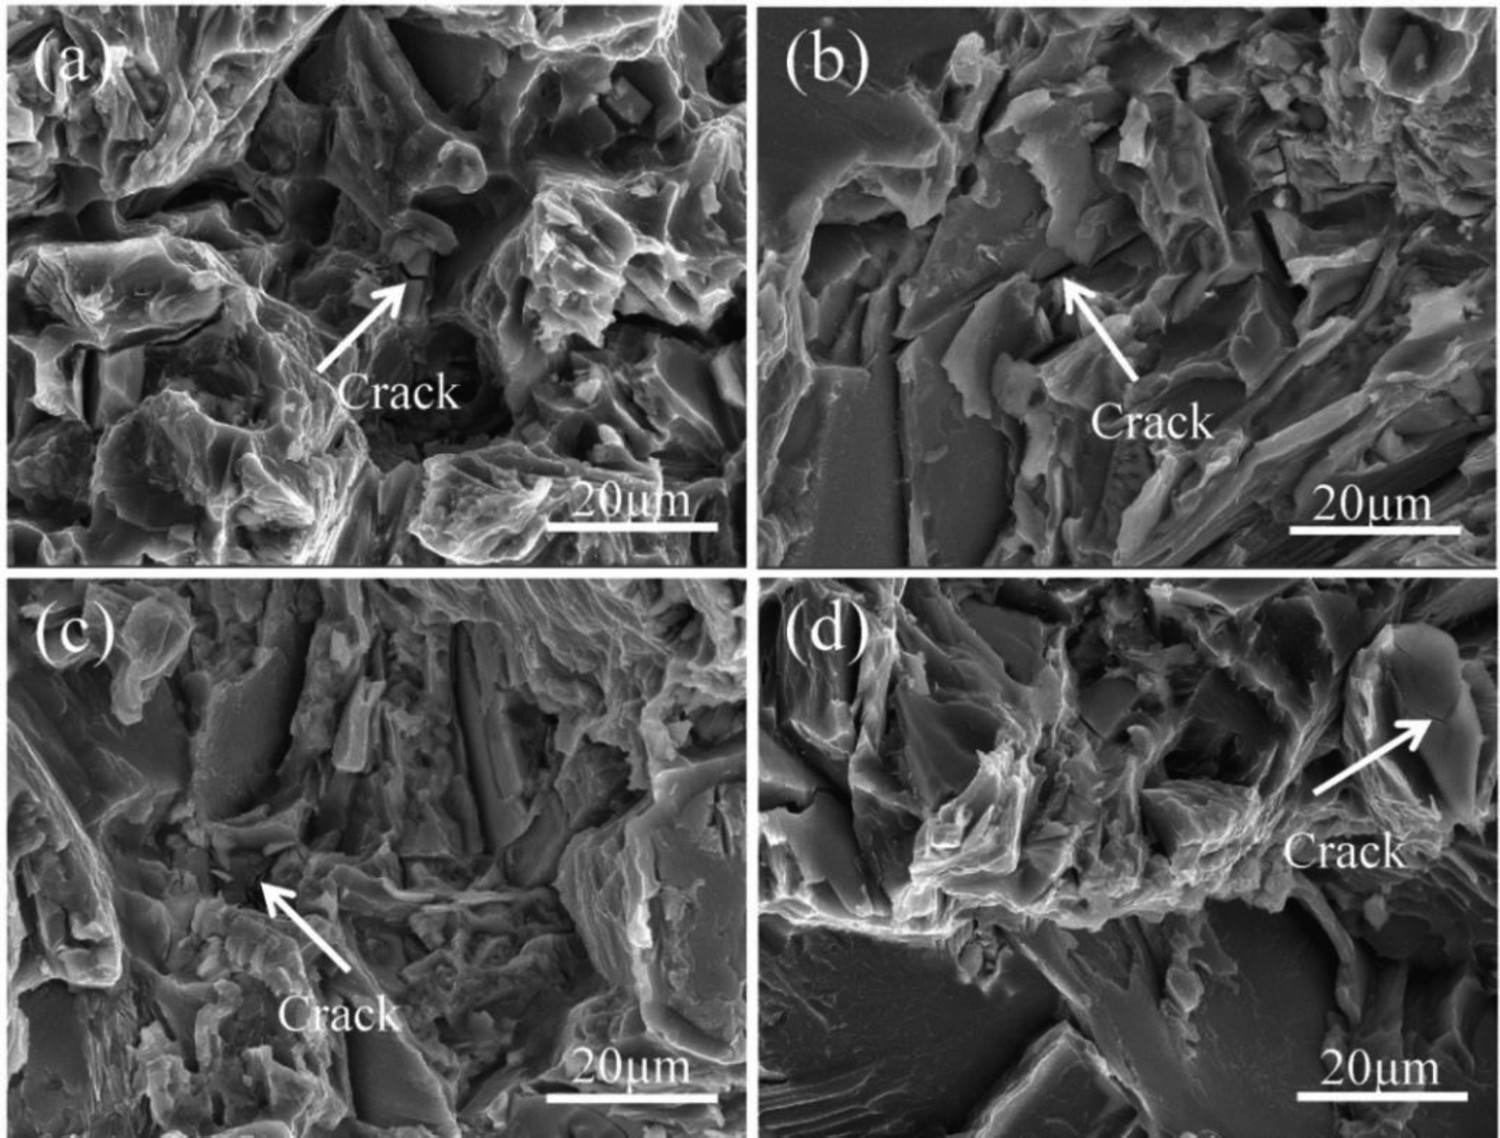
Discussion
Gibbs free energy difference between Al and RE is the smallest in Mg-RE-Al alloys [33], so Al and RE react preferentially, which leads to the formation of granular Al2RE during solidification process of GW9411 alloy [16]. The lower cooling rate, the smaller the nucleation driving force of granular Al2RE [26]. So nucleation of granular Al2RE can occur only at lower temperatures. Therefore, as cooling rate decreases, precipitation temperature of granular Al2RE decreases (Table 2). Granular Al2RE involves two processes: nucleation and growth. When granular Al2RE grows to a certain size, α-Mg can nucleate on it and grow up [20], resulting in granular Al2RE wrapped inside α-Mg (Figure 6). The slower cooling rate, the lower nucleation rate. Therefore, as cooling rate decreases, the amount of granular Al2RE decreases (Figure 6). Nucleation and growth inhibit each other. The lower the nucleation rate, the higher the growth rate. So, as cooling rate decreases, the size of granular Al2RE increases (Figure 6). The larger the size of granular Al2RE phase is, the easier α-Mg is to nucleate, which allows α-Mg to nucleate at higher temperature. Therefore, with the decrease of cooling rate, precipitation temperature of α-Mg increases (Table 2). In addition, the slower cooling rate, the longer growth time of granular Al2RE, which also causes its size to increase. Similarly, the size of α-Mg grains increases significantly (Figure 4). Granular Al2RE is also nucleation site of acicular Al2RE [34]. Acicular Al2RE nucleates and grows around granular Al2RE, which presents a petal-like appearance (Figure 6(a)). As cooling rate decreases, the amount of granular Al2RE decreases, so the growth of acicular Al2RE is more dominant than nucleation, leading to obvious increase in size. As cooling rate decreases, growth time of granular Al2RE is prolonged, so its content increases gradually (Table 4). When Al content is fixed, the more the content of granular Al2RE, the less the content of Al used to form acicular Al2RE. Therefore, as cooling rate decreases, the content of acicular Al2RE decreases gradually (Table 4). The solute partition coefficients of RE elements and other solute elements are all less than 1, so they are easy to be enriched at solid–liquid interface during solidification [35]. With the decrease of cooling rate, the diffusion distance of solute elements becomes longer [36], resulting in the weakening of the enrichment degree of solute elements. The weaker the enrichment is, the lower the content of solute is. Solute elements are necessary for the formation of LPSO and Mg3 (Zn, RE), so their contents both decrease with the decrease of cooling rate.
As cooling rate decreases, grain size of GW9411 alloy increases obviously (Figure 4), therefore, according to Hall–Petch formula [37], tensile strength will decrease. With the increase of grain size, the ability of coordinated deformation is weakened, so elongation will decrease with the decrease of cooling rate. On the other hand, as cooling rate decreases, total content of all phases decreases significantly (Table 4) and the size increases. In Mg-RE alloys, size of the second phases is micron, so dislocations can only be bypassed, which is in line with the Orowan mechanism [38]. The lower the quantity of the second phase is, the easier the dislocation is to bypass. When external force exceeds critical shear stress, cracks will initiate and propagate around the second phases (Figures 10 and 11). The larger the size of the second phases is, the easier the crack initiation and propagation are. As cooling rate decreases, size of all phases increases, so mechanical properties will decrease. Considering the above factors, mechanical properties decrease synchronously when cooling rate decreases. LPSO is a well-known strengthening phase in Mg-RE alloys, which can not only improve strength, but also improve toughness [11]. Mg3 (Zn, RE) is brittle and more prone to cracking under stress than LPSO [39], so tensile strength and toughness are more sensitive to variation of Mg3(Zn, RE) content, especially toughness. The lower eutectic phase content, the better toughness. As cooling rate decreases, the content of Mg3 (Zn, RE) decreases significantly (Table 4). Therefore, the decrease of Mg3 (Zn, RE) content has a tendency to increase toughness, which slows down the decreasing rate of elongation (Table 5). In order to quantitatively characterise the relationship between cooling rate and mechanical properties, mathematical regression method is used to fit UTS, YS and elongation, respectively, and the results are presented in Figure 12. At lower cooling rate, as cooling rate decreases, UTS, YS and elongation decrease sharply, while at higher cooling rate, decreasing rates all slow down and tend to 0. This indicates that at lower cooling rate, it is very important to regulate cooling rate.
Quantitative relationship between mechanical properties and cooling rate.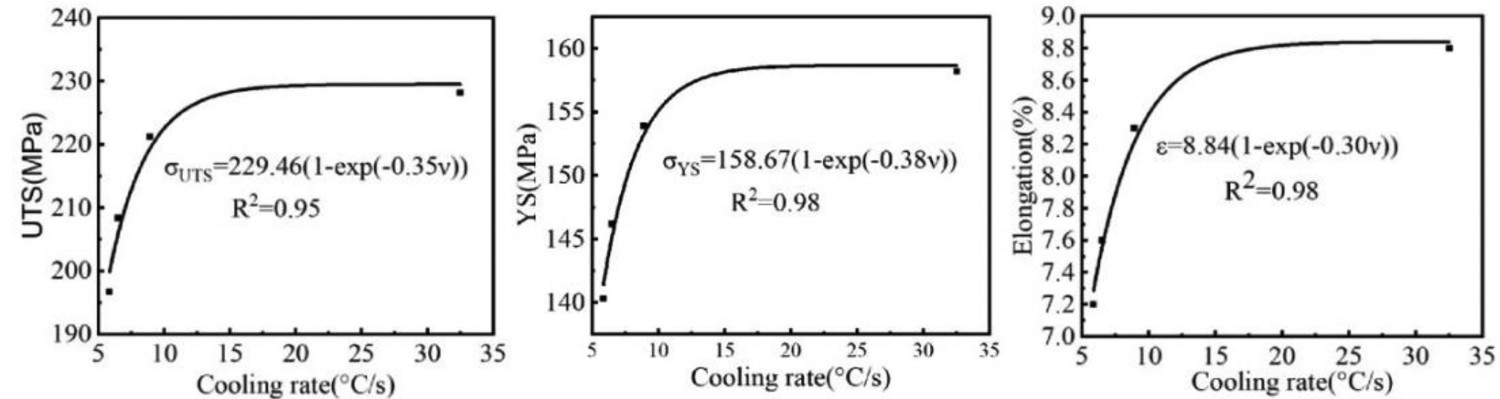
Conclusions
With the decrease of cooling rate, nucleation temperature of α-Mg increases, while eutectic temperature changes little. The variation trend of cooling rate is opposite to that of grain size. As cooling rate increases, the decreasing rate of grain size slows down. When cooling rate is 32.5°C/s, grain size reaches the minimum value (30.57 µm). There are four morphological second phases including lamellar LPSO, block-like Mg3 (Zn, RE), granular Al2RE and acicular Al2RE. As cooling rate decreases, the content of granular Al2RE increases, while the contents of the others decrease. As cooling rate decreases, UTS, YS and elongation all decrease, but decreasing rate of elongation is slower than that of UTS and YS. When cooling rate is 32.5°C/s, the mechanical properties are the best, and UTS, YS and elongation are 228.2 MPa, 158.2 MPa and 8.8%, respectively.
Footnotes
Disclosure statement
No potential conflict of interest was reported by the author(s).