
Abstract
Phase transformation, microstructure evolution, and mechanical properties of Ti–3Al–5Mo–4Cr–2Zr–1Fe alloy were investigated during a continuous heating process. Three microstructures, specifically lath, duplex, and lamellar structures, were examined. The activation energies for phase transition in these structures were measured as 277, 220, and 193 kJ mol−1, respectively. The phase transition follows: For the lath structure, β transforms into αacicular (550–660°C), αacicular converts to β (660–785°C), αlath does to β (660–850°C); For the duplex structure, β transforms into αacicular (545–660°C), αacicular converts to β (660–770°C), αlath does to β (660–850°C); For the lamellar structure, β transforms into αsecondary (560–615°C), αsecondary converts to β (615–705°C), αlamellar dose to β (615–850°C). The lath and duplex structures exhibited favorable comprehensive properties compared to lamellar microstructure.
Introduction
Titanium alloys garnered significant importance across industries such as aerospace, marine engineering, and biomedicine due to their exceptional properties, including high specific strength, excellent temperature resistance, and superior corrosion resistance [1–7]. The aerospace sector, in particular, has witnessed an increasing demand for advanced structural materials that offer lightweight construction, high strength, and exceptional toughness. Consequently, lightweight and high-strength Ti alloys are emerged as promising candidates for aerospace applications. Notably, near-β Ti alloys have attracted considerable attention in fields like aviation, aerospace, shipbuilding, and biomedicine due to their remarkable attributes, including high specific strength, excellent fracture toughness, and superior corrosion, and oxidation resistance [8–13]. One notable near-β Ti alloy is Ti–5Al−5Mo−5V−3Cr−1Zr (Ti-55531). This alloy exhibits high strength, good toughness, and notable hardenability, rendering it suitable for various aircraft components [14,15].
Ti–3Al–5Mo–4Cr–2Zr–1Fe (Ti-35421, wt-%) alloy is developed as a derivative of Ti–3Al–5Mo–5V–4Cr–2Zr (TB19) alloy, wherein Fe is introduced as a substitute for the expensive Vanadium. This substitution effectively reduces the manufacturing cost without compromising the alloy's high strength, ductility, and fracture toughness. Ti-35421 alloy exhibits an impressive yield strength of 1200 MPa and a fracture toughness of 75.8 MPa·m1/2 [16–18]. Furthermore, the inclusion of Fe in the alloy contributes to a reduction in flow stress, resulting in energy and cost savings [19]. In the pursuit of cost-effective Ti alloys, the United States has successfully developed two Fe-containing high-strength Ti alloys: Ti–1.5Al–6.8Mo–4.5Fe (Timetal LCB) and Ti–6Al–1.7Fe–0.1Si (Timetal 62s) [20,21]. Similarly, Japan has introduced Super-TIX series alloys, comprising two alloy systems: Ti–Al–Fe series and Ti–Fe–O–N series [22]. Ti-35421 alloy follows a similar pattern to other near-β Ti alloys, where the mechanical properties are influenced by factors such as the number, size, and morphology of the α phase. This characteristic allows for precise performance tuning through heat treatment, enabling the achievement of high strength, good ductility, and fracture toughness, tailored to meet the specific engineering requirements of diverse application scenarios [23–27].
The properties of Ti alloy are strongly influenced by their microstructure characteristics, including size, morphology, and chemical composition distribution of α-phase. Therefore, studying the different microstructures of Ti alloy is of great significance. Liu et al. [28] investigated the effects of primary α (αp), secondary α (αs), grain boundary α (αGB), and β grain size on the mechanical properties of near-β Ti alloys using two heat treatment processes. They found that the microstructure obtained after β solution treatment from different processes has a complex impact on the mechanical properties. This complexity arises due to the competition between various microstructural features and their cumulative effect on fracture toughness and tensile properties. Kadam et al. [29] employed Taguchi method to quantify the relative effects of β grain size and solid solution aging process parameters on the mechanical properties of the alloy. Fan et al. [30] conducted fracture toughness tests on Ti-7333 alloy at room temperature to understand the fracture mechanism. The results revealed that Ti-7333 alloy exhibited a high fracture toughness value (> 140 MPa·m1/2) when subjected to the β solution treatment, followed by slow cooling and aging heat treatment process. Relevant literature indicates that a significant amount of fine αs precipitation and continuous αGB have a more pronounced influence compared to other microstructural features. This results in higher strength but extremely low plasticity (<2%) in samples treated with Solid solution Treatment and Aging (STA) process. Furthermore, a negative correlation has been observed between β grain size and fracture toughness [31,32]. Wu et al. [33] investigated the microstructure evolution, mechanical properties, and fracture mechanism of the composite Ti–5Al−5Mo−5V−3Cr−1Zr (Ti-55531) alloy following solution treatment (760–820°C) and aging (580–640°C). They observed that the volume fraction of the primary α (αp) phase decreased with increasing solid solution temperature, while the length of αs phase decreased and the width increased with higher aging temperatures. They also found that the solution temperature primarily influenced the grain size, morphology, and volume fraction of the αp phase, whereas the width, length, morphology, orientation, and nucleation site of the αs phase were controlled by the aging temperature and time. Additionally, the study revealed that the yield strength and tensile strength of the alloy descend with the increasing solid solution temperature but ascend with the higher aging temperature. Therefore, studying the phase transformation kinetics, microstructure evolution, and mechanical properties of Ti-35421 during heating processes holds significant importance.
This study aims to investigate the phase transformation kinetics, mechanical properties, and microstructure evolution of Ti-35421 alloy with lath structure, duplex structure, and lamellar structure. The analysis focuses on examining the variation in mechanical properties during the microstructure evolution process for different initial structures. Ti-35421 alloy is subjected to continuous heating using the thermal expansion method, enabling the calculation of phase transformation kinetics curves, phase transformation activation energy, and the Avrami index for the initial lath structure, duplex structure, and lamellar structure under various heating rates. The phase transition activation energy values for the different initial structures are compared to determine the difficulty of the phase transition. Additionally, the study investigates the changes in morphology, size, and content of the three initial structures of Ti-35421 alloy during the phase transformation process to analyse the evolution patterns of the structure. Furthermore, mechanical properties are tested at different evolution temperatures, and the analysis takes into account the microstructure, size, and content to understand the reasons for the changes in mechanical properties. The overall goal is exploring universal laws that can provide valuable reference for subsequent theoretical research and practical applications.
Experimental procedures
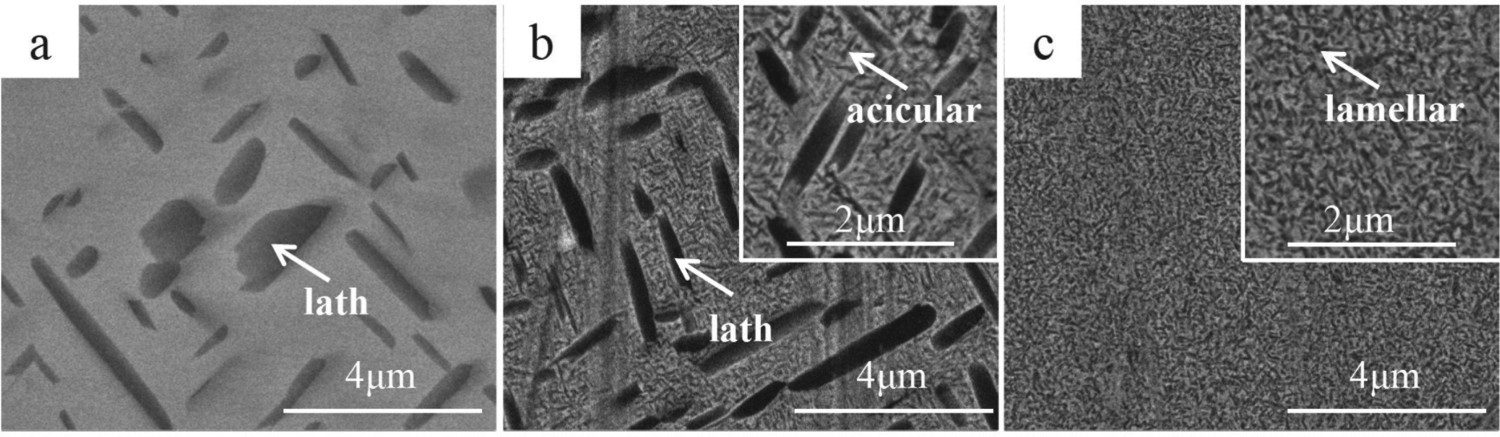
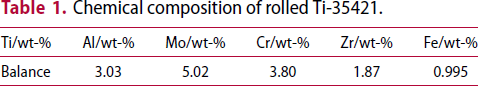
Ti-35421 alloy ingot was fabricated using a three-time vacuum arc remelting process, incorporating high-purity sponge Ti (Ti wt-% > 99.8%), high-purity Al (99.9 wt-%), high-purity Cr (99.9 wt-%), high-purity Zr (99.9 wt-%), high-purity Fe, and Al–80Mo master alloys. The specific composition of the alloy is shown in Table 1. In order to achieve the desired shape, a slab with a thickness of 74 mm was formed from the initial as-cast ingot through multi-pass forging within the β phase region at 1050°C. Subsequently, the forged slab underwent hot rolling within the β phase region until it reached a thickness of 22 mm at 900°C (i.e. ensuring that the final rolling temperature exceeded 780°C). Finally, the slab was cut into dimensions of 22 (H) × 83 (B) × 510 (L) mm. The microstructure of Ti-35421 alloy after the rolling process is shown in Figure 1. Heating the as-rolled alloy to 770°C at a rate of 7 K min−1 and holding for 1 h resulted in the formation of the lath structure. The duplex structure was obtained by holding the as-rolled alloy at 770°C for 1 h, followed by an aging treatment at 530°C for 8 h. Similarly, the lamellar structure was achieved by heating the as-rolled alloy above its transformation point (830°C) for 1 h and subsequently maintaining it at a temperature of 530°C for 8 h. The cooling method employed after the heat treatment was air cooling. The microstructure of lath, duplex and lamellar is illustrated in Figure 2.
As-rolled microstructure of Ti-35421 alloy. Initial microstructures of Ti-35421 alloy: (a) lath structure; (b) duplex structure; (c) lamellar structure. Chemical composition of rolled Ti-35421.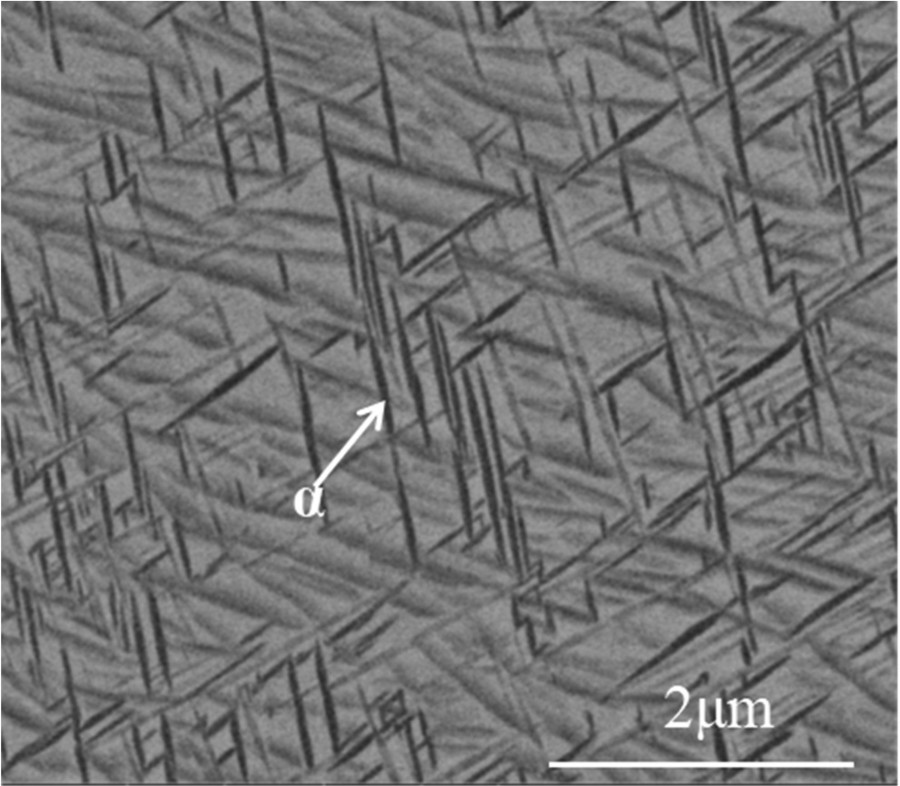
The thermal expansion experiments were carried out using a DIL402 thermal expansion apparatus manufactured by NETZSCH, Germany. Standard cylindrical specimen with dimensions of φ6 × 25 mm were used for the experiments. The specimens of lath, duplex, and lamellar microstructures were subjected to heating up to 1100°C, with heating rates of 4, 6, 8, and 10 K min−1. Throughout the experiment, argon was used as the protective atmosphere inside the furnace, and the circulation of argon was maintained continuously. The dimensional changes of the specimens, recorded as a function of temperature or time, enabled the generation of linear thermal expansion curves for the three different microstructures under various heating rates.
After analysing the thermal expansion curves, further investigation was conducted using Scanning Electron Microscope (SEM) testing at a voltage of 20.00 KV. The samples were prepared by cutting them into small pieces measuring 10 × 10 × 8 mm using a wire-cutting machine. These samples were then subjected to heat treatment at the target temperature, which was selected based on the phase transformation kinetic curve, followed by immediate quenching in water to preserve the instantaneous alloy structure. Following the heat treatment, the samples underwent a sequential grinding process using sandpaper ranging from 80 to 3000 mesh. Subsequently, a metallographic polishing machine was used to achieve a smooth surface. The polished samples were etched using an etching solution (5 mL HF + 10mLHNO3 + 35 mL H2O). Microstructure images were captured, and the size of different phases was measured using Nano Measurer software. The volume fraction of each phase in SEM microstructure was determined using Image-Pro Plus (IPP) software. Cylindrical tensile specimens, cut parallel to Rolling Direction (RD) in accordance with ASTM E8/E8M-09 standard, were prepared using wire EDM. Mechanical properties were evaluated using an ETM205D testing machine [34].
Results and discussion
Phase transformation kinetic analysis
Figure 2 illustrates the three different initial microstructure morphologies of Ti-35421 alloy obtained through annealing, which is a process employed to eliminate internal stress generated during the casting and rolling process of the alloy, resulting in a more uniform distribution of the microstructure. Within the microstructure, the lath α phase comprises approximately 16% of the content, with an average length of around 1.16 µm. The duplex structure, depicted in Figure 2(b), is formed through STA within the two-phase region. Based on SEM images, the concentration of the α-phase in the duplex structure is around 36%. This structure consists of αlath-phase and αacicular-phase. The length of the αlath-phase measures approximately 0.91 µm, while the length of the αacicular-phase is around 0.29 µm. Notably, there is a discernible difference in thickness between these two phases. Figure 2(c) represents the lamellar microstructure obtained through annealing above the phase transition point. The lamellar α-phase accounts for approximately 58% of the microstructure, with an average length of 0.21 µm.
The phase transformation behaviour of Ti alloys is characterised by its complexity and diversity, requiring precise control of the phase transformation during heat treatment to achieve desired mechanical properties, particularly in near-β Ti alloys. These alloys typically exhibit a low content of α-stabilising elements and a high content of β-stabilising elements, which imparts unique characteristics to their phase transformation process. Notable phase transformations [35,36] observed in near-β Ti alloys include the ω phase transformation, martensitic transformation, and β↔α transformation. This study specifically focuses on the β↔α phase transition, which represents an allotropic transition in Ti alloys. During this phase transition, changes occur in lattice type, as well as parameters such as thermal expansion coefficient and resistivity. Additionally, endothermic and exothermic phenomena are observed. To investigate this phase transition, the continuous heating thermal expansion method is employed in this research. This method takes advantage of the heat absorption, exotherm behaviour, and volume expansion that occur during the heating process to obtain the phase transition kinetic curve for heating.
In this study, thermal expansion experiments were performed on the lath, duplex, and lamellar structures using heating rates of 4, 6, 8, and 10 K min−1. The resulting thermal expansion curves were analysed. Figure 3 shows that these three structures exhibit a similar pattern. In the low-temperature region, there are no significant changes in size, indicating negligible shrinkage or expansion. However, a transformation occurs in the high-temperature region. Comparing the thermal expansion curves of the same microstructures, it is observed that increasing the heating rate leads to a gradual rise in the phase transition temperature, resulting in a rightward shift of the curves in the diagram. This phenomenon can be attributed to the fact that a lower heating rate provides sufficient time for nucleation and growth process, allowing the alloy to reach an equilibrium state in the low-temperature region.
Thermal expansion curves of various initial structures at different heating rates: (a) lath structure; (b) duplex structure; (c) lamellar structure.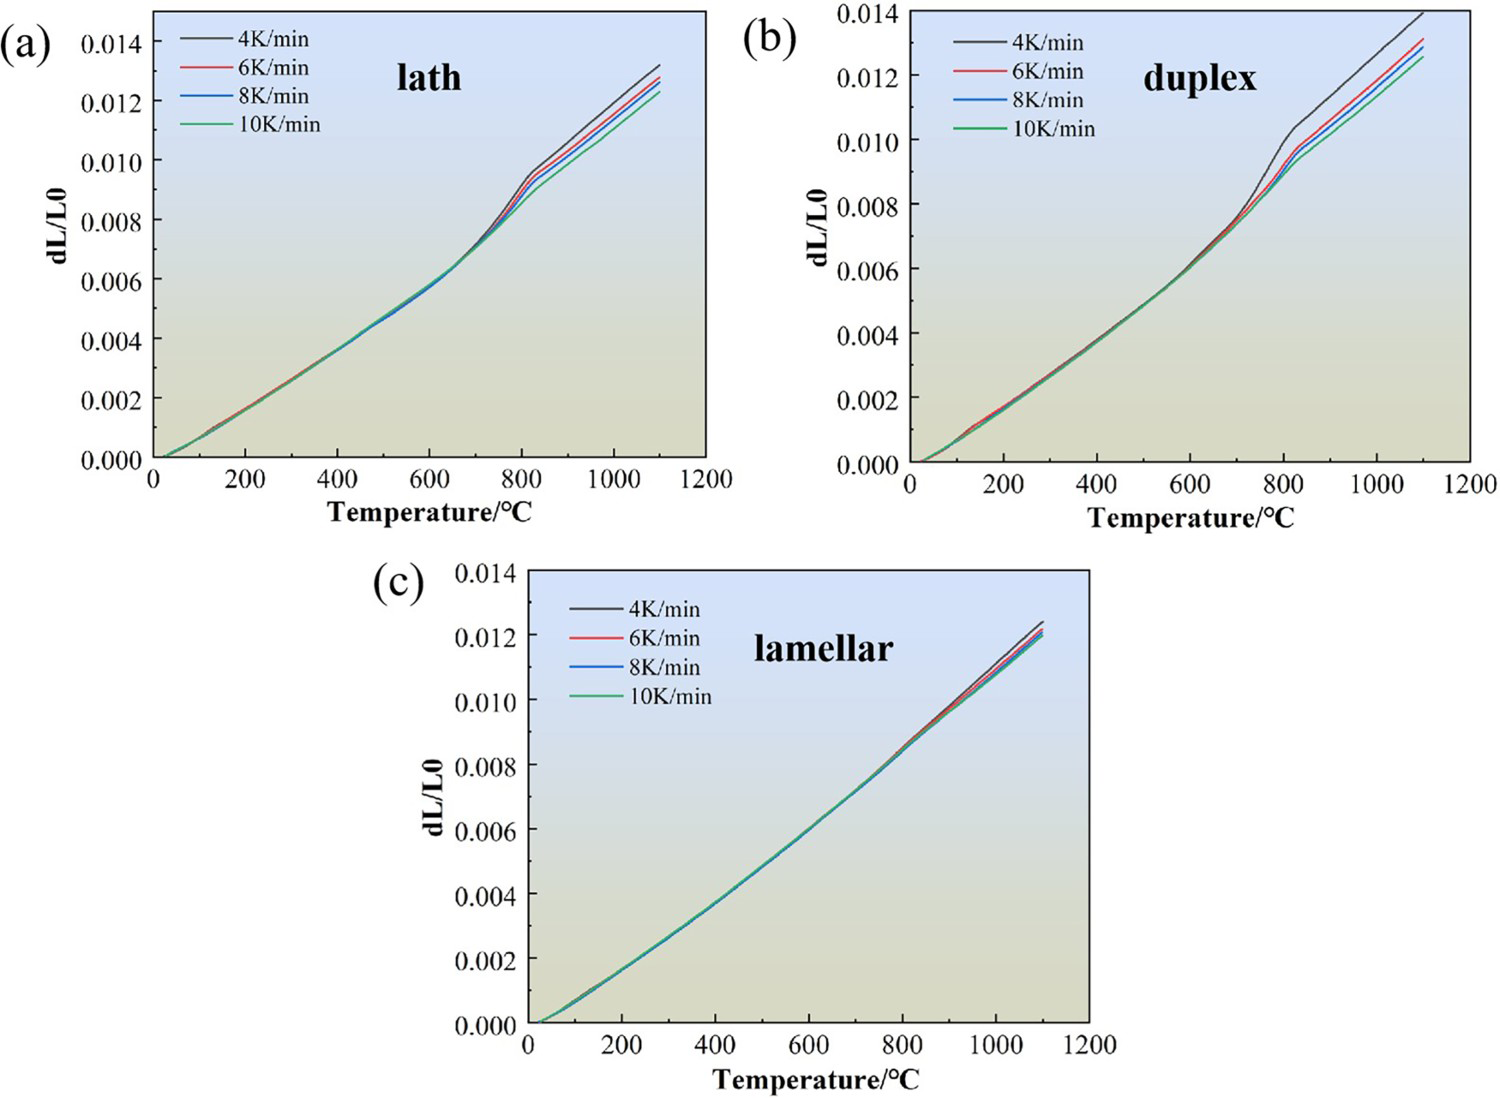
The α-solvation curves obtained for the three initial structures at different heating rates exhibit a characteristic “S” shape, with the variable ƒ denoting the degree of transition from α to β. The phase transformation process can be divided into three distinct stages, as illustrated in Figure 4. During the first stage, which corresponds to the nucleation incubation period, the curve exhibits a slow and gradual ascent. The second stage represents the growth period of solid-state phase transition, wherein the curve shows a continuous rise. In the third stage, the phase transformation proceeds at a slower rate, and the curve approaches a plateau, indicating the equilibrium period. The phase transition kinetic curve, derived from the thermal expansion curve, exhibits a similar trend. Specifically, as the heating rate rises, the curve shifts to the right.
Phase transition curves of various initial structures at different heating rates: (a) lath structure; (b) duplex structure; (c) lamellar structure.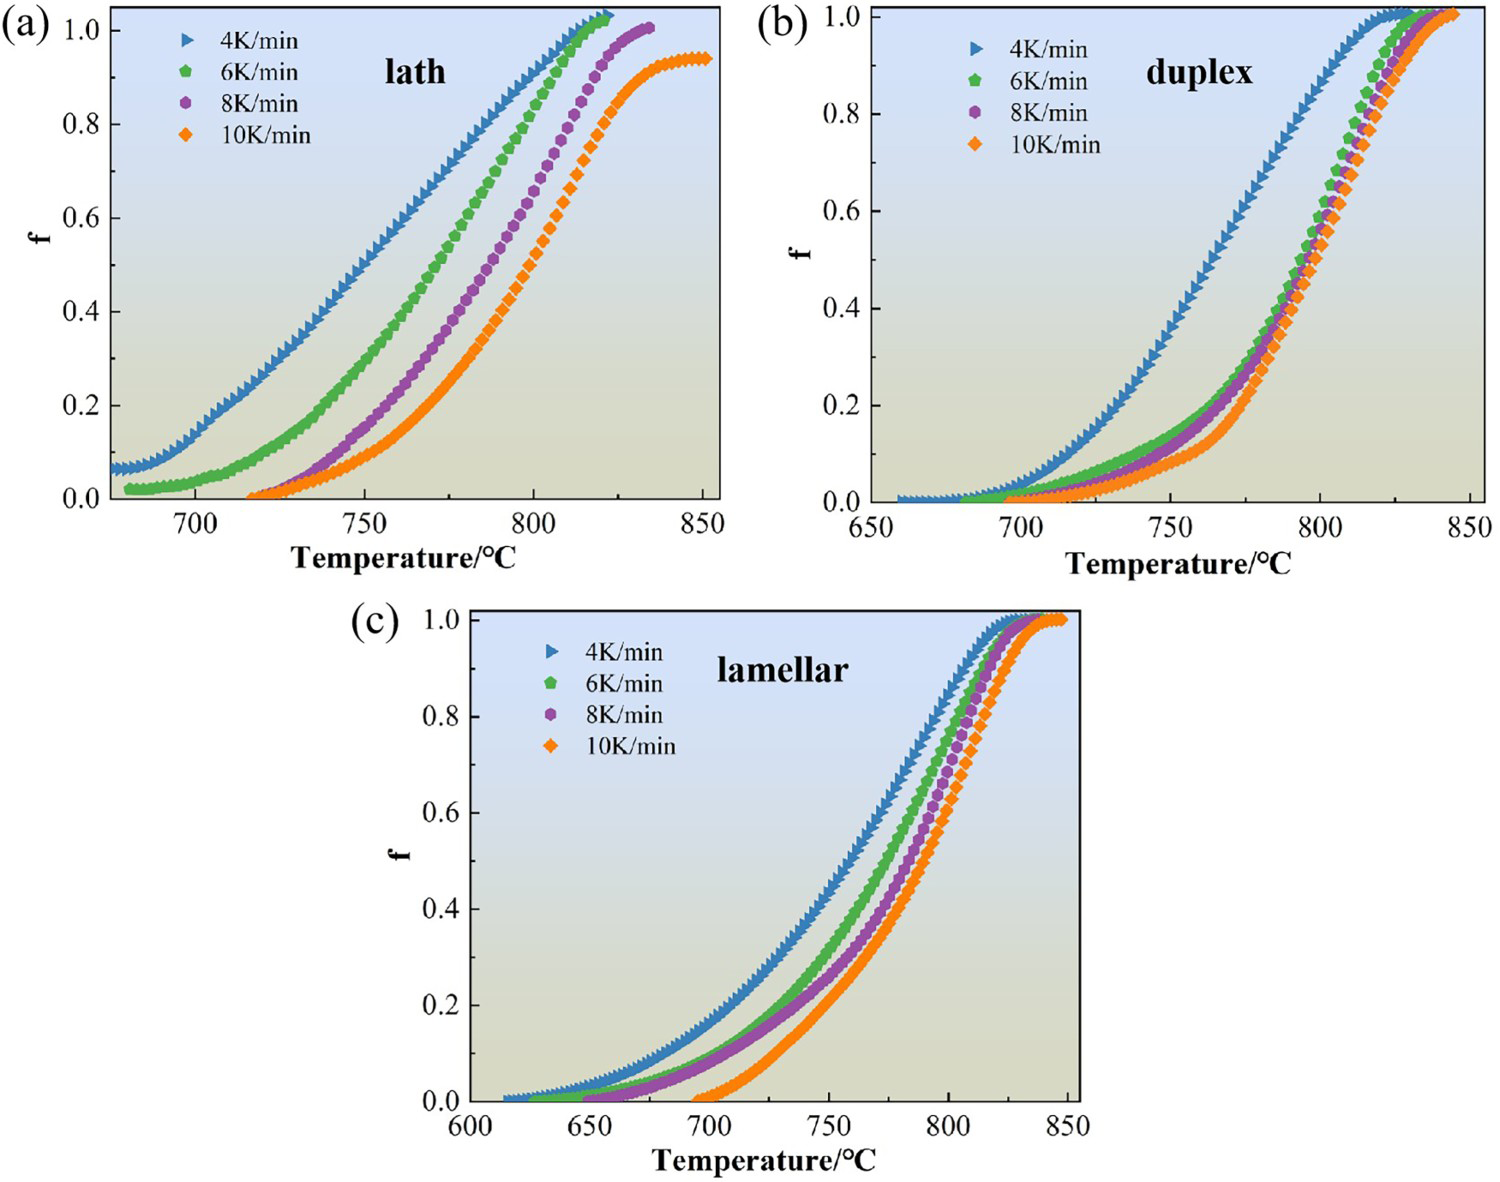
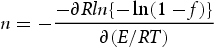
By analysing the phase transition kinetic curves obtained from the previous experiments and their corresponding data, the temperature points at which the alloy's phase transformation variable ranges from 0.1 to 0.9 were determined. Subsequently, the activation energy [37] required for each phase transition stage was obtained through linear regression and fitting. Figure 5 shows that the linear regression results of phase transformation for the transformation amount f initiates at 0.1, and the slope of the curve gradually increases. The symbol in the fit line represents the heating rate. The results indicate a progressive increase in the activation energy as shown in Figure 6. This phenomenon can primarily be attributed to the decreasing spacing between the β-phase structure as the volume fraction of the β-phase increases. Consequently, elastic strain interaction occurs between the β-phase structures, leading to a reduction in the growth rate of the β-phase and an increased difficulty in the phase transformation reaction [38]. Therefore, a higher energy input is required for the phase transformation to occur. Kissinger–Akahira–Sunose (KAS) calculation method [39,40] was employed to determine the average activation energy of the three-phase transitions. The calculated values were found to be 277 kJ mol−1 for the lath structure, 220 kJ mol−1 for the duplex structure, and 193 kJ mol−1 for the lamellar structure, respectively. The KAS calculation method can be expressed as follows:
The linear regression graph of phase transition of various initial structures: (a) lath structure; (b) duplex structure; (c) lamellar structure. Activation energy of various initial structures underdifferent phase variables: (a) lath structure; (b) duplex structure; (c) lamellar structure.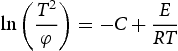
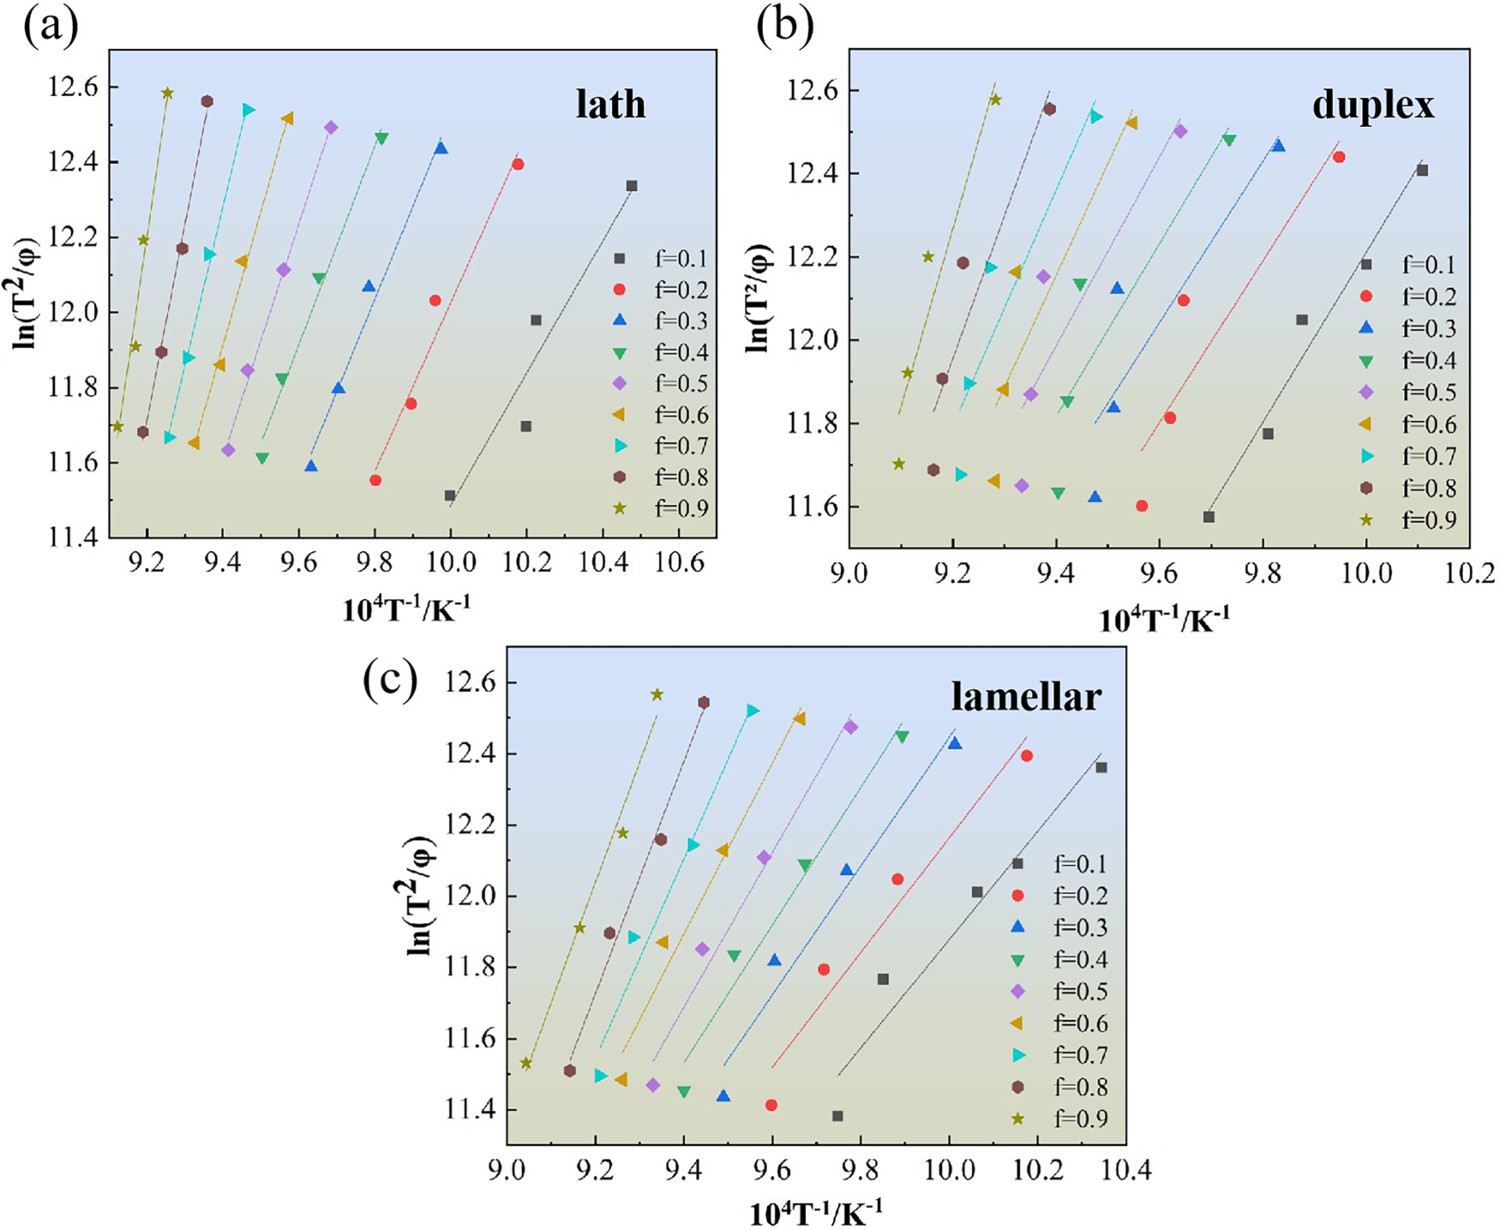
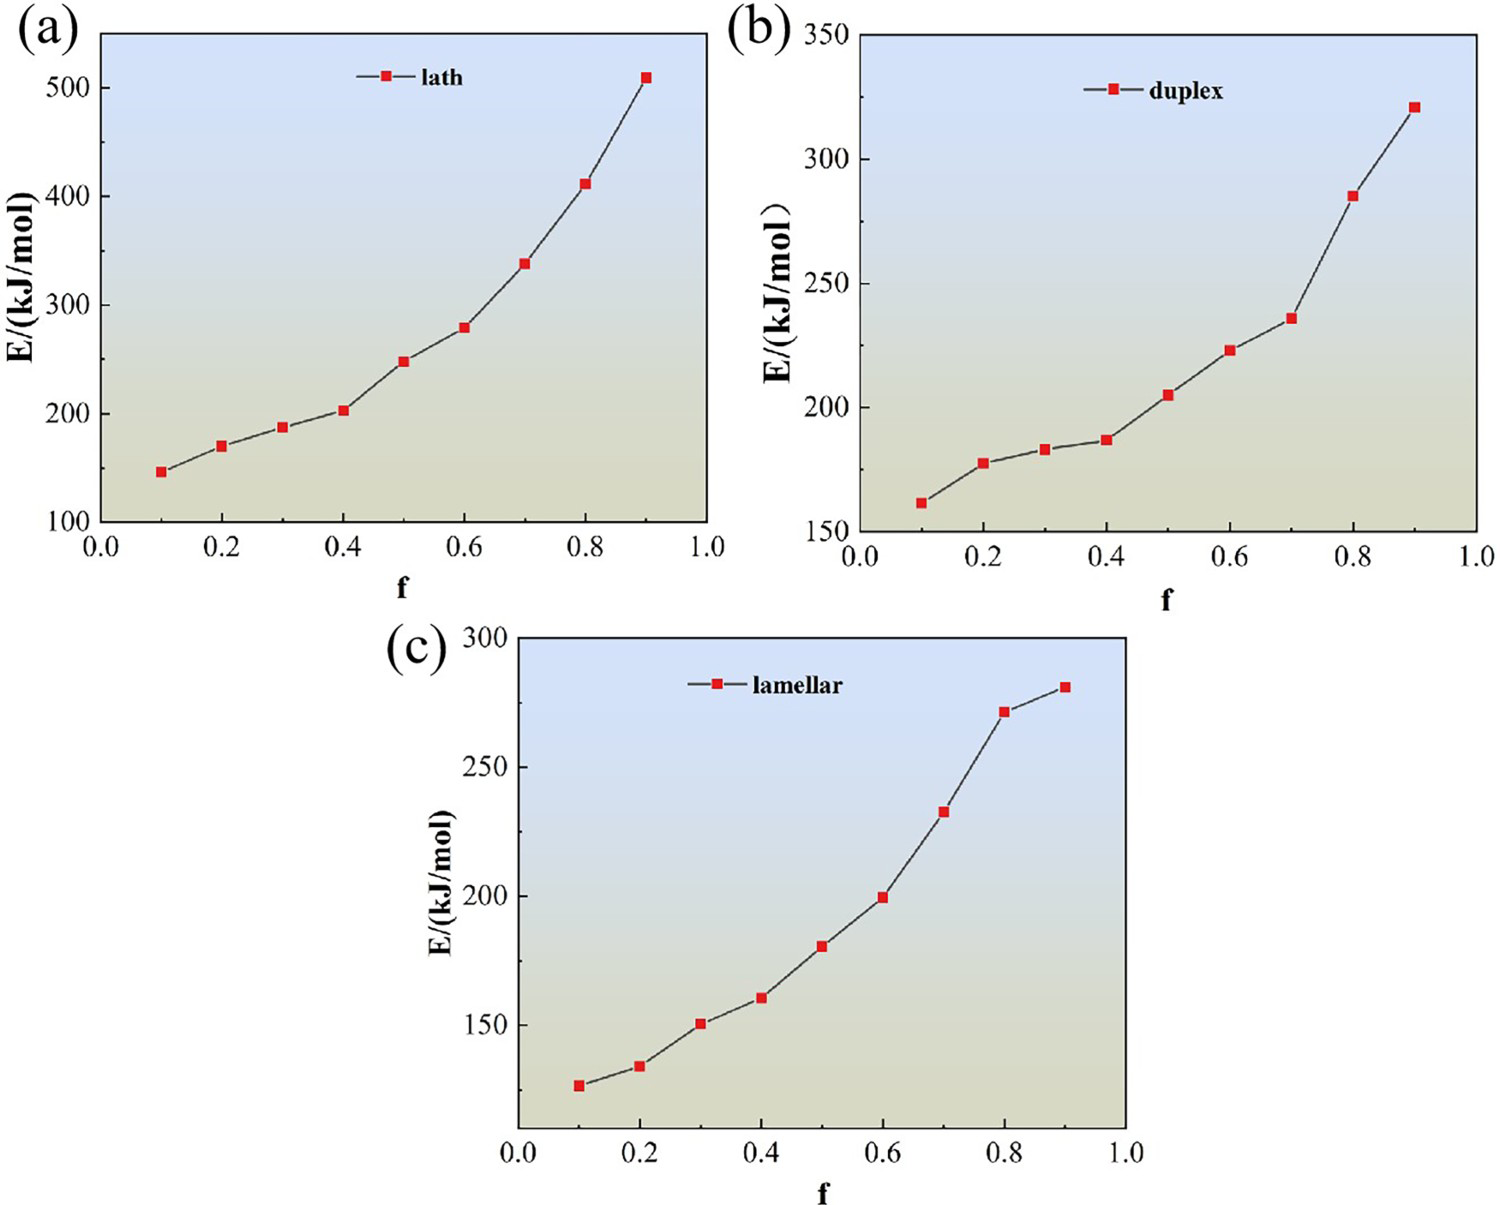
The activation energy for phase transition is a measure of the difficulty in achieving the transition. The results indicate that the lamellar microstructure has the smallest activation energy among the three microstructures, suggesting that the phase transition is more likely to occur in this structure. Conversely, the lath microstructure exhibits the largest activation energy, indicating that a higher temperature is required to provide sufficient energy for the phase transformation. These findings are consistent with the curve results obtained from the thermal expansion experiments. Comparing the activation energy can be a useful approach for assessing the difficulty of phase transformation, and it aligns with the influence of grain size on phase transformation.
The occurrence of phase transformation follows certain laws, which can be effectively analysed using the existing Kolmogorov-Johnson-Mehl-Avrami (KJMA) model [41,42]. KJMA model provides a framework for understanding the phase transformation behaviour in Ti alloys. The Avrami index n can be expressed as follows:
The average activation energy values obtained for the lath, duplex, and lamellar structures were utilised in KJMA model to establish the functional relationship between the Avrami index and the phase transition fraction for each initial structures at various heating rates. As depicted in Figure 7, the findings reveal that the Avrami constant n exhibits a “U” shape trend. This pattern suggests that the change in the Avrami index can be divided into three stages, which align with the α-phase re-solution process. During the initial stage of the reaction, when the transformation amount is minimal, n value decreases from 4 to 2 due to a reduction of the nucleation rate. This decline can be attributed to alterations in the β-phase composition of the matrix changes during the early phases of the transformation. Diffusion causes the β-stabilising elements to undergo depletion and enrichment in different regions. The phase transition mechanism at this stage involves crystal growth through crystal nucleation and diffusion. In the middle stage of the reaction, the nuclear embryo attains saturation, resulting in an almost negligible nucleation rate. Consequently, n value further decreases from 2 to 1. During this stage, the phase transition occurs through a combination of nucleation at phase interfaces and dislocation lines. The nuclear embryo becomes saturated, and the nucleation rate approaches 0. The phase transition mechanism during this stage involves the three-dimensional growth of the crystal. In the third stage of the reaction, the Avrami index exhibits an increase, which represents a physical anomaly observed in other studies concerning metals and amorphous materials [43–45].
Avrami index of various initial structures at different heating rates: (a) lath structure; (b) duplex structure; (c) lamellar structure.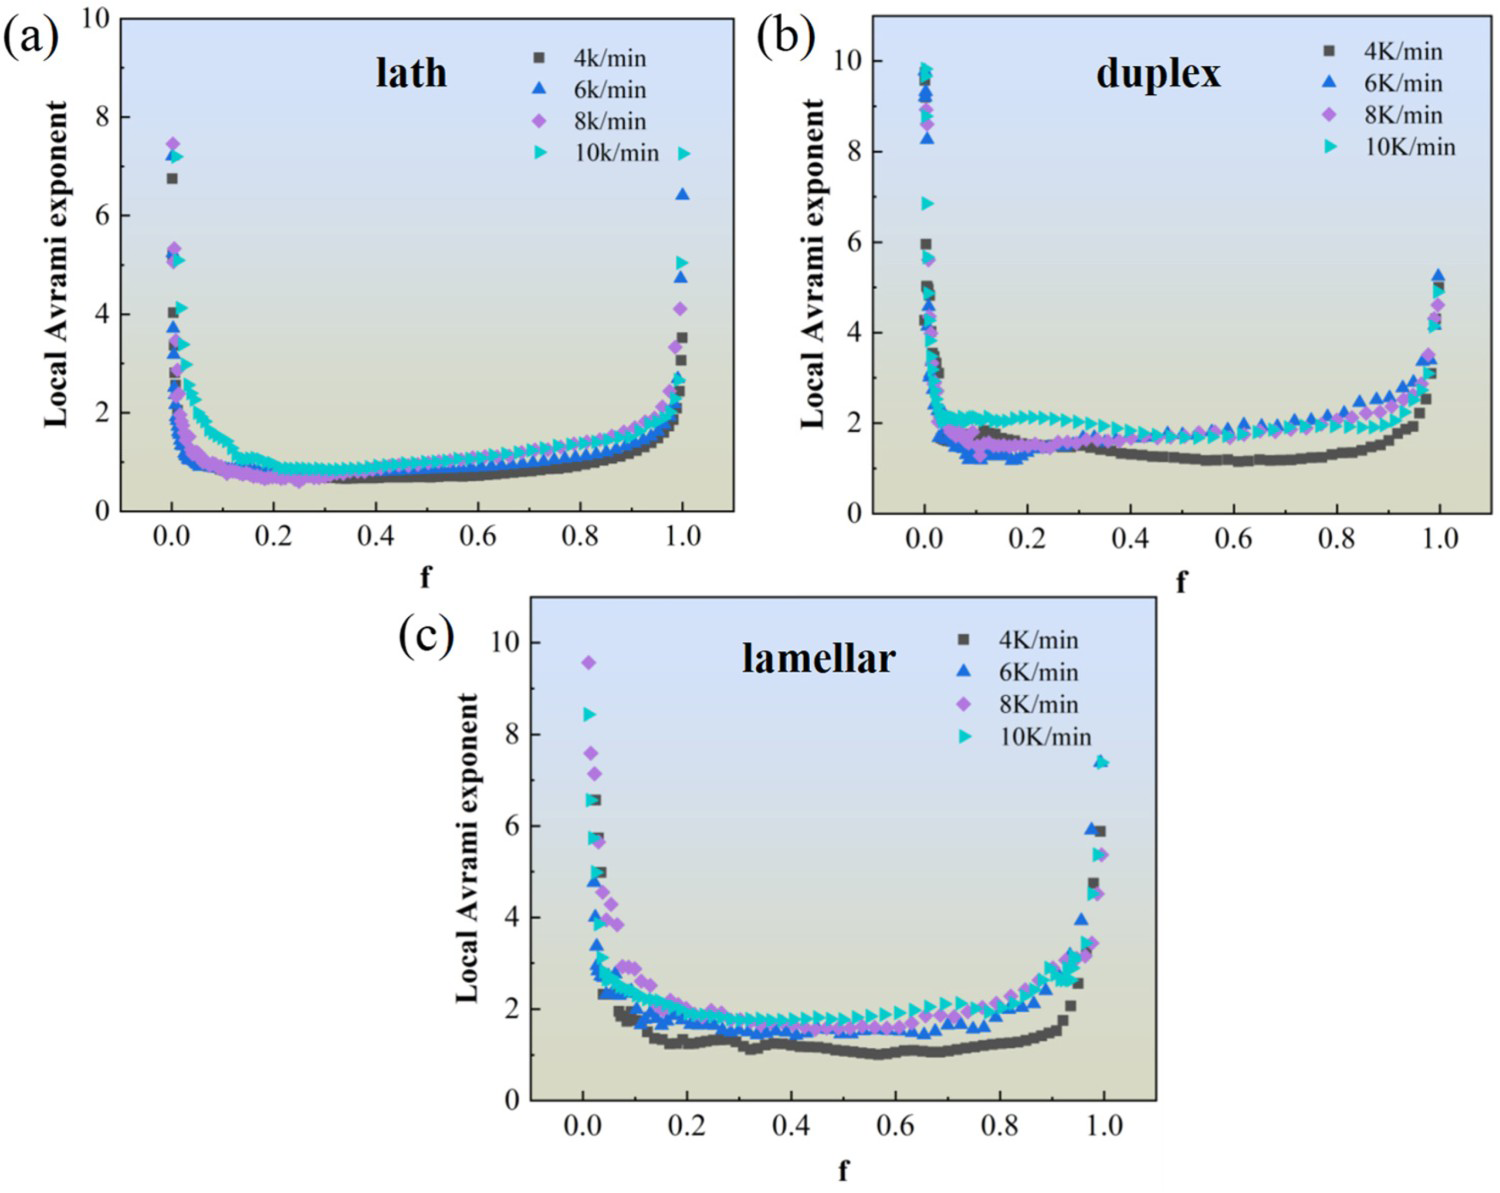
Microstructure evolution
The samples, initially possessing a lath structure, were subjected to a heat treatment process at different temperatures (i.e. 550, 600, 660, 705, 785, and 850°C) with a heating rate of 7 K min−1. Following the heating process, water cooling was employed. The resulting microstructure of the samples was meticulously examined using SEM, and the obtained micrographs are demonstrated in Figure 8. Subsequently, a detailed analysis was conducted to ascertain the evolution patterns pertaining to phase content and grain size.
SEM images of lath structure at different heating temperatures: (a) 550°C, (b) 600°C, (c) 660°C, (d) 705°C, (e) 785°C, (f) 850°C.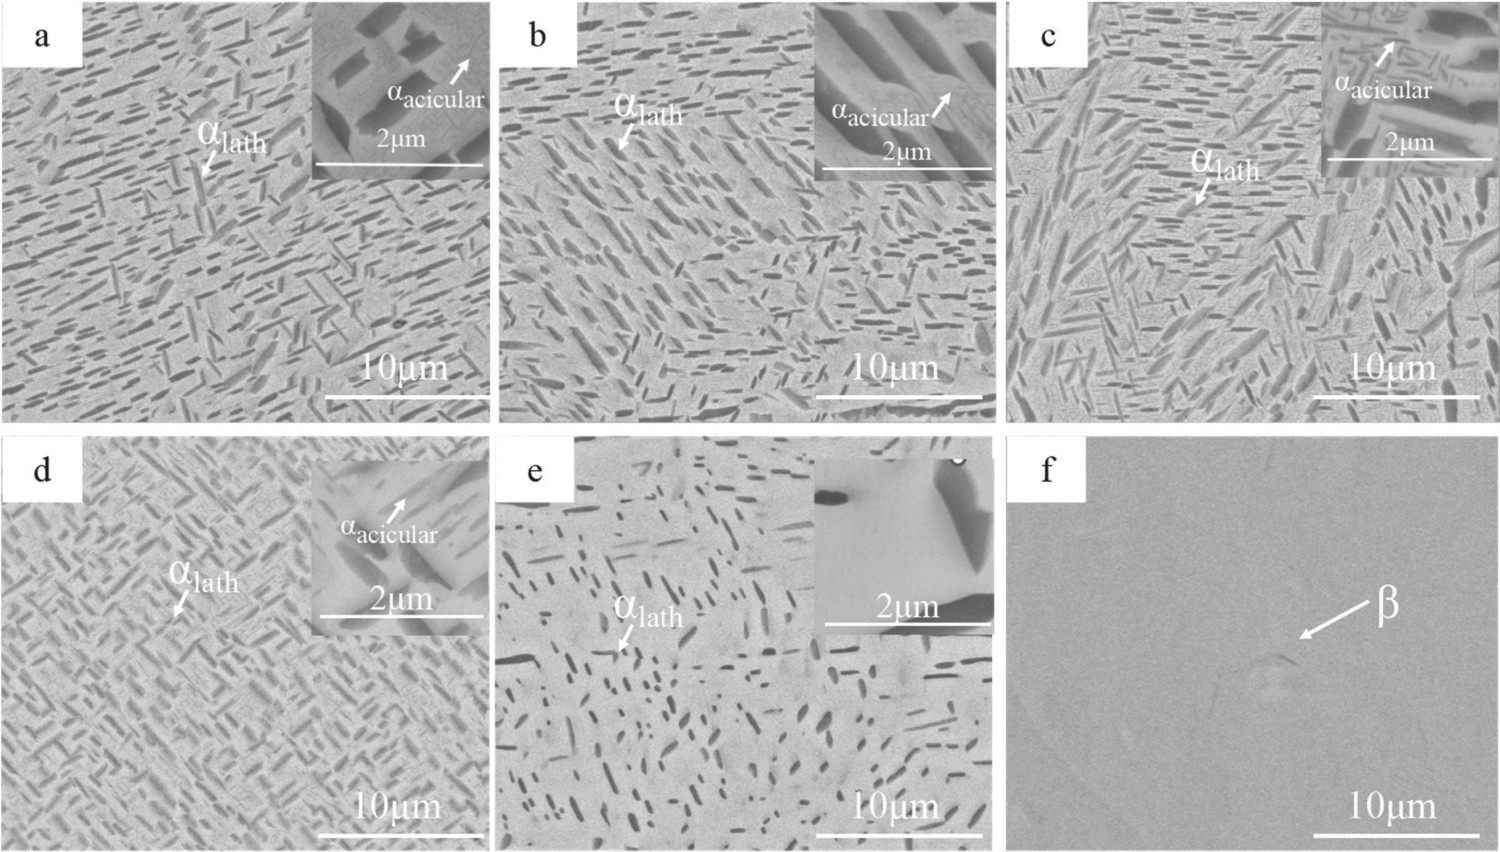
During the heating process of the lath structure, three distinct phase transitions occur. At lower temperatures, the β-phase transforms into the αacicular-phase. As the temperature increases, the αacicular-phase further transforms into the β-phase, while the αlath-phase also undergoes a transition into the β-phase. When the heating temperature remains below 660°C, the phase content of the incipient αlath-phase remains relatively unchanged, but αacicular-phase emerges as a result of the transformation from the β-phase. At 660°C, the αlath-phase begins to dissolve. With the gradual heating process continues, both the αlath and αacicular-phase, which have transformed from the β-phase, undergo growth and decomposition processes. Eventually, the α-phase completely dissolved at 850°C, resulting in a microstructure composed entirely of the β-phase. It is noteworthy that the α → β phase transformation in Ti-35421 during the heating process is a diffusive phase transition. During this phase transition, a higher number of Al elements diffused from the α-phase to the β phase compared to the number of V and Fe elements that diffuse from the β-phase to the α-phase. It should be pointed out that Al is a stabilising element for the α-phase, while V and Fe are stabilising elements for the β-phase. Similar observations have been reported in other references [46,47]. As a result of this diffusion behaviour, the α-phase content gradually decreases until the microstructure becomes fully composed of the β-phase.
Figure 9 presents the average length of α and phase content of the lath structure. The results demonstrate a gradual increase in both the content and length of α-phase within the temperature range of 550–660°C. During this range, the phase content reaches approximately 22%, while the average length measures around 1.20 µm. As the temperature continues to rise, a notable decrease in the content of α-phase is observed. For instance, the phase content reduces to 16% at 705°C, and further decreases to 10% at 785°C. Similarly, the average length of the α-phase also gradually descended. At a temperature of 850°C, the α-phase completely disappears from the microstructure.
The variations of α phase in lath microstructure with temperatures: (a) volume fraction and (b) average length.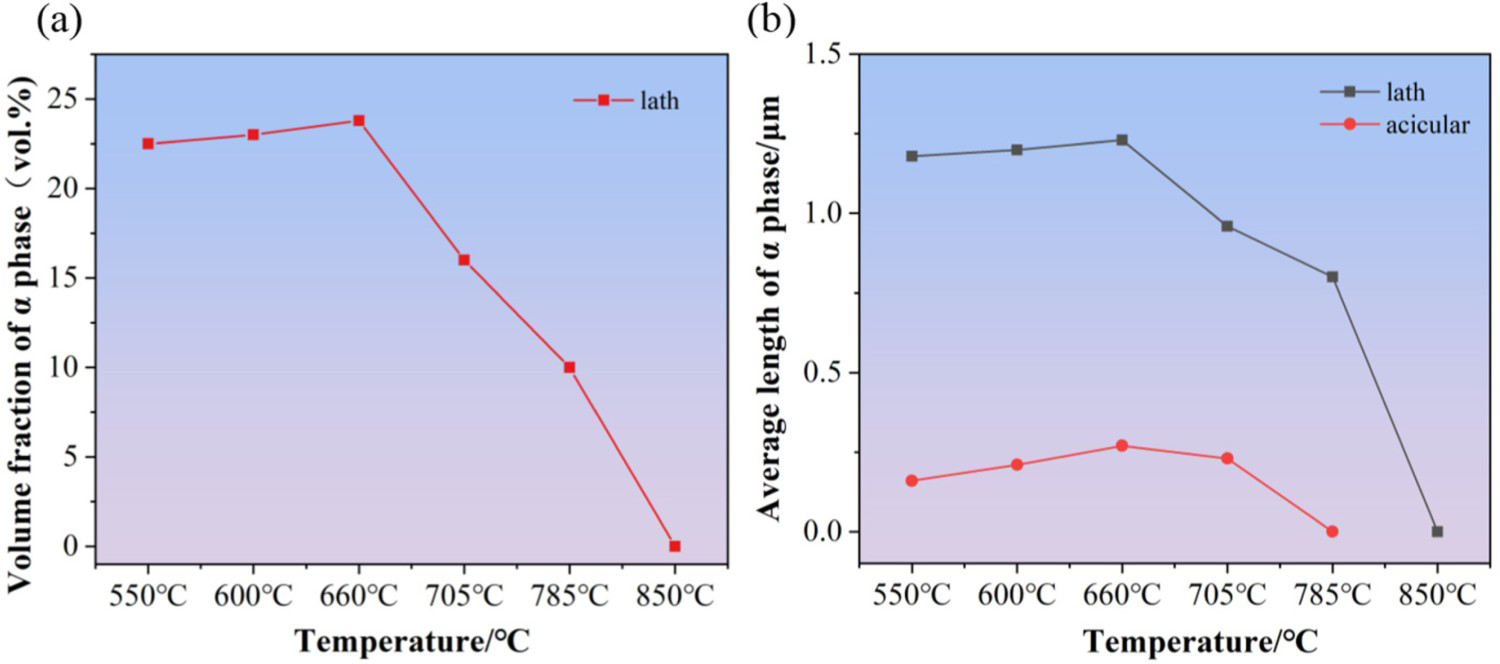
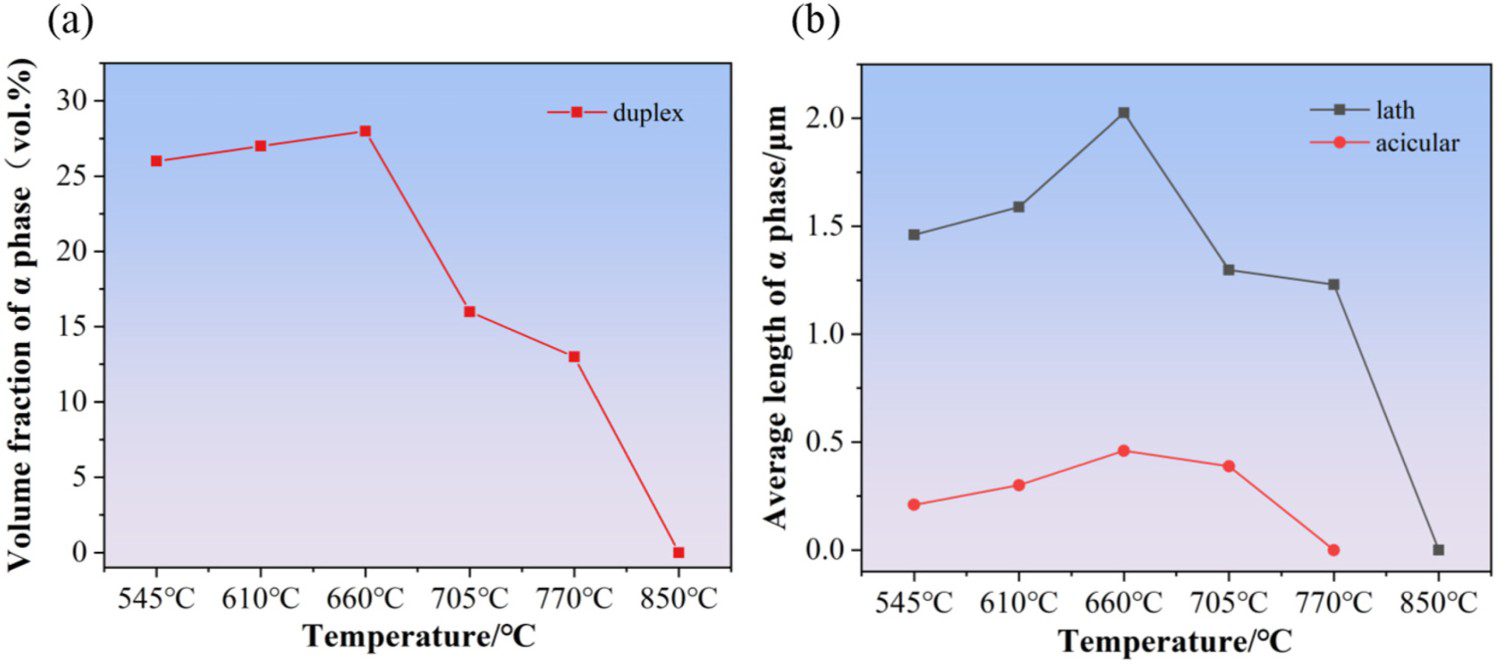
The samples with a duplex structure were heated at different temperatures (i.e. 545, 610, 660, 705, 770, and 850°C) with a heating rate of 7 K min−1, followed by direct water cooling. The microstructures of the duplex structure at each temperature were examined and analysed in Figure 10, and the phase fraction and grain size were evaluated. From the observations presented in Figure 10 and 11, it can be found that at the lower temperatures (i.e. 545, 610, and 660°C) the α-phase content gradually increases with minimal changes. This can be attributed to the transformation of the β-phase into the αacicular-phase, accompanied by the growth of the αlath-phase. Figure 11(a) reveals a subsequent decrease in the fraction of the α-phase as the temperature rises. This reduction is due to the re-dissolution of the α-phase into the β-phase, resulting in an overall descent in the α-phase content. Figure 10(d, e) and 11(b), shows a gradual decrease in the fraction of the αacicular-phase until its complete disappearance in the temperature range of 660–770°C. This indicates the occurrence of the αacicular → β transformation within this temperature range. Additionally, in Figures 10(e,f) and 11, it can be concluded that the αlath → β transformation takes place between 660°C and 850°C. At 850°C, the microstructure consists entirely of the β-phase, signifying the complete transformation of the α-phase. This behaviour can be attributed to the increased activation energy for phase transition obtained with rising temperature. The growth and dissolution behaviour between the αlath and αacicular-phases can be elucidated by considering Gibbs–Thomson effect and the multicomponent diffusion coefficient, as previously discussed in references [48–50].
SEM images of duplex structure at different heating temperatures: (a) 545°C, (b) 610°C, (c) 660°C, (d) 705°C, (e) 770°C, (f) 850°C. The variations of α phase in duplex microstructure with temperatures: (a) volume fraction and (b) average length.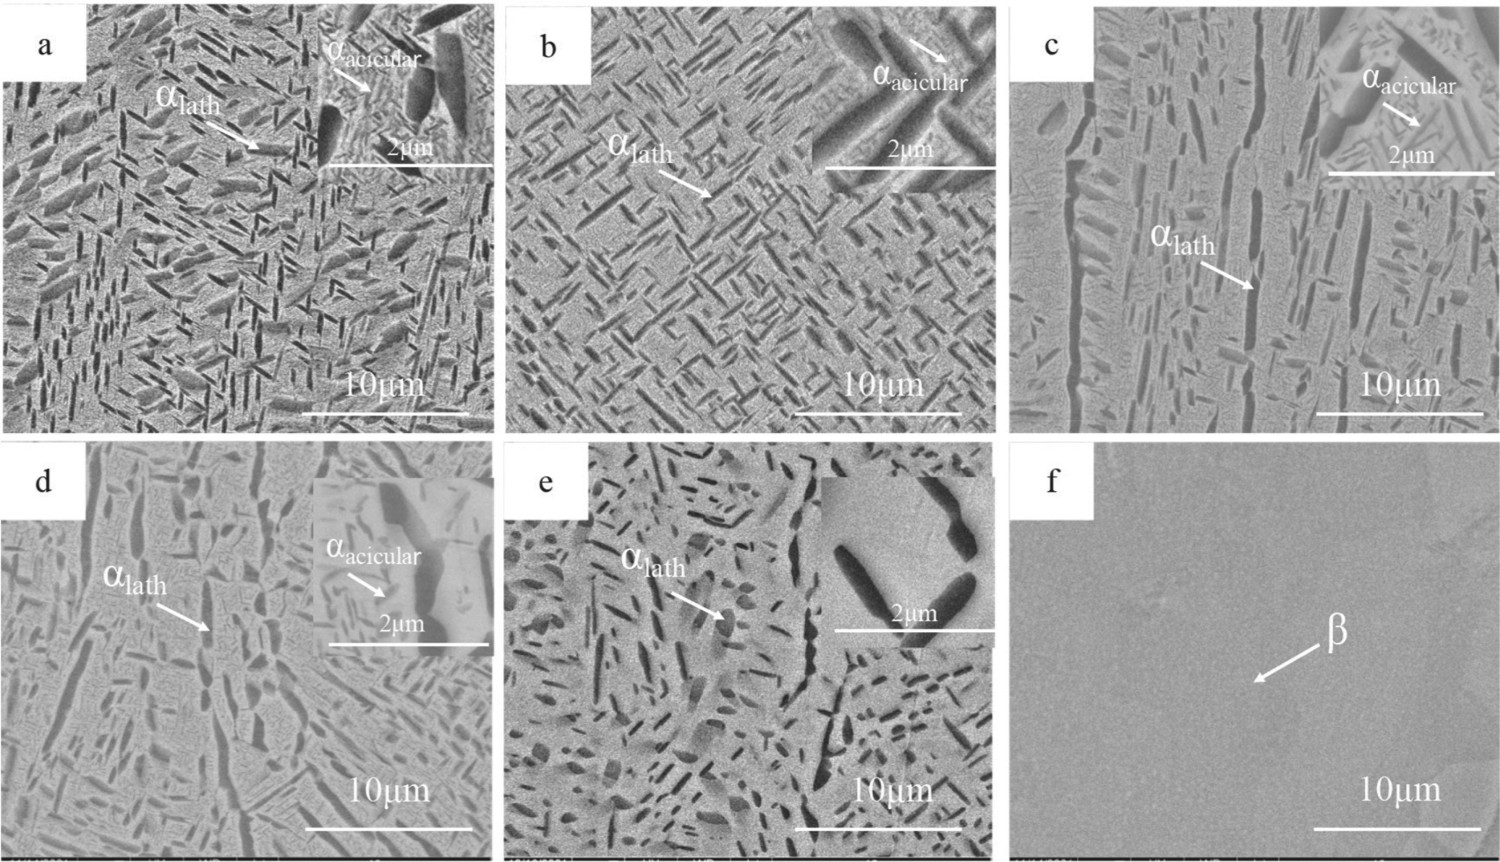
The microstructure of the alloy was analysed using backscattered images acquired through SEM. Different phases of the alloy possess varying sensitivity to emitted atoms, which is influenced by their atomic number size and atomic radius. Consequently, a difference in the phase contrast is observed. Figure 12 illustrates the microstructure of the lamellar structure at different heating temperatures, specifically 560°C, 615°C, 705°C, 745°C, 810°C, and 850°C.
SEM images of lamellar structure at different heating temperatures: (a) 560°C, (b) 615°C, (c) 705°C, (d) 745°C, (e) 810°C, (f) 850°C.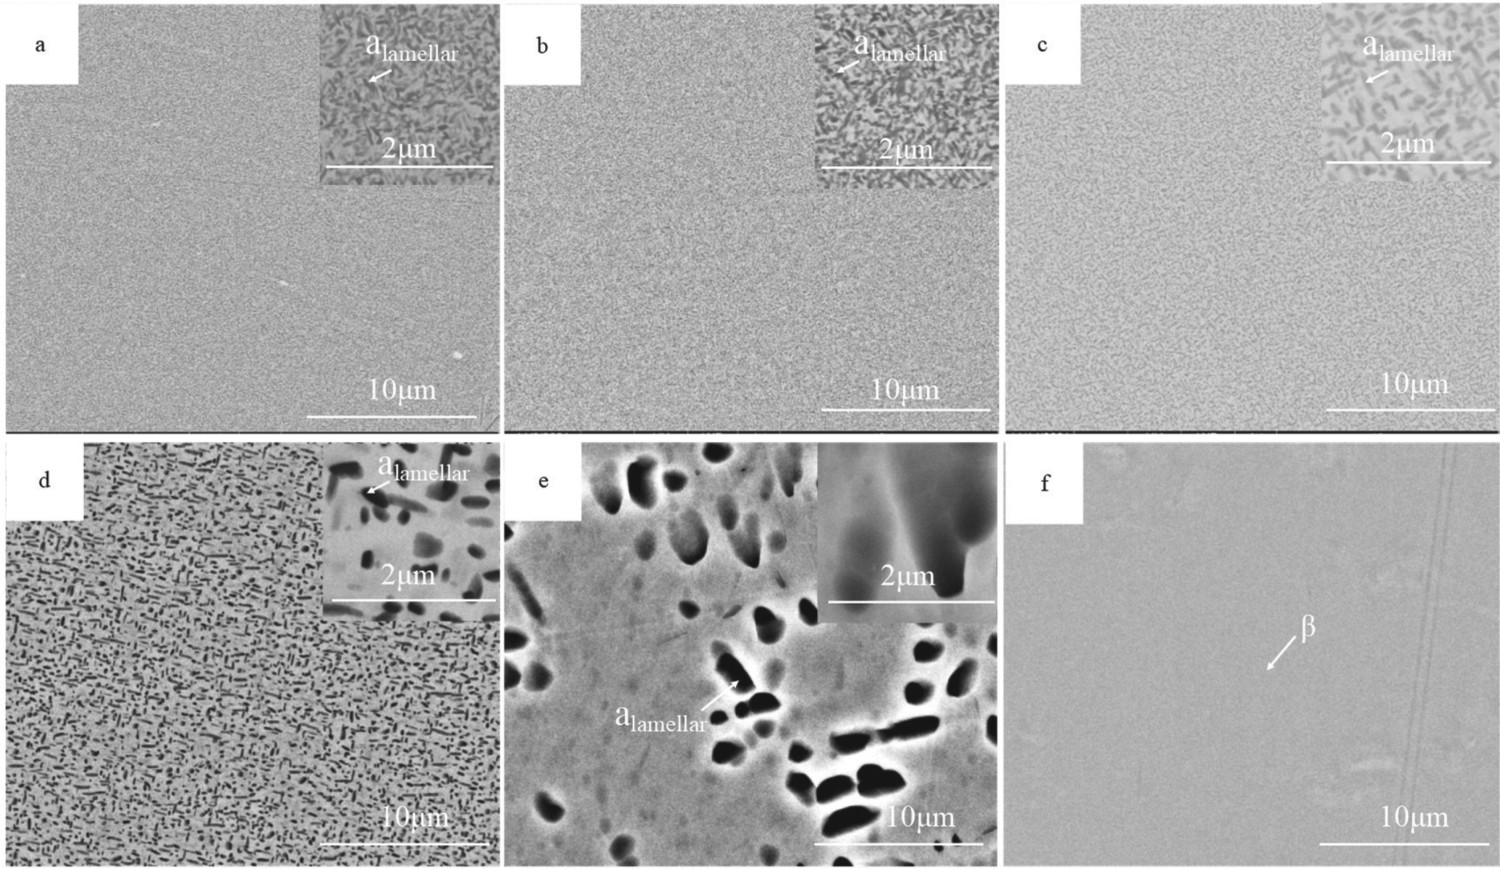
Figure 13 displays the statistical analysis of the phase content and length of the α-phase in the lamellar structure at different temperatures. As the temperature rises from 560°C to 615°C, the phase content increases from 49% to 56%. This increase can be attributed to the fact that, within the temperature range of 560–615 °C, the Gibbs free energy of the β-phase is higher than that of the α-phase. Consequently, the phase transformation proceeds in the direction of decreasing free energy, facilitating the nucleation of the secondary α-phase. However, due to the relatively low temperature, the diffusion of elements in the alloy becomes more difficult, impeding the growth of the secondary α-phase. As a result, smaller secondary α-phases are generated within the β matrix. Continuing the temperature increase, the phase content gradually reduces. At 810°C, the α-phase content decreases to 16%, while the β-phase content ascends to 84%.
The variations of α phase in lamellar microstructure with temperatures: (a) volume fraction and (b) average length.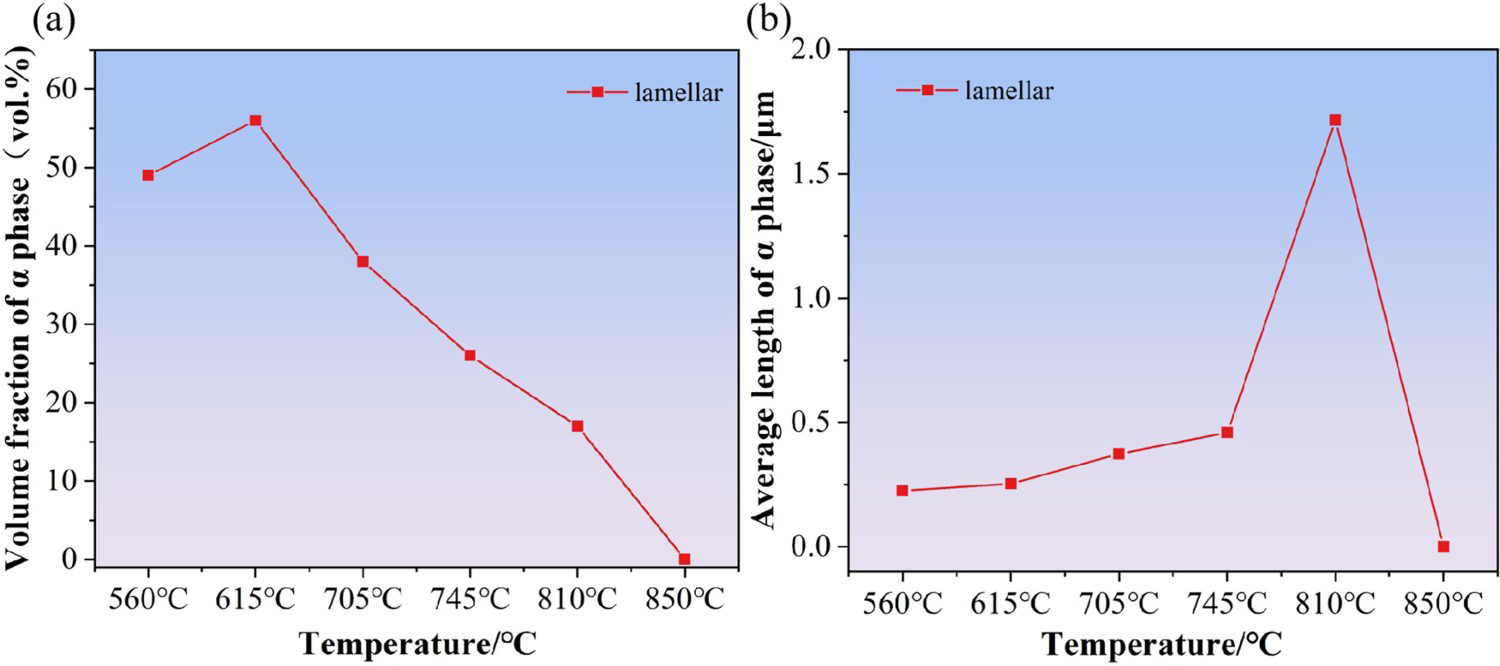
The fine worm-like α-phase is uniformly distributed throughout the β matrix, exhibiting an average length of approximately 0.225 µm at 560°C. As the temperature increases, the content of the α-phase decreases after reaching 705°C, indicating a re-solution period within the alloy. During this period, the α-phase grows in a more balanced state, leading to an increase in the average length of the α-phase to around 0.374 µm. Upon reaching 745°C, the phase content of the α-phase continues to decrease due to its continuing dissolution. However, the morphology of the α-phase undergoes a transformation, becoming more spheroidised as the temperature rises. Simultaneously, the average length of the α-phase further increases to approximately 0.45 µm, as depicted in the accompanying image. At 850°C, only the β-phase grains are present in the microstructure, indicating that the heating temperature has surpassed the phase transformation temperatures. At this stage, the phase transformation process during the entire heating period is completed.
Mechanical properties of different microstructures
Mechanical properties of initial structures
Tensile tests were conducted under the same conditions for the three initial structures, and the resulting tensile properties are shown in Figure 14. These test results provide valuable insights into the mechanical properties of Ti-35421 alloy with different initial structures. The duplex structure demonstrates superior overall performance, characterised by a yield strength of 1210 MPa and an elongation of 9.19%. Although the lath structure exhibits a lower yield strength compared to Ti-35421 rolled state [51], it displays a higher elongation of 19.28%. On the other hand, the lamellar structure has better strength but significantly lower elongation, measuring only 0.8%. This elongation value is much lower than that of the lath and the duplex structure. Comparing the duplex structure of Ti-35421 with Ti-B19, it exhibits comparable performance while offering advantages in terms of lower raw materials and processing costs. Furthermore, the strength of lamellar structure demonstrates higher than TB19 [16]. During the solid solution process above the phase transition temperature, Ti-35421 alloy transforms into a supersaturated solid solution as the primary α-phase dissolves into the β matrix. Subsequent solid solution and aging treatment lead to the formation of numerous fine secondary α-phases within the β substrate. These secondary α-phases possess a small grain size and diffuse distribution. They act as obstacles at the grain boundaries, allowing dislocations to traverse them in a cut-through manner [52]. As a result, the strength of the lamellar structure is significantly improved, albeit at the expense of reduced plasticity.
Tensile properties of different initial structures.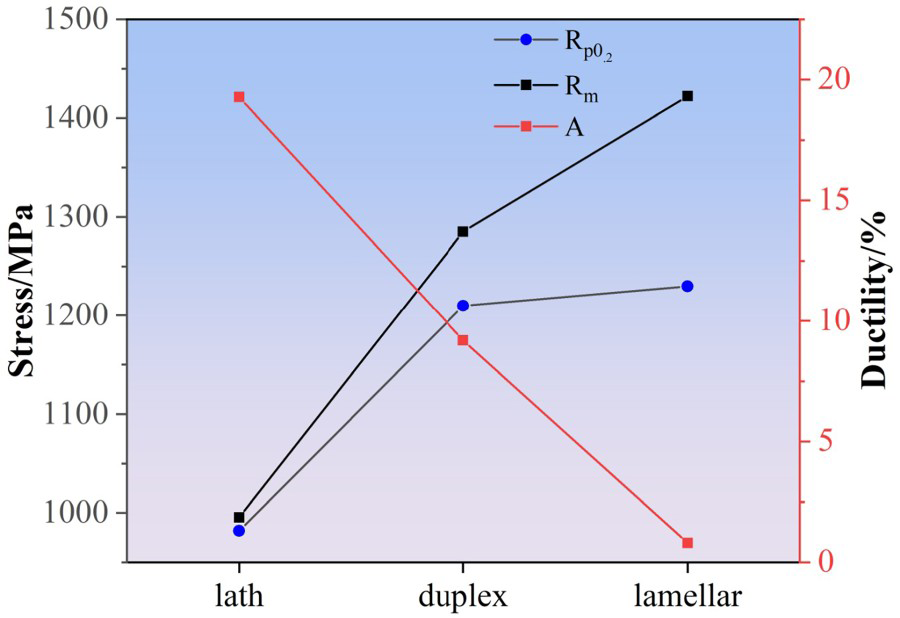
Figure 15(a) presents the tensile fracture morphology of the lath structure, revealing the presence of dimples with highly similar shapes distributed across the fracture surface. These dimples are characteristic of ductile fractures. Numerous secondary cracks, along with a few microvoid, can be observed along the direction of cracks propagation on the fracture surface. The occurrence of these secondary cracks contributes to the absorption of cracking energy from the main cracks, thereby enhancing the fracture toughness of the lath structure. In Figure 15(b), significant plastic deformation is evident on the fracture surface. Intense slip deformation leads to the dislocation accumulation, resulting in the formation of new micropores on the fracture surface. The aggregation of these micropores eventually triggers the fracture. Tear ribs can be observed in the fibre zone of the fracture, which is a consequence of violent plastic deformation. The height of the tear ribs gradually decreases as the crack expands, corresponding to a decrease in energy. Dimples are also observed on the fracture surface, although their distribution is uneven, and their size varies. The size of the dimples in Figure 15(b) is smaller compared to those observed in the lath structure, indicating lower levels of plasticity. Figure 15(c) exhibits bright crystalline fracture morphology, forming a rock sugar fracture. No significant plastic deformation is observed prior to fracture. Various gullies and dissociation steps are distributed on the fracture surface, which are typical characteristics of brittle fracture [53].
Tensile fracture morphology of different initial structures: (a) lath structure, (b) duplex structure, (c) lamellar structure.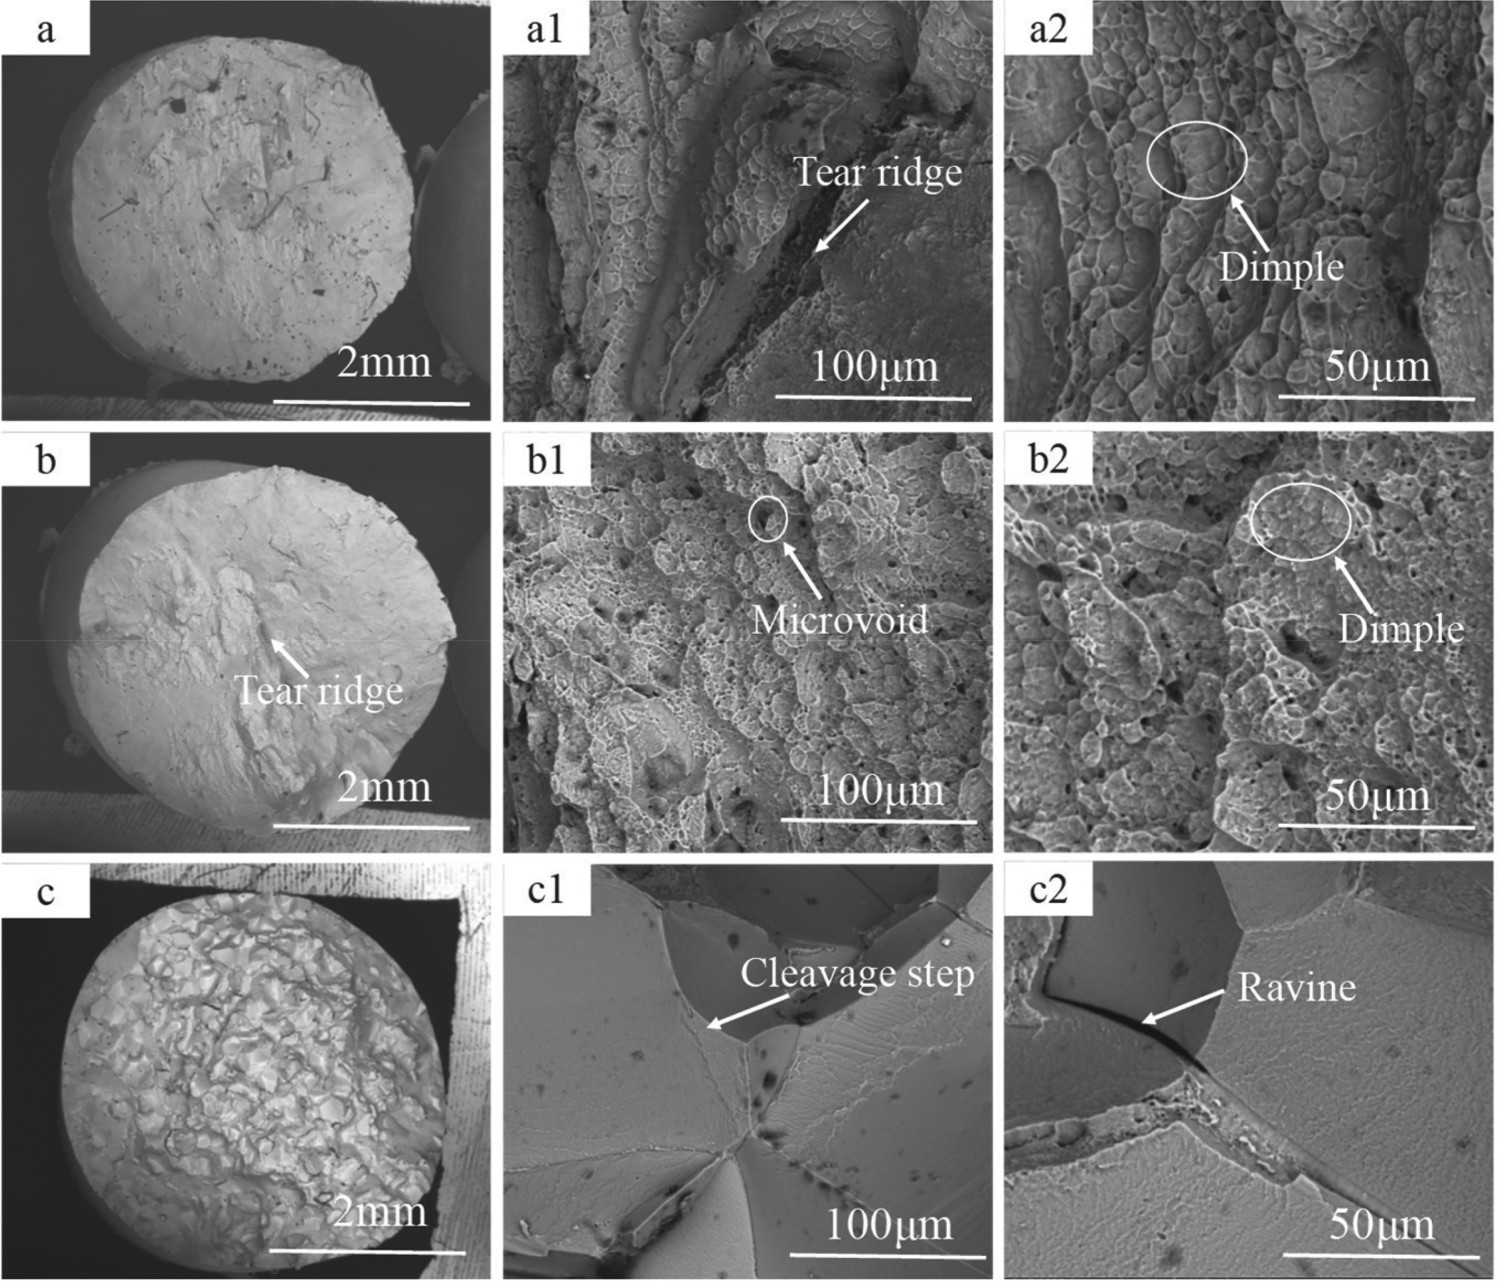
Mechanical properties of lath structure
Figure 16 shows the tensile properties of the lath structure at different temperatures (i.e. 550, 600, 660, 705, 785, and 850°C). The results reveal that as the heat treatment temperature increases, the strength of the alloy gradually decreases, while the plasticity shows an opposite trend. At 550°C, the alloy exhibits a yield strength of 1309 MPa, but the elongation after fracture is only 1%. As the temperature increases to 600°C, the yield strength decreases to 1200 MPa, while the elongation after fracture increases to 5.6%. Further increasing the temperature to 705°C leads to a decrease in the yield strength to 945 MPa, accompanied by an increase in the elongation after fracture to 11.6%. At 850°C, the microstructure consists entirely of the β-phase, resulting in a low yield strength of 727 MPa but a plasticity of 23.28%. With lower temperature, the formation of the αacicular-phase occurs, and the grains exhibit a fine and diffuse distribution within the β matrix, contributing to diffusion strengthening. However, as the temperature increases, the grains start to grow. Eventually, at a certain temperature, the α-phase begins to dissolve, resulting in a reduction in strength while improving the plasticity of the alloy.
Tensile properties of lath structures after heating at different temperatures.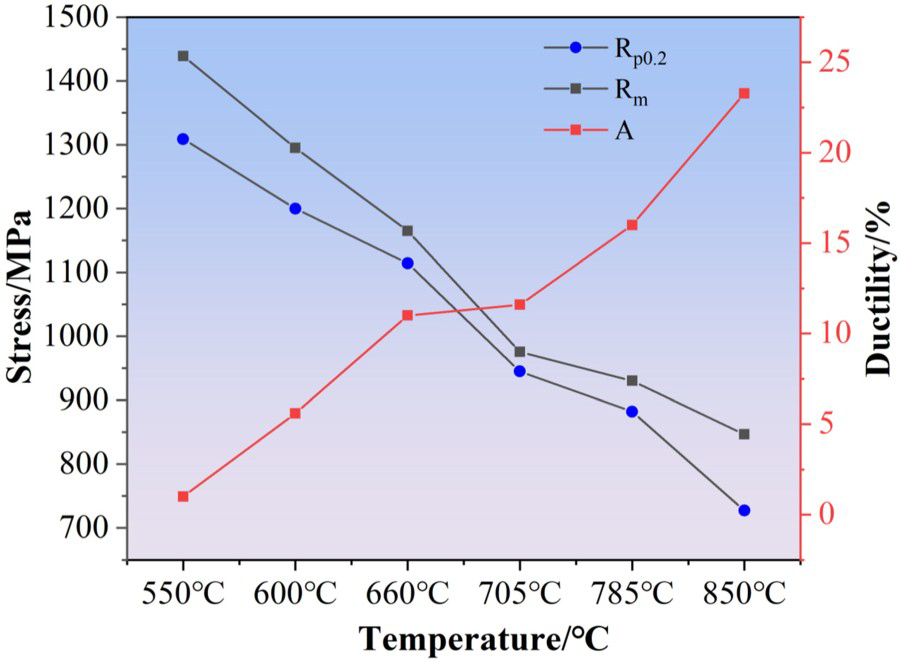
Figure 17 presents the fracture surfaces of the tensile specimens from the lath structure at different temperatures. The analysis of fracture morphology provides valuable insights into the observed mechanical properties, thereby corroborating the previously obtained results. In Figure 17(a), the fracture surface displays distinctive river-like patterns and a crystalline appearance, indicating a brittle fracture. Conversely, Figure 17(b) exhibits a dissociation plateau with irregularly shaped but shallow dimples. Macroscopically, the fracture mode appears to be shear fracture. Figure 17(c1) reveals a tear ridge and a relatively uniform dimple, which are indicative of plastic deformation. The fracture surfaces in Figure 17(d–f) have three distinct zones: the fibre zone, radial zone, and shear lip. Numerous micropores are present, serving as initiation sites for crack propagation. Additionally, the size of the dimples gradually increases, accompanied by deeper depths. This observation supports the conclusion that the plasticity of the lath structure improves progressively with the rising heating temperature, thus corroborating the data obtained from the preceding tensile experiments.
Tensile fracture morphology of lath structures at different temperatures: (a) 550°C, (b) 600°C, (c) 660°C, (d) 705°C, (e) 785°C, (f) 850°C.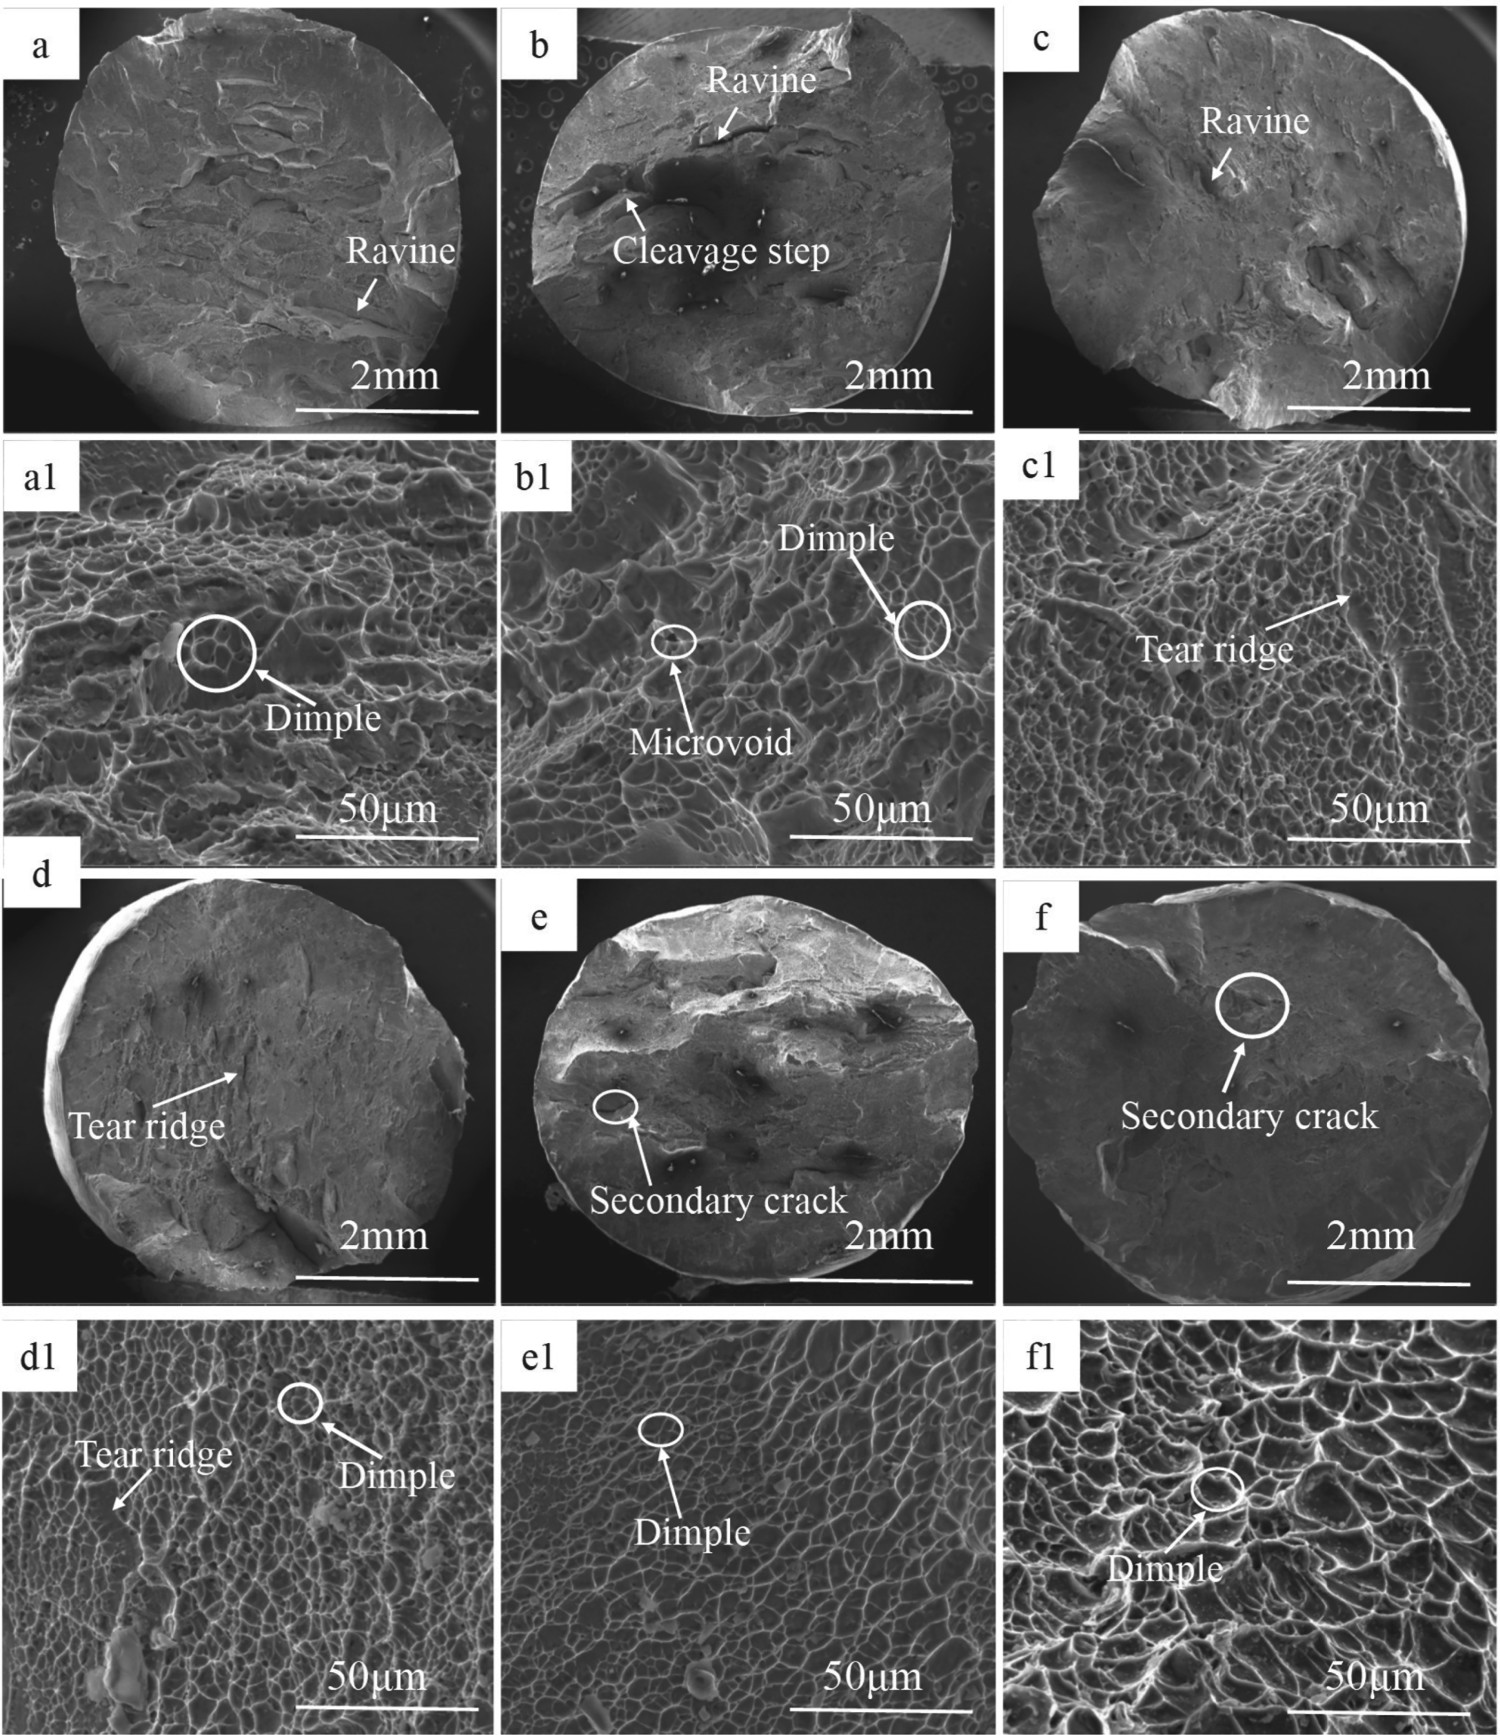
Mechanical properties of duplex structure
Figure 18 illustrates the mechanical properties of the duplex microstructure aged at different temperatures (i.e. 545, 610, 660, 705, 770, and 850°C). A consistent trend is observed: as the heating temperature increases, the tensile strength descends while the plasticity ascends. This trend is similar to the evolution process observed in the lath structure. At a heating temperature of 545°C, the duplex structure exhibits optimal comprehensive performance, while a yield strength of 1216 MPa and an elongation after fracture of 6.56%. It is noteworthy that the yield strength of the duplex structure in Ti-35421 alloy surpasses that of Ti–6Al–4 V ELI alloy [54]. Up to a heating temperature of 660°C, a significant amount of fine needle-like secondary α-phase is generated due to the low temperature. The diffusely distributed secondary α-phase hinders dislocation slip, forcing dislocation to pass through the secondary α-phase in a cut-through manner. Consequently, the strength level is high while the plasticity is relatively poor. However, as the heating temperature continues to rise, the size of the generated secondary α-phase increases, resulting in a decrease in their number. This reduces the number of grain boundaries and allows dislocations to bypass the secondary α-phase more easily. As a result, the strength decreases while the plasticity increases.
Tensile properties of duplex structures after heating at different temperatures.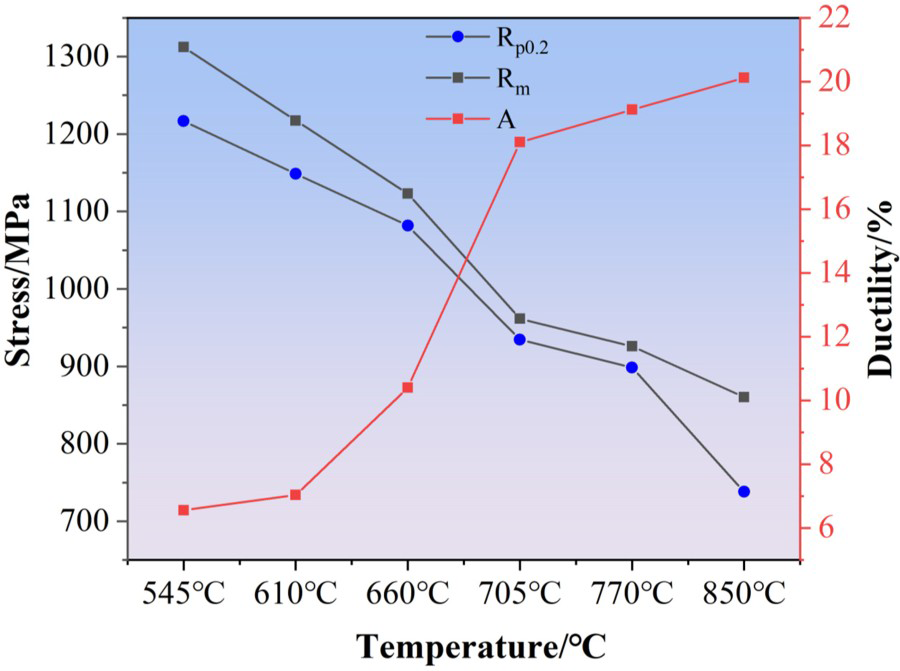
Figure 19 shows the fracture morphology of Ti-35421 duplex structure specimen following tensile fracture. The fracture exhibits distinctive characteristics that reveal a discernible trend. Several noteworthy observations can be made from Figure 18. First, the necking shrinkage is minimal, and the macroscopic fracture morphology displays small rubble-like features and destructive steps, which indicate relatively poor plasticity, as illustrated in Figure 19(a,b). Second, the fractures depicted in Figure 19 (c–f) contain relatively uniform dimples, with both the size and depth of the dimples gradually increasing. This phenomenon can be attributed to the expansion of the micropores leading to the formation of the observed dimples. As a result, the number of micropores gradually decreases, resulting in an improvement in plasticity compared to the fractures shown in Figure 19(a,b). The overall trend observed in the fracture morphology suggests a gradual enhancement in the plasticity of the duplex microstructure as the heat treatment temperature increases. This trend is evident in both the microscopic and macroscopic transformation characteristics of the fractures. Furthermore, when combined with the elongation values obtained from the tensile tests, the fracture morphology provides additional support for the trend indicating an increase in plasticity as the temperature rises. These findings are consistent with the experimental results obtained in this study.
Tensile fracture morphology of duplex structures at different temperatures: (a) 545°C, (b) 610°C, (c) 660°C, (d) 705°C, (e) 770°C, (f) 850°C.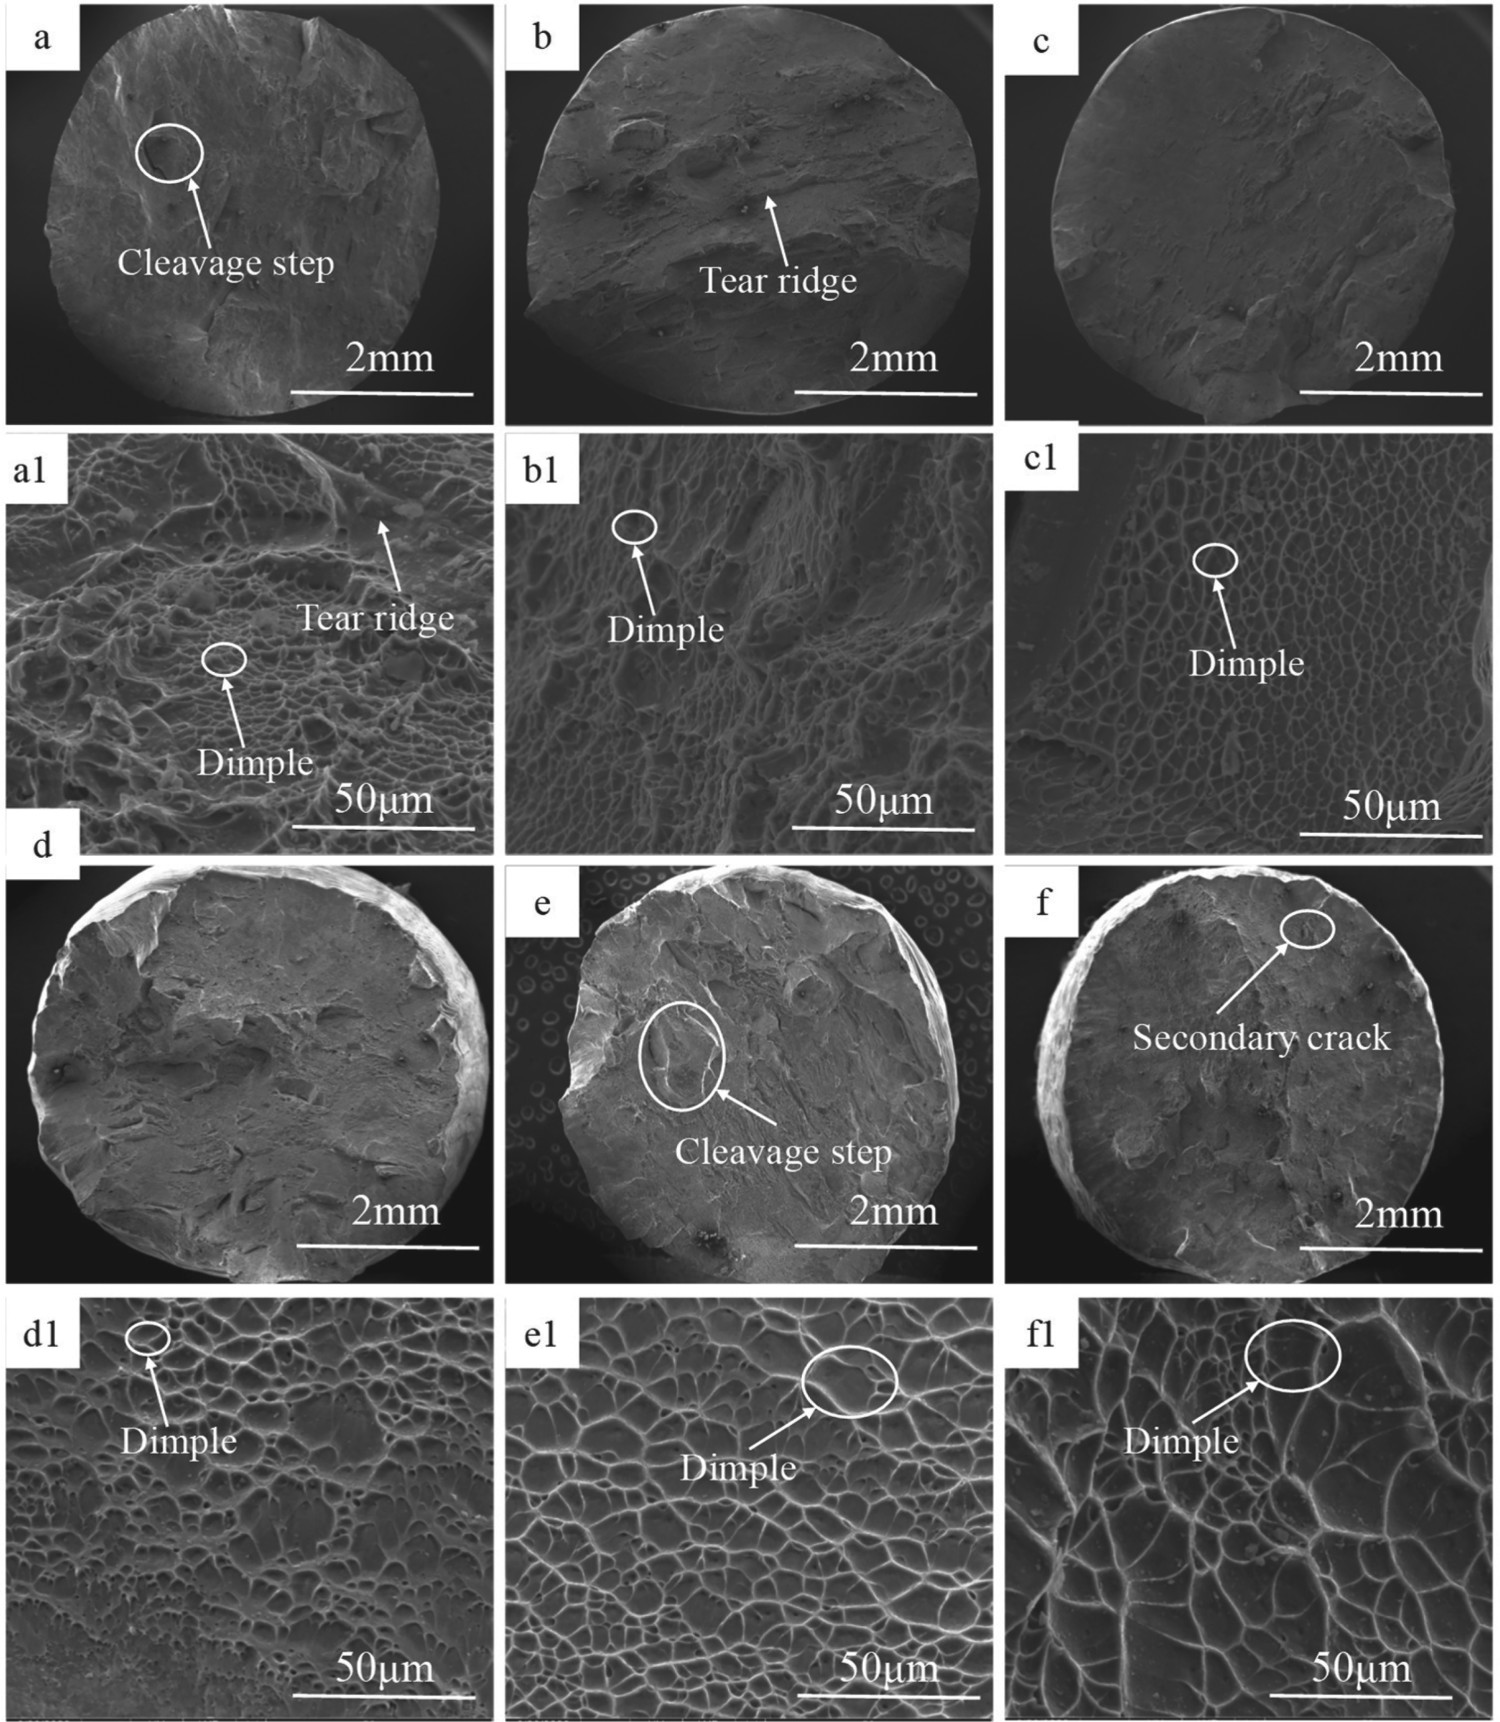
Conclusion
The phase transition kinetics, microstructure evolution, and mechanical properties of Ti-35421 alloy in the lath, duplex, and lamellar structures were investigated, leading to the following conclusions:
The thermal expansion experiments with different heating rates resulted in distinct “S”, indicating a phase transformation process controlled by nucleation and growth. The activation energies for the lath, duplex, and lamellar structure were 277, 220, and 193 kJ mol−1, respectively. The Avrami index showed a “U” distribution, reflecting that the phase transformation process can be divided into three stages, with the diffusion-controlled grain growth as the primary mechanism. The specific phase transformation reactions and temperature ranges were determined for each structure. For the lath structure, β transform into αacicular (550–660°C), αacicular convert to β (660–785°C), αlath transition to β (660–850°C) Similarly, for the duplex structure, the phase transformations were determined as β transform to αacicular (545–660°C), αacicular convert to β (660–770°C), and αlath transition to β (660–850°C). In the case of the lamellar structure, the phase transition observed were β transform to αsecondary (560–615°C), αsecondary convert to β (615–705°C), αlamellar transition to β (615–850°C). The mechanical properties of the different structures were systematically investigated, highlighting the exceptional comprehensive properties of the duplex structure. Specifically, the duplex structure demonstrated a remarkable yield strength of 1210 MPa and an elongation after fracture of 9.19%. Through heating treatment at different temperatures during the process, both the lath and duplex structure exhibited a clear trend of decreasing strength and increasing plasticity with rising temperature.
Footnotes
Disclosure statement
No potential conflict of interest was reported by the author(s).