
Abstract
A photo-deposition method was developed to synthesise argentous oxide/calcium aluminate nanocomposites (Ag2O-CAONCS) with orthorhombic Ca5Al6O14 and cubic Ag2O phases. Micro-morphology, micro-structure, optical, and visible-light catalytic properties were investigated via different techniques. Ag2O enhances visible-light absorption performance and decreases the band gap of the Ag2O-CAONCS. About 20 mL crystal violet (CV) dye (10 mgL–1) is totally degraded using 20 mg Ag2O-CAONCS under sunlight irradiation for 20 min. The enhanced photocatalytic activity of the Ag2O-CAONCS towards CV under sunlight irradiation is ascribed to the reduction of the band gap, improvement in visible-light absorption and inhibitation role of carriers recombination by Ag2O. The high, stable visible-light catalytic activity makes Ag2O-CAONCS promising photocatalysts for removing organic pollutants.
Keywords
Introduction
Calcium aluminate, as an inorganic compound in Al2O3-CaO binary system, exhibits great application promising in the fields of high alumina cement, refractory, photocatalysts, optical devices, flame detectors, dental cements and biomaterials [1–5]. Calcium aluminate nanoparticles with an average crystalline size of 8.34 nm exhibited good photocatalytic performance towards Coralene Dark Red 2B azo under solar irradiation [6]. The photocatalytic efficiency reached 86.87% using 1500 mg calcium aluminate nanoparticles in 300 mL 30 mg/L of Coralene Dark Red 2B dye in a neutral solution. Calcium aluminate paste showed good flowability and rigidity owing to the lubricating role between the calcium aluminate particles exhibiting good application potential in the inorganic binder field [7]. La, Te-doped calcium aluminate nanophosphors exhibited strong PL emission at 395 and 535 nm corresponding to blue light and green light, respectively [8]. Calcium aluminate@reduced graphene oxide (rGO) composite electrode showed good electrochemical double-layer capacitive behaviour with the specific capacitance of 79.33 Fg–1 at 0.2 Ag–1 due to synergistic role of free electron transfer and diffusion between the interface of the calcium aluminate and rGO nanosheets [9]. However, calcium aluminate possesses a large band gap which limits the practical application for wastewater treatment as the photocatalyst. Visible-light-sensitive semiconductor photocatalysts are effective to remove organic pollutants in wastewater under visible-light illumination which is beneficial for the practical application of the photocatalysts owing to the low cost and facile treatment process. Therefore, it is important to modify calcium aluminate nanomaterials for practical wastewater treatment under visible-light irradiation.
It is an effective method to prepare inorganic nanocomposite photocatalysts for promoting the migration of the photo-generated carriers, visible-light catalytic activity [10,11]. Argentous oxide (Ag2O) belongs to a visible-light-driven photocatalyst with a narrow band gap (1.2 eV) [12–14]. However, the application of Ag2O is limited owing to the high cost and instability for the decomposition into metallic Ag during the photocatalytic degradation of the inorganic pollutants [15]. Nanocomposites formed from semiconductors and Ag2O can work as efficient and stable visible-light photocatalysts [16,17]. Hierarchical Ag2O/TiO2 heterojunction-loaded CuC2O4 nanosheet-modified Cu mesh (Ag2O/TiO2@CuC2O4 CM) showed superior photocatalytic ability which greatly enhanced the anti-pollution ability of the substrate Cu mesh [18]. Ag2O/TiO2@CuC2O4 CM exhibited a high photo-degradation efficiency towards methylene blue (MB) under visible light for 60 min and self-cleaning ability for regenerating oil-contaminated mesh. Ag2O/TiO2 nanocomposites exhibited good photocatalytic activity towards MB and phenol which was 8.9 and 2.9 times superior to that of TiO2, respectively [19]. The enhanced photocatalytic activity was ascribed to improved light absorption and reduced recombination of electron–hole pairs. ZnO/Ag0/Ag2O heterojunction structures exhibited enhanced photocatalytic activity towards MB dye with a degradation ratio of 96.24% within 30 min visible-light irradiation which was 26.75 times higher than that of ZnO [20]. Ag2O can be used as an efficient electron trapping agent to improve the visible-light catalytic activity of semiconductor photocatalysts. Thus, a combination of Ag2O and calcium aluminate nanomaterials, such as calcium aluminate nanosheets (CaAlONS), will improve the catalytic performance of CaAlONS due to the stepwise structure of band-edge levels in the Ag2O/CaAlONS. To date, the research on the synthesis and photocatalytic activity of the argentous oxide/calcium aluminate nanocomposites (Ag2O-CAONCS) has not been reported.
In this work, Ag2O-CAONCS were obtained through a photo-deposition approach. The as-synthesised Ag2O-CAONCS show improved catalytic activity in crystal violet (CV) removal under natural sunlight compared with the CaAlONS. Furthermore, photo-stability and photocatalytic mechanisms for CV degradation using the Ag2O-CAONCS were also researched.
Experimental procedure
Synthesis of Ag2O-CAONCS
About 0.2 g of sodium aluminate and 0.226 g of calcium chloride were used to synthesise CaAlONS in an autoclave at 180 °C for 24 h by hydrothermal process. Ag2O-CAONCS were prepared by the photo-deposition process as follows: A certain amount of Ag acetate and 60 mg of CaAlONS were mixed in 15 mL of distilled water. The uniform dispersion was obtained by sonicating for 15 min; 5 mL methanol was added to above solution stirring for 15 min. The mixed solution with the CaAlONS and Ag acetate was illuminated for 0.5 h under a 200 W Hg lamp. White Ag2O-CAONCS samples were isolated and obtained by the filtration process. The Ag2O-CAONCS samples were named 0.05-Ag2O-CAONCS, 0.1-Ag2O-CAONCS corresponding to the Ag2O content of 0.05, 0.1 mmol, respectively.
Characterisation techniques
The crystal structures of the as-grown Ag2O-CAONCS samples were realised from X-ray diffraction (XRD) patterns with graphite monochromatised Cu-Kα radiation (Bruker AXS D8). The microscopic morphologies and structures of the Ag2O-CAONCS samples were recorded using scanning electron microscopy (SEM, JEOL JSM-6490LV) and transmission electron microscope (TEM, JEOL JEM-2100). Ag2O-CAONCS samples were dispersed into distilled water with the supersonic wave sonication for 10 min. Then, several drops of solution with Ag2O-CAONCS were added to the copper grid and dried to get TEM sample. Element mapping was obtained using energy dispersive spectroscopy (EDS) attached to SEM equipment. Solid ultraviolet–visible (UV–vis) diffusion reflectance spectra (DRS) of Ag2O-CAONCS were obtained via a UV3600 UV–vis spectrometer with an integrating sphere attachment. The elemental compositions of the samples were measured by X-ray photoelectron spectroscope (XPS, Thermo Fisher Scientific). Raman spectra of the samples were measured by a Renishaw Invia model confocal Raman spectrometer with a He/Ne light source (10 mW), excitation wavelength of 532 nm and exposure time of 10 s. Photoluminescence (PL) spectra were recorded using FLS920 model fluorescence spectrophotometer with an excitation wavelength of 330 nm from an Xe-laser. Electrochemical impedance spectroscope (EIS) was analysed in 10 mg·L−1 CV solution in the air using the CHI660E model workstation.
Evaluation of the photocatalytic performance of Ag2O-CAONCS
Photocatalytic experiments were performed as follows: The Ag2O-CAONCS (20 mg) were added to 20 mL of CV dye (10 mg·L–1). Before sunlight irradiation, the mixed suspension was stirred in the dark for 20 min to obtain equilibrium between CV molecules and Ag2O-CAONCS. At an interval of 10 min, 2 mL of suspension was collected to remove remnant Ag2O-CAONCS. CV concentration in the supernatant was obtained by analysing the intensity of the UV–vis absorption peak on a Youke UV756 model UV – vis spectrophotometer. For the comparison, the photocatalytic activity of the CaAlONS was also determined under identical conditions. About 20 mg of 0.1-Ag2O-CAONCS sample, 10 mL of CV solution, and 10 mL scavenger solution (10 mg·L−1) were applied for scavenger experiments to determine the reaction active species; 200 mg of 0.1-Ag2O-CAONCS and 200 mL CV solution (10 mg·L−1) were applied for investigating the re-usability of the Ag2O-CAONCS under sunlight irradiation. The 0.1-Ag2O-CAONCS were washed with distilled water and ethanol, respectively, and dried after each photocatalytic experiment.
Results and discussion
Structures, morphologies and compositions of Ag2O-CAONCS
The XRD data of CaAlONS and Ag2O-CAONCS are shown in Figure 1. CaAlONS sample is composed of orthorhombic Ca5Al6O14 phase (JCPDS card, No. 11–0357) (Figure 1(a)). Ag2O shows several diffraction peaks at 2θ = 38.1°, 47.1° and 65.6°, indexed to (200), (211) and (311) crystalline plane of cubic Ag2O phase (JCPDS card, No. 65–6811) in 0.05-Ag2O-CAONCS sample (Figure 1(b)). Compared with the CaAlONS sample, the new diffraction peaks corresponding to the cubic Ag2O phase also appear in the XRD pattern (Figure 1(c)), further confirming the existence of the Ag2O in the nanocomposites. With increasing Ag2O content, diffraction peak intensity of the cubic Ag2O increases obviously. The results show that Ag2O-CAONCS samples are composed of orthorhombic Ca5Al6O14 and cubic Ag2O phases.
XRD Patterns of the CaAlONS and Ag2O-CAONCS: (a) CaAlONS, (b) 0.05-Ag2O-CAONCS and (c) 0.1-Ag2O-CAONCS.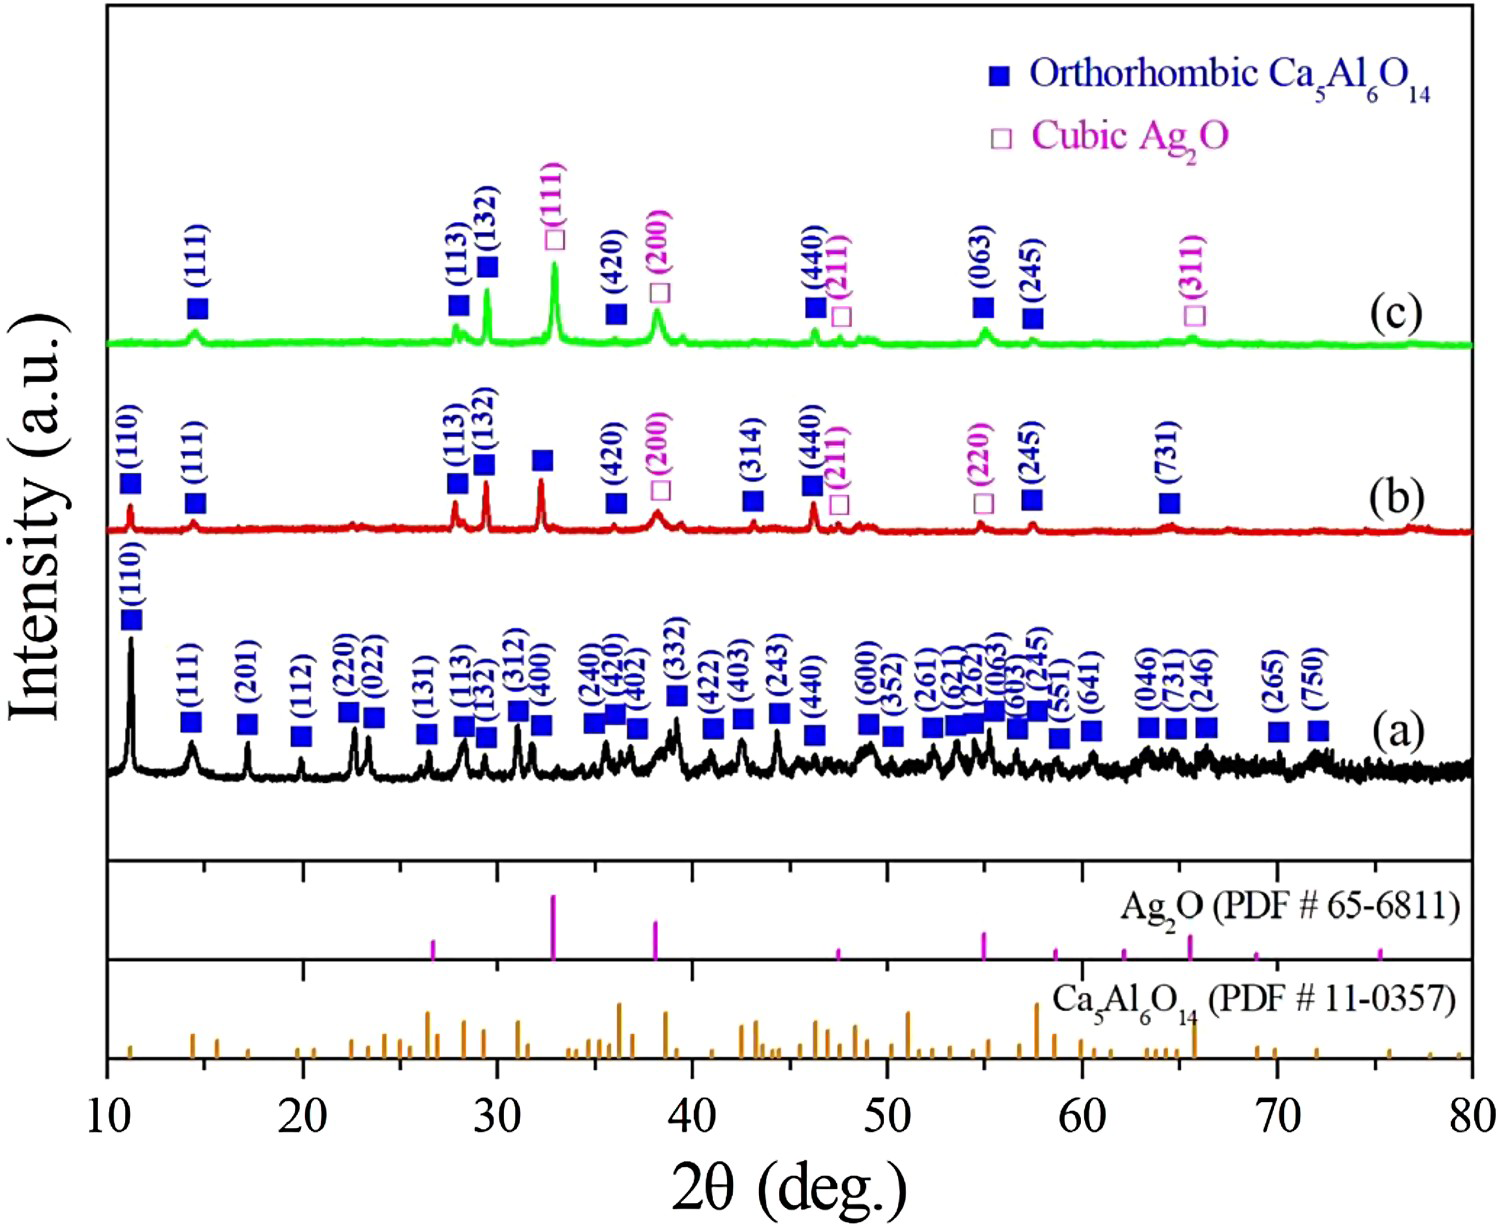
SEM images of the CaAlONS and Ag2O-CAONCS with different Ag2O contents were recorded so as to distinguish the difference in morphology between single material and composite materials. The CaAlONS samples are composed of nanoflake-shaped structures of about 2 μm size and a thickness of about 50 nm (Figure 2(a)); 0.05-Ag2O-CAONCS sample exhibits that the nanoscale particles are well distributed in the nanoflakes (Figure 2(b)). The size of the whole nanoflakes is about 500 nm–1 μm. The nanoflake thickness is about 50 nm. The morphology of the 0.1-Ag2O-CAONCS sample (Figure 2(c)) is similar to that of the CaAlONS and 0.05-Ag2O-CAONCS. Only the size of Ag2O-CAONCS samples is smaller than that of the CaAlONS. The existence of O, Al, Ca and Ag in the nanocomposites is proved by the element mapping of the 0.1-Ag2O-CAONCS, as shown in supplementary Figure S1.
SEM Images of the CaAlONS and Ag2O-CAONCS: (a) CaAlONS, (b) 0.05-Ag2O-CAONCS and (c) 0.1-Ag2O-CAONCS.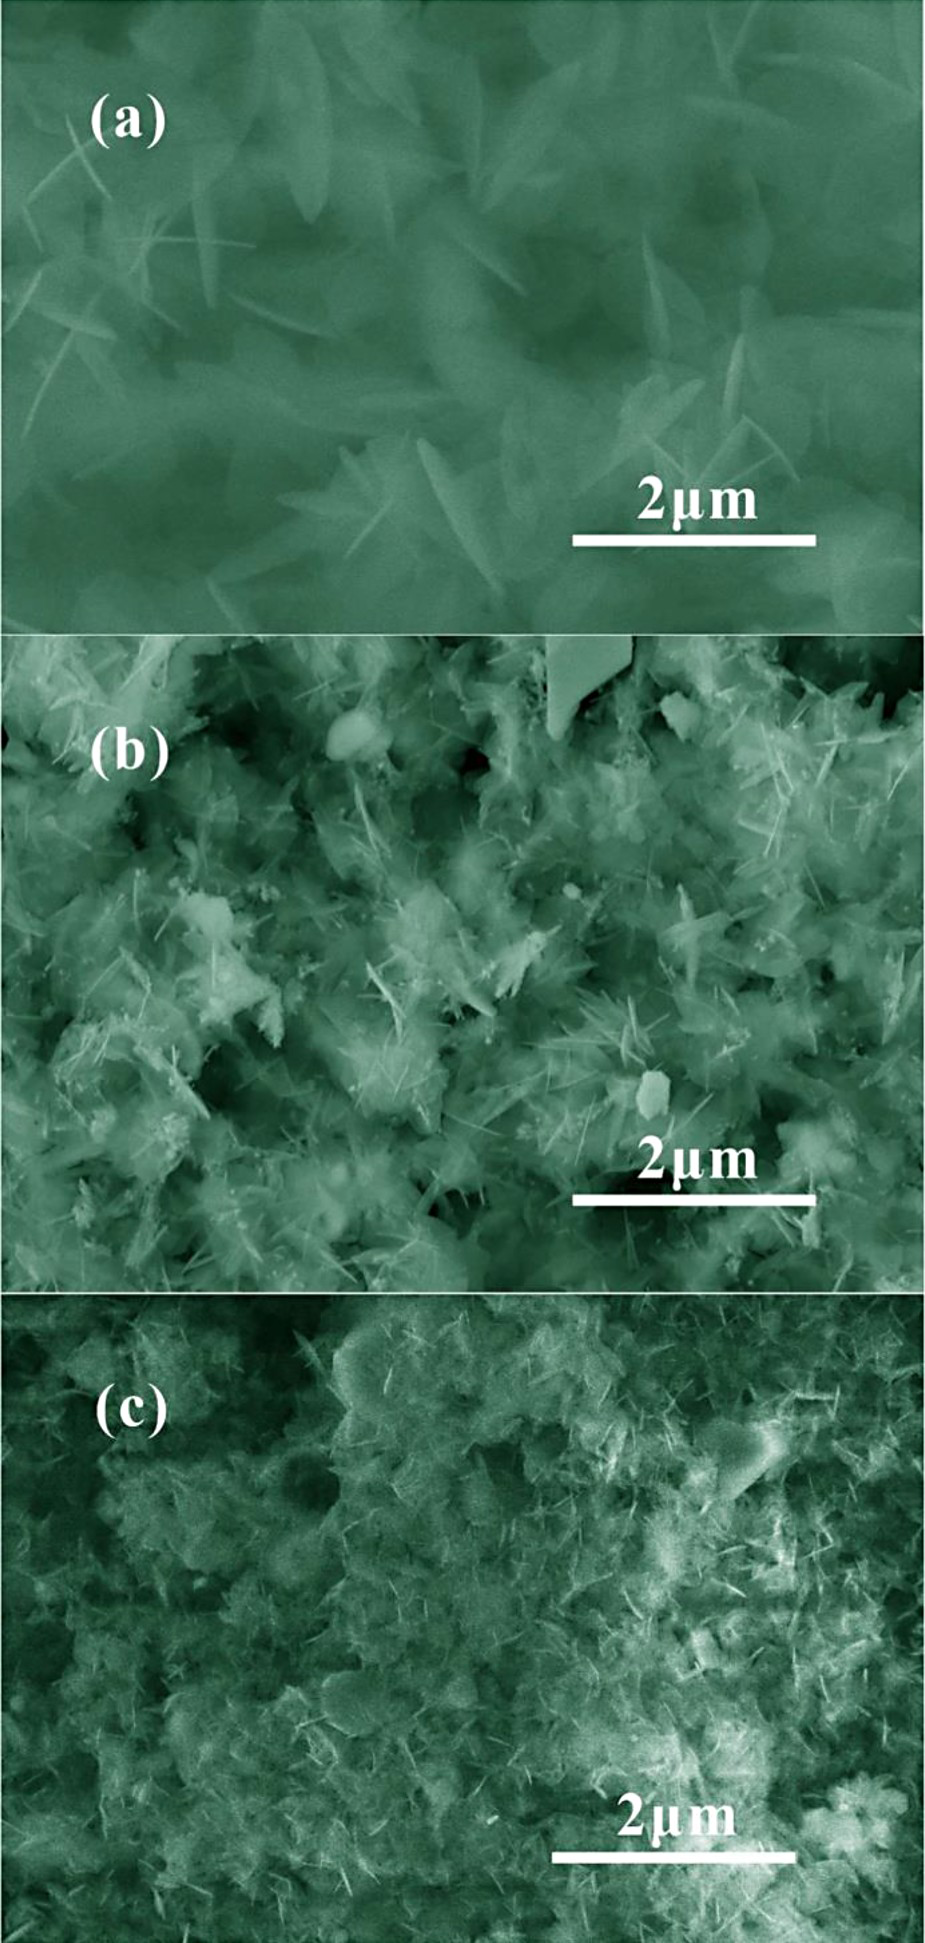
Figure 3(a) indicates the TEM image of the 0.1-Ag2O-CAONCS sample; 0.1-Ag2O-CAONCS shows the best photocatalytic performance towards CV which is confirmed by the following photocatalytic experiments. Therefore, 0.1-Ag2O-CAONCS were used as the representative sample for TEM and HRTEM observation. It is clearly observed that the nanocomposites are constructed from the nanoflakes with randomly distributed nanoparticles; 0.1-Ag2O-CAONCS sample exhibits regular lattice fringes (Figure 3(b)). The interplanar distance is 0.79, 0.33 nm, which is ascribed to (110) plane of orthorhombic Ca5Al6O14, (110) plane of cubic Ag2O. The regional electron diffraction patterns of the corresponding crystal planes are shown in the insets of Figure 3(b) as the Fast Fourier transform (FFT) patterns show single crystalline nature. Combined with the XRD, SEM and TEM analyses, Ag2O-CAONCS are composed of orthorhombic Ca5Al6O14 and cubic Ag2O phases.
Transmission electron microscopy images of 0.1-Ag2O-CAONCS: (a) TEM and (b) HRTEM; the insets are the FFT patterns.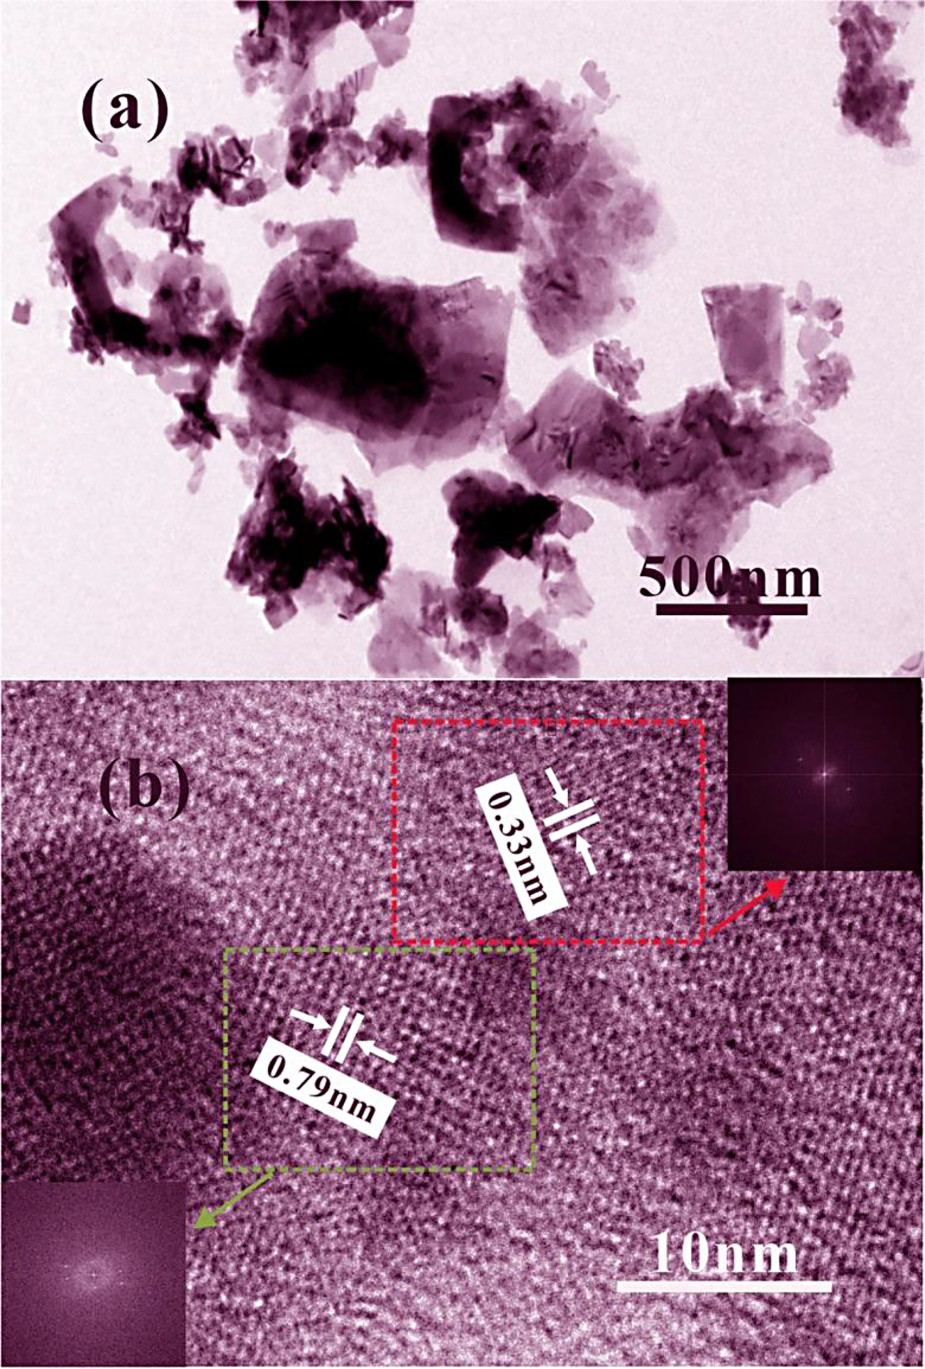
The surface chemical compositions of 0.1-Ag2O-CAONCS sample were characterised by XPS. Figure 4(a) shows the survey spectrum displaying that the Ag2O-CAONCS sample consists of O, Ag Ca and Al. The peak of high-resolution O 1s at 528.9 eV (Figure 4(b)) can be contributed to Al–O or Ag–O peak of the Ag2O-CAONCS [21]. Al 2p XPS peak at 71.4 eV (Figure 4(c)) is assigned to Al 2p3/2 of the Ag2O-CAONCS [22]. Ca 2p XPS peaks at 344.3 and 347.8 eV are caused by Ca 2p3/2 and Ca 2p1/2, respectively (Figure 4(d)) [23,24]. Ag 3d XPS peaks (Figure 4(e)) demonstrate spin–orbit split lines of Ag 3d5/2 and Ag 3d3/2 at 366.8, 372.1 eV, which indicates the existence of Ag+ and formation of the Ag2O in the nanocomposites [25]. The binding energies of the elements Ca, Al, O and Ag in the Ag2O-CAONCS sample are similar to those of the undoped CaAlONS (supplementary Figure S2) and Ag2O CaAlONS (supplementary Figure S3).
XPS Spectra of 0.1-Ag2O-CAONCS: (a) survey, (b) O 1s, (c) Al 2p, (d) Ca 2p and (e) Ag 3d.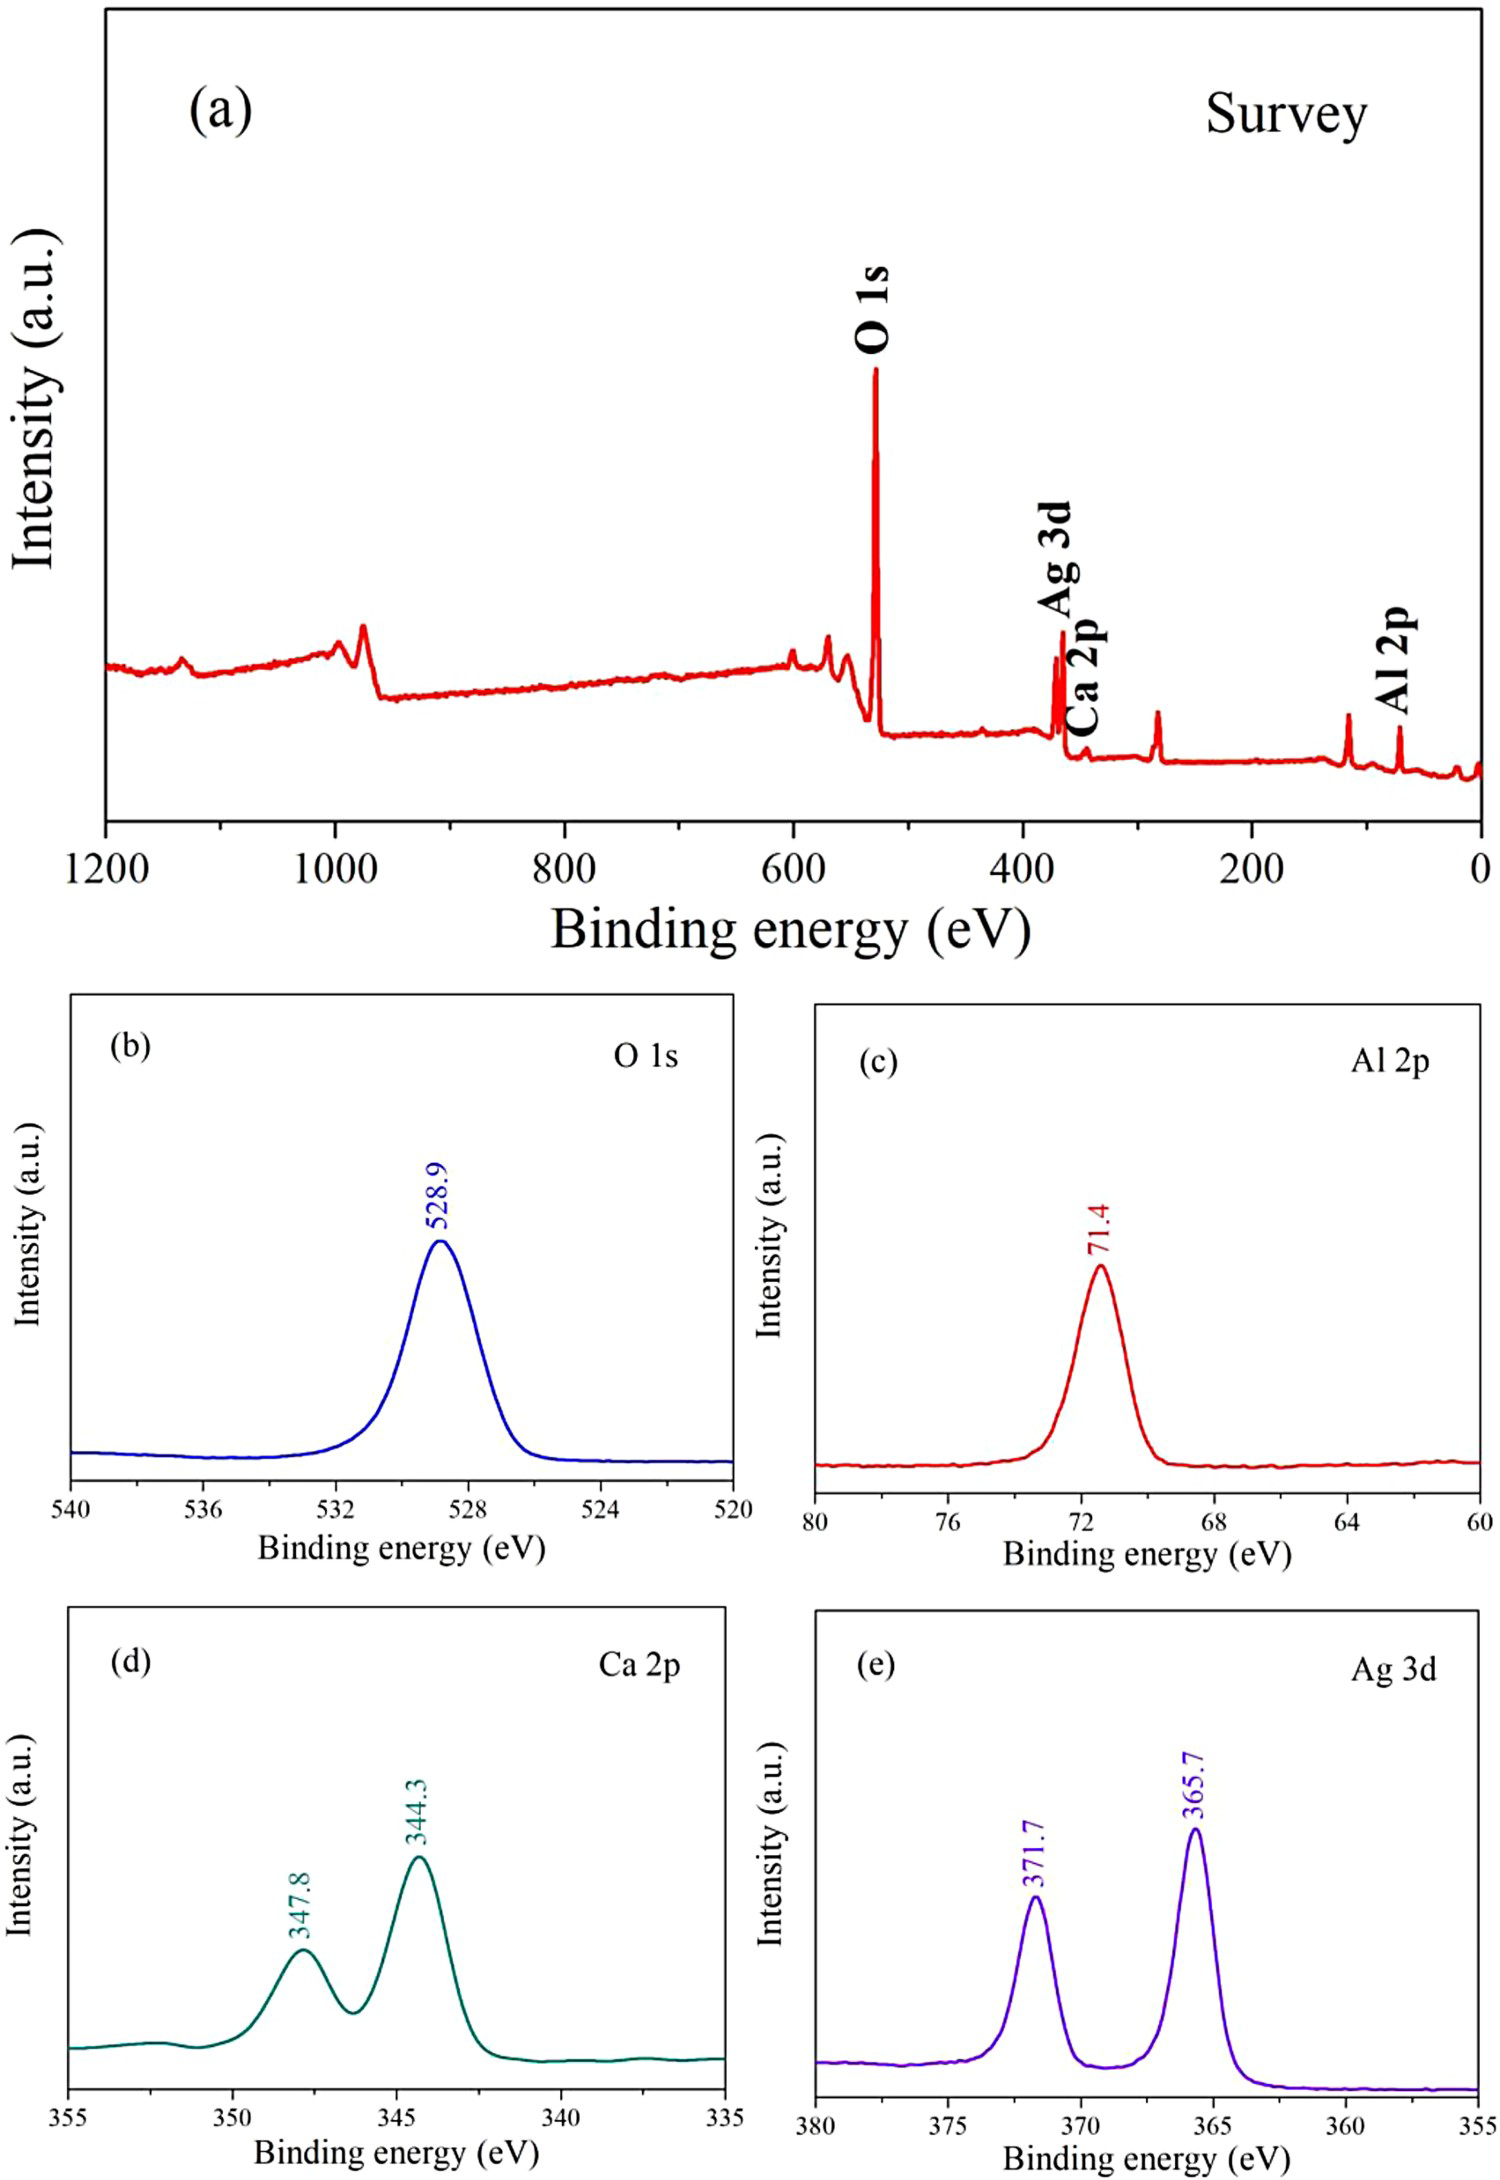
Optical performance of the Ag2O-CAONCS
The photochemical activity of the semiconductor photocatalysts is relevant to the optical performance. Therefore, the optical performance of the Ag2O-CAONCS was analysed by DRS, PL spectra of the CaAlONS and Ag2O-CAONCS. As shown in Figure 5(a), it is clear that the Ag2O-CAONCS shows stronger absorption in the visible-light region which is similar to that reported by various groups [26–28]. Ag2O plays a significant role in the optical absorption performance of the Ag2O-CAONCS. Furthermore, the absorption spectra of 0.05-Ag2O-CAONCS and 0.1-Ag2O-CAONCS perform to be flat from 350 to 500 nm, which may be contributed to significant background absorption of the Ag2O ranging from 350 to 500 nm [29]. The absorption edge of 0.05-Ag2O-CAONCS and 0.1-Ag2O-CAONCS is 713.1 and 947.1 nm. The band gap is 1.74 and 1.31 eV for 0.05-Ag2O-CAONCS and 0.1-Ag2O-CAONCS, respectively (Figure 5(b)), which is lower than that of CaAlONS (3.87 eV). Strong visible-light absorption and narrow band gap indicate the capability of Ag2O-CAONCS as visible-light-active photocatalysts.
DRS and Tauc plots of Ag2O-CAONCS: (a) DRS spectra; (b) Tauc plots.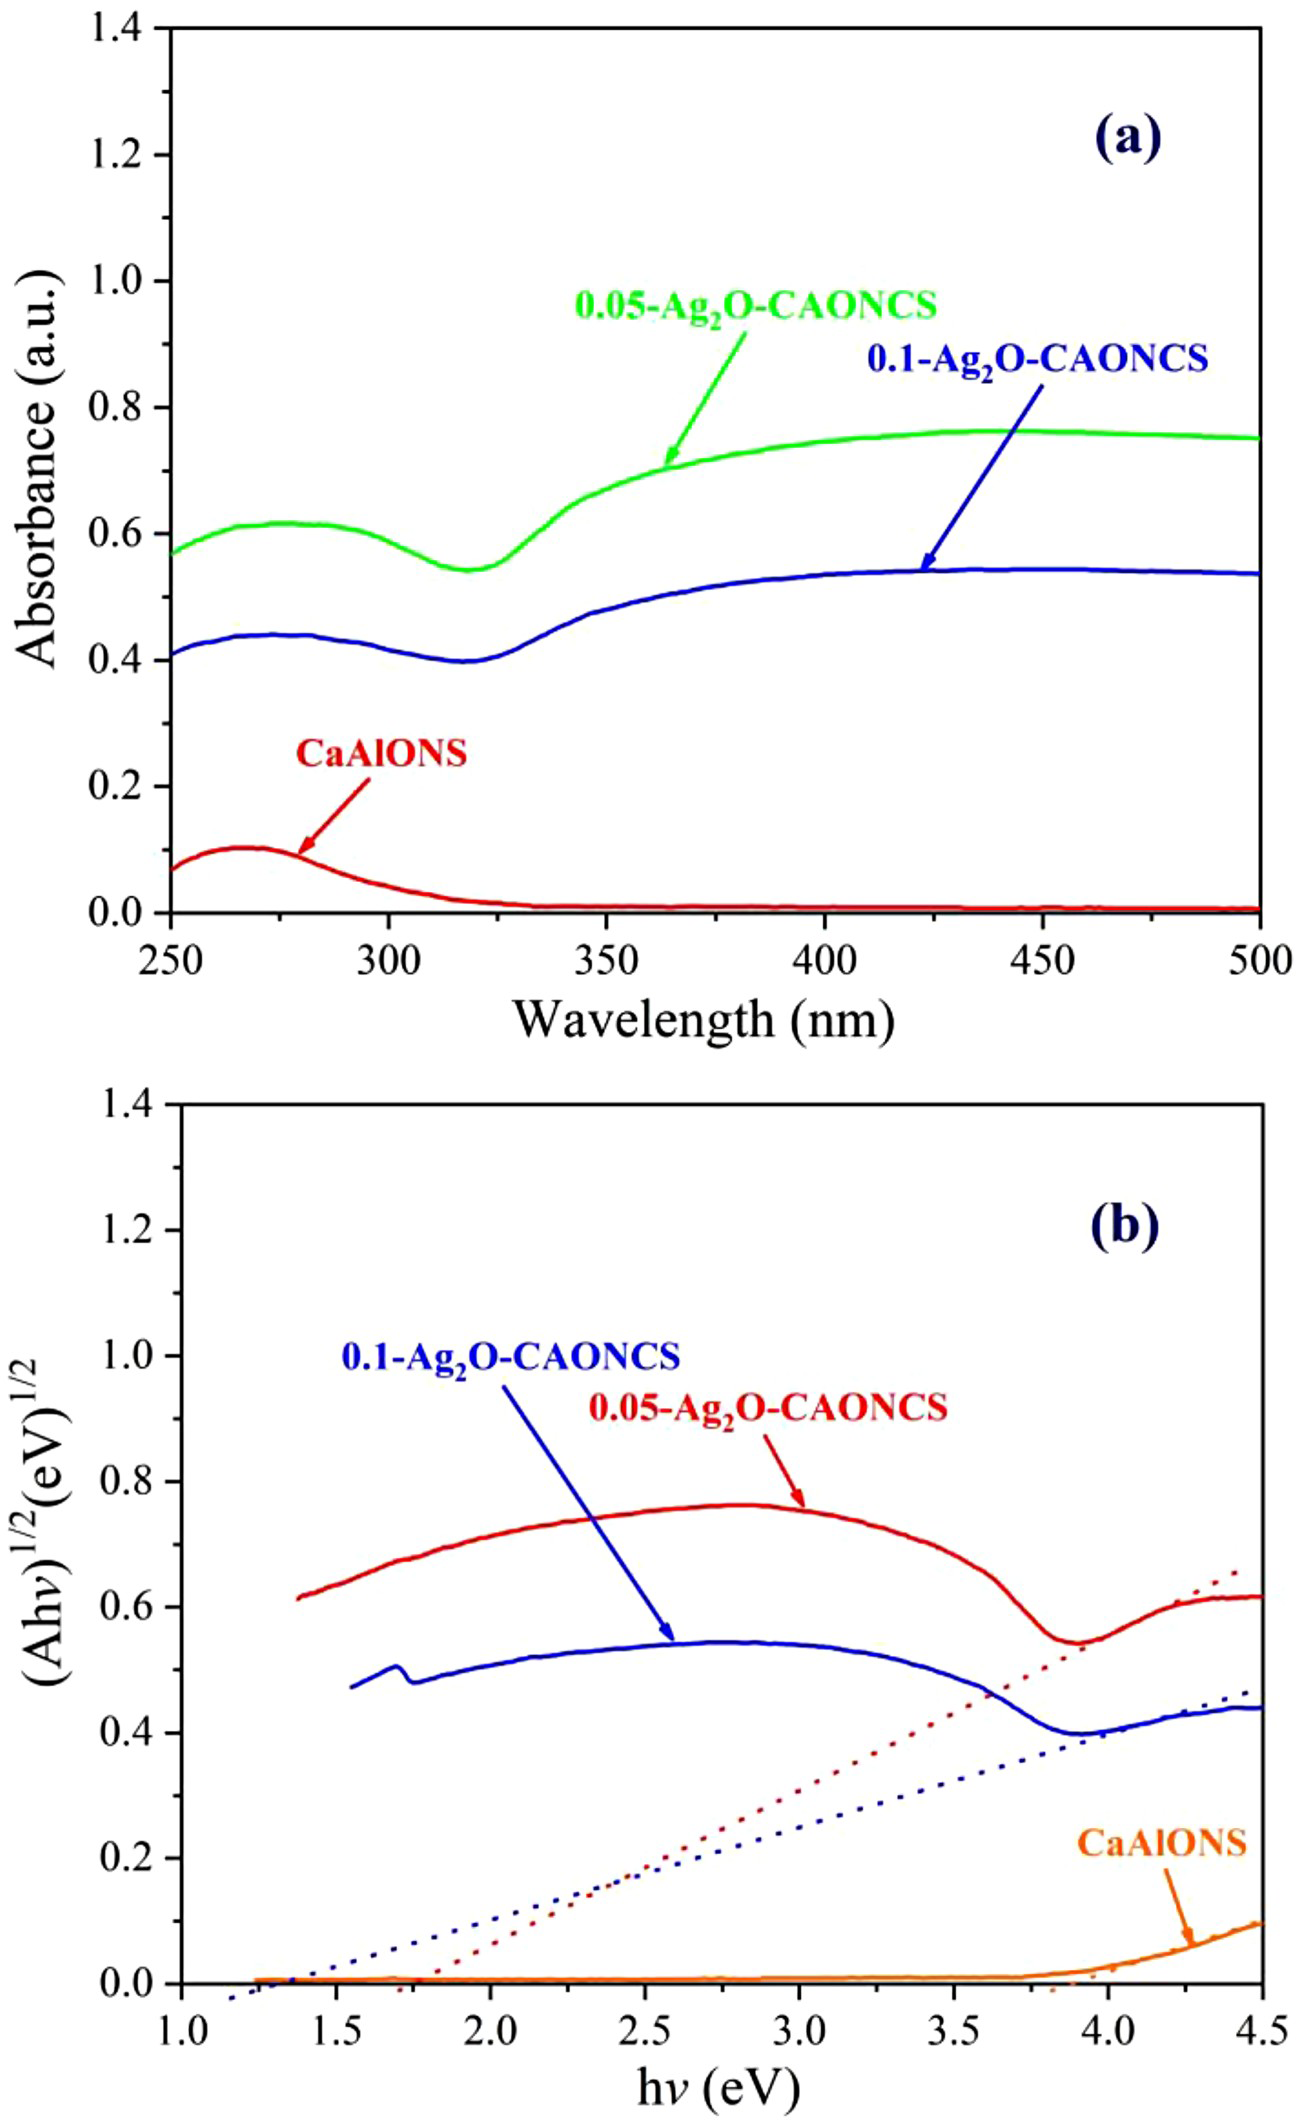
PL Emission can be used to analyse the separation capability of the carriers in the semiconductor photocatalysts. It is well known that the lower intensity of the PL emission peak implies lower recombination efficiency of photo-generated carriers [30–33]. As shown in Figure 6, the broad emission band at 640–680 nm with the emission peak at 658.4 nm is assigned to the charge transfer transition of oxygen vacancy trapped electrons of the Ca5Al6O14. When Ag2O is introduced into CaAlONS to form Ag2O-CAONCS, Ag2O-CAONCS exhibits a sharper decrease in the intensity of the PL peak than CaAlONS. Therefore, Ag2O-CAONCS exhibits fast charge transfer and enhanced separation of photo-generated carriers at the interface between Ca5Al6O14 and Ag2O, which will decrease the recombination efficiency of carriers and enhance the catalytic performance [34,35].
PL Spectra of the CaAlONS, 0.1-Ag2O-CAONCS.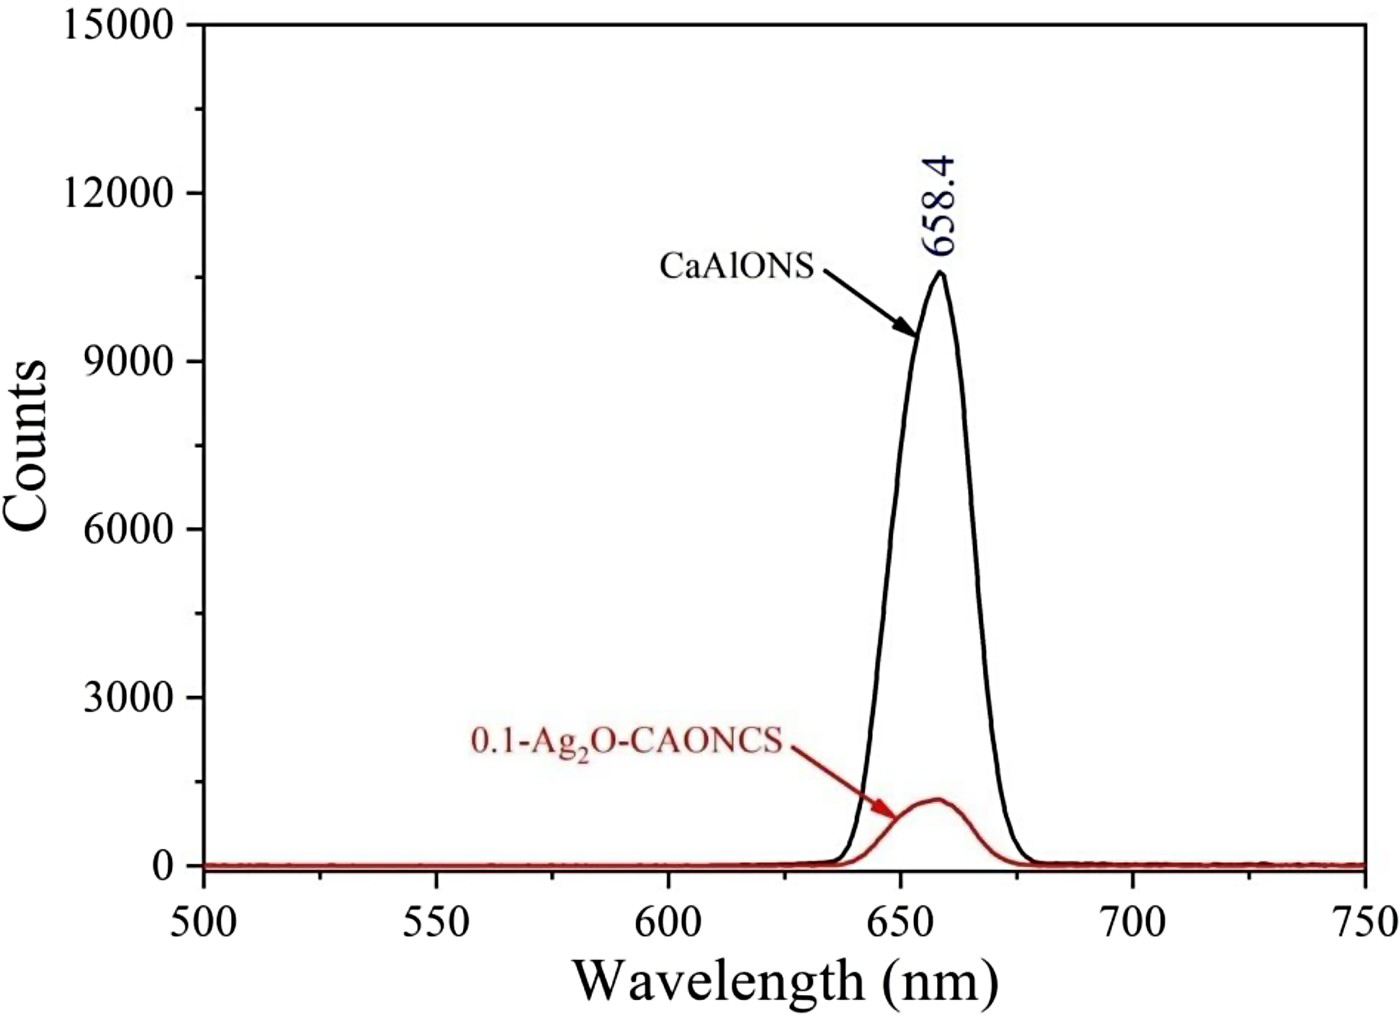
Photocatalytic activity of the Ag2O-CAONCS
CV was chosen as model pollutant for analysing catalytic activity of the Ag2O-CAONCS under sunlight irradiation compared with the CaAlONS. About 20 mg photocatalysts and 20 mL 10 mgL–1 CV solution were used for photocatalytic degradation experiments. Figure 7(a) shows the photocatalytic activities of the CaAlONS and Ag2O-CAONCS under sunlight irradiation. Using the CaAlONS as the photocatalysts, the CV degradation ratio is only 1.6% under sunlight irradiation for 40 min because CaAlONS can only absorb UV light. In the presence of 0.05-Ag2O-CAONCS and 0.1-Ag2O-CAONCS, 58.1% and 67.4% of CV degradation were achieved under sunlight irradiation for 10 min, respectively. With increasing sunlight irradiation time to 20 and 30 min, 20 mL CV dye (10 mgL–1) is totally degraded with 20 mg 0.1-Ag2O-CAONCS and 0.05-Ag2O-CAONCS, respectively. Ag2O-CAONCS shows greatly enhanced catalytic activity for the CV removal under sunlight illumination than the CaAlONS because of the decreased carrier recombination efficiency and lower band gap. Therefore, 0.1-Ag2O-CAONCS possesses the best photocatalytic activity in the samples.
(a) Relationship between C/C0 and sunlight irradiation time using Ag2O-CAONCS; (b) the corresponding first-order kinetic curve for CV degradation using Ag2O-CAONCS. CV concentration, 10 mg·L–1; Ag2O-CAONCS content, 1.0 mg/mL CV dye.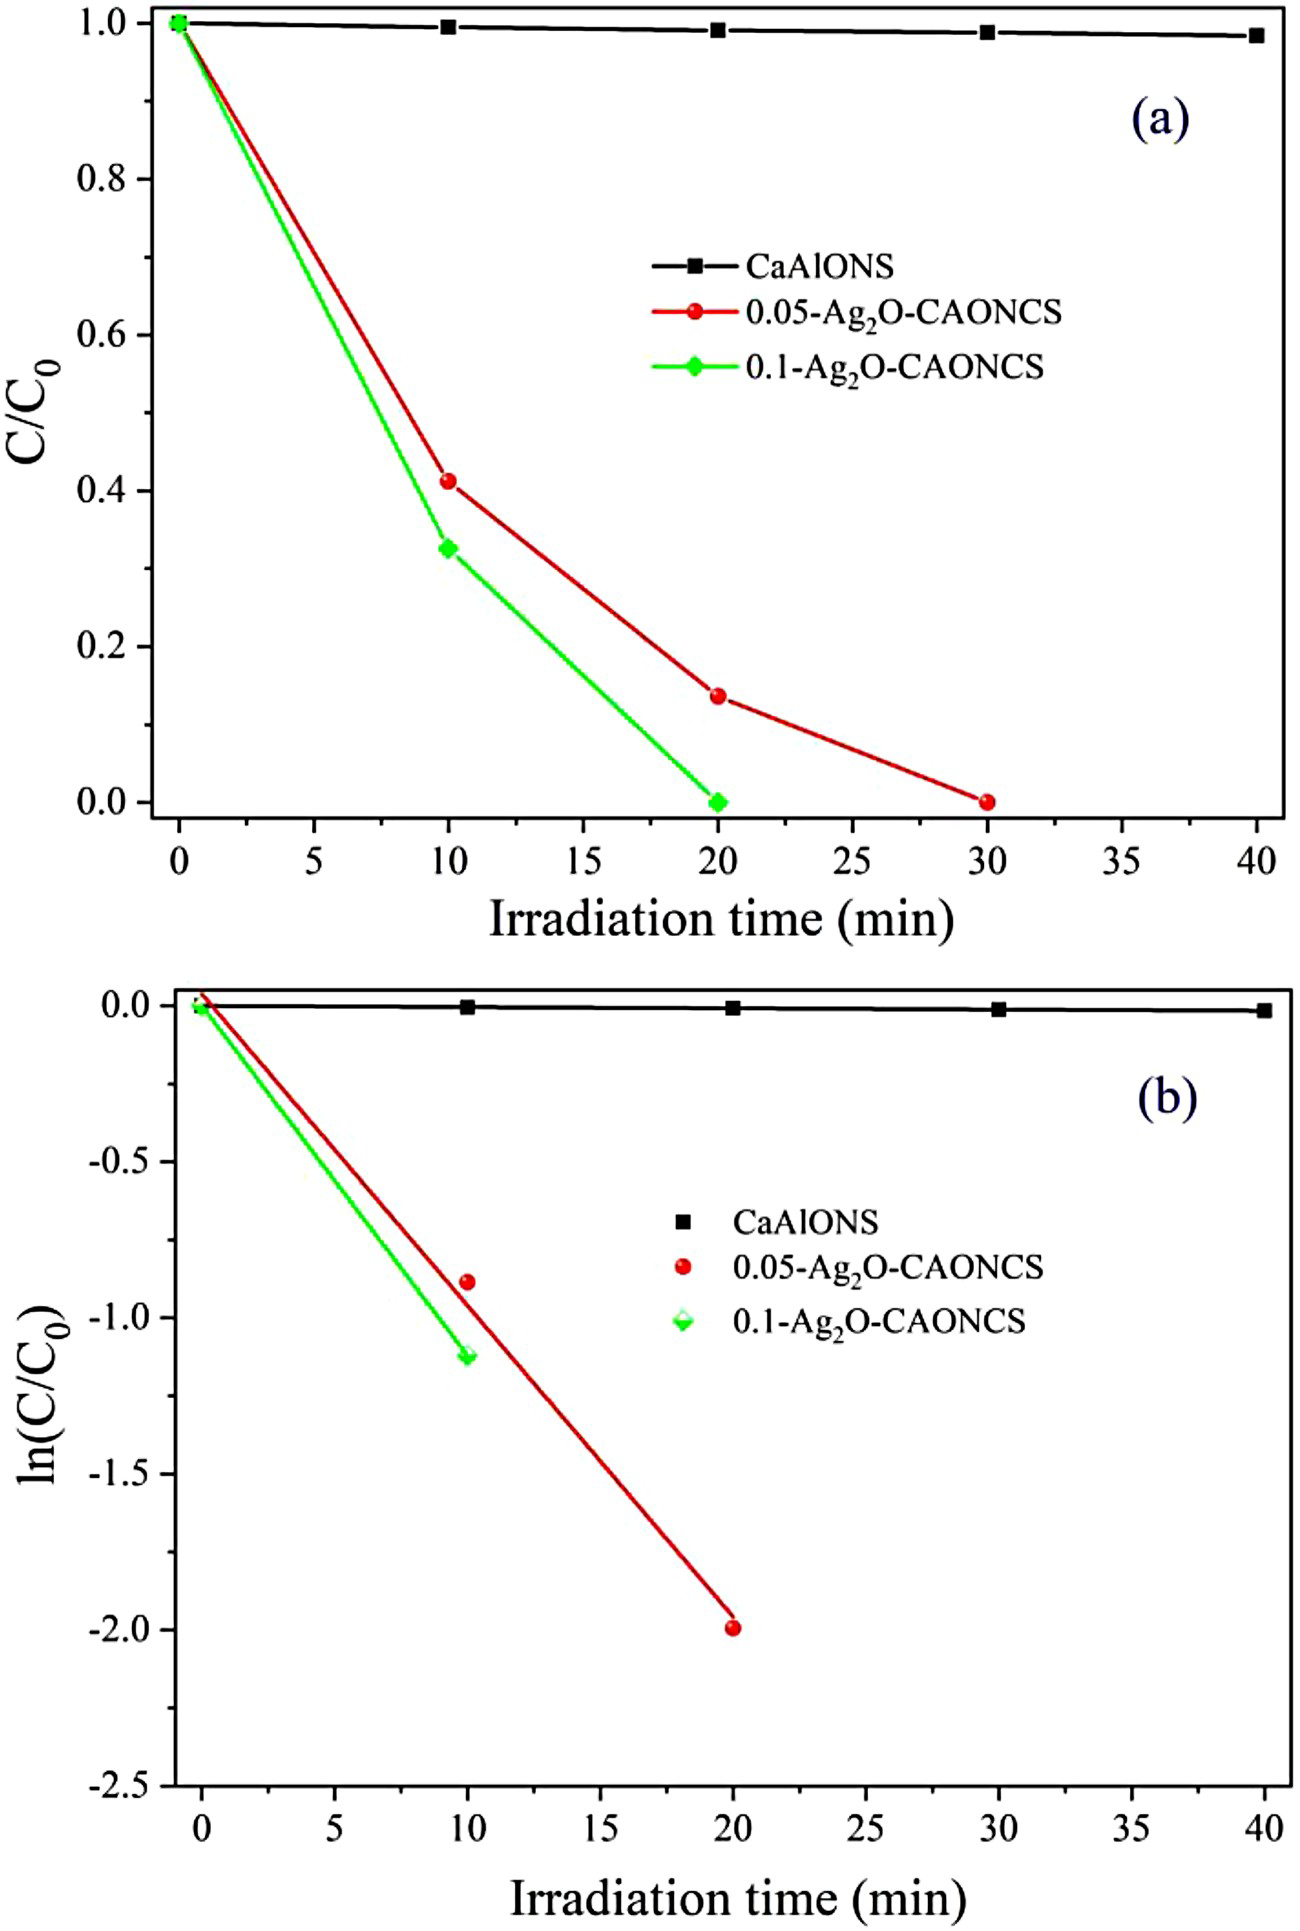
Kinetic analysis for CV degradation can be conducted through the fitting of the experimental data using the first-order kinetic formula as the following: –ln(C/C0) = kt [36], where k is the apparent first-order reaction rate constant. Figure 7(b) shows the first-order kinetic data for CV degradation with Ag2O-CAONCS. The linear relationship between –ln(C/C0) and irradiation time t indicates that CV degradation follows the pseudo-first-order kinetics. CV reaction rate constant (k) with CaAlONS, 0.05-Ag2O-CAONCS and 0.1-Ag2O-CAONCS is estimated to be 0.0004, 0.0847 and 0.1121 min–1 with the correlation coefficient of 0.997, 0.996 and 1, respectively. The reaction rate constant of 0.1-Ag2O-CAONCS is 249.25 times higher than that of the CaAlONS, 1.32 times higher than that of 0.05-Ag2O-CAONCS. The experimental results demonstrate that Ag2O-CAONCS shows greatly enhanced catalytic activity to CV than the CaAlONS under sunlight irradiation. The improved catalytic activity for CV degradation is contributed to the synergistic effect of Ca5Al6O14 and Ag2O in the nanocomposites. The increased visible-light absorption, reduced recombination efficiency of electronhole pairs have been further confirmed by the solid diffuse reflectance and PL spectra.
Raman spectra of 0.1-Ag2O-CAONCS irradiated by sunlight for different times in 10 mg·L–1 CV solution were further analysed for the CV degradation (Figure 8). Observed from the Raman spectrum of fresh 0.1-Ag2O-CAONCS, a Raman peak is located at 1573.1 cm–1. After the CV solution with 0.1-Ag2O-CAONCS was irradiated under sunlight for 7 min, the Raman peak of 0.1-Ag2O-CAONCS shifted to 1590.9 cm–1. Some Raman peaks located at 1445.1, 1387.7, 1179.7 and 1140.1 cm–1 are observed which corresponds to ring C–C stretching, N-phenyl stretching, ring C–H bend (II) and ring C–H bend (II), respectively [37,38]. With increasing sunlight irradiation time to 14 min, the intensity of Raman peaks at 1440.4, 1175.1 and 1135.3 cm–1 sharply decreases showing the catalytic degradation of CV molecules. After 20 min sunlight irradiation, the Raman spectrum of 0.1-Ag2O-CAONCS is similar to that of fresh sample further demonstrating that CV solution can be entirely degraded by 0.1-Ag2O-CAONCS with sunlight irradiation for 20 min.
Raman spectra of 0.1-Ag2O-CAONCS irradiated by sunlight for different times in 10 mg·L–1 CV solution: (a) 0.1-Ag2O-CAONCS, (b) 7 min, (c) 14 min, (d) 20 min. CV concentration, 10 mg·L–1; Ag2O-CAONCS content, 1.0 mg/mL CV dye.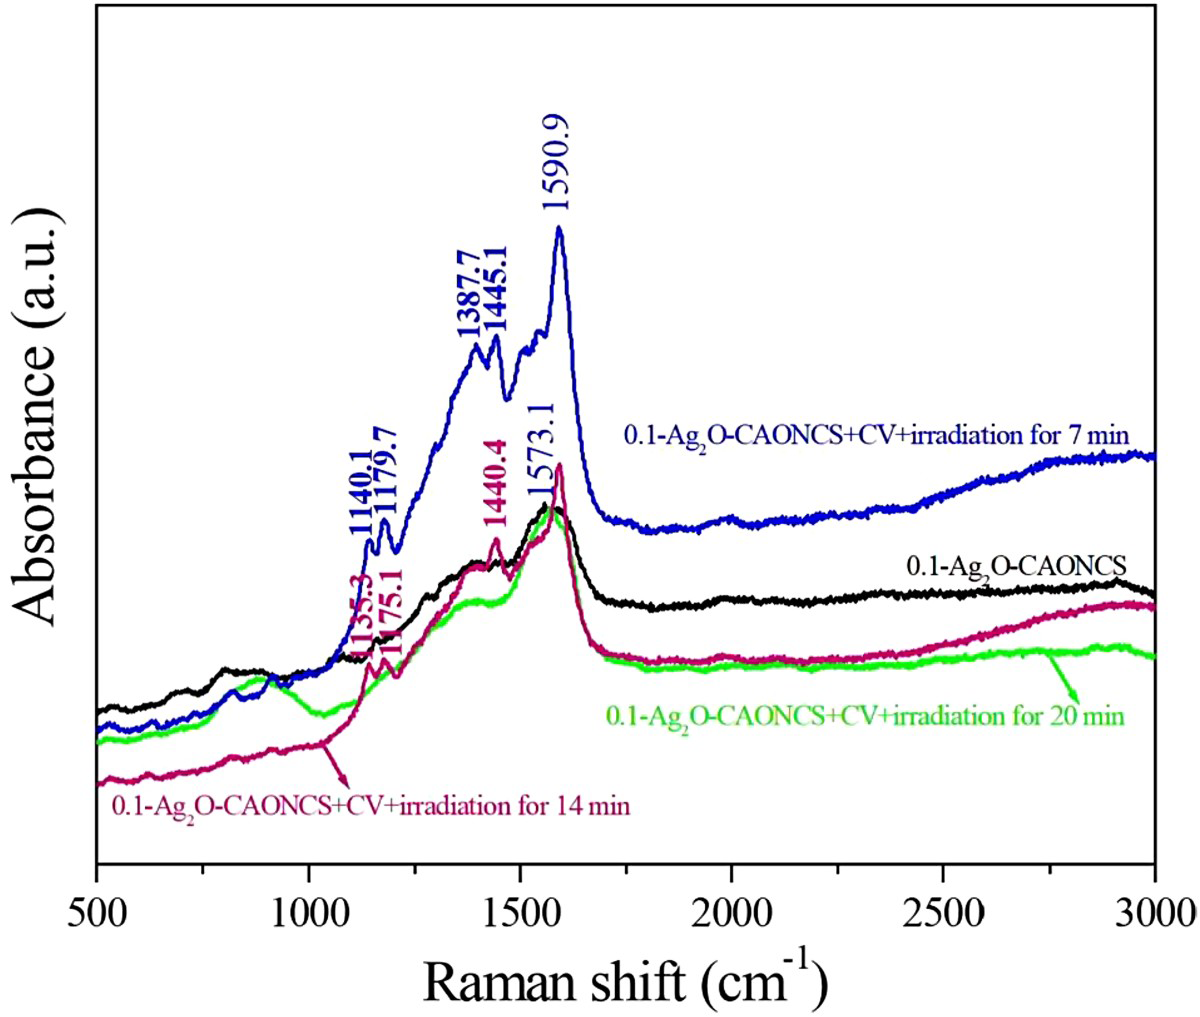
Metallic cations usually exist in wastewater, and it is important to analyse the role of metallic cations on the catalytic activity of Ag2O-CAONCS for CV degradation under sunlight. CV degradation efficiency using 0.1-Ag2O-CAONCS decreases to 78.6%, 82.4% and 75.3% when Mn2+, Cu2+ and Zn2+ are introduced into CV solution, respectively (supplementary Figure S4). It is obvious that these metallic ions inhibit CV catalytic degradation which is caused by the adsorption of metallic cations on Ag2O-CAONCS decreasing reaction active sites [39,40].
To analyse the stability of visible-light catalytic property, the as-synthesised 0.1-Ag2O-CAONCS was used to degrade CV dye in five repeated cycles. The corresponding photocatalytic results are shown in supplementary Figure S5. It is noted that the photocatalytic performance of the Ag2O-CAONCS shows effective photocatalytic stability under sunlight irradiation. The CV degradation efficiency reduces only by 6% after five cycles indicating good stability of Ag2O-CAONCS photocatalyst.
Photocatalytic mechanism of the Ag2O-CAONCS
The interfacial charge transfer ability of the CaAlONS and 0.1-Ag2O-CAONCS was analysed using EIS (Figure 9). Nyquist plots of EIS show an arc part of the semi-circle and a linear part. The radius of the semi-circular arc part of 0.1-Ag2O-CAONCS is far smaller than that of the CaAlONS and 0.05-Ag2O-CAONCS showing a lower interfacial charge transfer resistance [41]. Using Zview3.0 software, the interfacial charge transfer resistance was calculated by fitting the EIS data via an equivalent circuit (inset in the upper-left part of Figure 9). The interfacial charge transfer resistance is 794.4, 279.3 and 102.9 Ω for CaAlONS, 0.05-Ag2O-CAONCS and 0.1-Ag2O-CAONCS, respectively; 0.1-Ag2O-CAONCS possesses the lowest interfacial charge transfer resistance showing the fastest charge transfer ability, lowest recombination of electron–hole pairs and excellent photo-electrochemical reaction kinetics [42,43]. The higher charge transfer ability of Ag2O-CAONCS also suggests better CV catalytic performance under sunlight than the CaAlONS.
Experimental and fitting data of EIS of the CaAlONS and Ag2O-CAONCS, the inset in the upper-left part is electrical equivalent circuit.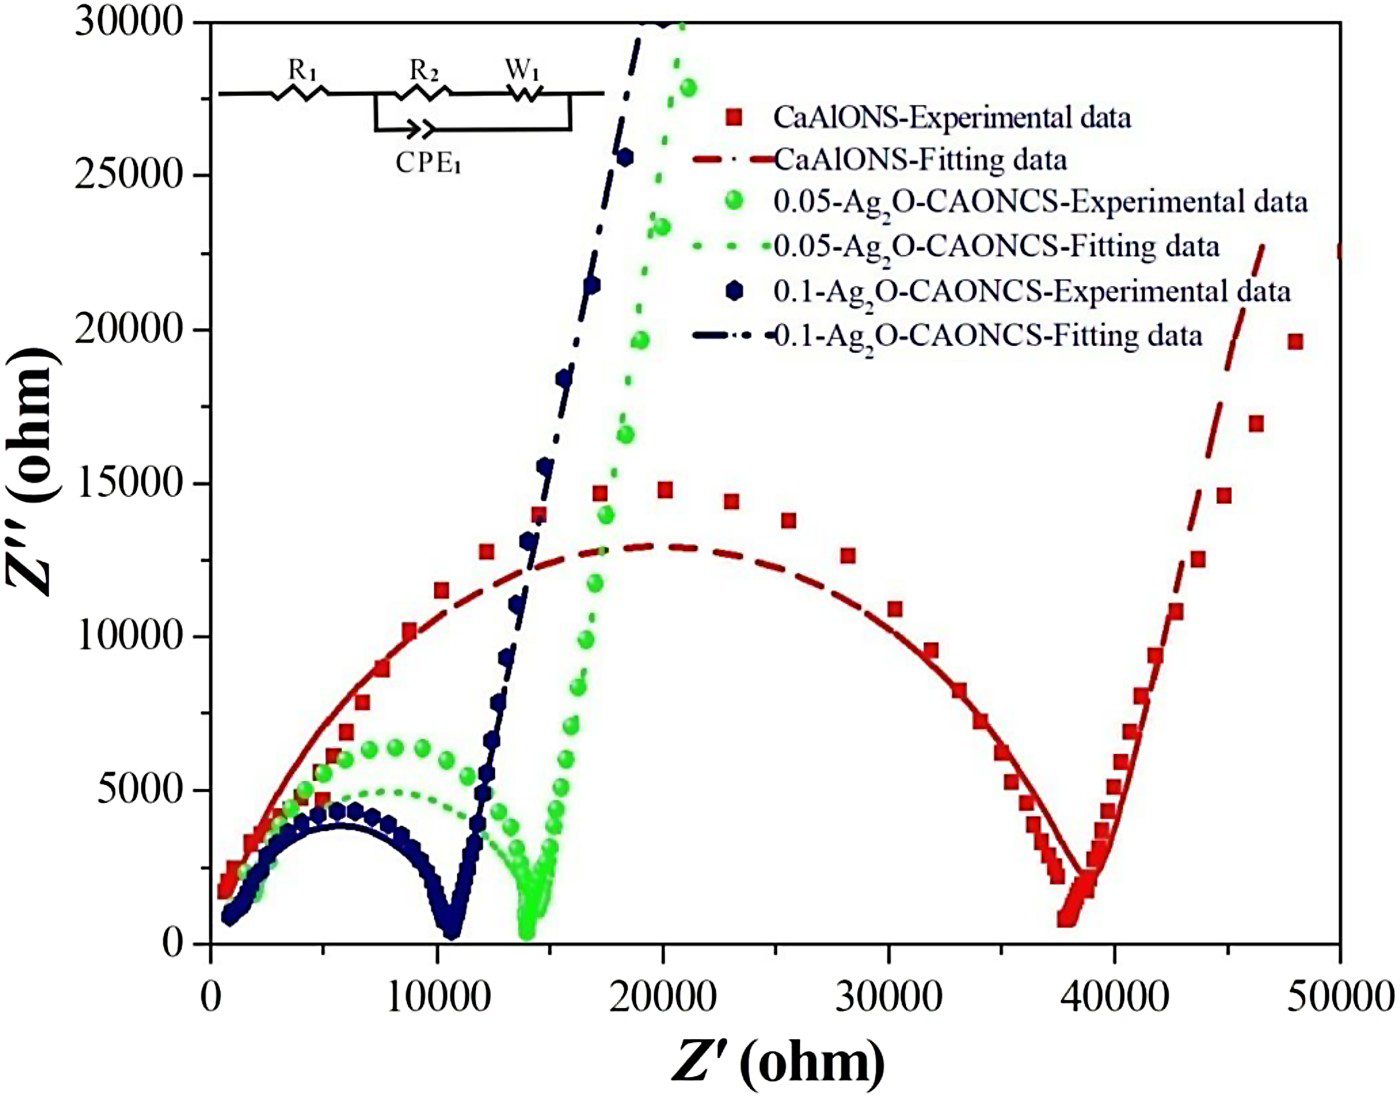
During the catalytic degradation of the organic pollutants, reaction active substances including •OH, •O2− and h+ play essential roles in the photocatalytic reaction [44–46]. For this reason, the reaction active substances trapping experiments were carried out using 0.1-Ag2O-CAONCS to identify the effect of the reaction active substances. The reaction active trapping agents including ascorbic acid (AA), disodium ethylenediaminetetraacetate (EDTA) and methanol were utilised to scavenge •O2−, h+ and •OH radicals. As seen in Figure 10, methanol has no effect on the photocatalytic degradation efficiency compared with 0.1-Ag2O-CAONCS without scavengers under sunlight irradiation. Although •OH radical belongs to a crucial reaction active substance formed during the photocatalytic reaction, it doesn't act as the reaction active substance for CV degradation. However, in the presence of AA and EDTA, the CV photocatalytic degradation efficiency decreases to 21.3% and 9.5%, respectively, showing the inhibition role of the photocatalytic activity. The results indicate that •O2− and h+ are the main reaction species in the CV degradation process compared with •OH in the presence of Ag2O-CAONCS catalyst under sunlight irradiation.
CV Degradation ratio using 0.1-Ag2O-CAONCS in the CV solution with different scavengers.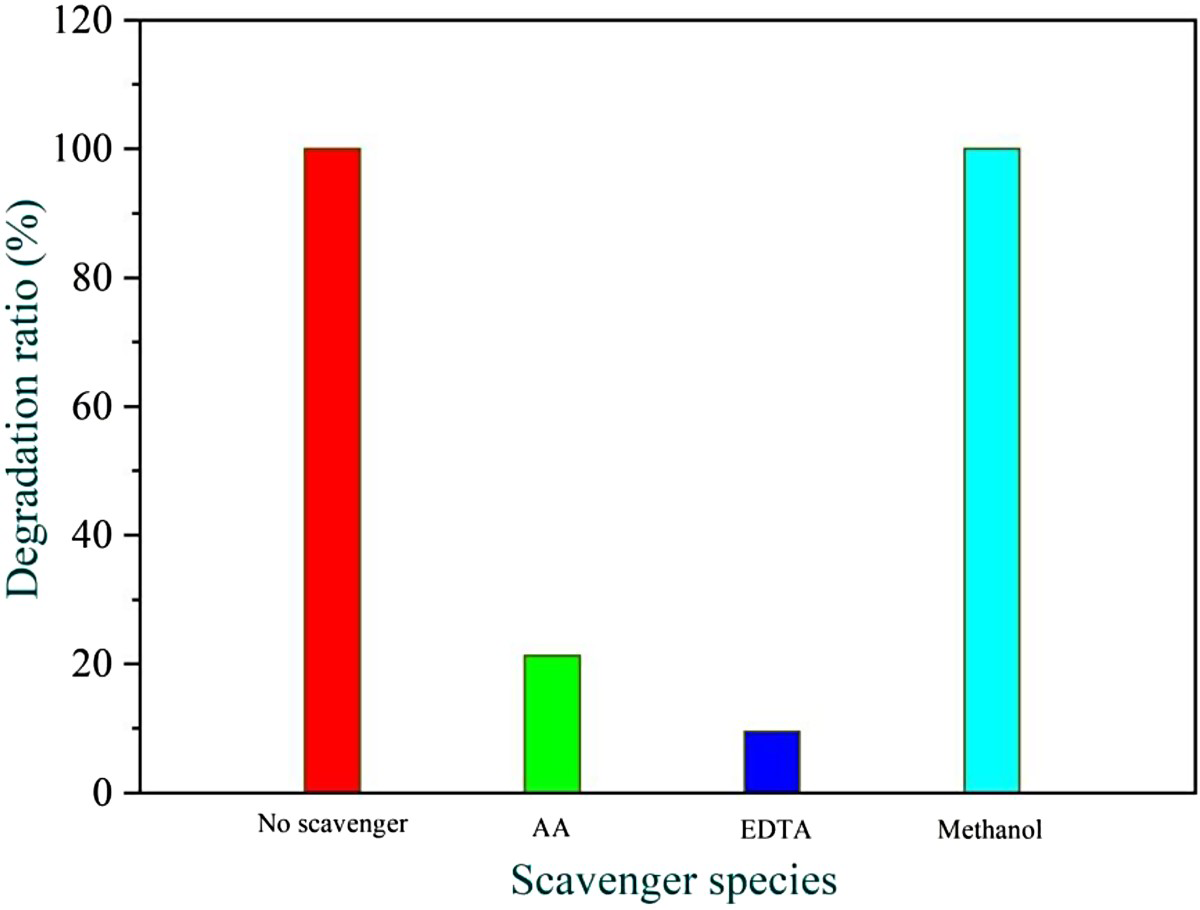
Based on the above analysis, possible photocatalytic mechanism of the as-synthesised Ag2O-CAONCS under sunlight irradiation has been proposed and illustrated in Figure 10. The mechanism is that the Ag2O-CAONCS photocatalyst is believed to exhibit a synergetic role between the Ca5Al6O14 and Ag2O. The valence band (VB) of the CaAlONS with Ca5Al6O14 phase was measured and calculated by the VB XPS spectrum (inset in Figure 11). The conduction band (CB) of the Ca5Al6O14 is –3.04 eV and VB is 0.85 eV (vs. Normal Hydrogen Electrode (NHE)). The CB and VB of Ag2O are 0.19 and 1.39 eV (vs. NHE), respectively, with a band gap of 1.2 eV [47,48]. CB of Ag2O is far smaller than that of the Ca5Al6O14. Such energy levels are beneficial for the photo-induced electrons to transfer from the Ca5Al6O14 CB to Ag2O CB which will effectively inhibit the recombination of the carriers in the electron transfer process [42,49,50]. When the Ca5Al6O14 is connected with the Ag2O, the heterojunction structure is formed at the interface. Ca5Al6O14 has positive charges in the depletion region, and Ag2O has negative charges leading to the formation of the electric field at the heterojunction. During the photocatalytic reaction, photo-generated electrons will transfer to CB of Ca5Al6O14 and holes will move to VB of the Ag2O. Ca5Al6O14 and Ag2O nanocomposites can be excited to produce electrons and holes under sunlight irradiation. The photo-generated electrons reduce the O2 species adsorbed on the surface of Ag2O-CAONCS to form •O2− radicals (O2 + e− → •O2−) [51,52]. Ag2O in the nanocomposites can also attract electrons to inhibit the recombination of charge carriers. More h+ in the nanocomposites will oxidise CV dye [53–55]. Therefore, carrier separation and generation of more •O2− radicals enhance the catalytic activity of Ag2O-CAONCS under visible light.
CV Photocatalytic degradation schematics using Ag2O-CAONCS. The inset is the VB spectrum of the CaAlONS.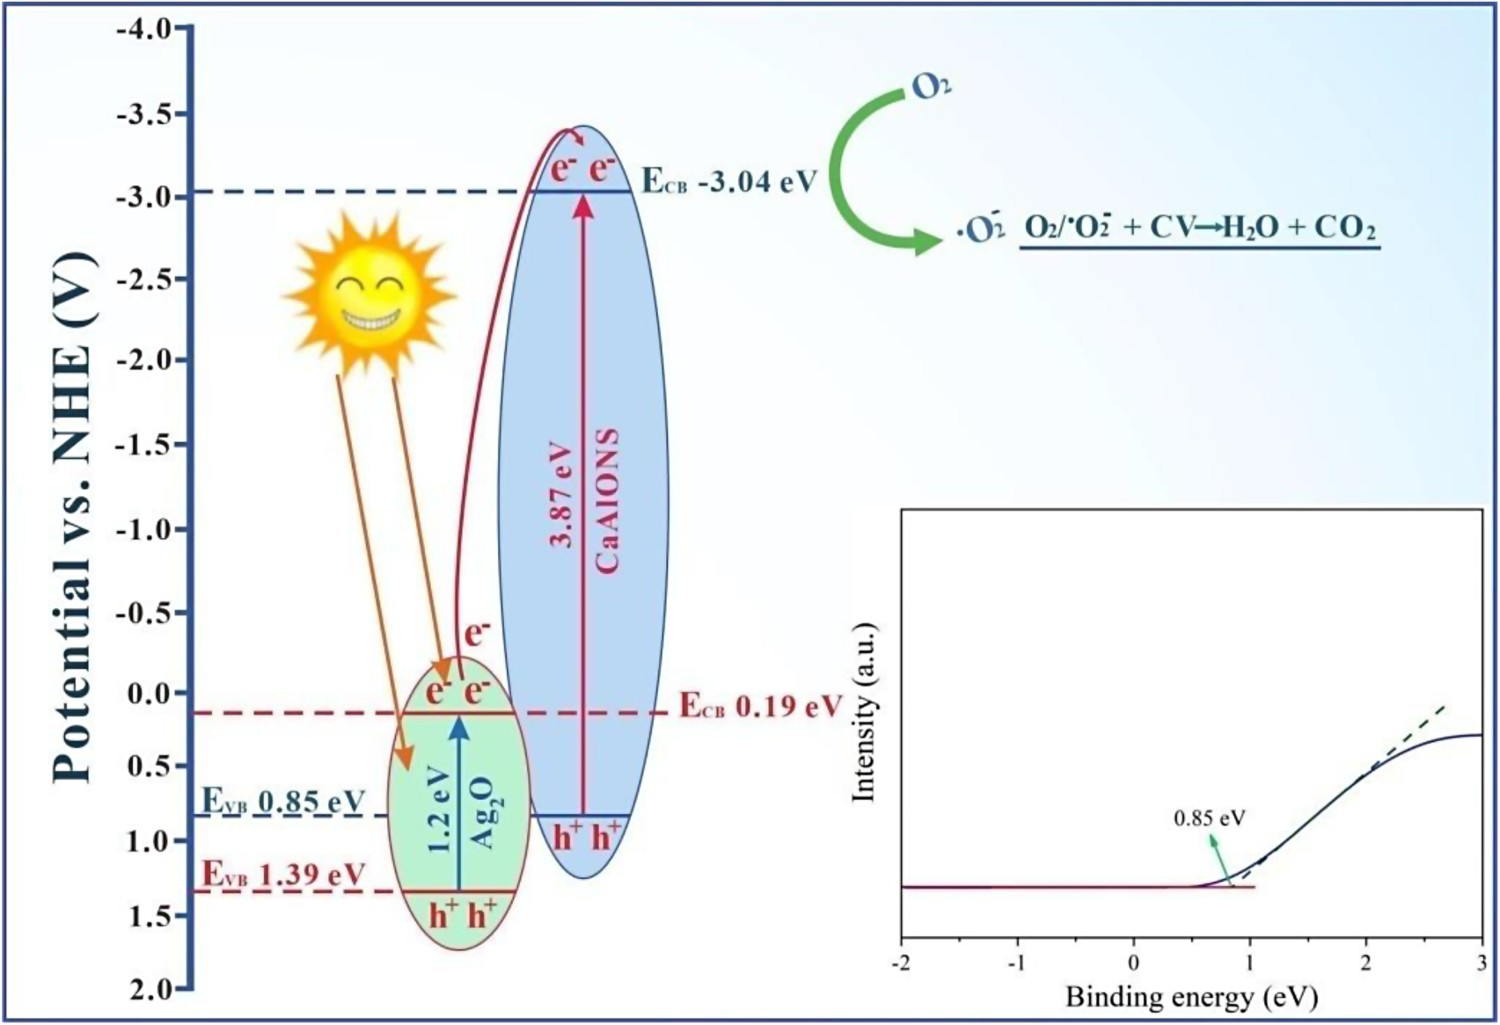
Conclusion
In summary, Ag2O-CAONCS photocatalysts with orthorhombic Ca5Al6O14 and cubic Ag2O phases were obtained via a facile photo-deposition process using Ca aluminate nanoflakes and Ag acetate. Ag2O-CAONCS are composed of nanoflakes with well-distributed nanoscale particles. Ag2O plays a significant role in the optical absorption performance of the Ag2O-CAONCS, enhancing visible-light absorption ability and decreasing the band gap to 1.31 eV (0.1-Ag2O-CAONCS). PL analysis shows that Ag2O-CAONCS exhibit fast charge transfer and decreased recombination of charge carriers; 20 mL CV dye (10 mgL–1) is totally degraded using 20 mg 0.1-Ag2O-CAONCS under sunlight irradiation for 20 min. •O2− and h+ are the main reaction species for CV degradation. Ag2O-CAONCS shows enhanced photocatalytic activity towards CV under sunlight irradiation due to band gap reduction, enhancement in visible-light absorption and inhibition role of the recombination of charge carriers by Ag2O.
Footnotes
Acknowledgment
This work was supported by the Natural Science Foundation of Anhui Province of P. R. China (2008085ME172), the National Scholarship Fund of China Scholarship Council (CSC) (202008340046) and the Student Innovation and Entrepreneurship Training Program of Anhui Province of P. R. China (S202210360153).
Disclosure statement
No potential conflict of interest was reported by the authors.