
Abstract
We present an advanced image analysis study of the 3D surfaces of silver/diamond-like carbon nanocomposite films prepared by radio-frequency plasma-enhanced chemical vapour deposition. Atomic force microscopy data were analysed, with the goal to provide image analysis tools allowing for a better understanding of the structure–property correlation, with specific case for the present material. While the samples' fractal dimension decreased and the roughness increased with increasing deposition time, fractal succolarity showed no significant difference and relatively high values, describing high percolation, and fractal lacunarity decreased, in agreement with topographic entropy, which revealed uniformity in height distribution. In conclusion, the samples' microtexture shows a nearly uniform surface with a homogenous distribution of nanoparticles, due to the fabrication process and the emerging fractal nature of the nanocomposite, at all the considered deposition times. Fractal lacunarity and succolarity, currently not provided by commercial image analysis programmes, can be useful in advanced surface image characterization.
Keywords
Introduction
In recent years, silver/diamond-like carbon (Ag/DLC) nanocomposite thin films have attracted much attention because of their special properties that make them promising for various applications. For example, Carvalho et al. [1] manufactured Ag/a:C coating by plasma gas condensation on ureteral stents with good adhesion to the substrate. The coated layer had an optimal size of silver nanoparticles and was compatible with the wet environment. Ionita et al. [2] studied the performance of Ag/DLC compound films coating on the CoCrNbMoZr alloy related to corrosion performance, also pointing out its hydrophilic and antibacterial nature. The variation in the friction coefficient with Ag content for Ag/DLC thin films fabricated by radio-frequency (RF) magnetron sputtering was studied by Goto [3]. Alam et al. [4] investigated the optical properties of Ag/DLC films on the poly-dimethyl siloxane substrate prepared by RF reactive sputtering. They showed that an increase of Ag content causes a decrease of transparency and optical bandgap and an increase of the Urbach parameter. Also, Alam et al. [5] fabricated a-Ag: DLC by direct current plasma-enhanced chemical vapour deposition (PECVD) and showed favourable electron field emission properties with increases of the Ag content. Písarík et al. [6] indicated antibacterial properties of Ag/DLC coating produced by dual pulsed laser deposition against Staphylococcus aureus and Pseudomonas aeruginosa. They examined surface energy, wettability and protein adsorption, and showed the application of the material in sensors. Bociaga et al. [7] used hybrid RF/magnetron sputtering plasma-assisted CVD for the deposition of a-C:H/Ti + Ag coatings and examined the chemical, physical and biological properties of their samples to check their antimicrobial effectiveness and biocompatibility. Abdolghaderi et al. [8] fabricated Ag/DLC nanocomposite thin film by RF-sputtering deposition to study the electrical properties and the percolation threshold of those layers at different applied voltages.
In all cases, the 3D surface micromorphology of thin films is a key factor in their application. In many studies, the surface microtexture was characterized by using stereometric analyses with a minimal set of surface parameters (see, e.g. [9-13]). Additionally, the 3D properties can be evaluated using fractal [14-17] and multifractal [18-20] methods, as well as by power spectral density functions [16,21]. On samples such as those presented here, Ţălu et al. [22] have already performed height distribution and basic fractal analysis. In this work, additional quantities are extracted from the sample atomic force microscopy (AFM) images to provide a deeper and complementary characterization of the 3D surface microtexture of the Ag/DLC nanocomposite thin films prepared by RF-PECVD.
Experimental
Samples' fabrication
The substrates were ∼1 × 1 cm2 pieces cut-off silicon wafer, used as received. On these substrates, co-deposition by sputtering and RF-PECVD was carried out, to prepare Ag/DLC layers, in a vacuum chamber connected to rotary and diffusion pumps. The substrate holder worked as a lower electrode, and was placed at ∼4 cm distance from the pure silver target, working as the upper electrode, and coupled to the RF power generator. Acetylene gas entered the chamber to form a plasma environment. The deposition parameters of chamber base pressure, bias voltage and RF power were set to 4 Pa, 80 V and 60 W, respectively. The operating frequency was 13.56 MHz, and the silver target was a disc of 5 cm diameter. Three samples were fabricated for the investigation of their resulting morphology, with different deposition time of 10, 25 and 40 min, labelled as samples #1, #2 and #3, respectively. These deposition times were selected according to the previously identified critical steps for sample growth, resulting in different percolation levels, as characterized electrically, and different resulting plasmonic properties of the Ag (see Abdolghaderi et al. [8] for details).
Atomic force microscopy imaging
The 3D surface of the samples was measured by an AFM instrument Solver P47H-PRO (NT-MDT, Russia). The AFM was operated in a contact mode, using single crystal silicon probes VIT_P_C-A. (TipsNano, Estonia). The cantilever had Al reflective coating, and nominal spring constant and maximum tip apex diameter of 3 N/m and 20 nm, respectively. The images were 512 × 512 pixels, and the scan line frequency was 1 Hz. For each sample, four images in different regions were acquired and analysed, to extract for each quantitative value, the mean and the standard deviation assigned to the quantity as the uncertainty. The analysis of variance (ANOVA) was also carried out in the software OriginPro 2016 (OriginLab, MA, USA), and the pairs were compared with Tukey's post hoc test, with significance levels of 5% (p < 0.05, *) and 1% (p < 0.01, **).
Image analysis
Standard rendering and quantitative parameters
The qualitative analytical images of furrows and contour lines were rendered using the MountainsMap® Premium 7.4.8872 software. The standard quantitative statistical parameter of image amplitude Sq, describing the surface roughness in accordance with ISO 25178-2: 2012, was extracted from the AFM images with SPIP™ 6.7.4 software (Image Metrology A/S, Denmark). The same programme was used to calculate the fractal dimension Df, describing the image texture envelope with z-scale extension.
Advanced fractal analysis
The fractal succolarity Sf was measured using the algorithm developed by Pinto et al. in R language [23]. First, the height distribution mean is used as a cut-off threshold, setting all the values above or equal to it to 1 and the values below it to 0. Moving on from this binarized image, where 0 pixels are defined as ‘accessible to water’ and 1 pixels are ‘inaccessible to water’, to calculate the Sf, according to De Melo and Conci [24], the following steps are carried out:
Starting from either of the four edges of the binary image in the direction towards the opposite edge, four ‘flooding profiles’ are sketched, according to the rule that if a pixel is accessible to water, it means that water can reach this area and pass through. For each direction, the flooded areas are subdivided in boxes of equal sizes L(k), where k is an index ranging from 1 to n, and n is the number of possible divisions of an image in boxes, something similar to the box-counting method [25]. Next, the occupation percentage Po(L(k)) is calculated for each box, by dividing the number of occupied pixels in the box to the total number of its pixels. For each box of L size, Po(L(k)) is multiplied by the quantity Pr(L(k), pc), where pc is the (x, y) position of the box centroid. Pr represents the ‘pressure’ on the box in the given direction, which is actually described by the coordinate x or y (in pixel units) of the box centroid, depending on the direction of the considered pressure field. For clarifying examples, see [24]. A dimensionless value between 0 and 1 is finally calculated for the Sf by normalizing the above described quantity to the largest possible amount of flooded areas, same as if the initial pattern was all made of black pixels:
where dir is the water inlet direction.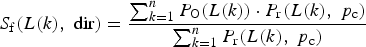
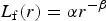
Lacunarity Lf has been so far calculated in different ways in the literature (see, e.g. [26]). We adopted the box-counting differential algorithm and adapted it for the programming language FORTRAN 77 [25]. The starting image was the same binary one as used for the Sf. Next, the following processing steps were applied:
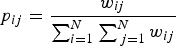
A box of size r × r was placed at the origin of the binary image N × N and the number s of access points for water inside the box was counted. The box was moved along the whole set of observations and its mass was calculated. This process was repeated for the whole set of observations, obtaining the frequency distribution n(s,r) of the mass of the box, and correspondingly, the probability distribution P(s,r) = n(s,r)/N(r), where N(r) = (M − r + 1)² is the total number of boxes of size r × r placed over the binary image; and M is the total number of pixels of the image. The lacunarity for the box of size r × r is then calculated by the following equation:
where


Topographic uniformity
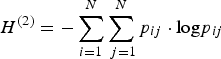
The topographical uniformity of the samples was determined by computation of the 2D surface entropy based on an algorithm programmed in R language, as proposed by Matos et al. [28]. Entropy is assumed to be a measure of the uniformity of the distribution of energy [29]. The process for calculating the surface entropy considers that the energy of a surface can be described by its matrix of heights, which is associated with the matrix of N × N pixels in the AFM topographical image of datapoints. Then, in the bidimensional space of the surface positions, the homogeneity of the pattern of heights in the sample is estimated by generalization to 2D of the Shannon entropy, described by Nosonovsky [29], which is carried out as follows:
 and
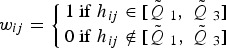
and
 are the lower and upper limits of the ranges of assumed ‘uniform’ height hij
, respectively, defined after the first and third quartile of the height distribution, respectively, i.e.
are the lower and upper limits of the ranges of assumed ‘uniform’ height hij
, respectively, defined after the first and third quartile of the height distribution, respectively, i.e.

Results
Thin film morphology
Figure 1 shows the surface microtexture of the nanocomposite thin film object of the present study, as resulting from the AFM images of one series out of the four carried out, assumed to be representative. The rendering is done in perspective view, with surface height in so-called false colours, where the height values are biunivocally mapped to single colours in a ‘spectrum’ palette. This sequence of colours is similar to the visible light wavelength, spanning from red to blue for very tall and very short features, respectively, with the uppermost values saturated to additional white ‘colour’.
3D AFM micrographs of the samples in one series representative of the four series acquired: (a) sample #1, (b) sample #2 and (c) sample #3.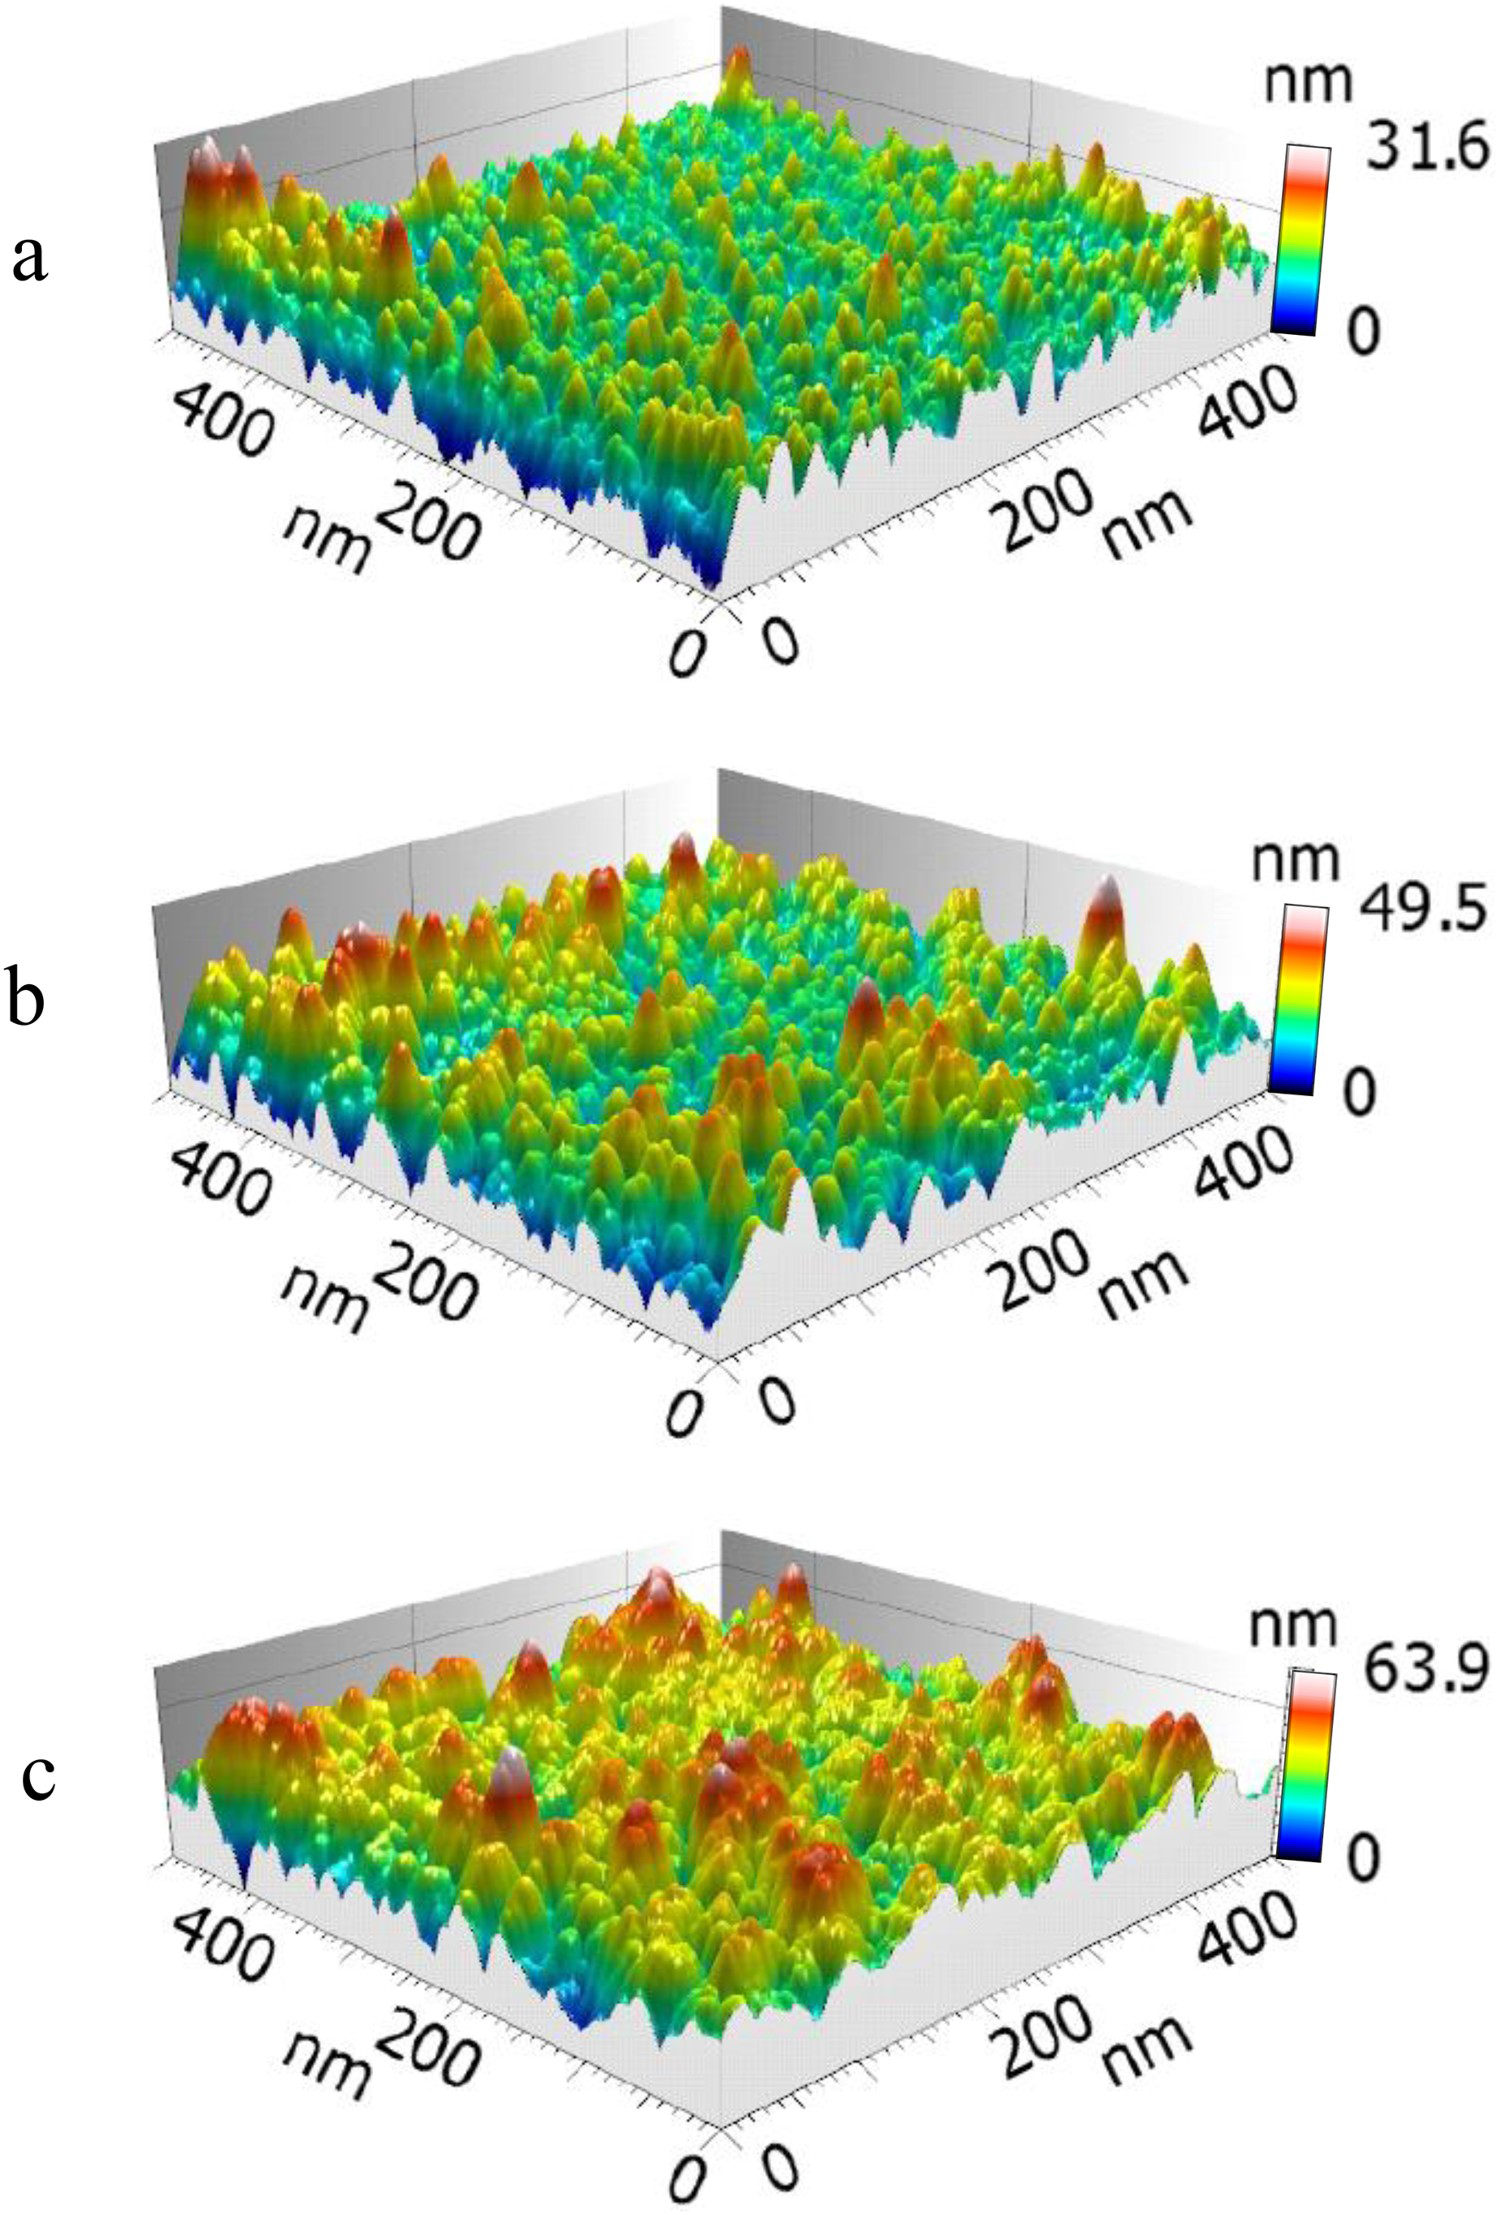
The goal of this study is to analyse the surface complexity of the samples. One means to stress the image texture is to represent the 3D surface by so-called photo simulations, as shown, for example, in Figure S1. These appear as the top-view images with grey levels corresponding to the shades of light and shadow appearing on the given surface features as the result of specific illumination directions. More advanced qualitative rendering exists, also aiming to stress the surface texture, which identifies either the peaks by height level contour lines (see Figure 2(a–c)) or the furrows that can be dig in the valleys around those peak (see Figures 2(d–f)). However, we are interested in numerical information emerging from the images.
Graphical representations of the furrows (a–c) and of the contour lines (d–f) of the same images of the series considered representative for the samples and shown in Figure 1: (a, d) sample #1, (b, e) sample #2 and (c, f) sample #3.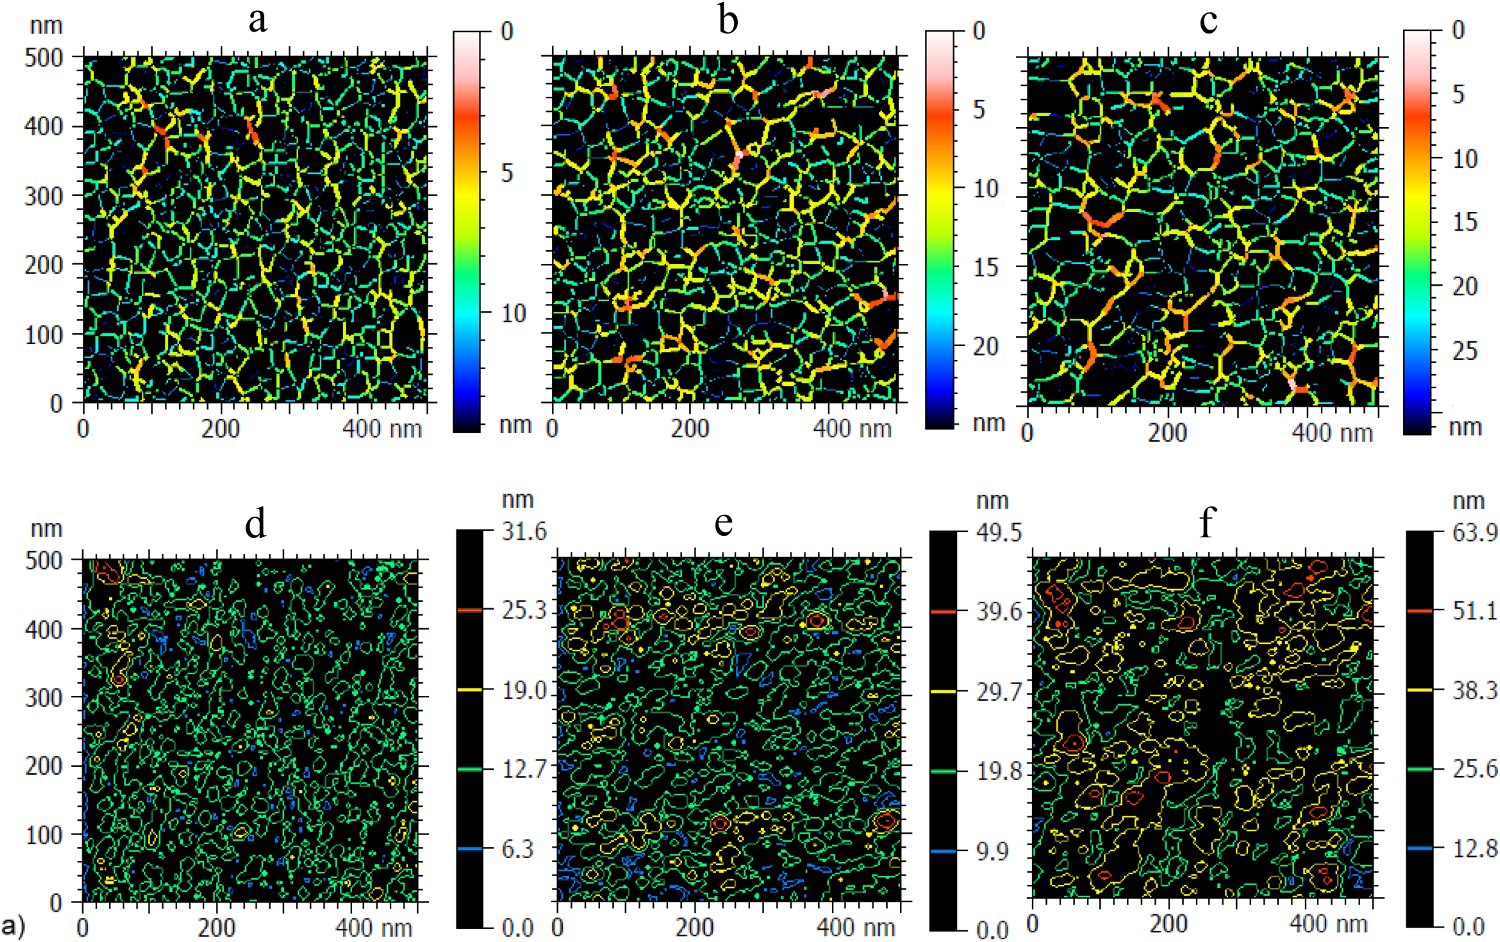
Quantitative evaluation of the surface complexity
Fractal dimension Df determined by the morphological envelopes method for analysed samples and surface roughness amplitude Sq (samples #2, #3: ** vs. sample #1; sample #3: * vs. sample #2).
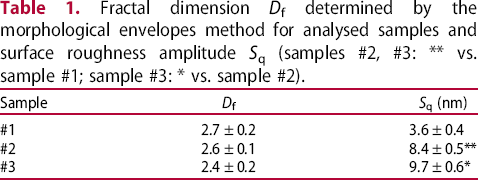
It appears from Table 1 that, on increasing the thin film deposition time from sample #1 to sample #3, the sample roughness increases, i.e. the features become vertically more pronounced – even if in sublinear fashion probably tending to saturation. All the differences are statistically significant (at least p < 0.05). On the other hand side, the fractal dimension appears to be slightly decreasing, yet without statistically significant difference, meaning that the pattern complexity of the texture is rather constant or even mitigated.
For the vertical amplitude of the features, an extension of the analysis done with Sq can be provided in the form of multiple slicing the height images at different – arbitrarily chosen – thresholds, such as those selected in the case of Figure S2. Correspondingly, the parameters of projected area, material or void volume and material thickness have been extracted and reported in Table S1, which is discussed in the Supporting Information. However, in the present work, we will not focus on this type of analysis. Rather, based on the raw data of height matrices from the AFM images, the additional fractal surface parameters Sf and β were computed. In particular, the fractal lacunarity was calculated for different sizes of boxes (from 1 to 256 pixels), and then, due to the small values obtained, it was necessary to displace 0.5 upward the graph of Lf(r), before linearizing and applying the regression to find the coefficient β. In Figure 3, the graphical representations of linear regression log[0.5 + Lf(r)] versus log(r) are shown, again, for the representative series of image data as shown in Figure 1.
Graphical representation of linear regression for the calculation of the lacunarity coefficient of samples: (a) sample #1, (b) sample #2 and (c) sample #3.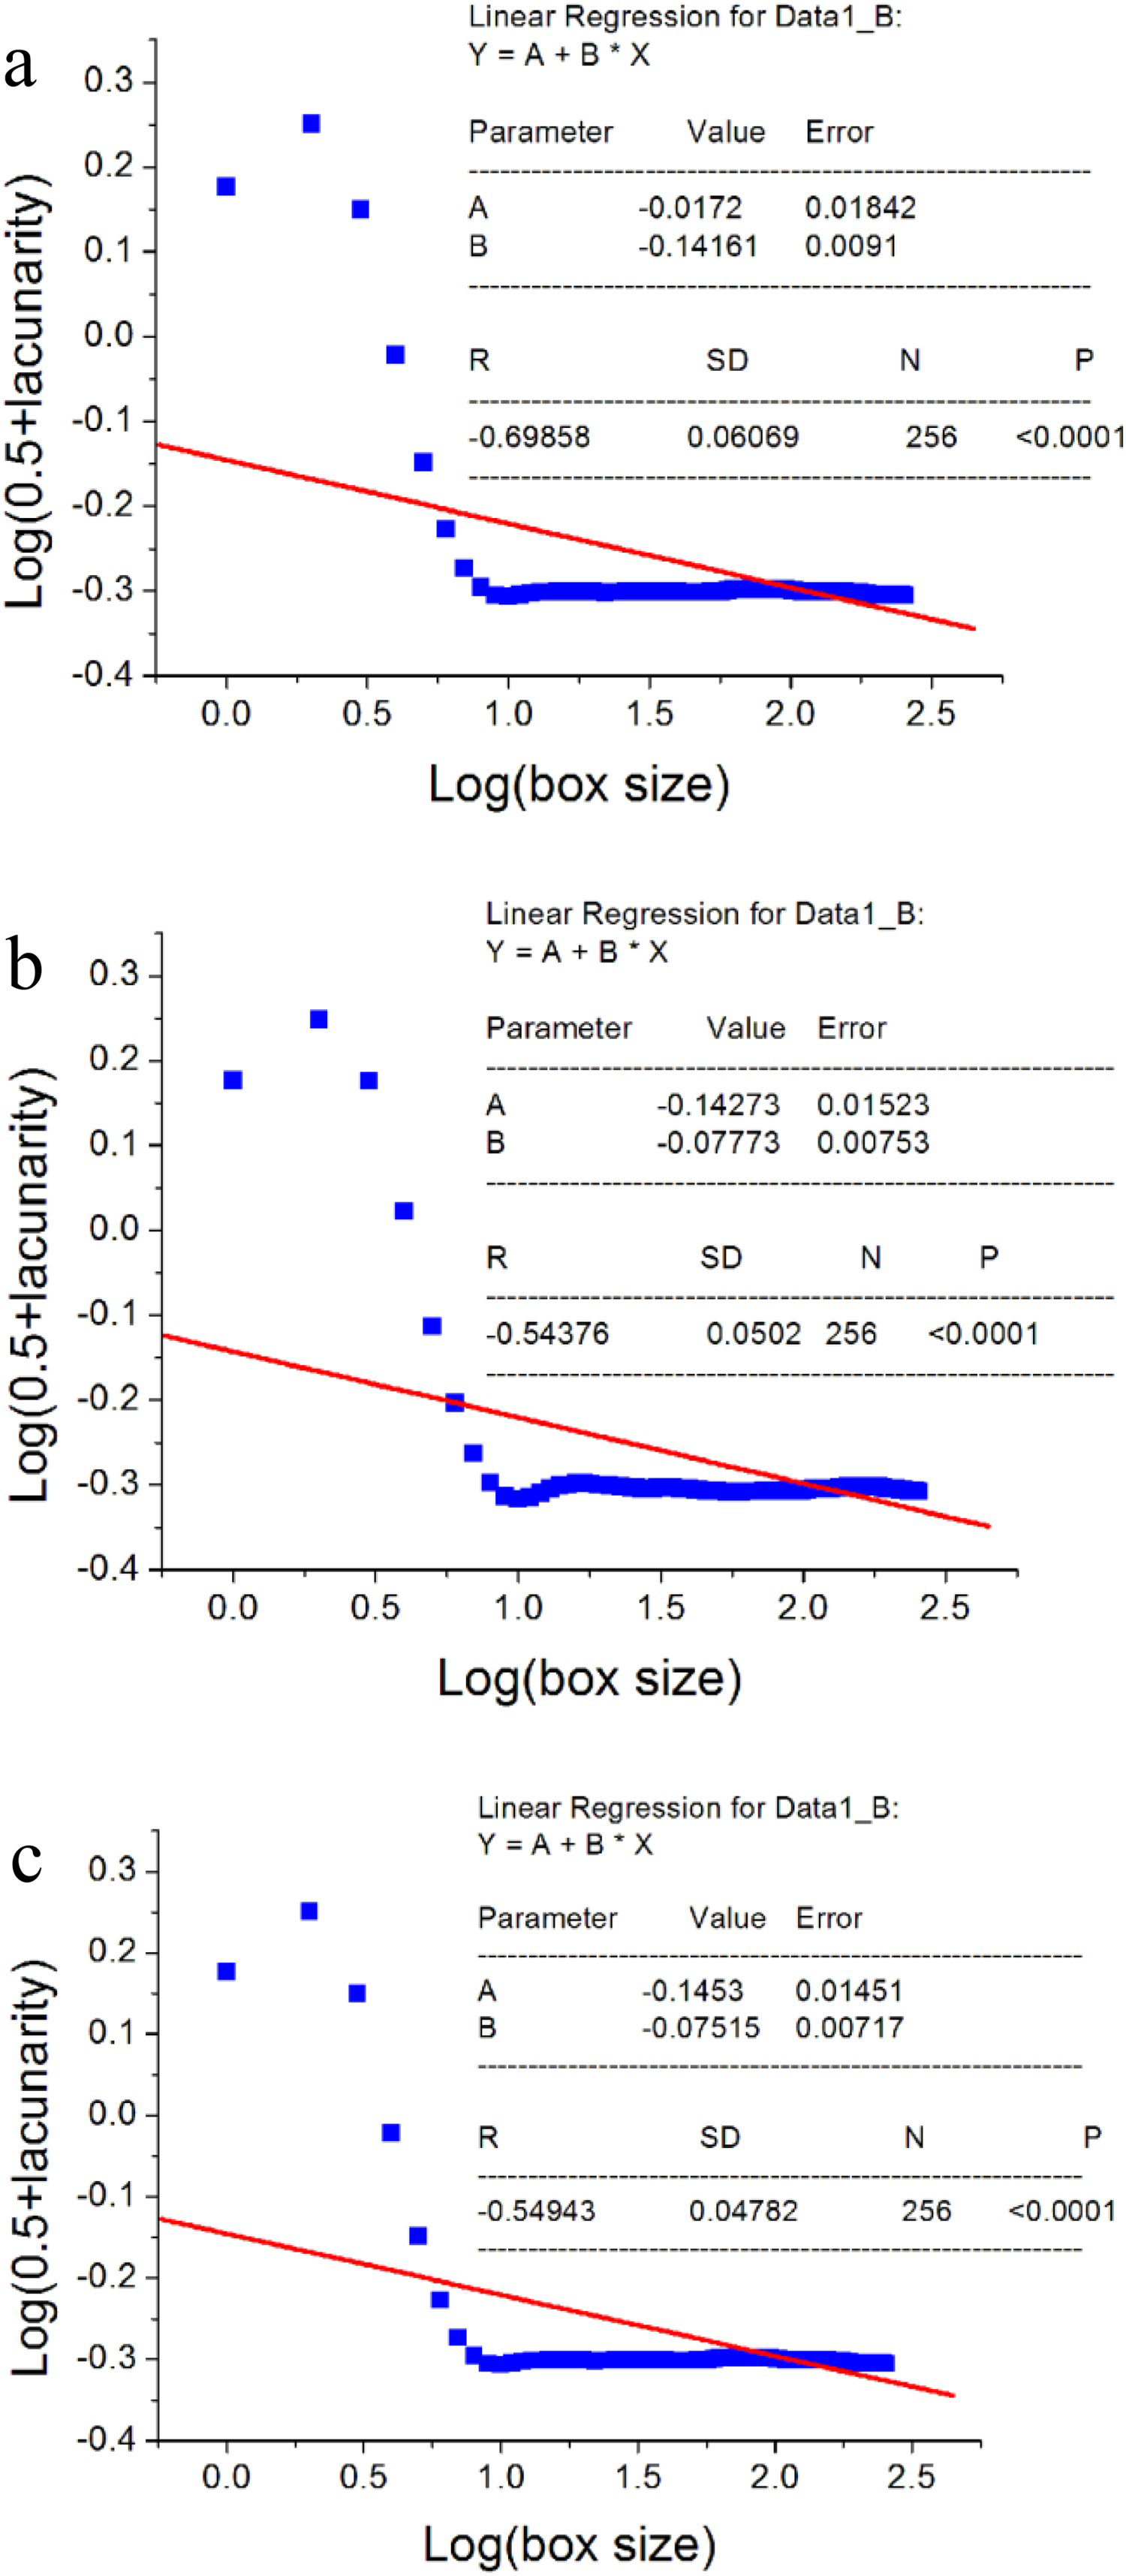
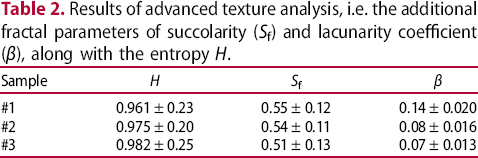
Results of advanced texture analysis, i.e. the additional fractal parameters of succolarity (Sf) and lacunarity coefficient (β), along with the entropy H.
Discussion
From standard image analysis data provided by the commercial software, we decided to consider the most common parameter of roughness Sq and the simple fractal dimension Df. To extend the texture analysis, we used instead dedicated homebuilt routines, which allowed to determine the additional fractal parameters of succolarity Sf and lacunarity, via the coefficient β, together with the surface entropy H.
Generally speaking, multifractal analysis is today applied in a wide range of fields, including some even apparently far from the original area of development, e.g. economics (see [31]). It should be stressed, however, that while fractal lacunarity has already proved useful in different applications of image analysis, e.g. for food quality control [32] or in hydrology [33], so far the applications of succolarity and entropy appear more sparse (see, e.g. [34] for the latter).
We remind that the Df quantifies the complexity of an object and provides one measure of the spatial texture [10]. On the other hand, the Sf can be interpreted as the degree of penetration of a potentially present – and pressing – surrounding fluid, inside the pattern of features, according to a given inlet direction [35], thus describing the so-called percolation. Furthermore, the fractal lacunarity, through its coefficient β, evaluates the size distribution of gaps on the surface of the fractal object, providing a quantitative measure of its heterogeneity; indeed, for a surface with a homogeneous distribution of gaps size, β has lower values [27,36]. In this respect, the best score for homogeneity of sample #3 is consistent with the observation of highest isotropy for the same sample [22]. However, the variation in entropy H is not much consistent throughout the three samples, and all values stay quite high. As a consequence, one can say that a rather homogenous distribution of nanoparticles on the surface was observed, which is probably associated with the fabrication process and the fractal nature of the resulting nanocomposite thin film.
Whereas the roughness Sq increased as a result of the film growth, the topographical entropy H was very close to 1 for all the samples, revealing no topographical discontinuity points, i.e. some uniformity in the distribution of heights of all the surfaces, which suggest that the processing time did not influence the distribution of heights. Indeed, the microtexture is not affected much, and few or no defects are expected, which usually determine the superficial tribological characteristics. This result is in agreement with [28], where this uniformity is attributed to the excellent coalescence of the samples. In addition, the degree of surface complexity was not altered significantly with the increase of deposition time, as the Df did not undergo major changes.
Regarding the connectivity and intercommunication between the surface areas, the samples showed similar percolation, since the values of Sf shown in Table 2 did not present significant difference. However, Sf above 0.5 indicates that there are more accessible than inaccessible sites for liquid penetration on film surface [37], which happens in higher relative intensity in sample #1. This is in agreement with the analyses of topographical uniformity, microroughness and fractal lacunarity, since this sample is less uniform when compared to the others.
The values of lacunarity coefficient β are small for all the samples, showing that in the three films there is homogeneity in the distribution of the gap sizes. Additionally, the fact that the lacunarity decreases with the processing time suggests that the distribution of voids is affected in the nanocomposites, with samples #2 and # 3 being those ones that have the best surface uniformity, which is in agreement with the data of surface entropy H. In fact, the lacunarity quantifies the deviation of translational invariance by describing the distribution of gaps within the image at multiple scales: the more lacunar an image, the more heterogeneous the spatial arrangement of gaps [38]. It should be noted that the lacunarity is related to the permeability of the film [39], since the size of the gaps directly influences the passage of liquids through the surface.
Conclusion
In this study, an advanced surface analysis of Ag/DLC nanocomposite films deposited by RF-PECVD was carried out based on AFM images and dedicated software routines. The complex fractal nature of the samples' nanoscale geometry, which had already been identified previously, has been investigated in deeper detail. Whereas the fractal dimension Df decreases slightly with the deposition time, and the roughness Sq increases, the Shannon entropy H and the lacunarity parameter β stay relatively constant, with a low degree of non-uniformity (with H very close to 1 for all samples). Therefore, the silver nanoparticles embedded in the DLC matrix cause a limited non-uniformity of the resulting surface in the tested composites, which exhibit a nearly homogenous distribution of nanoparticles. The samples showed also similar percolation, with homogeneity in the distribution of the gap size on the surfaces, and β small in all cases. The fact that the lacunarity decreases with the processing time is in agreement with the data of surface entropy.
The newly identified parameters describing the nanoscale topography (i.e. lacunarity and succolarity) could hopefully represent critical figures that will allow one to associate the structure of samples with their functionality. Confirmation of this point will only be possible over the time, when the present analytical toolbox will be systematically applied to a statistically large number of various similar samples, in the future.
Footnotes
Disclosure statement
No potential conflict of interest was reported by the authors.