
Abstract
In this study, thermal barrier coatings with different porosities were prepared using 8 wt-% yttria-stabilized zirconia by atmospheric plasma spray on a superalloy substrate. The porosity of the ceramic coating was increased by modulating the primary gas flow rate and the secondary gas flow rate. The elastic modulus and fracture toughness of the coatings were measured by the indentation method, and the thermal shock resistance was evaluated by quenching the samples from 1050°C to room temperature. The Vickers hardness and elastic modulus of the coating were decreased by increasing the volume of the pores, and the fracture toughness was enhanced. It was found that the thermal shock resistance was improved owing to the stress release due to the pores.
Introduction
Gas turbine engines have been widely researched for decades owing to their exceptional performance in the fields of power generation and aircraft propulsion [1,2]. The hot sectors of gas turbines are generally made of superalloys with good mechanical properties in high-temperature environments [3]. To improve the engine efficiency further, the gas turbine needs to operate at temperatures above the melting point of the superalloy [4]. Therefore, thermal barrier coatings (TBCs) made of low-thermal-conductivity ceramics are applied on the surface of hot components [5].
Zirconia-based ceramic is one type of the common materials for TBC applications. Zirconia can be partially stabilized by adding 7–8 wt-% yttria [6,7]. This yields the metastable tetragonal phase (t′), which is the most desirable phase. Yttria-stabilized zirconia (YSZ) displays a high thermal-expansion coefficient (which is approximately 1.1 × 10⁻⁵ K−1) that is close to that of the underlying metal (which is approximately 1.4 × 10⁻⁵ K−1) [8]. The thermal conductivity of YSZ is below 2.3 W m−1 K−1 at 1000 °C for a fully dense material. If porosity is engineered into this material, the thermal conductivity can be reduced to 0.8–1.7 W m−1 K−1 [9]. This can lower the substrate temperature further. The mechanical properties of YSZ are also closely related to the volume and distribution of pores. The elastic modulus can be reduced by an appropriate porosity, making the YSZ top coat more compliant with stresses [10,11]. The erosion resistance of TBCs which is associated with the hardness can be modulated by the porosity of the top coat. The propagation of cracks can be affected by the pores. This is reflected in the fracture toughness of YSZ ceramics [12].
The failure of TBCs is derived from many sources [13]. First, the growth of thermally grown oxide (TGO) during thermal cycling [14] is a crucial factor responsible for the spallation of TBCs. Second, although the primary phase in YSZ is t′- ZrO2, the monoclinic phase (m-ZrO2) can be observed after long-term thermal cycling [15]. It is well established that the phase transformation to m-ZrO2 is accompanied by a large destructive volume variation, which results in delamination and spallation of the top coat. The stress caused by the thermal expansion mismatch between the top coat and underlying metal is another important factor [16]. The stress intensity and cracking tendency are affected by the elastic modulus and fracture toughness.
In this study, 8 wt-% YSZ (8YSZ) TBCs were prepared by air plasma spraying (APS) on a superalloy substrate. The porosity of the top coat was tuned by altering the spraying parameters. The effect of porosity on the mechanical properties of the top coat and their relationship with the thermal shock resistance were investigated.
Materials and methods
Material and sample preparation
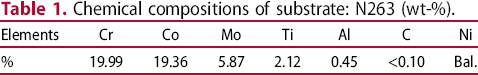
Chemical compositions of substrate: N263 (wt-%).
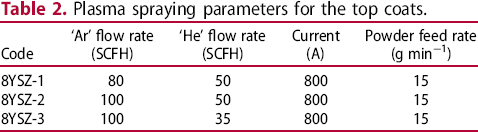
Plasma spraying parameters for the top coats.
Microstructural and porosity characterization
The cross-section of the coatings before and after thermal shock was mechanically ground with SiC paper and polished with 0.5 μm diamond paste. The cross-sectional morphologies of the as-sprayed and as-quenched coatings were observed by optical microscopy and scanning electron microscopy (SEM). The porosity was determined by analysing the grey level of the metallographs.
Structural characterization was carried out using X-ray diffraction (XRD). The XRD patterns were obtained using Cu Kα radiation at 50 kV and 180 mA in the 2θ range from 10° to 80°. The XRD patterns were compared with the standard spectrum of tetragonal zirconia (PDF48-0224), which is the major phase of 8YSZ. The morphology and distribution of pores in the top coat were characterized using the 3D X-ray microtomography system (ZEISS Xradia 500 Versa) with sub-micrometre resolution.
Mechanical property and thermal shock test
The thermal expansion coefficients of the top coat, bond coat and substrate were measured with conventional push-rod dilatometers. The microhardness was measured using an automatic microhardness tester (Qness Q10a) and a load of 300 g. The nanoindentation tests were performed at a constant room temperature using a Hysitron nanoindentation system TI-950 equipped with a triangular Berkovich diamond indenter. The projected contact area of the tip was calibrated by making indentation into a standard specimen. The maximum indentation load was 10 mN, whereas the applied loading/unloading rate was 100 μN s−1. The elastic modulus was evaluated from the load-displacement nanoindentation data using the widely accepted Oliver and Pharr method. The fracture toughness was determined using Vickers indents [17]. At least ten indents were prepared using a microhardness tester on each specimen to reduce the experimental uncertainty. The indents were observed using SEM.
The thermal shock resistances of the as-sprayed 8YSZ TBCs were evaluated by heating and water quenching. Each cycle consisted of 5 min of holding the specimens in the furnace at 1050°C, followed by direct quenching into water. When the spallation area attained approximately 10% of the top coat, the test was stopped, and the number of thermal shock cycles was recorded. Three specimens were tested to obtain the average lifetime of the thermal shock for each coating.
Results and discussion
Characterization of the coatings
The metallographs of three 8YSZ top coats with different porosities are shown in Figure 1(a–c). Randomly distributed pores and microcracks were observed in all the coatings, which were marked on the images. This is a characteristic feature of plasma-sprayed coatings [18,19]. The pores were deliberately engineered into the top-coat to reduce the thermal conductivity. Whereas the pre-existing microcracks will propagate to cause the coating to delaminate [20]. The 8YSZ-1 coating was sprayed via a primary gas Ar flow of 80 SCFH and a secondary gas He flow of 50 SCFH. The 8YSZ-2 coating was prepared by a primary gas Ar flow of 100 SCFH and a He flow identical to that for 8YSZ-1. For preparing the 8YSZ-3 coating, the higher primary gas flow rate was adopted, and the secondary gas He flow rate was reduced to 35 SCFH. The lower Ar flow rate (corresponding to a low velocity of particle) resulted in a longer residence time of the ceramic powders, in the plasma plume. A higher He flow rate could improve the operating temperature because of the high enthalpy of the plasma flame [21]. Thereby, a larger fraction of the ceramic powders could be melted completely for the 8YSZ-1 coating. Moreover, the porosity of this condition was the lowest (8.29 vol.-%). The porosity of the 8YSZ-2 coating was 9.18 vol.-%, because of the particle velocity is higher than that in the condition for 8YSZ-1. A porosity of 14.5 vol.-% was obtained in the microstructure of the 8YSZ-3 coating, at the decreased enthalpy in the plasma flame. All the three coatings displayed a uniform top coat with a thickness of 950–1050 µm, aiming at the protection of the gas turbine combustor. The thickness of the top coat was marked with red line as shown in Figure 1(b).
Optical micrographs of as-sprayed ceramic top coats: (a) 8YSZ-1; (b) 8YSZ-2; (c) 8YSZ-3 and (d) XRD patterns of the coatings before and after thermal shock.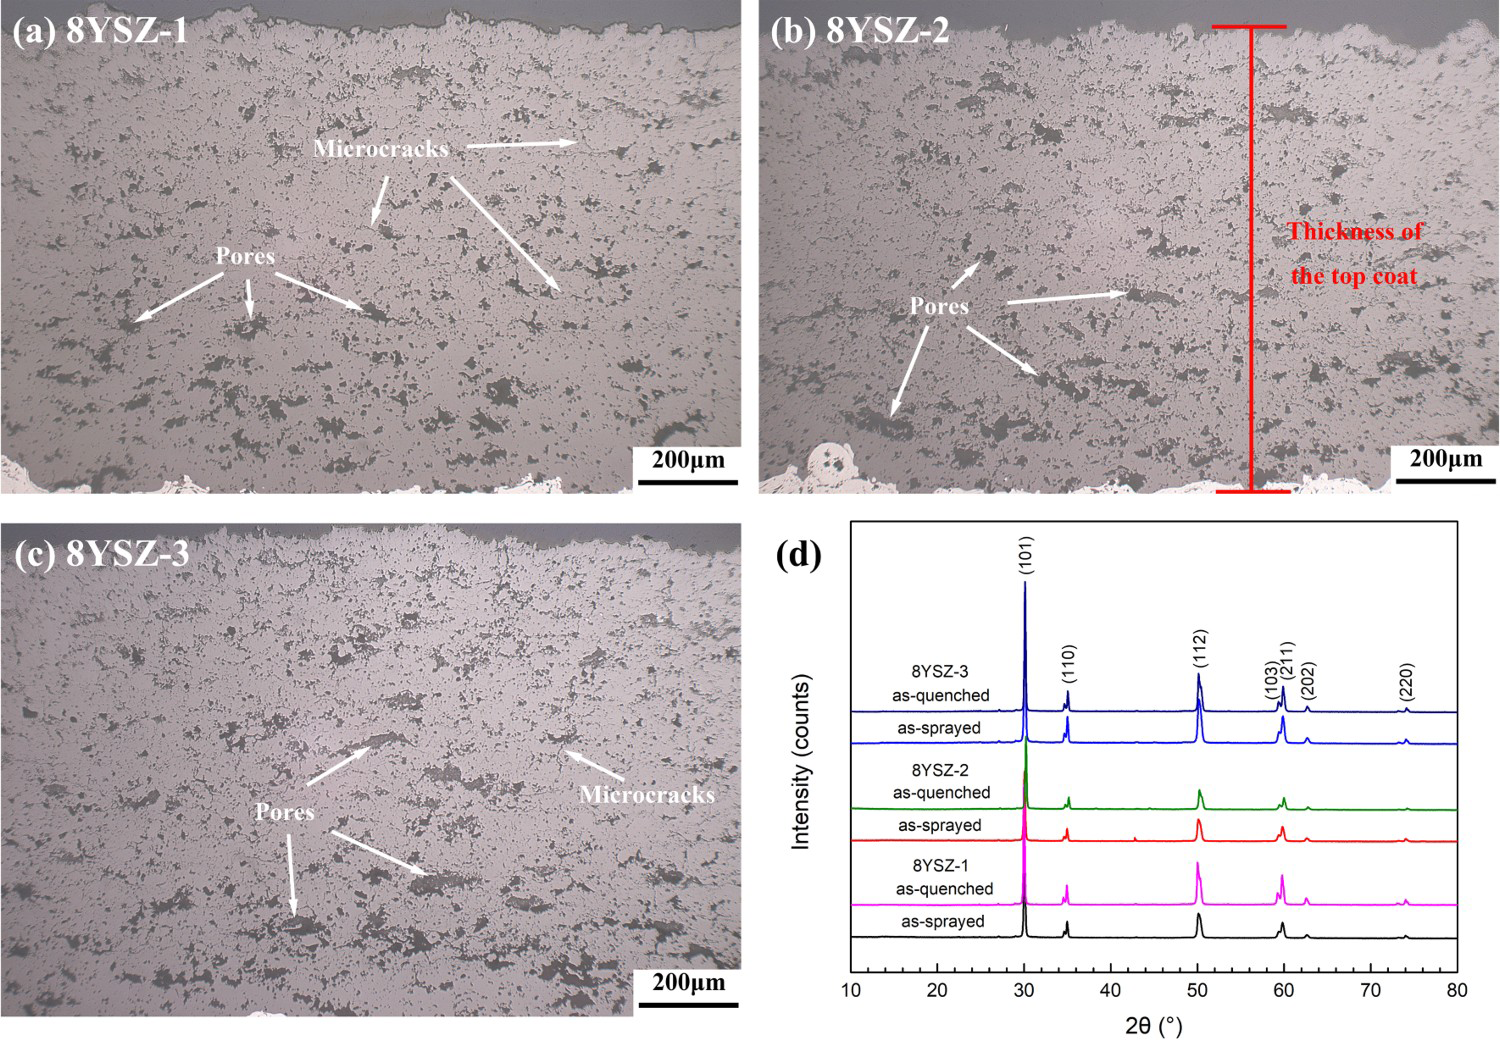
The XRD patterns of these coatings are shown in Figure 1(d). It is evident that the coatings prepared using the different parameters primarily present a single phase. The diffraction patterns are in full agreement with the diffraction pattern of metastable tetragonal ZrO2 (t′) [22], which is formed from the quenching of molten droplets during plasma spraying at a rate of 106 K s−1 [23-25]. The XRD spectra of the coatings after thermal shock are also depicted in Figure 1(d).
The pores in these coatings were characterized further by 3D X-ray microtomography. The representative 3D reconstruction of the TBC is presented in Figure 2(a). Because the pores in the coating absorb X-rays weakly, the coating displays inhomogeneous grey levels. The dark spots represent the pores [26]. The size and spatial distribution of the pores in the top coats can be visualized by making the coating transparently displayed. As shown in Figure 2(b–d), the variation in the equivalent diameter of the pores is represented by different colours, and the porosity of these three coatings increases gradually.
(a) Typical 3D visualization of the coating reconstruction from X-ray tomography system and spatial distribution of the pores in the coatings: (b) 8YSZ-1; (c) 8YSZ-2; (d) 8YSZ-3.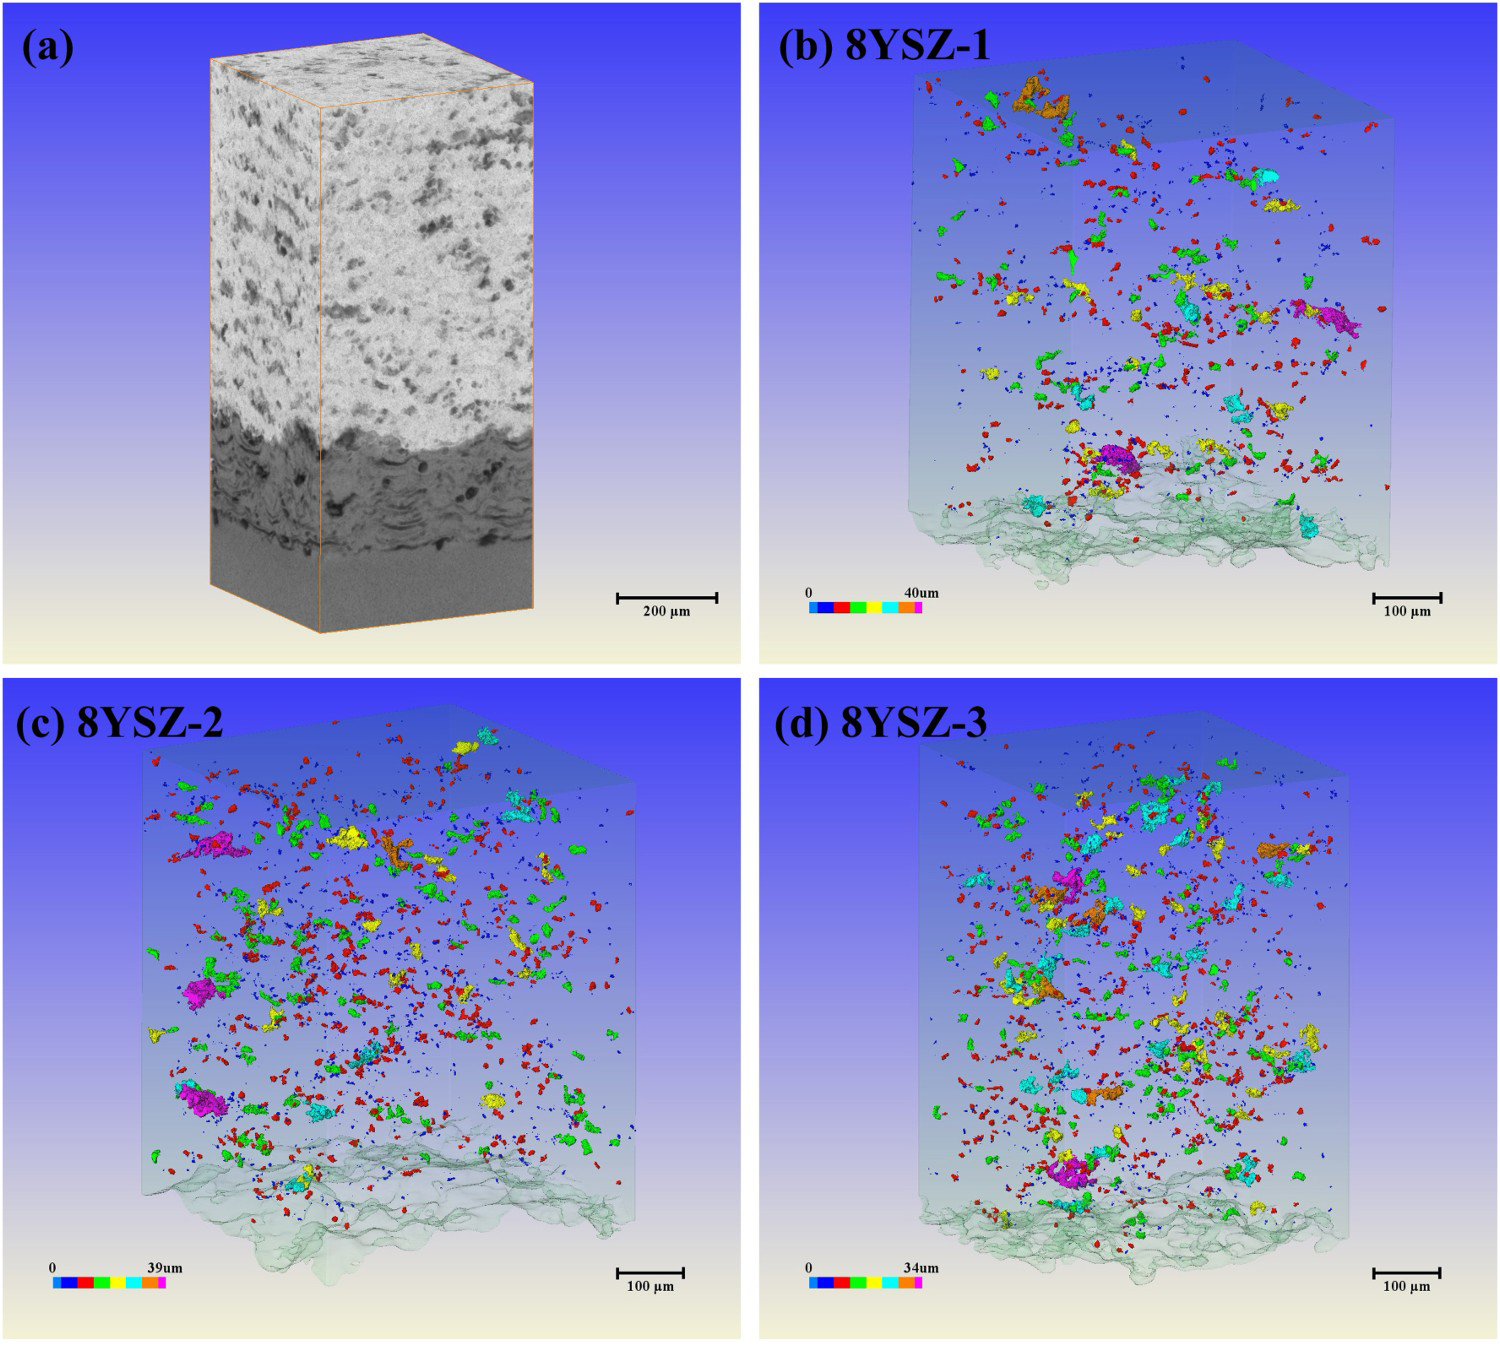
The substrate, bond coat and the top coat of 8YSZ-1 coating were machined into the dimensions for the coefficient of thermal expansion (CTE) test. The results are depicted in Figure 3(a). The CTE decreases in the order N263 > Amdry 962 (bond coat) > 204NS-G (top coat), particularly in the high temperature range. The CTE of N263 is the highest, ranging from 1.4 to 1.5 × 10⁻⁵ K−1. The CTE of the bond coat is lower than 1.0 × 10⁻⁵ K−1 at temperatures below 200 °C, and increases to 1.2–1.5 × 10⁻⁵ K−1 above this temperature. This phenomenon may be because of the alteration in the porosity and content of the β-phase in the bond coat with the increase in temperature [27]. The CTE of the top coat decreases from 1.3 × 10⁻⁵ K−1 to 1.1 × 10⁻⁵ K−1. The stress states of the TBCs during the thermal cycling are presented in Figure 3(b). The difference between the volume of the sample at high temperature and low temperature decreases in the order substrate metal > bond coat > top coat. Therefore, the stresses at the top coat/bond coat interface are compressive during the heating process and tensile during the cooling process. The thermal stresses caused by thermal expansion mismatch were reported to induce the initial failure of the coating [21,28]. However, that is not the primary factor in this study. The difference in mechanical properties is also critical.
(a) The coefficients of thermal expansion of N263, Amdry 962 bond coat and 8YSZ-1 top coat and (b) the stress states of the top-coat during thermal cycling.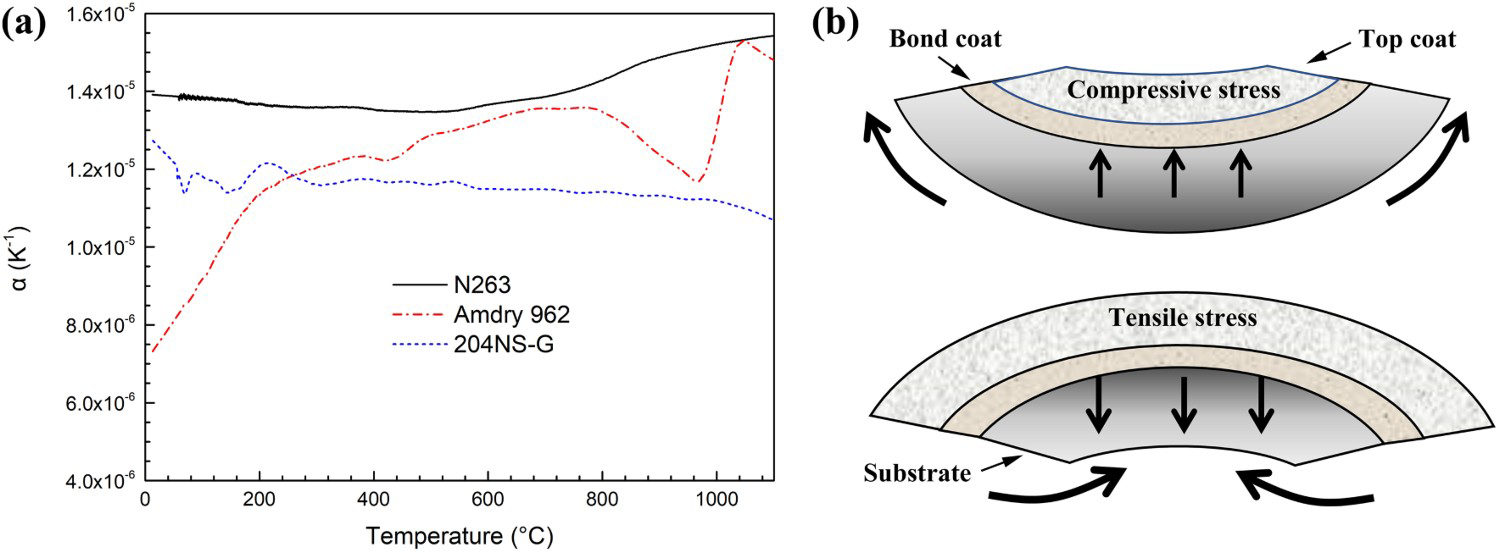
Mechanical properties of coatings
The Vickers hardness values of the coatings are shown in Figure 4. The error bar represents the standard deviation from ten values for each sample. The hardness of the 8YSZ-1 coating (807.25 HV0.3) was the highest. The lower porosity corresponding to better lamellar bonding could have caused the improvement in the microhardness [29]. The hardness values of the 8YSZ-2 and 8YSZ-3 coating were 771.87 and 708 HV0.3, respectively. An indenter is likely to hit the pores in a sample with high porosity, which results in a larger indentation size. Therefore, the Vickers hardness decreases with increasing porosity. The Vickers hardness can be applied to calculate the fracture toughness of the top coats.
Vickers hardness of the 8YSZ coatings with different porosities.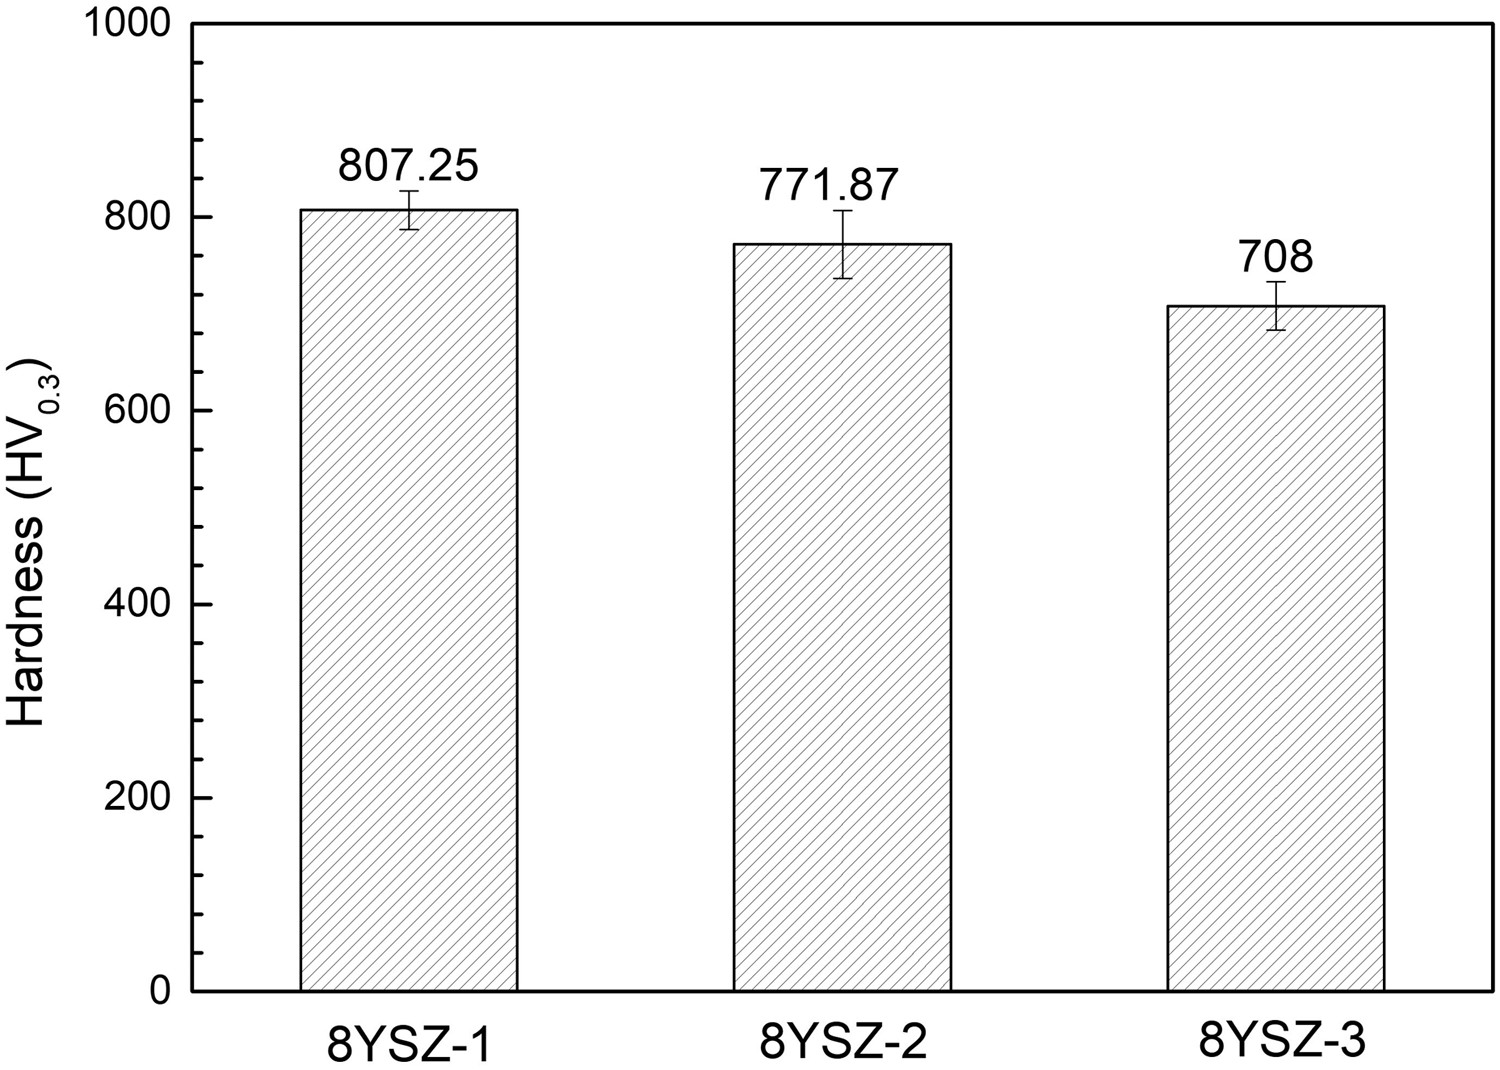
The load-displacement nanoindentation data of 8YSZ top coats with different porosities are shown in Figure 5(a). It is apparent that the indentation depth increases with the increasing porosity under the same load. The reduced elastic moduli of these three samples were determined by the widely accepted Oliver and Pharr method [30]. The following equation was employed:
(a) The nanoindentation displacement-load plots of the 8YSZ coatings with different porosities and (b) the cumulative probability plots of the elastic modulus.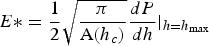
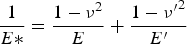
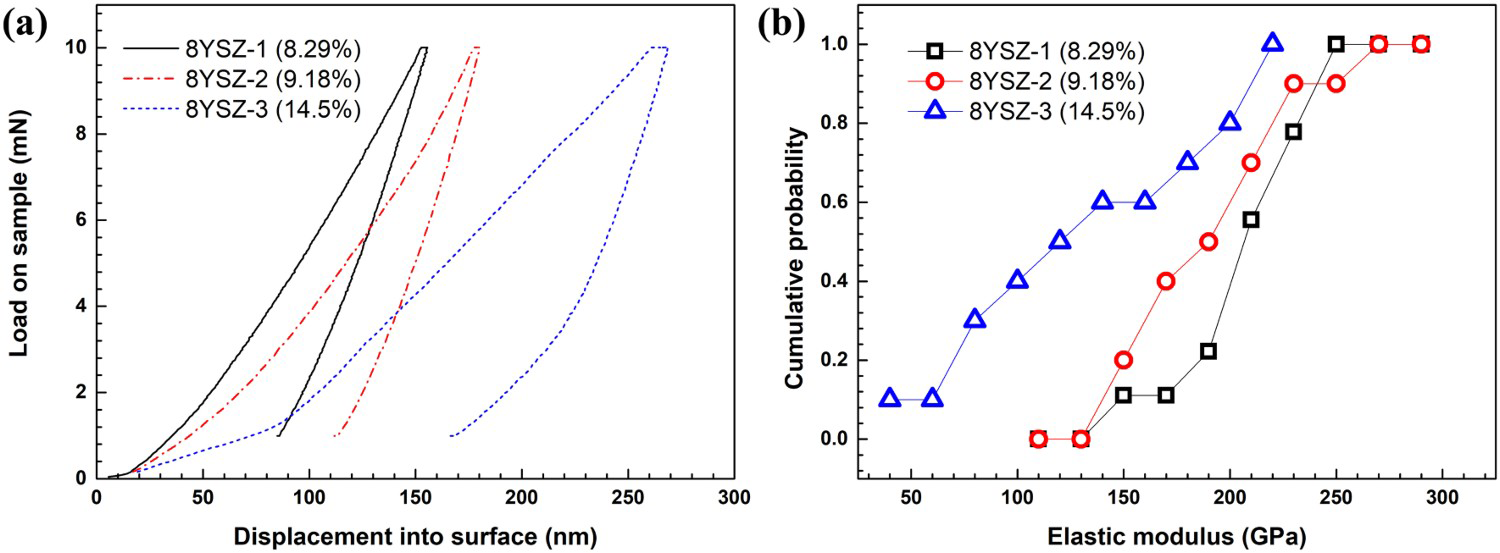
The cumulative probability plots of the elastic modulus are shown in Figure 5(b), which depicts the probability at or below the value on the x-axis. It is apparent that the median value of the elastic modulus (which denotes the average of E) decreases from 210 to 120 GPa with the increase in porosity. The relatively large scatter of elastic modulus is reasonable for YSZ ceramics, which display inhomogeneous lamellar microstructures with a number of pores and microcracks [33]. Therefore, the degree of dispersion is more remarkable for the sample with high porosity.
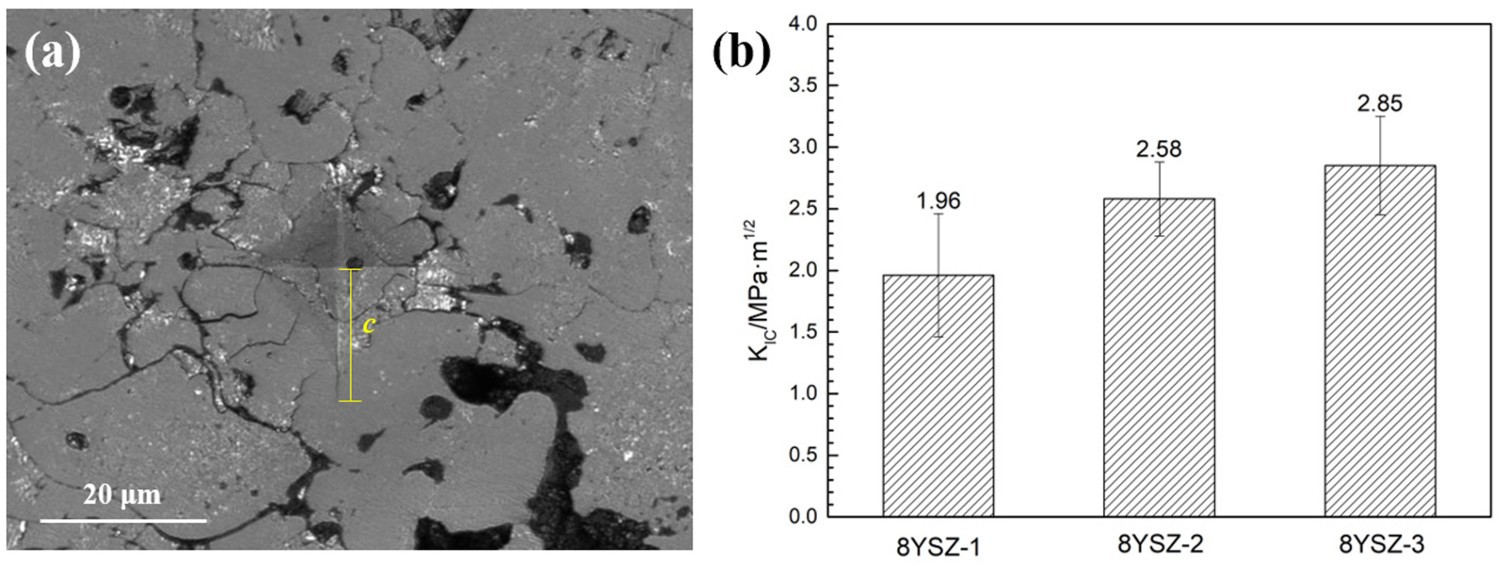
The fracture toughness (KIC) of the ceramic top coats was evaluated by the Vickers indentation method [34]. A typical indentation with radial cracks is shown in Figure 6(a). The mean radial surface crack length (c) is marked on the image. KIC can be calculated from the elastic modulus and Vickers hardness using the following equation [35]:
(a) Indent mark on the cross section of 8YSZ ceramic coating and (b) the calculated fracture toughness of the coatings with different porosities.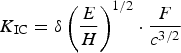
Thermal shock resistance of the coatings
The thermal shock behaviour of the coatings with a thickness of 1 mm was investigated by quenching the samples in water from 1050°C to room temperature. The top coat of 8YSZ-1 fell off after 20 quenching cycles. The failure of 8YSZ-2 accompanied the generation of cracks after 27 thermal cycles. The thermal shock resistance of 8YSZ-3 was higher than those of the other two coatings: a thermal shock lifetime of 50 cycles was achieved. The XRD patterns of the coatings after quenching are shown in Figure 1(d). The primary diffraction peaks of the as-quenched coatings are consistent with those of the as-sprayed coatings [38]. No phase transformation was observed among these samples after thermal shock. The major phase in the top coat is the non-transformable tetragonal phase. No detrimental phase (monoclinic phase) can be observed. Therefore, the failure of the 8YSZ coating is not related to the phase composition in this study.
A typical micrograph of the interface between top coat and bond coat of 8YSZ-1 after thermal shock is shown in Figure 7. The composition of area A, which is located in the matrix of the bond coat, is consistent with the nominal composition of Amdry 962. Points B and C are the interface between ceramic layer and metal layer and the boundary of the melted powders, respectively. The Al and O contents of these two positions, which are deficient in Ni and Cr, are significantly higher than those of the bond coat matrix. The Al depletion did not occur and the spinels comprising of Co/Ni/Cr oxides were not found [39]. The thermally grown oxide (TGO) layer formed during the thermal cycling is discontinuous and not dense for plasma-sprayed bond coat, which is different from high velocity oxyfuel bond coat [40]. Although, the TGO cannot provide effective inhibition for the penetration of oxygen [41], the stress concentration at the interface is avoided. Therefore, the thickening of the TGO is not the key factor in the failure during thermal shock.
Typical SEM micrograph of the interface between top coat and bond coat after thermal shock and the chemical compositions of marked regions.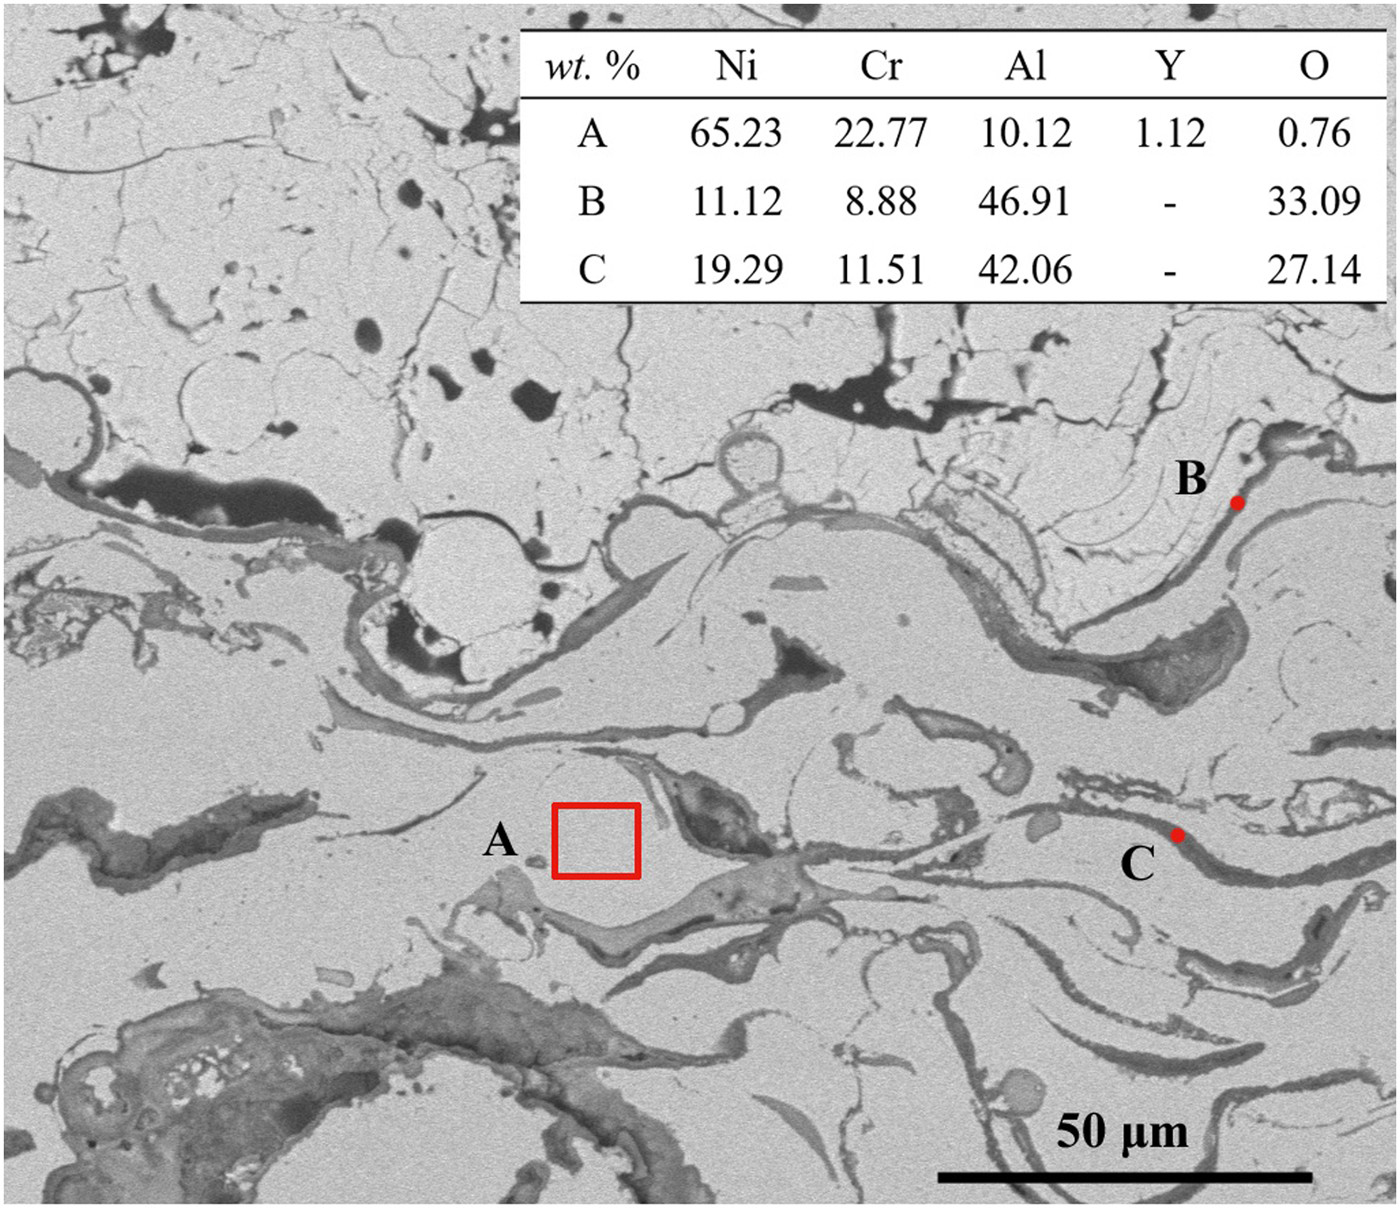
Cross-sectional micrographs of the 8YSZ coatings before and after thermal shock are shown in Figure 8. Although the porosities of the three coatings decreased, the interface between the top coat and bond coat was intact. The porosities of 8YSZ-1, 8YSZ-2, and 8YSZ-3 were reduced to 7.92%, 8.37%, and 9.31%, respectively. The extent of reduction is relatively low because of the short thermal shock lifetime of the 8YSZ-1 coating. The reduction in porosity is owing to the sintering effects during thermal cycling. A large number of pores healed such that a loosely connected structure was transformed into a more densified structure [42]. However, the formation of many new cracks can be observed, and the states of cracks in the ceramic layers are quite different. A few macro cracks can be observed in the top coat of 8YSZ-1, propagating towards the interface. With regard to 8YSZ-2, the generation of macro cracks is partially suppressed, and the macro cracks in 8YSZ-3 are barely observable. As a result, the initiation and propagation of cracks are effectively inhibited with the increase in porosity.
Comparison of micrographs of as-sprayed and as-quenched coatings: as-sprayed (a) 8YSZ-1, (b) 8YSZ-2, (c) 8YSZ-3 and as-quenched (d) 8YSZ-1, (e) 8YSZ-2, (f) 8YSZ-3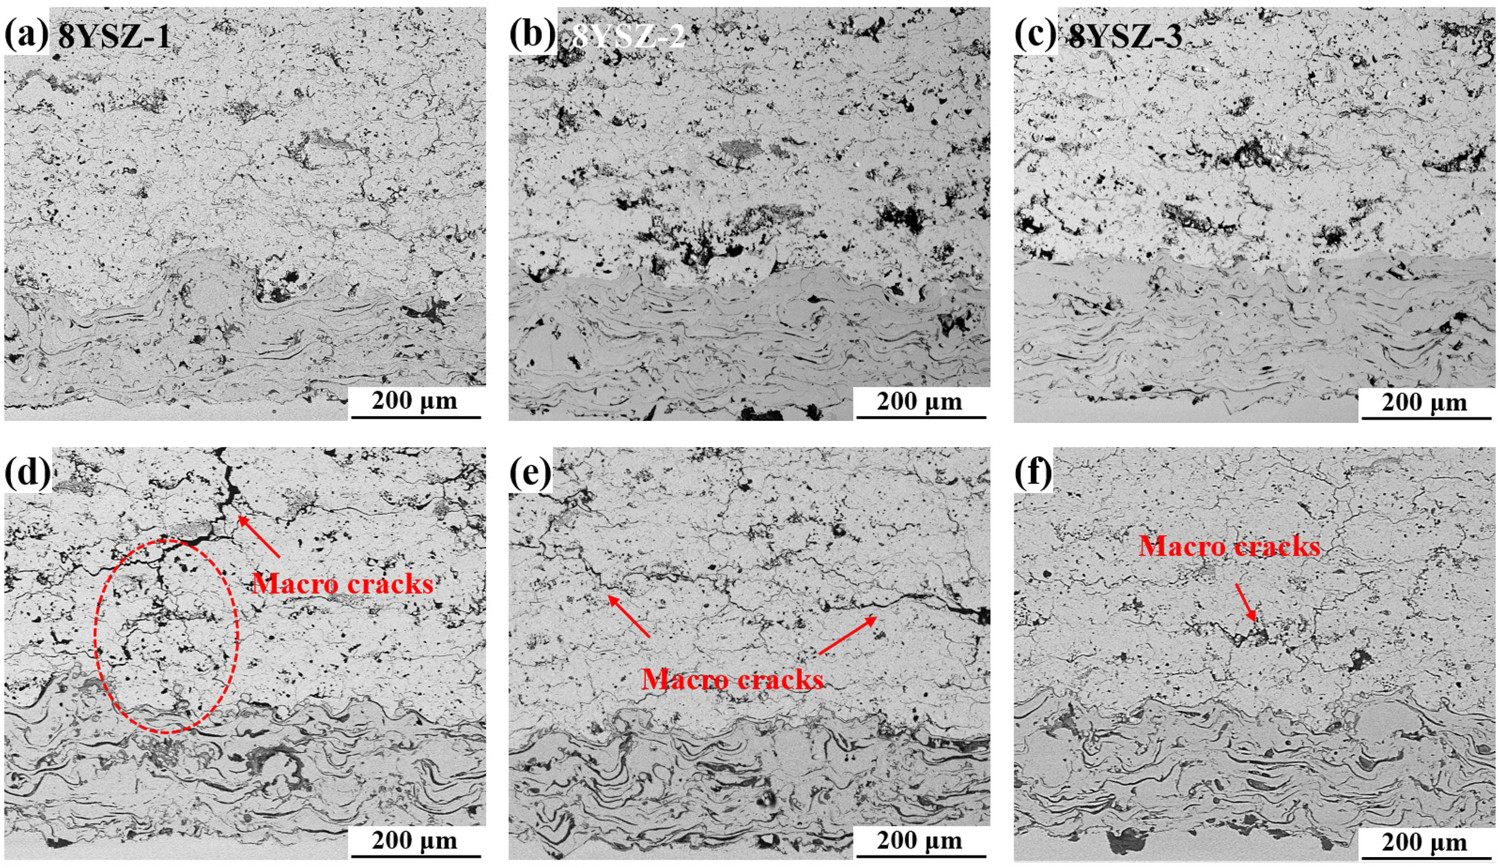
The elastic moduli of these three samples after thermal shock are shown in Figure 9. The inset image displays the typical load-displacement curves. The differences among the curves are reduced, owing to the similar porosity of the as-quenched samples. The dispersion of the elastic modulus decreased owing to the reduced porosity. In general, the elastic modulus of the samples after thermal shock is significantly enhanced. Choi et al. reported that an increase in the elastic modulus can be observed because of sintering, and that the good stress-tolerant capability was degraded upon annealing [42]. The increase in elastic modulus after annealing at elevated temperatures has been verified by many researchers [43-45]. It also signifies that the high porosity in the microstructure corresponds to good stress-tolerance.
Elastic modulus of the 8YSZ coatings after thermal shock (inset image: displacement-load curves).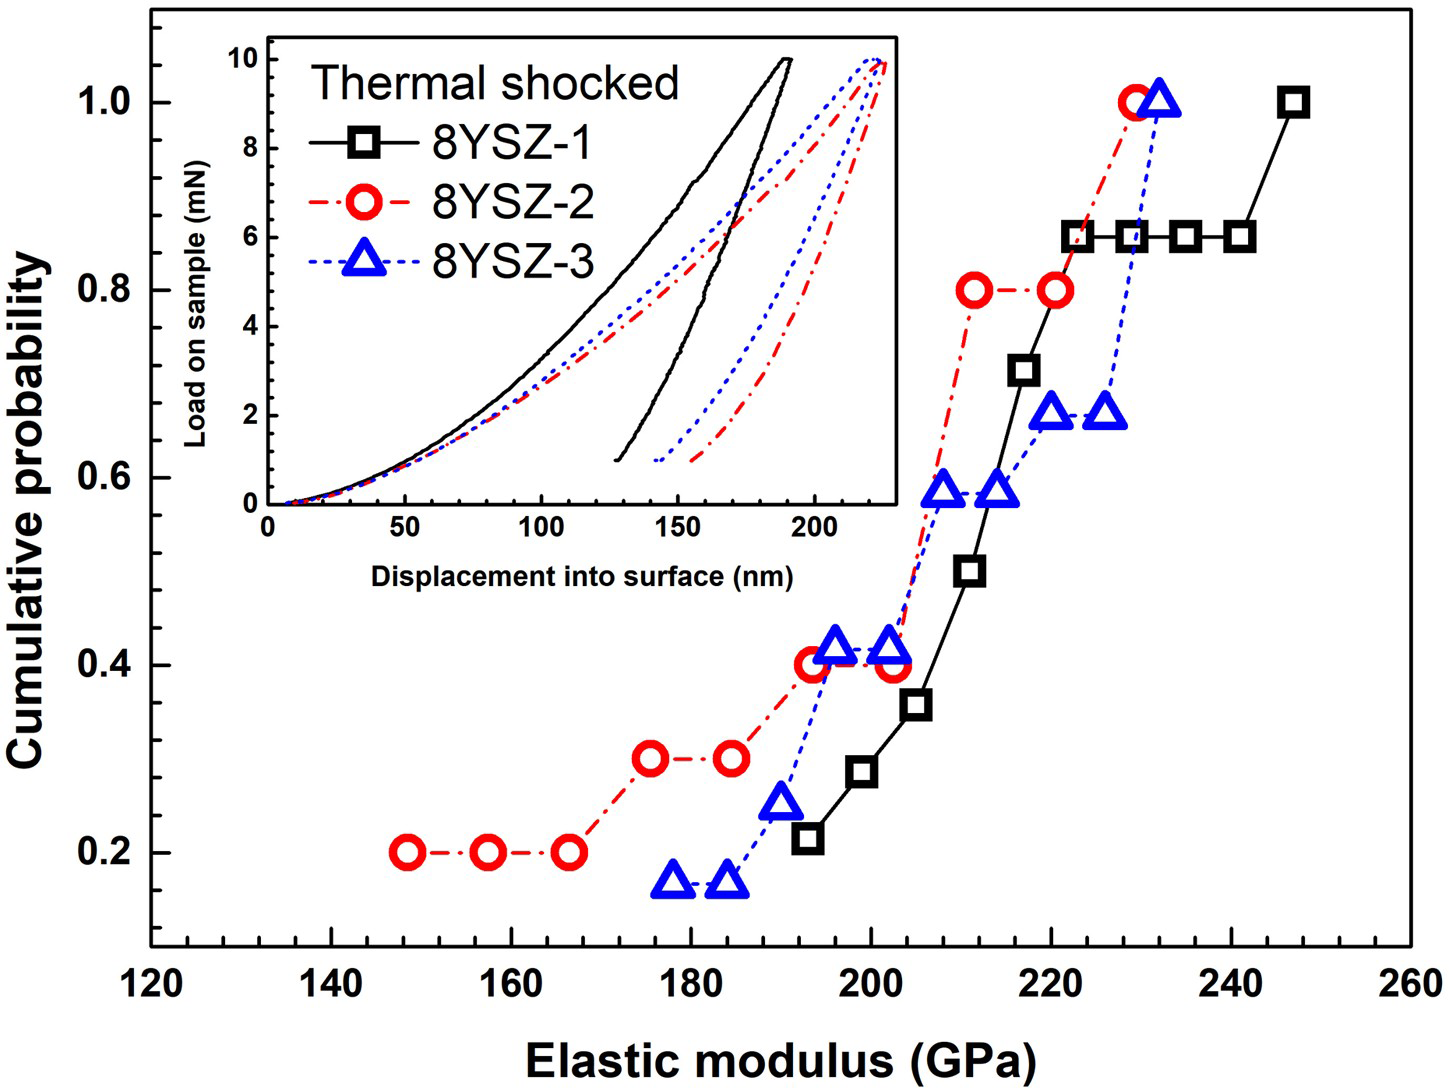
8YSZ-1 has the lowest porosity and highest elastic modulus among the three coatings. This causes the formation of a significant amount of stress during thermal cycling. Therefore, the cracks nucleate preferentially in 8YSZ-1, and the existing cracks in its microstructure propagate straightforwardly. The high porosity of TBCs can provide higher strain tolerance and lower thermal conductivity. This would contribute to extending the lifetime of the coatings [46]. It is well established that the stress at the crack tip can be released by the pores. In addition, the cracks are susceptible to blockage by the increase in porosity. This is the so-called ‘stress-tolerance’ [9]. The elastic modulus of the ceramic layer and the cracking tendency decrease as more pores are introduced into the microstructure of 8YSZ coating. This is verified by the measurement of fracture toughness. The thermal shock lifetime of the 8YSZ coating is prolonged with an increase in fracture toughness, which can be achieved by an increase in porosity.
Conclusions
The 8 wt-% YSZ TBCs with different porosities were deposited by air plasma spraying on an N263 substrate. The following conclusions can be made on the basis of the results and discussion.
The porosity increased from 8.29% to 14.5% by an increase in the primary gas flow rate and a reduction in the secondary gas flow rate. The Vickers hardness decreased as the pore volume increased. The average elastic modulus was reduced from 210 GPa to 120 GPa, and the coating was more stress tolerant. The fracture toughness of the 8YSZ coating improved as the porosity increased. The thermal shock lifetime of the 8YSZ coating with a thickness of 1 mm increased from 20 to 50 cycles. This is owing to the blockage of the propagation of cracks by the pores.
Footnotes
Disclosure statement
No potential conflict of interest was reported by the author(s).