






Abstract
The commensurate contact condition plays a key role in the directional friction properties and wear performance when two surfaces slide against each other. An experimental study on bidirectional friction and wear control by nanosecond pulsed laser selective texturing of grooves on AISI 304 stainless steel (SS) and TA2 titanium (Ti) surfaces of the sliding components was proposed. The influence of the aspect ratio (AR) and groove orientation angle on directional friction properties and wear performance was investigated. The AR2 and 75° samples performed best with 68.13 and 21.71% overall average coefficient of friction reduction for the Ti–Ti and SS–SS interfaces, respectively. The AR5.5 generated the least wear for the Ti–Ti and SS–SS pairs. The results take us a step closer to deriving a more effective, accurate, and dependable guideline for designing laser-machined surface grooves for directional sliding friction control.
Introduction
It is estimated that about 20% of the total energy production in the world is used to overcome friction. With efficient application of tribological findings on a global scale, savings would amount to 1.4% of GDP annually and 8.7% of the total energy consumption in the long term [1]. Efforts have been made to modify the surface properties of interacting components, with the aim of reducing the mechanical locking of asperities, enhancing lubricant flow and supply, ensuring even distribution of contact forces, utilizing micro bearing and reservoir effects of dimples [2].
Many surface texture designs have been tried over the years for the control of surface friction properties. The most common textures are of two types: micro-grooves, i.e. parallel grooves, hexagonal grooves, cross-hatched patterns [3] and micro-dimples, i.e. square, triangular, circular, ellipse and chevron [4].
Vladescu et al. noticed that grooves perpendicular to the direction of sliding showed the highest level of effectiveness for all mixed and boundary regime tests, closely followed by the chevron pattern, and grooves parallel to the sliding direction were the least effective [5]. Yu et al. concluded that the aspect ratio (AR) was seen to be the most influential in friction control of groove surface textures [6], which agrees with the findings of Tong et al. that the ratio of asperity radius R to texture width a could be an important parameter that influences the friction characteristics of nanoscale sliding contacts between multi-asperity tips and textured surfaces [7]. Sperka et al. in their work have proven by careful experiments that an increasing angle of the groove in the contact area to the direction of rolling speed has a negative impact on film thickness [8]. Lu et al. realized that micro-grids with a spacing of 200 µm and a width of 100 µm exhibits excellent wear resistance with a reduction of 57% [9].
Some common surface texturing techniques are electric discharge machining [10], laser texturing [9,11], electron and ion beam, chemical or electrochemical etching [12], micro-electrochemical [13] and mechanical machining methods [14], but laser surface texturing is extremely promising because of its unique characteristics such as non-contact process, no mechanical cutting force, no tool wear, CAM automated, capable of processing fragile or ultra-hard materials, and precise control of geometry shape and depth [15].
To the best of our knowledge, little work has been done on the experimental investigation of the directional sliding friction properties between sliding surfaces of TA2 titanium and AISI304 stainless steel (SS) with both contacting surfaces textured by the laser ablation technique. This work takes aim at the clearer understanding of the dependence of directional sliding friction properties on groove textures geometry and orientation. This will provide promising applications of laser surface texturing in the field of surface tribology. The scope of the study is to modify the friction and wear characteristics of SS and titanium sliding components via laser surface textured grooves. It also provides a simplified guideline with experimental proof of the control mechanism.
Materials and methods
The AISI 304 SS and TA2 titanium (Ti) samples with the thickness of 5 mm were cut using a wire cutting machine. The sample sizes were 15 mm×15 mm and 170 mm×15 mm as required for testing.
The sample test surfaces were polished to an average surface roughness (inspected by a laser LS4000 confocal microscope) of 0.07–0.1 µm using a series of emery cloths of 380–7000 cc roughness, under a constant stream of flowing water. The samples were ultrasonically cleaned in the ethanol bath for 10 min before the laser texturing process.
An UV pulsed laser micro-machining system with a 355 nm wavelength laser (Aptowave, co., Ltd), a pulse width of 20 ns, at 100 kHz pulse repetition frequency and a 2-D galvo-scanner system was used for the fabrication of the groove textures on the sample surfaces as shown in Figure 1.
Set-up of the UV nanosecond laser texturing system and the laser texturing patterns.
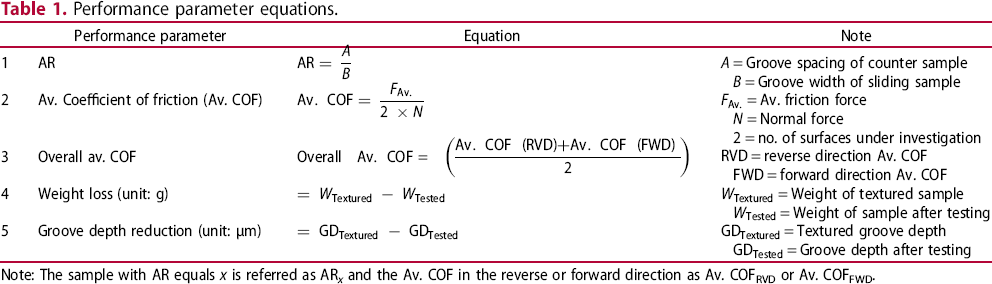
The focal plane was fixed on the specimen surface and the focused laser beam was approximately 25 μm in diameter. The laser fluence adopted in the experiment was 1.4 J cm−2, and scanned twice at 5 mm s−1 scanning speed. The sample test surface was textured, weighed and then inspected using the LS 4000 laser confocal microscope. The surface inspection was done before and after the laser texturing process, the friction test and the working principles of the self-built sliding friction test equipment are shown in Figure 2. To investigate the coefficient of friction and directional friction properties, the samples were textured with straight grooves as shown in Figure 1 and tested for sliding friction properties as shown in Figure 3, and Table 1 lists the performance parameter equations used in this study.
Sliding friction properties testing equipment (a) equipment set-up and (b) schematic diagram. (a) Schematic diagram of sliding friction properties testing equipment and (b) contact spot surface. Performance parameter equations. Note: The sample with AR equals x is referred as AR
x
and the Av. COF in the reverse or forward direction as Av. COFRVD or Av. COFFWD.

Straight groove texture parameters.

The test samples were fixed securely to the sliding friction test equipment (Figure 2) and a normal load of 87.5 N was applied. Ten millilitres of commercial engine oil SAE40 15 W (kinematic viscosity equals 140.45 cSt) was then applied, which fully covered the surfaces to be tested, and all preliminary experiments were carried out for 1 h for the untextured and textured samples of both material pairs, but the friction data collected every 5 min revealed that the Av. COF was stable after 15–16 min of sliding. Additional data retrieved after 15–16 min of sliding showed very insignificant change in the Av. COF, therefore the succeeding experimental data were analysed for 0–1 min and 15–16 min. The sliding speed was set to 37.5 mm s−1 and each of the tests was carried out for 15 min which was equivalent to a total sliding distance of 36 m for each test. This short duration (15 min) of sliding was selected so as to investigate the early initiation mechanism of Av. COF, the trend of Av. COF, and to study this mechanism without the influence of more complex factors that arise from very long duration tests, e.g. an increase in temperature [16], very significant changes in the viscosity of the lubricant [17], etc. and it is also consistent with some published literature [18-20]. The force measurements in the forward and reverse directions were recorded using the AIGU ZP-1000 digital force gauge attached to the sliding sample during the reciprocating action, while the room temperature was maintained at 17°C. The temperature difference of the lubricant was kept between 2 and 3°C, as too large temperature difference is indicative of high friction activity, and has a significant effect on lubricant viscosity. Four experiments were conducted for each sample pair, and then the results were averaged and the error bars have been included in the result figures of these experiments. A hand held microphone was used to record the friction noise 20 cm from the noise source (sliding sample) in all the tests, and the effect of dust and third-body materials was minimized by testing in an air tight super clean room and using all the samples once.
The groove textured SS–SS, Ti–Ti sample pairs were then tested with different AR's as shown in Table 2. The groove orientation angle between the counter samples and the sliding sample was initially set at 0° to maximize the energy dissipation and stick–slip effects encountered in commensurate groove contact condition, which has been discovered to be a significant source of friction between interacting surfaces [21]. As observed from preliminary experiments, the SS–SS material pair's overall Av. COF of AR2 (hereinafter refers to the sample with the AR equalling x as AR x ) by 6 and 1.5%, while that of the Ti–Ti samples decreased by 47 and 28.3%, when compared with AR5.5 and AR3.9, respectively. Therefore, the best-performing AR (AR2) was used to fabricate the straight grooves with five different groove angle orientations which were 0°, 35°, 55°, 75°, and 90°.
Results and discussion
Influences of the texture geometry on Av. COF
The untextured samples displayed no discernible trend, as shown in Figure 4(a), because of the random interaction of asperities and less controlled surface condition, while the textured samples outperformed the untextured samples in all sliding experiments (see Figure 4(b)).
Influence of the AR on the Av. COF with a normal load of 87.5 N: (a) pairs with untextured surfaces and (b) laser surface textured pairs.
This performance was due to effective lubricant distribution and retention by the textured sample surfaces, decrease in real contact surface area, evacuation of third-body wear debris, etc. It was observed that the lubricant on the surface of the untextured samples was swept off the surface during sliding, creating mixed to boundary contact conditions in some areas, and the third-body particles were not evacuated. These third-body particles acted as impurities and were highly abrasive material, leading to an increase in the Av. COF values [18]. The Ti–SS pair had the worst performance in comparison with the Ti–Ti and SS–SS untextured pairs because ploughing (plastic deformation) of the softer SS (70 HRB) surface asperities by that of the harder titanium (80 HRB) surface asperities. Therefore, the Ti–SS pair was excluded from further experiments.
The effect of AR was very significant on the Av. COF values of both SS–SS, Ti–Ti material pairs (Figure 4), and as the AR was increased from 2 to 5.5, the effectiveness of the grooves was decreased for both the Ti–Ti and SS–SS material pairs. Nevertheless, the AR5.5 had 20.25 and 1.32% greater overall Av. COF than that of the untextured sample pair in the Ti–Ti and SS–SS pairs, respectively, but the untextured SS–SS pair showed some comparable results to AR2 textured samples when the grooves were in commensurate alignment (0°). The overall Av. COF values of the Ti–Ti pair decreased as sliding progressed, i.e. 0–1 min values were higher than 15–16 min values for AR3.9 and AR2, but the AR5.5 showed an increasing trend. This reduction followed by the stabilization of Av. COF values is due to the polishing effect of sample surfaces under the counter surface textured sliding condition, during this the third-body particles generated from the plowing of interacting asperities, and the texture edges were deposited in the grooves. But in the case of the AR5.5 which showed an increasing trend, the spacing was much larger than the groove width (in comparison with other ARs) which led to insufficient lubricant availability on the surface of the groove spacing, and also made it difficult for the third-body materials to be transported to the grooves, consequently increasing the interaction time with the spacing leading to an increasing friction trend. The hardness of the material (titanium) influenced the deformation of third-body materials and polishing effect of counter surface textured sliding, but this is minimal under light loads.
All ARs showed a decreasing Av. COF trend in the reverse and forward directions in the SS–SS pair (Figure 4) because of the polishing effect of counter surface textured sliding, unlike the result obtained in the Ti–Ti pair for the AR5.5, the comparatively lower hardness of the SS–SS pair ensured effective deformation of third-body material, and polishing. This is responsible for the decreasing trend of the Av. COF of AR5.5 in the SS–SS pair as compared to the Ti–Ti pair.
In all interacting pairs for this texture, AR2 out performed all other AR's because of reduced contact area, and better lubricant distribution on the surface of the spacing, and the small spacing surface area which made the lubricant in the grooves to completely cover the surface of the spacing. In both the material pairs, only a 7.6% reduction in the overall Av. COF was achieved with the best-performing AR (AR2) when compared to the untextured samples, this nearly insignificant reduction shows the impact of commensurability of textures on overall Av. COF values of counter surface textured sliding. In the design of sliding mechanical components, care must be taken to avoid this contact condition, which could render the groove textures ineffective.
The influence of groove orientation angle on Av. COF values was quite interesting. The worst performing orientations were 0° and 90°, 0° and 35° in the SS–SS, and Ti–Ti material pairs, respectively (Figure 5). The reason for the variance is yet to be fully understood, but the 0° angle created a commensurate contact condition which had a detrimental effect on the friction results in both material pairs (see Figure 6).
Influence of groove orientation angle on Av. coefficient of friction. Influence of groove textures on lubricant distribution and friction force showing friction mechanism.

Of all the SS–SS pairs, the 75° groove angle had the lowest overall Av. COF values (see Figure 5) with a reduction of 21%, while the 55° groove angle of the Ti–Ti pair had the lowest overall Av. COF values, with a 56.3% reduction in the overall Av. COF when compared with AR2. This shows the impact of the orientation angle on Av. COF values for groove textures.
The effective distribution of lubricant and sufficient film thickness on the contact surfaces of the groove spacing had a considerable impact on friction force results. Groove textures served a dual role, i.e. as lubricant reservoir and trench [22]. After 15 min of sliding, the lubricant could still be seen in the grooves which ensured lubricant availability on the contact surface, as shown in Figure 4. So, the lubrication mode was in the mixed lubrication regime for most of the sliding duration. When contact pressure is high or sliding speed is too low or at zero, the lubricant film will be penetrated by the surface asperities, leading to the boundary lubrication regime, and consequently higher friction values as a regular occurrence near the start and stop points of sliding in both directions. This phenomenon also contributed to the high friction values noticed at the start and stop points of sliding, but when maximum speed was attained, the lubrication regime transitions from boundary to mixed lubrication regime. The trenching effect of the groove textures made the hydrodynamic lubrication regime impossible to attain, therefore the friction performance parameter used was the Av. COF over the entire sliding distance. The mixed lubrication regime aided by the reservoir effects of the groove textures had a positive effect on the friction results as opposed to the condition of the untextured sample scraping the lubricant off the sample surface as the sliding progressed. This caused lubricant starvation at the contact surfaces and therefore had an adverse effect on the friction values. It is also worthy of note that a major drawback of the groove texture is trenching effect which resulted in some loss of the lubricant, through the sides of the grooves, but it is beneficial for the removal of excess lubricant, and wear debris.
The scraping off of the lubricant contributed to the untextured sample having 7.64 and 6.25% higher overall Av. COF than that of the AR3.9, and 33.68 and 7.57% reduction in the overall Av. COF for AR2 of both Ti–Ti and SS–SS material pairs, respectively, as compared to the untextured pairs.
The change in the groove orientation angle, further reduced the overall Av. COF as has been previously mentioned, and a 68.13 and 21.71% reduction in the overall Av. COF values for the Ti–Ti and SS–SS material pairs, respectively, was achieved using the 75° groove angle, when compared with the untextured sample pair. The smaller contact spot surface area (CSSA) of 75° ensures adequate film thickness, and a reduced real contact area, though higher contact pressures will occur. However, this was a major factor responsible for the reduced overall Av. COF in the groove texture.
Additionally, energy barrier phenomenon will create a higher overall Av. COF if AR<1, because the spacing of the counter sample will sink into the grooves, but changing the groove orientation angle will eliminate the possibility of mechanical locking of the texture edges this effect, and the Av. COF will improve as was observed in the 55° and 75° angles for the Ti–Ti, SS–SS material pairs, respectively. So, AR should be designed so that the groove volume is greater than the minimum volume of the lubricant required to completely cover the contacting spacing surface.
Influence of texture geometry on wear performance
After the friction tests were carried out, the samples were washed with commercial cleaning detergent and then rinsed in ethanol for about 10 min, and dried before the surfaces were analysed, then the weights of the samples were measured. The weight was measured using a precise analytical balance with 0.01 g accuracy, while the laser LS4000 confocal microscope was used for the surface analysis, and the wear performance criteria used in this study were weight loss and reduction of groove depth.
High magnification and SEM images (see Figure 6) of the surface condition of the samples revealed microscale wear-induced textures such as grooves, tracks, dimples, micro ridges and tracks were observed in all the samples. The groove edges were in a better condition and groove edge fracture was reduced in the orientation tests because of the reduced impact loads on the groove edge when the groove orientation angle was changed. The groove edge fracture and tracks were the dominant wear-induced textures observed in the AR2 samples, but on the 55° and 75° sample surfaces, the wear tracks, and pit textures were more pronounced.
The trends of the wear performance of SS–SS and Ti–Ti pairs with AR2, AR3.9, and AR5.5 improved with decreasing texture density (see Figure 7). The mass loss increased with increasing texture density and the groove depth reduction followed the same trend; therefore the AR2 had the worst wear performance with mass loss of 0.22 g and a groove depth reduction of 25.2 µm in the SS–SS pair. This corresponds to 40.9% more weight loss and 12.3% more reduction in groove depth than the AR5.5 sample.
Groove surface condition after sliding test.
However, in the Ti–Ti pair, the AR5.5 exhibited a 50% reduction in mass loss and 12.2% reduction in groove depth loss. The larger surface area of the AR5.5 had led to a reduction in contact pressure, and this had a positive effect on wear results, but an adverse effect on Av. COF results. As the groove orientation angle was changed, a significant change in the wear performance of samples was observed, and the Ti–Ti material pair had better wear performance than that of the SS–SS material pair except in the case of the 75° groove angle orientation as shown in Figure 8(a,b).
Influence of groove orientation angle: (a) mass loss and (b) groove depth reduction.
The improved performance of the Ti–Ti pair over the SS–SS is due to the higher hardness of the TA2 titanium than AISI 304 SS but Av. COF and wear are not directly proportional to each other as can be clearly seen in the generally lower Av. COF values of the SS–SS pairs than Ti–Ti pairs, but for the wear performance, Ti–Ti pairs performed better.
In the SS–SS pair, the 55° had the most mass loss of 0.17 g, while 75° had the least mass loss of 0.03 g, but the 75° had 0.10 g and 55° had 0.04 g in the Ti–Tipairs. This interesting trend reversal in the mass loss results is caused by the higher contact pressure generated by the small contact spot area for the 75° groove angle orientation, and the third-body particles generated from the plowing of interacting asperities of very hard materials could increase wear in the Ti–Ti pair, but in the SS–SS pair, the third-body materials are more readily deformed leading to less wear of the surface. When compared with the worst performing sample, for the SS–SS pair, the 75° groove orientation exhibited 82.4% reduction in mass loss, and a 43.8% reduction in groove depth, while for the Ti–Ti pair a 60 and 14.3% reduction in mass loss, and groove depth, respectively, was observed. A 76.9 and 44.3% reduction in weight loss and groove depth was achieved by altering the groove orientation angle when the 75° sample was compared with the best-performing AR (AR5.5) in the SS–SS pair. While in the Ti–Ti pair, the 55° groove orientation angle outperformed the AR5.5 by 33.3% reduction in mass loss and 16.8% groove depth.
Friction and wear mechanism via laser surface textured grooves
Appropriate surface texturing reduces the real contact area; therefore, the asperities available for mechanical locking is reduced, but the adverse effect it creates is commensurate edge contact condition, specifically in parallel grooves (AR tests). The dominant source of friction was the mechanical locking of interacting asperities and groove edges, so the change in contact pressure (due to the reduction in contact area) had less impact on the overall Av. COF. The reduction in CSSA was also responsible for the significant improvement of the Av. COF when the orientation was changed, and is dependent on the geometry and orientation of the texture. Concretely, the (35°, 55°, 75°, 90°) orientations created incommensurate contact condition (minimum edge contact), decreased CSSA with increasing angle, and increasing contact pressure with decreasing angle (see Figures 3 and 9).
Influence of AR on (a) mass loss and (b) groove depth reduction.
In this work, the CSSA refers to the total real surface area in contact during sliding or in the stationary position. The untextured sample had a CSSA of 225 mm2, while for the selected groove parameters the AR2, AR3.9 and AR5.5 had a CSSA of 150, 178.4, and 189.8 mm2. The 90° orientation had the smallest CSSA (100 mm2) closely followed by the 75° groove orientation angle (104 mm2) just 3.4% greater than that of 90°, as compared to being 14.8 and 40% less than that of 55° (122 mm2) and 35° (174 mm2).
Since adhesion is minimal in lubricated sliding pairs, the wear control was due to the lubricant flow characteristics, lubrication regime (boundary to mixed), contact pressure and reduced wear debris interaction time due to the presence of the grooves. Although the interaction time of the abrasive third-body particles is proportional to the surface roughness, sliding speed and the groove spacing, and wear begins at the edges of the textures, so increasing the texture density (though leading to a reduction in groove spacing) will lead to an increase in wear and not a decrease. Additionally, the reduced texture density in the AR5.5 sample had a significant effect on the wear results because in commensurate contact condition, fewer groove edges means fewer wear initiation points and better the wear performance. On a closer examination of the micro-structure (see Figures 6 and 10), a recast layer and heat affected zone (HAZ) along the edges of the grooves were observed, this recast layer and the HAZ could contain micro-cracks that will be more easily worn off and fractured because of its loose attachment and inferior mechanical properties. The hardness values of specimen surface pre- and post-laser texturing that achieved on an automatic Vickers hardness tester (INNOVATEST, FALCON600) are 202HV and 211HV, respectively. Therefore, it is the shape-designed micro-structure, not the surface hardness, that improves the surface wear performance. The presence of these defects in the affected area contributed to the reduced wear resistance along the edges which favours wear initiation, but overall wear performance of the sample improves after these layers are worn off and due to the presence of the groove textures. Finally, the contribution of edge contact to wear is minimized when the orientation is changed. The AR2 though with the worst wear performance as noticed in the AR tests outperformed the AR5.5 when the groove orientation was within 55–75° for both material pairs, thus maximizing AV.COF and wear performance (Figure 11).
SEM images of samples with the lowest Av. COFs achieved by SS–SS pair @ AR2 and 75° orientation angle, and Ti–Tipair @ AR2 and 55° orientation angle. Friction and wear mechanism via laser surface textured grooves.

Conclusion
A revelation of bidirectional friction and wear control via laser selective texturing of grooves on the sliding component (AISI 304 SS and TA2 titanium) surfaces was proposed. The influence of the AR and texture orientation angle on Av. COF and wear was found to be significant. The textured samples outperformed the untextured samples in all the sliding experiments due to effective lubricant distribution and retention, decrease in CSSA, evacuation of third-body wear debris, etc. The increase in AR led to a decrease in texture density and contact pressure. The AR and orientation angle alteration had a direct influence on the Av. COF results (Av. COF reduction). Wear performance deteriorated as texture density increased (AR2), but a change in orientation (SS–SS, 75° and Ti–Ti, 55°) improved the wear performance, due to the creation of incommensurate contact condition, effective evacuation of wear debris and control of edge contact mechanics.
The experimental exploration in this work should have practical applications in the design of components in sliding motion. With the surface texture parameters and mechanism discussed in this study, the sliding components in contact can be designed to improve friction and wear properties, especially in low speed and low contact pressure guiderails and tracks used in sliding doors, automated high-tech package sorting systems, precision machining systems, linear motors and cutting blade guides applications.
Footnotes
Disclosure statement
No potential conflict of interest was reported by the author(s).