
Abstract
We aimed to identify demographic, health, and biomarker correlates of reaction time performance and to determine whether biomarkers explained age differences in reaction time performance. The sample comprised three representative cohorts aged 20–24, 40–44, and 60–64 years, including a total of 7,485 participants. Reaction time measures of intraindividual variability and latency were used. The measure of intraindividual variability used was independent of mean reaction time. Older adults were more variable than younger adults in choice reaction time performance but not simple reaction time performance. The most important correlates of reaction time performance after gender and education were biological markers such as forced expiratory volume at one second, grip strength, and vision. Few measures of physical or mental health or lifestyle were associated with poorer performance on reaction time measures. Biomarkers explained the majority of age-related variance in simple reaction time and a large proportion of variance in choice reaction time. We conclude that for the ages studied, biomarkers are more important than health factors for explaining age differences in reaction time performance.
Two of the key findings in cognitive ageing research are observed in reaction time (RT) tasks. These are the ubiquitous slowing of behaviour in old age (Birren, 1965; Salthouse, 1996) and the increasing variability in performance (Anstey, 1999; Christensen et al., 1994; Hultsch, MacDonald, & Dixon, 2002; Morse, 1993; Rabbitt, Osman, Moore, & Stollery, 2001). Although cognitive slowing has been proposed as the factor underlying more general cognitive decline in old age (Salthouse, 1996), age-related increase in variability has been noted in the literature for some time (Christensen et al., 1994, 1999; Morse, 1993). However, there has recently been a renewed emphasis on variability in test performance as a means of investigating the neural basis of cognitive decline (Hultsch & MacDonald, 2004; Hultsch et al., 2002; Li, Aggen, Nesselroade, & Baltes, 2001; Rabbitt et al., 2001). Hultsch in particular has recently proposed that variability in performance may provide a window to view cognitive change and frame key research questions in this field. This proposal follows studies showing that patient groups with neurological conditions show increased variability in performance on reaction time tasks (Hultsch, MacDonald, Hunter, Levey-Bencheton, & Strauss, 2000) and studies showing that interindividual variability is strongly related to intraindividual variability both within and between occasions (Rabbitt et al., 2001).
There are several types of variability identified in the literature but the main subtypes involve either interindividual differences or intraindividual differences in cognitive test performance. Research by Rabbitt et al. (2001) and Hultsch et al. (2002) suggests that intra-individual differences in RT are fundamental to explaining between group differences in RT and other aspects of cognitive performance. Of particular importance are within-occasion intraindividual differences that have been described as “inconsistency” measures by Hultsch et al. (2001). It is assumed that inconsistency is a function of neurological integrity (Hultsch & McDonald, 2004; Li & Lindenberger, 1999). Other authors have argued that increased variability in RT performance is due to lapses of attention caused by frontal lobe deficits (Theodore & Mirsky, 1999). Li and Lindenberger propose that deterioration in neurotransmitter systems may be at the heart of cognitive ageing and increased variability in performance. For example, in Parkinson's disease, slowing of RT (not movement time) has been observed after administration of levodopa (Mueller, Benz, & Boernke, 2001). If this were the case, we would expect that correlates of consistency would more probably be direct indicators of neurological efficiency or impairment.
Most psychological research on RT has been conducted on convenience samples within strictly controlled experimental designs, or on clinical samples. Experimental studies have the advantage of permitting longer testing sessions with manipulation of test parameters (e.g., Rabbitt & Banerji, 1989). Clinical studies allow for the neuropsychological import of experimentally derived effects to be evaluated between patient samples and controls (e.g., Hultsch et al., 2000). Population-based research has yet another contribution to make to this field. With the advantage of large sample sizes and the collection of data on a range of health, lifestyle, and functional variables, population-based studies allow for the examination of effect sizes at the population level and for the identification of individual differences variables associated with cognitive phenomena. In ageing, individual differences in physical function and health become increasingly important for explaining age differences in cognitive test performance (e.g., Luszcz, Bryan, & Kent, 1997). Therefore, a substantial body of cognitive ageing research involves taking cognitive phenomena established in the laboratory into larger studies where they can be examined in the context of health, physical function, and demographic factors (e.g., Bryan & Luszcz, 2000; Christensen et al., 2000).
Although population-based studies and large community-based volunteer studies are less tightly controlled than experiments (testing is usually conducted in participants' homes, and testing batteries cover a wide range of material), they provide the opportunity to evaluate a unique and important set of questions relating to cognitive ageing that are not available with smaller scale studies. They also have the potential to link cognitive phenomena that have been well described in an experimental setting with genetic indicators and observations based on neuroimaging such as cortical atrophy or white matter changes (e.g., Deary et al., 2003). In the field of cognitive ageing, the cross-fertilization of ideas between experimental cognitive psychology and population-based studies has led to several important theoretical advances. For example, the reporting of the association between sensorimotor and cognitive function in community samples has led to further experimental work on vision, hearing, and cognition (e.g., Lindenberger, Sherer, & Baltes, 2001) suggesting some common factors may underlie a proportion of sensory and cognitive ageing. Hybrid individual differences and experimental designs have also become a feature of much cognitive ageing work (e.g., Bryan & Luszcz, 2000; Salthouse, 1994).
To date few studies have evaluated the association of variables used as biomarkers of ageing (e.g., vision, hearing, grip strength, and lung function) and health and other contextual variables with reaction time performance. Likewise few studies have focused on relating RT performance to contextual factors in young and middle-aged adults. The studies that have linked biomarkers and health with reaction time have been restricted to samples of older adults. For example, Anstey (1999) showed that biomarkers of ageing explained all the chronological age-related variance in both visual and auditory reaction time tasks in women aged 60 to 90 years, and Christensen et al. (2000) report the lack of relationship of reaction time to change in memory performance in a longitudinal study of 425 very old adults. The only population-based study of RT in middle-aged adults obtains population-based estimates of reaction time but does not link RT data to health and biological variables (Deary, Der, & Ford, 2001).
Rationale for the Present Study
The specific aim of the present study was to identify the effects of demographic variables, biomarkers, and health and lifestyle factors on RT test performance in young, middle, and older aged adults. We also sought to determine whether there were age differences in the importance of these effects. The approach taken in the present study therefore follows from a tradition in cognitive ageing, where questions developed in experimental psychology laboratories are taken up in the context of large epidemiological studies. Previous research has shown that biological markers of ageing, such as forced expiratory volume, grip strength, and vision, explain virtually all age-related variance in cognitive test performance and often additional variance (Anstey, 1999; Christensen, Mackinnon, Korten, & Jorm, 2001). Biomarkers have also emerged as the most important set of variables when compared with physical and mental health, personality, and education within samples of older adults (Anstey & Smith, 1999). Therefore, the present study also sought to determine whether biomarkers as a group were the most important set of variables for explaining differences in RT performance between cohorts aged 20–24, 40–44 and 60–64 years.
In the present study covariates of RT performance were drawn from domains measuring demographics, biological age, physical health, and mental health. Education was included in all analyses as a control variable because of the well-documented association between education and cognitive test performance (Anstey & Christensen, 2000). Gender was also included as a demographic variable because of gender differences observed in cognitive test performance in the sample used for this study (Jorm, Anstey, Christensen, & Rodgers, 2004) and gender differences observed in RT and cognitive test performance performance (Deary et al., 2001; Rabbitt, Donlan, Watson, McInnes, & Bent, 1995). Medical conditions (heart disease, epilepsy, stroke, asthma, and head injury) that potentially affect neuropsychological test performance and biological markers (grip, forced expiratory volume at one second, vision, and systolic blood pressure) that have been shown to correlate with cognitive performance and RT were included (Anstey, 1999; Anstey, Lord, & Williams, 1997; Anstey & Smith, 1999; Christensen et al., 2001). Lifestyle and mental health variables (smoking, alcohol, physical activity, depression, anxiety) were included because there is evidence of associations of these factors with cognitive test performance in previous studies (Anstey & Christensen, 2000; Dustman, Emmerson, & Shearer, 1994; Hill, 1989; Luszcz et al., 1997; Parsons & Nixon, 1998; Rabbitt et al., 1995). These last variables also provide a base for comparison with the physical health and biomarker variables in terms of strength of association with RT measures.
On the basis of previous research (e.g., Anstey & Smith, 1999; Christensen et al., 2000) we hypothesized that biomarkers would be most strongly associated with variability and slowing, followed by diseases known to affect neurological function, and that measures of mental health will have the weakest associations with RT performance. One reason that bio-markers do correlate with cognitive performance is that they reflect not only individual differences in neurological integrity but also the impact of disease. For example, a disease such as diabetes, or neurological insult such as a stroke, may affect vision, muscle strength, and sensation. A battery of sensorimotor tests may measure the impact of the disease on function, and this may be more sensitive to the effects of disease than a simple questionnaire measure of medical conditions. In this sense biomarkers may operationalize the effects of ageing, disease, and insult to the brain (Anstey, Lord, & Smith, 1996).
Measure of Intraindividual Variability
Given the recent theoretical importance of intraindividual variability for explaining cognitive ageing and cognitive impairment (Martin & Hofer, 2004; Nesselroade, 2004), an aim of the present study was to evaluate whether there were specific correlates of intraindividual variability at the population level. One feature of some commonly used available measures of intraindividual variability in RT, such as the standard deviation and the coefficient of variation, is that they correlate with mean RT. This means that the unique contribution of intraindividual variability to cognitive ageing cannot be estimated and that associations between measures of intraindividual variability and other predictors may in fact be confounded by associations with mean RT. Concern about the problem of intraindividual variability measures being confounded by mean performance led to the development of a measure of intraindividual variability that was independent of the mean RT (see also Christensen et al., 2004).
Method
The sample came from the PATH Through Life Project, a large community survey concerned with the health and well being of people aged 20 to 24, 40 to 44, and 60 to 64 years who live in Canberra or the neighbouring town of Queanbeyan. Each cohort is to be followed up every 4 years over a total period of 20 years. Results presented here concern the first-wave interviews with 20- to 24-year-olds, which were conducted in 1999 and early 2000, with 40- to 44-year-olds, which were conducted in 2000 or early 2001, and with 60- to 64-year-olds, conducted in 2001 and early 2002. Participants had to be in their respective age group on the 1st January 1999 (for 20- to 24-year-olds), 2000 (for 40- to 44-year-olds), or 2001 (for 60- to 64-year-olds). The sampling frames were the electoral rolls for Canberra and Queanbeyan, Australia. Registration on the electoral roll is compulsory for Australian citizens. Because the Australian Electoral Commission would only release decade age ranges for research purposes, we wrote to 12,414 persons recorded as aged 20–29 years on the electoral roll and asked for participation of those aged 20 to 24 years. Out of these, 5,058 were found to be out of the required age range, 1,061 were known to have moved out of the area, 2,190 could not be found, 1,701 refused or had poor English language skills, and 2,404 were interviewed. The participation rate of those who were found and who were in the required age range was 58.6%. Similarly, for the 40- to 44-year-olds, 9,033 persons were sent letters, 4,222 were out of the required age range, 280 had moved, 612 could not be found, 1,389 refused or had poor English, and 2,530 were interviewed (64.6% of those found and in age range). For the 60- to 64-year-olds, there was a change to the law allowing the Australian Electoral Commission to release more specific age group information. Letters were sent to 4,832 persons, 34 were out of the required age range, 182 had moved, 28 were dead, 209 could not be found, 1,827 refused or their English was too poor to allow an interview, and 2,551 were interviewed (58.3% of those found and in age range). The gender breakdown of the sample was 1,163 males and 1,241 females at age 20 to 24 years, 1,193 males and 1,337 females at age 40 to 44 years, and 1,319 males and 1,232 females at age 60 to 64 years.
Procedure
Participants were asked to complete a questionnaire on hand-held computers, which covered sociodemographic characteristics, anxiety and depression, substance abuse, cognitive function, well-being, physical health, health habits, use of health services, personality, coping, early life psychosocial risk factors, current psychosocial risk factors, and nutrition. This was done under the supervision of a professional interviewer. Some basic physical tests were also carried out (e.g., blood pressure, grip strength, visual acuity, lung functioning), and the participants were asked to provide a cheek swab from which DNA could be extracted. Most of the interview was self-completed on a Hewlett-Packard 620LX palmtop personal computer using the Surveycraft software for computer-assisted personal interviewing. However, testing by the interviewer was required for the physical tests, some of the cognitive tests, and the cheek swab.
Demographic Variables and Height
Participants were asked a series of questions about educational activities, and these were used to calculate years of education (Education). Gender was coded 0 = male, 1 = female. Participants were asked to report their height in either feet and inches or centimetres.
Health Variables
Self-reported history of heart problems, diabetes, asthma, epilepsy, and head injury were coded 1 = yes, 2 = no. General physical health was assessed using the short-form SF-12 Physical Health Summary Scale. This scale consists of a 12-item subset of the SF-36 (Ware et al., 1996) with higher scores indicating better health.
Biomarker Variables
Forced expiratory volume at one second (FEV1) was measured in litres using a Micro Medical “Micro” spirometer (Micro Medical Limited, Rochester, Kent, UK), which is a hand-held microprocessor- based unit. The participant was given the following instruction: “ Breathe in until your lungs are completely full, now seal your lips around the mouthpiece and blow out as hard and as fast as possible until you cannot push any more air out.” Participants completed the procedure three times, and the average of the second and third trials was used. Grip strength was taken using the Smedley hand dynamometer (Model No PE7, Stoelting Co., Wood Dale, Illinois), which measures the force exerted in kilograms. Four trials were given for each hand, and the mean of the average score of left and right hands was the measure used in this study. Participants were first shown how to grip the hand and began with their dominant hand (the hand they wrote with). The interviewer said: “Now squeeze your fingers and thumb together. Good. Hold the grip meter like this down by your side. Squeeze as hard as you can.” Participants swapped hand after two trials and then repeated the procedure. Across the eight trials at Wave 1, Cronbach's alpha was .82 based on 838 individuals. FEV1 and grip strength are known to correlate with gender and height so adjustments for these variables were made in the multiple regression analyses. Corrected visual acuity was measured using a 3–m Snellen Chart. It contained seven lines that subtend 1 min of arc at distances of 60, 36, 24, 16, 9, 6, and 5 m. A participant's score was the total number of letters readable, and scores ranged from 0 to 28. Blood pressure was measured twice during the interview using an Omron M4 blood pressure monitor, and values for diastolic and systolic pressure were averaged.
Measures of Mental Health
Anxiety and depression symptoms in the past month were assessed by the Goldberg anxiety and depression scales (Goldberg, Bridges, Duncan-Jones, & Grayson, 1988), which give scores of 0 to 9 for number of symptoms of anxiety and of depression.
Lifestyle Variables
Current smoking status was assessed with a single item (“yes” or “no”; Smoking). Items used in the UK Whitehall II study (Marmot et al., 1991) were used to produce a physical activity variable (phys act). Participants were asked to rate the frequency with which they engaged in mildly energetic (e.g., walking, weeding), moderately energetic (e.g., dancing, cycling), or vigorous (e.g., running, squash) activity, and to also report the average number of hours and minutes per week that they spent in mild, moderate, or vigorous activity (Marmot et al., 1991). Combined responses to the items were then used to classify participants into three activity levels: mild or no activity, moderate activity, and vigorous activity.
Alcohol use was assessed using the Alcohol Use Disorders Identification Test (AUDIT; Saunders, Aasland, Babor, De La Fuente, & Grant, 1993). Categorical estimates of weekly consumption were derived from the quantity and frequency items of the AUDIT as described previously (Caldwell et al., 2002). Participants were defined as hazardous/harmful drinkers based on the definitions of the National Health and Medical Research Council (2001), namely, more than 28 standard drinks per week for men and more than 14 for women. Abstainers/occasional drinkers were defined as consuming less than 8 standard drinks per week for men and less than 4 for women. For the present study, a dichotomous variable was created: coded hazardous/harmful drinker (1), not hazardous/harmful drinker (0).
Measures of Reaction Time
Mean Level
RT was tested using a small box held with both hands, with left and right buttons at the top to be depressed by the index fingers. The front of the box had three lights: two red stimulus lights under the left and right buttons, respectively, and a green get-ready light in the middle beneath these. There were four blocks of 20 trials measuring simple reaction time (SRT), followed by two blocks of 20 trials measuring choice reaction time (CRT). For SRT everyone used their right hand regardless of dominance. The interval between the “get-ready” light and the first light of the trial was 2.3 for both SRT and CRT.
Means were calculated after removing outliers. This was done by first eliminating any values over 2,000 ms for the younger age groups and over 6,000 ms for the 60–64 age group. Next, means and standard deviations were calculated for each individual for each block, and values were eliminated that lay outside three standard deviations for each individual. A number of very slow individuals still retained RT scores greater than 1,000 ms. In a final step, these values were dropped before the final means per block were calculated for each participant.
Calculation of Measures of Intraindividual Variability in RT
Figure 1 shows all the data points for one participant about a summary function for each of the RTs over the 80 trials. Mean absolute residuals (in ms; MAR) were calculated for each individual by averaging the deviations from quadratic models for the reaction time in each of the simple and complex RT series (Blocks 1–4 inclusive were SRT, and Blocks 5–6 were CRT blocks). These models were designed to remove both intra-block practice effects and the effect of the short rest periods between blocks, leaving residuals that measure only random variation. The distribution of MAR across subjects showed the expected pattern of increasing mean and variance with age. For example 92% of the 20–24 age group, but only 76% of the 40–44 and 54% of the 60–64 age groups, had MAR under 50 ms (Figure 2).
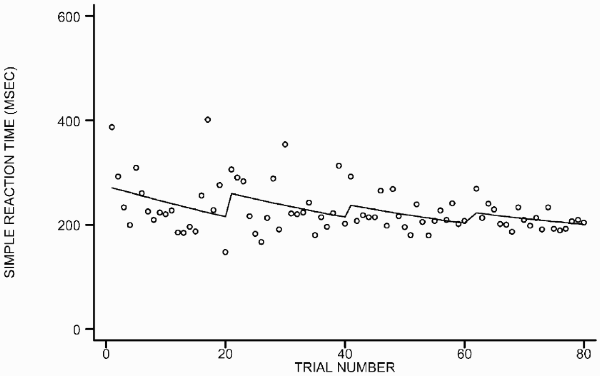
An example of one individual's raw SRTs showing how the residuals are corrected both for trend over the whole series and for steps between blocks.

Kernel density estimates (smoothed histograms) of mean absolute residuals from choice trials, by age group.
Also as expected, the between-subject variance of absolute residuals for the sample was found to increase as subjects' mean RT increased, reflecting the association between intraindividual variability and reaction time. To develop a measure of intra-individual variability that was independent of mean RT, the size of the associations between the MAR and mean RT needed to be estimated. Then a function had to be developed that adjusted for this association to achieve a measure of mean independent variation. To do this, the log of MAR was calculated and plotted against speed (−1/mean RT). The linear slope of this function was calculated for simple (b = 0.55) and choice times (b = 0.35) using the 40 CRTs and 80 SRTs. The slope indicates the degree of association between log MAR and speed. To adjust for speed, deviations from the line of best fit were calculated using the formula log MIV = log MAR − b(−1/RT), where MIV is the individual mean independent variability (i.e., the mean absolute residual adjusted for speed). Two scores of intraindividual variability adjusted for speed were computed for each individual. These were the MIV for SRTs (MIVS) and the MIV for CRTs (MIVC). For example, for the simple reaction times the corrected variation was given by:

Here “Mean” is mean RT in seconds, and the coefficient 0.55 is the regression slope described above (the regression intercept is ignored). The effect of this is that the variance is adjusted upwards more in subjects with fast reaction times, to achieve a measure of variation independent of speed.
Statistical Analyses
Hierarchical Regression Analyses of Correlates of Reaction Time Measures
A hierarchical regression model was tested to allow for the evaluation of groups of predictors of SRT, CRT, MIVS, and MIVC. Demographic variables were entered first, followed by physical health variables, biomarkers, lifestyle variables, and measures of mental health. Age group was entered as a demographic variable in the initial hierarchical regression analyses. Analyses were conducted to evaluate whether there were any significant interactions between predictor variables and age (where age was a significant predictor). A block of interactions between age and the independent variables was entered on a final block in the hierarchical model that had been developed. If inclusion of this block led to a significant increment in the R square, then the individual beta weights were viewed to determine which interaction was significant. Independent variables were centred by conversion to z–scores.
Age differences were evaluated by examining interactions of significant predictors with age group; p values less than or equal to .01 were treated as statistically significant.
Treatment of Missing Data
Missing data were imputed with the EM algorithm in SPSS using all the variables in the present study (Shafer & Graham, 2002). Missing data frequencies before imputation were less than 2% for most variables and less than 5% for all variables except MIVC (5.3%) and moderate hours of physical activity (7.7%).
Evaluation of Biomarkers versus Age in Explaining Individual Differences in Cognitive Test Performance
The relative importance of biomarkers versus age for explaining individual differences in RT performance was evaluated using hierarchical multiple regression models. In both models gender and height were entered at Step 1 to control for the effect of these on FEV1 and grip strength. In Model 1, age was entered at Step 2, and the biomarkers were entered at Step 3. In Model 2, the bio-markers were entered at Step 2, and age was entered at Step 3. The proportion of age-related variance explained by biomarkers was calculated using the formula 1 − (q/p) where q = the variance explained by age after controlling for biomarkers and height and gender, p = the variance explained by age after controlling for height and gender (as described in Anstey et al., 1997).
Results
Descriptive Data on the Reaction Time and Consistency Measures
Table 1 shows the descriptive statistics for the RT performance parameters for each age group. There were significant differences between age groups on the SRT task, F(2, 7482) = 372.26, p < .01, with post hoc tests showing that the 40–44-year-old age group was slower on the SRT than was the 20–24-year-old age group, and the 60–64-year old age group was slower than the 40–44-year-old age group (p < .01). Likewise, there were significant differences on the CRT task, F(2, 7482) = 971.64, p < .01, with post hoc tests showing that the 40–44-year-olds were slower than the 20–24-year-olds, and the 60–64-year-olds were slower than the 40–44-year-olds (p < .01). Significant group differences were found for the MIVS, F(2, 7482) = 7.19, p < .01, with post hoc tests revealing no significant difference in consistency between the 20–24-year-olds and the 40–44-year-olds on the SRT task, and a very small yet significant difference between the 60–64-year-olds and the 40–44-year-olds (p < .01). Significant group differences were also found for the MIVC, F(2, 7483) = 116.90, p < .01, with post hoc tests showing that the 40–44-year-olds were less consistent than the 20–24-year-olds (p < .01), and the 60–64-year-olds were less consistent that the 40–44-year-olds (p < .01).
Descriptive statistics for RT measures for each age group based on the imputed dataset and (effect sizes) for group differences
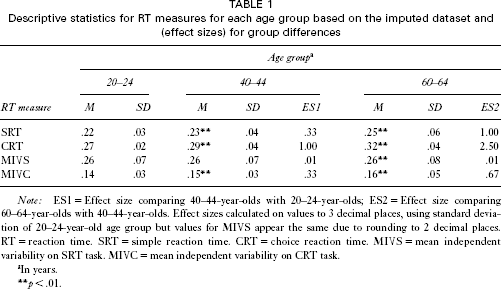
Note: ES1 = Effect size comparing 40–44-year-olds with 20–24-year-olds; ES2 = Effect size comparing 60–64-year-olds with 40–44-year-olds. Effect sizes calculated on values to 3 decimal places, using standard deviation of 20–24-year-old age group but values for MIVS appear the same due to rounding to 2 decimal places. RT = reaction time. SRT = simple reaction time. CRT = choice reaction time. MIVS = mean independent variability on SRT task. MIVC = mean independent variability on CRT task.
In years.
p < .01.
Intercorrelations among the reaction time measures are shown in Table 2. Here the difference between MIV and MAR in their correlations with mean RTs is illustrated. Very small associations were observed between RT and consistency measures, with the largest (MIVC and CRT) sharing 1% of variance. In contrast, moderate to large associations were observed between the MAR of the SRT and CRT tasks, and the mean SRT and mean CRT. This illustrates that the MIVS and MIVC measures were successful in measuring relatively independent intraindividual variability. A large correlation was observed between SRT and CRT(r = .67), and a moderate-sized correlation was observed between MIVC and MIVS (r = .29). Moderate to large associations are shown between the MAR for SRT and CRT, and mean RTs.
Intercorrelations among RT measures
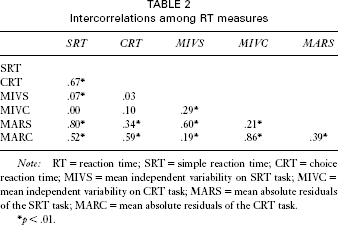
Note: RT = reaction time; SRT = simple reaction time; CRT = choice reaction time; MIVS = mean independent variability on SRT task; MIVC = mean independent variability on CRT task; MARS = mean absolute residuals of the SRT task; MARC = mean absolute residuals of the CRT task.
p < .01.
Demographic, Physical Health, Biomarker, Lifestyle, and Mental Health Correlates of Mean Reaction Times and Intraindividual Variability in Reaction Times
Table 3 shows the standardized beta weights and p values for each predictor in the hierarchical regression equations of SRT, CRT, MIVS, and MIVC. Age group was the strongest predictor of SRT, CRT, and MIVC, but was not associated with MIVS. Gender was a significant predictor of all RT measures except MIVC, with men showing faster performance but women showing less intraindividual variability on MIVS. Education was associated with performance on SRT only. Of the medical conditions, diabetes was the only condition associated with SRT, and diabetes and head injury approached a significant association with CRT. None of the medical conditions were associated with MIVS or MIVC. After the demographic variables, the biomarkers had the strongest and most frequent associations with the RT performance measures, explaining between 1 and 4% of the variance after controlling for demographics. Specifically, after controlling for demographic and health variables, grip, FEV1, and vision were associated with SRT and CRT. FEV1 was also associated with MIVS and MIVC.
Standardized beta weights and pvalues for correlates of RT parameters in hierarchical multiple regression analyses
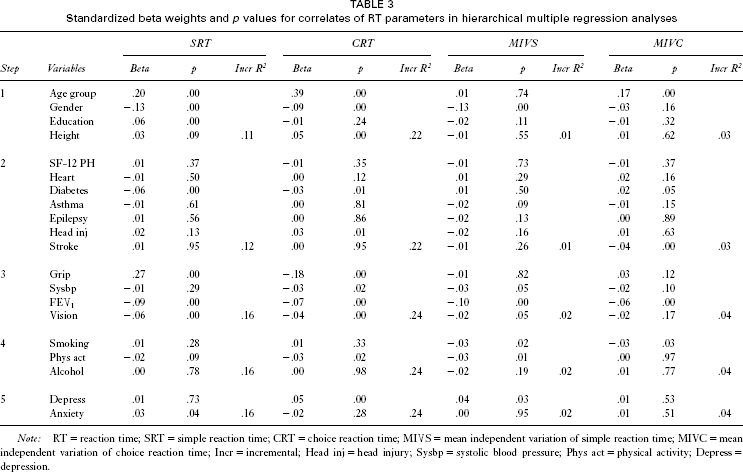
Note: RT = reaction time; SRT = simple reaction time; CRT = choice reaction time; MIVS = mean independent variation of simple reaction time; MIVC = mean independent variation of choice reaction time; Incr = incremental; Head inj = head injury; Sysbp = systolic blood pressure; Phys act = physical activity; Depress = depression.
The association of physical activity with MIVS approached significance (p = .01) but no other lifestyle variables were associated with RT performance. Depression was associated with CRT. Altogether the predictors explained 16% of the variance in SRT, F(25, 7459) = 55.59, p < .01, 24% of the variance in CRT, F(25, 7459) = 92.31, p < .01, 2% of the variance in MIVS, F(25, 7459) = 7.36, p < .01, and 4% of the variance in MIVC, F(25, 7459) = 11.92, p < .01. After adjusting for demographic variables, medical conditions explained 1% of the variance in SRT and less than 1% in all the other measures.
Interactions of potential covariates with age group were evaluated for significance in a final step of a set of further regression models. For SRT, entry of the interaction terms led to a significant increment in R2, F Change (6, 7481) = 15.37, p = .000, which explained an additional 1% of variance in mean SRT. Significant interactions occurred between age group and education, beta = −.192, p < .01, age group and grip strength, beta = −.495, p < .01, and age group and gender, beta = −.205, p < .01. The interaction between age group and education occurred because higher education was associated with faster SRTs in the 20–24-year-olds and the 60–64-year-olds, but there was no association between education and SRT in the 40–44-year-old age group. The interaction between age group and grip strength occurred because higher scores on grip strength were associated with faster SRTs in the 20–24-year-olds and 40–44-year-olds but not in the 60–64-year-olds.
For CRT and MIVS, inclusion of interactions did not lead to an increase in the variance explained. For MIVC, interactions explained an additional 0.01% of variance, F(2, 7448) = 4.71, p < .01, and the age group by FEV1 beta weight was significant, beta = −.300, p < .01; however, the effect size was deemed too small to interpret.
Comparison of biomarkers with age group in explaining individual differences in reaction time performance
To evaluate how much age-related variance was explained by the biomarkers, a series of hierarchical regressions was conducted. Summary results from these are shown in Table 4. In all cases blocks of biomarkers and age made a statistically significant contribution to explaining variance in RT performance, even where the size of this effect was extremely small. Biomarkers explained more total variance in mean SRT than did age, but this pattern was reversed for the CRT measures. Together, the biomarkers explained 73%, 56%, 100%, and 56% of the age-related variance in SRT, CRT, MIVS, and MIVC, respectively.
Comparison of biomarkers and age on reaction time parameters using hierarchical multiple regression
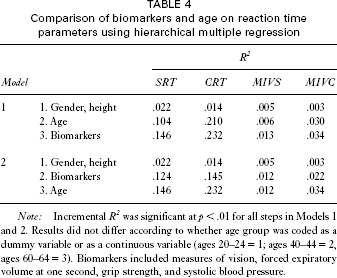
Note: Incremental R 2 was significant at p < .01 for all steps in Models 1 and 2. Results did not differ according to whether age group was coded as a dummy variable or as a continuous variable (ages 20–24 = 1; ages 40–44 = 2, ages 60–64 = 3). Biomarkers included measures of vision, forced expiratory volume at one second, grip strength, and systolic blood pressure.
Discussion
The present study aimed to describe age differences in speed of response and intraindividual variability in three population-based cohorts of adults aged 20–24, 40–44, and 60–64 years. It also evaluated predictors of speed and intraindividual variability, and age differences in the associations among the RT parameters and cognitive test performance. The approach taken here allowed for the evaluation of a range of potential correlates of RT performance that have previously been linked to age differences or age changes in cognitive performance.
The general findings of the study illustrate age differences in response times whereby older adults are slower than younger adults. Older adults were also less consistent in their responding than were younger adults on the CRT task, consistent with previous reports (Christensen, Griffiths, Mackinnon, & Jolcomb, 1997; Hultsch et al., 2002). There was no difference in consistency on the SRT task between the 40–44-year-olds and the 20–24-year-olds. We found relatively small effect sizes for differences between age groups; however, our “old” sample was younger than samples used in other recent studies (e.g., Hultsch et al., 2002; Rabbitt et al., 2001). Therefore, the estimates of age differences are likely to be less reliable than those obtained in a laboratory situation over thousands of trials. Moreover, the present study yielded relatively gross measures of RT performance compared with those derived from experimental studies, precluding the evaluation of any sophisticated model of underlying processes.
We investigated a large number of predictors of reaction time and intraindividual variability from different domains. Theories by Hultsch et al. (2002) and Li and Lindenberger (1999) would predict that markers of neurological integrity would be most strongly associated with RT measures, and variables unrelated to neurological integrity would not be associated with response time and consistency. Our study included a measure of grip strength, which is known to reduce after neurological insult (Haaland, Temkin, Randahl, & Dikmen, 1994) and has been associated with biological ageing (Anstey & Smith, 1999). Visual function in ageing has been viewed by some authors as an indicator of brain ageing (Lindenberger & Baltes, 1994). Our study also included data on specific conditions previously associated with impaired or reduced neurocognitive function including diabetes, stroke, head injury, and hypertension. In our analyses, we found virtually no associations between medical conditions and RT performance. This may have been due to the relative health and youth of the samples compared with clinical and ageing studies that have found these conditions to be associated with cognitive performance. We did, however, find that our biomarkers explained a moderate proportion of variance in SRT and CRT and a small proportion of variance in MIVS and MIVC.
Of our biological markers, grip strength was associated with RT but not with intraindividual variability, suggesting that individuals with weaker grip are slower but no less consistent than their stronger peers. Likewise, vision was associated with slower performance but not with consistency of performance. It is possible that poorer vision and grip strength affect movement time and not decision time but the present study did not distinguish between these two components of the RT task. It would be valuable to follow up this finding in laboratory studies to determine whether specific biomarkers are more strongly associated with slowing versus intraindividual variability. FEV1 was the only variable to be associated with all four RT measures. Although several studies have now shown that FEV1 is correlated with RT and other measures of cognitive test performance, the reason for this is still not known (e.g., Anstey, 1999; Anstey, Windsor, Jorm, Christensen, & Rodgers, 2004; Christensen et al., 2001; van Boxtel et al., 1997). Some authors have suggested that FEV1 is a marker of general biological age (Anstey et al., 1996; Anstey & Smith, 1999), or that it is related to cardiovascular fitness and lifestyle factors such as exercise and smoking (Emery, Pedersen, Svartengren, & McClearn, 1998). As a group, the biological markers were the most important set of predictors of SRT performance.
Lifestyle factors showed negligible associations with RT measures but depression was associated with CRT. This latter finding is consistent with previous research showing that depression is associated with cognitive slowing and poorer neuropsychological test performance (Austin et al., 1992; Christensen et al., 1997).
Results from the present study also show that biomarkers explain a large proportion of age-related variance in RT measures, although the proportion of variance explained was smaller than that found in a previous study that studied RT in relation to biomarkers conducted on a much older sample (e.g., Anstey, 1999). This difference is probably due to the inclusion of younger age cohorts in the present study. We expect that individual differences in rates of biological ageing will increase during the planned follow-up of the PATH Through Life Study and that greater age differences will be observed in future waves.
In comparison to laboratory studies (e.g., Rabbitt & Banerji, 1989) the present study is limited by the low number of reaction time trials which did not allow for the isolation of practice effects. Tests were not conducted in a laboratory setting, and the medical data were self-reported. However, the study has strengths in its large sample size and the use of measures of intraindividual variability that were independent of mean RT performance. We also note that a larger proportion of variance was not explained by the covariates examined. This probably reflects the fact that individual differences in RT performance occur in the normal healthy population and are due to general intellectual function rather than to health factors. However, the fact that associations were detected among some of the health and lifestyle variables and the biomarkers shows that these factors may affect brain function. The sizes of the associations among the health and biological variables and our RT measures were small and were detected due to our large sample size. Nevertheless, they are consistent with other reports in the literature and with earlier suggestions by Houx, Vreeling, and Jolles (1991) that suboptimal health and neurological risk factors affect cognitive development from young adulthood. From the point of view of cognitive ageing, it is important to identify even small effects if they are occurring in young adulthood as we still do not know when risk factors become important for determining cognitive decline. Research on older cohorts suggests that the factors identified in this study will become more important in age groups 65 and older (e.g., Anstey & Christensen, 2000). Population-based studies such as the one reported here reveal the importance of considering cognitive performance in the context of biological and health changes that occur in ageing. The results of this study also suggest that investigation of the association of specific biomarkers and RT performance may be a fruitful avenue for cognitive ageing researchers to pursue in the laboratory.