
Abstract
Precise prediction of the end of carbonisation possesses intangible benefits in the coke making process. The coke ovens in Tata Steel measure the raw gas temperature (at the gooseneck arrangement in the oven top) to identify the end of coking. Based on the gooseneck temperature profile, the carbonisation time is divided into active carbonisation time (ACT) and soaking time. As the soaking time is varied between 45 min and 1.5 h as per the need, the current study focusses on developing a mathematical model to predict the ACT given the coal blend properties and the operating conditions of the oven. Different statistical methods ranging from linear regression to artificial neural network (ANN) have been used to arrive at a robust model. Piece-wise linear regression and ANN have been found to out-perform the other statistical techniques. However, the ANN model is preferred in terms of the predictability of unseen data.
Introduction
Coke is one of the prime ingredients in iron making and the quality of coke, hence used significantly influences the quality of the product in the subsequent downstream processing. Striking a chord between the high quality and quantity of coke to be produced is one of the critical challenges faced by a coke plant of any steel industry. A plethora of factors influence the coke making process (subsequently the coke quality); a few of which can be predicted and controlled. A significant amount of research has been devoted in this regard for over a century and several factors such as coal blend properties, coking pressure, flue temperature etc. have been identified.
Studies to analyse the influence of cake porosity and fissure generation on the coking pressure were carried out via pilot plant studies [1]. Subsequently, the cake structure and densification process in a stamp charged coke making process were analysed in detail using the 2D discrete element method [2]. This eventually led to a deeper understanding of the development of mechanical strength in the oven. Numerous studies on predicting the coke quality based on the coal blend properties were carried out and mathematical models to predict the same have also been proposed [3–6]. Several researchers across the globe have contributed extensively in developing novel techniques to enhance the coke quality such as addition of organic binders [7] and phenolic resins [8].
Despite the abundance in the literature in predicting and enhancing the coke quality, very minimal research has been carried out on identifying the end of carbonisation. Prediction of end of coking holds prime importance in the coking process and influences the coke quality to a large extent. It is a known fact that, green pushing hampers the coke quality. Therefore, a few schools of thought have studied the influence of carbonisation time on the coke quality and have suggested that a longer carbonisation time is essential for improved coke quality [9]. However, it is also reported that an excessively high coking time leads to an inadvertently high push force; which in turn hampers the battery life. Hence, identifying a suitable coking time is crucial for a healthy coke making process.
Yonghong and Ruili [10] have developed a mathematical model using artificial neural network (ANN) to predict the finished carbonisation time from the temperature and change rate of temperature in the waste gas pipeline. Lumadue et al. [11] proposed a technique to identify the end of carbonisation by measuring the temperature of the raw gases. This technology was validated via the fundamental principles employing H2 concentration and coke centre mass temperature.
Tata Steel Ltd., Jamshedpur, has seven batteries in operation with each housing a varied number of ovens. The end of the carbonisation in this century old plant is predominantly driven by the blast furnace demand and the design specifications. In an attempt to shift to a foolproof method of understanding the end of carbonisation, the most recent of the batteries (Batteries 10 and 11 with 88 ovens each) were provided with the facility to measure the temperature of the raw gases at the gooseneck, an application of the methodology proposed by Lumadue et al. [11]. It may be noted that, the gooseneck is the elbow-shaped connection between the ascension pipe and the gas collecting main of the coke ovens.
The general schematic of the gooseneck temperature profile is shown in Figure 1. The initial increase in temperature is due to the emission of gases while charging and the associated release of moisture within the initial few hours. Subsequently, the release of volatile matter from the coal mass is indicated by an approximately horizontal profile till the peak point is reached. This peak is considered the end of active carbonisation, as suggested by Lumadue et al. [11]. The time taken to reach the peak from the point of charging is called the active carbonisation time (ACT) (Note: ACT indicates the removal of a majority of the volatile matter from the system). It is a general practice to provide additional time (called soaking time) beyond the completion of carbonisation in order to accommodate the homogenisation of the cake formed. Although the exact soaking time required for a given condition varies based on a number of factors including the design of the oven, a common practice is to provide a time of around 45 min to 1.5 h. A prediction of the ACT would ensure an ease of operation as continuous monitoring of the gooseneck temperature profile can be dispensed with. Therefore, the present work focusses on developing a model to predict the ACT by considering the plant data obtained from the byproduct recovery coke ovens (Battery 10 and 11) of Tata Steel. Schematic of gooseneck temperature profile.
Methodology
In the present work, the data obtained from batteries 10 and 11 of the byproduct recovery coke ovens of Tata Steel has been used to develop a model to predict the ACT. The data in the current study corresponds to 10 month duration – March 2016 to January 2017. The different input parameters considered for analysis include the coal blend properties and operating parameters such as stamping time and operating battery temperature. The rationale behind the selection of the physical properties of coal is straight forward. However, it may be noted that, the operating parameters such as stamping time and battery temperature also play a crucial role via altering the bulk density of the charged coal and the carbonising temperature, as a whole, respectively.
The data sets obtained directly from the plant operation show certain abnormal variations intermittently due to the external and uncontrollable factors. Therefore, a preliminary analysis of outlier identification is performed for all the collated data. It may be noted that, this time span ensures that the collected data encompasses a wide range of variations in the plant operations and hence may be considered a strong representative of the process variables, given the operation of the same set of coke ovens as that considered. The filtered input data (145 data sets) has been analysed using different statistical techniques from multiple linear and non-linear regressions to ANNs and a trade-off between the techniques has been achieved based on their predictive capabilities. The regression analysis was carried out using ‘STATISTICA 14.0’ software and ANN was developed using Matlab 2007a.
As known, neural networks work on the principle of ‘learning’ (supervised or unsupervised) from the input data set and this process is often termed as ‘training’. The efficacy of this process dictates the predictive ability of the network. It is proven by several researchers that a well-trained network can exactly replicate the output of a real situation. In the present work, a generalised multilayer feed-forward network with a back-propagation algorithm is used to develop a neural network. A general schematic of the network is shown in Figure 2. Schematic of feedforward netowrk without bias.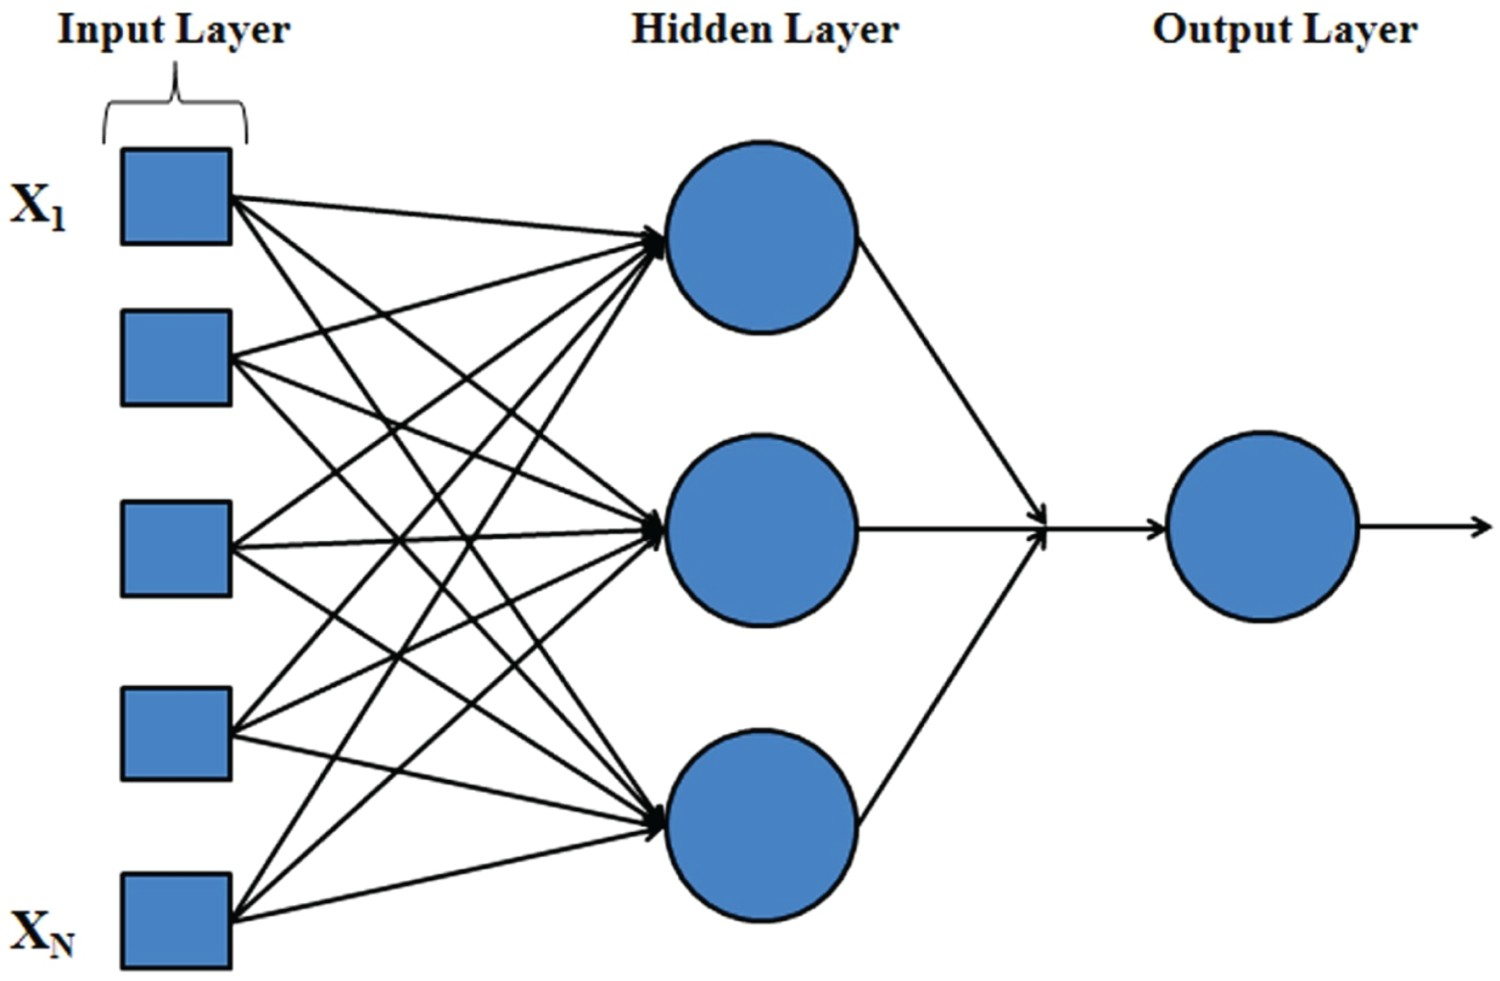
The number of nodes in the input and output layers are fixed at 5 and 1, respectively. Note that, the extra node in the input layer is used to account for the bias node in the network. As a part of the pre-processing, the filtered data is normalised to have a zero mean and unity standard deviation using the ‘prestd’ function in Matlab. This is to ensure that any data falls within the same constant range. In order to achieve a good model, the distribution of data between the training and testing sets is very crucial. In the present work, the data is divided into 8:1:1 ratio between the training, validation and testing sets using the random division technique available in Matlab. Additionally, the network is trained for a multiple times so that the familiarity with the variation in the data improves. The network, thus developed is accepted based on different parameters, such as the correlation co-efficient between the output and target and root mean squared error (RMSE).
Results and discussion
Preliminary studies were carried out to identify the parameters (among coal blend properties and process parameters) that affect ACT significantly via x–y scatterplots (see Figure 3). Effect of different input parameters on ACT.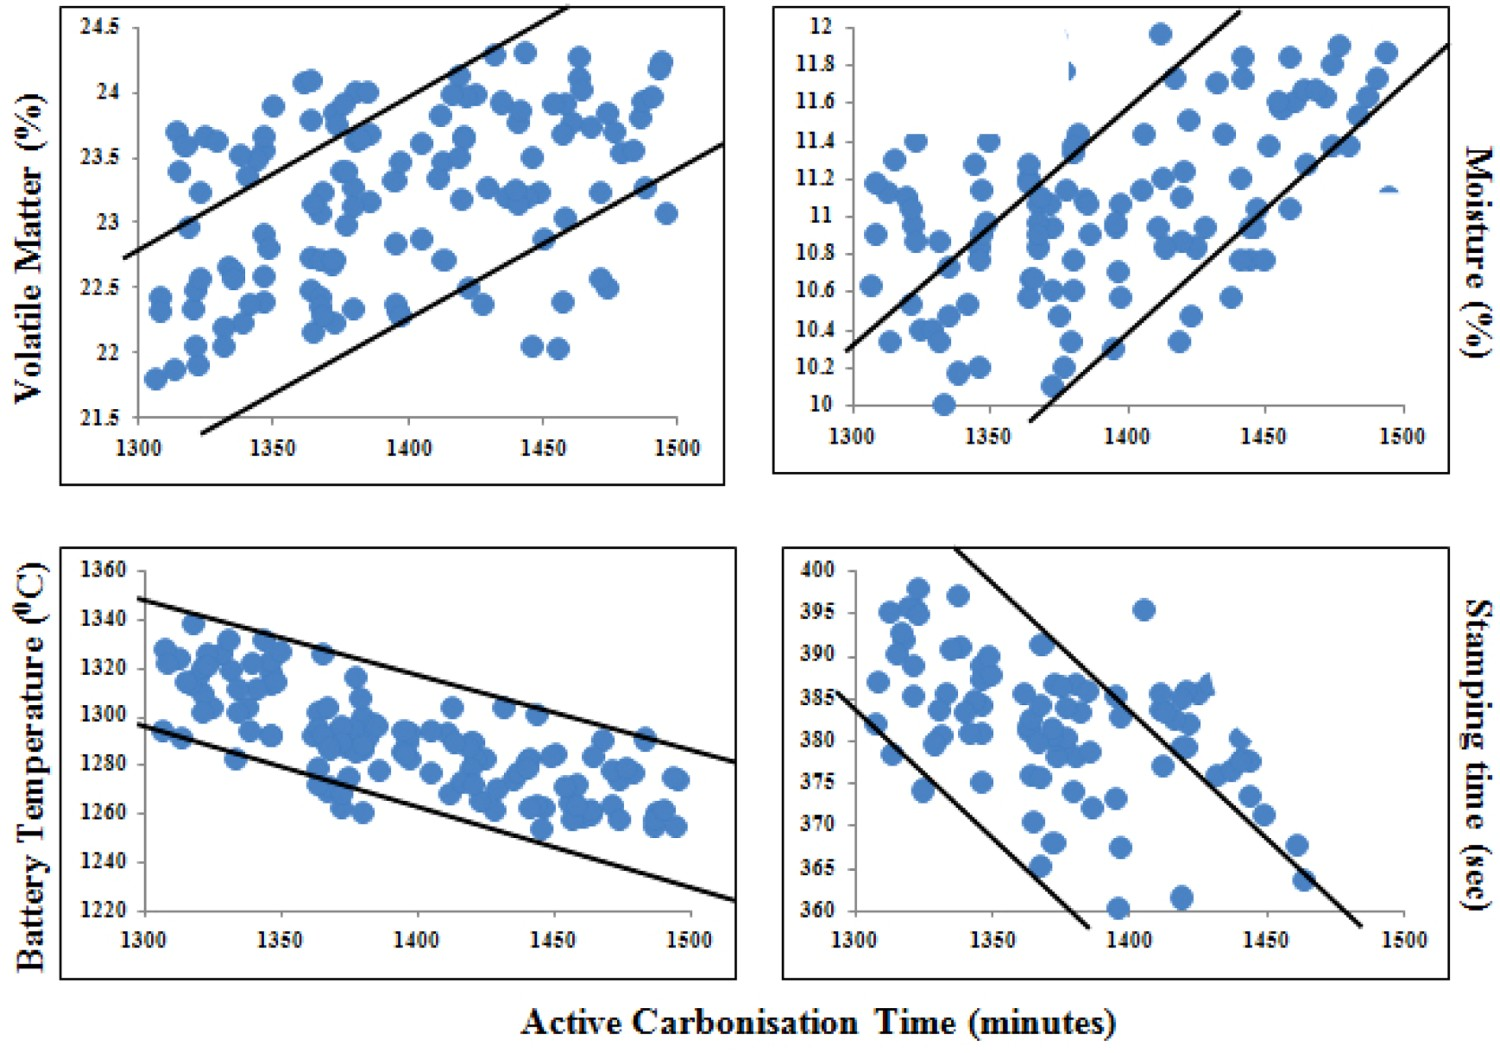
It is observed that volatile matter, moisture content, operating battery temperature and stamping time play a crucial role in altering the ACT while ash content in coal has little or no effect (not shown in Figure 3). However, it may be noted that, no strong mathematical correlation can be established through any of these individual plots. This is obvious due to the fact that the entire process is complex and the overall effect is a collective contribution of the parameters. But still, the strong trend observed through these plots is indicative of the possible effects these parameters create. For example, an increase in the volatile matter or moisture content leads to an increased ACT while the battery temperature and stamping time have an inverse effect.
With these results as the pretext, different types of linear and non-linear analysis (as afore mentioned) are performed in STATISTICA 14.0 on the selected parameters (volatile matter, moisture, battery temperature and stamping time) to obtain the collated effect on the ACT. Subsequently, carbonisation time is also predicted using ANN. It is interesting to observe that, a non-linear predictive model obtained using STATISTICA suffices for most trial cases.
Regression analysis
Mathematical model equations to predict ACT using different statistical techniques.
Note that, VM and Moist indicate the volatile matter and moisture content in the coal blend considered while tstamp and Tbatt correspond to the stamping time and operating battery temperature, respectively. In addition, bp is the break point in piece-wise approximation and amounts to 1408.7 min, in the current analysis. The higher magnitude of the correlation co-efficient and the lower RMSE values make the model equation obtained using piece-wise approximation a preferred choice. This is also supported by the scatterplot between the observed and the predicted values (refer Figure 4). A plot between observed and predicted values of ACT using piece-wise approximation.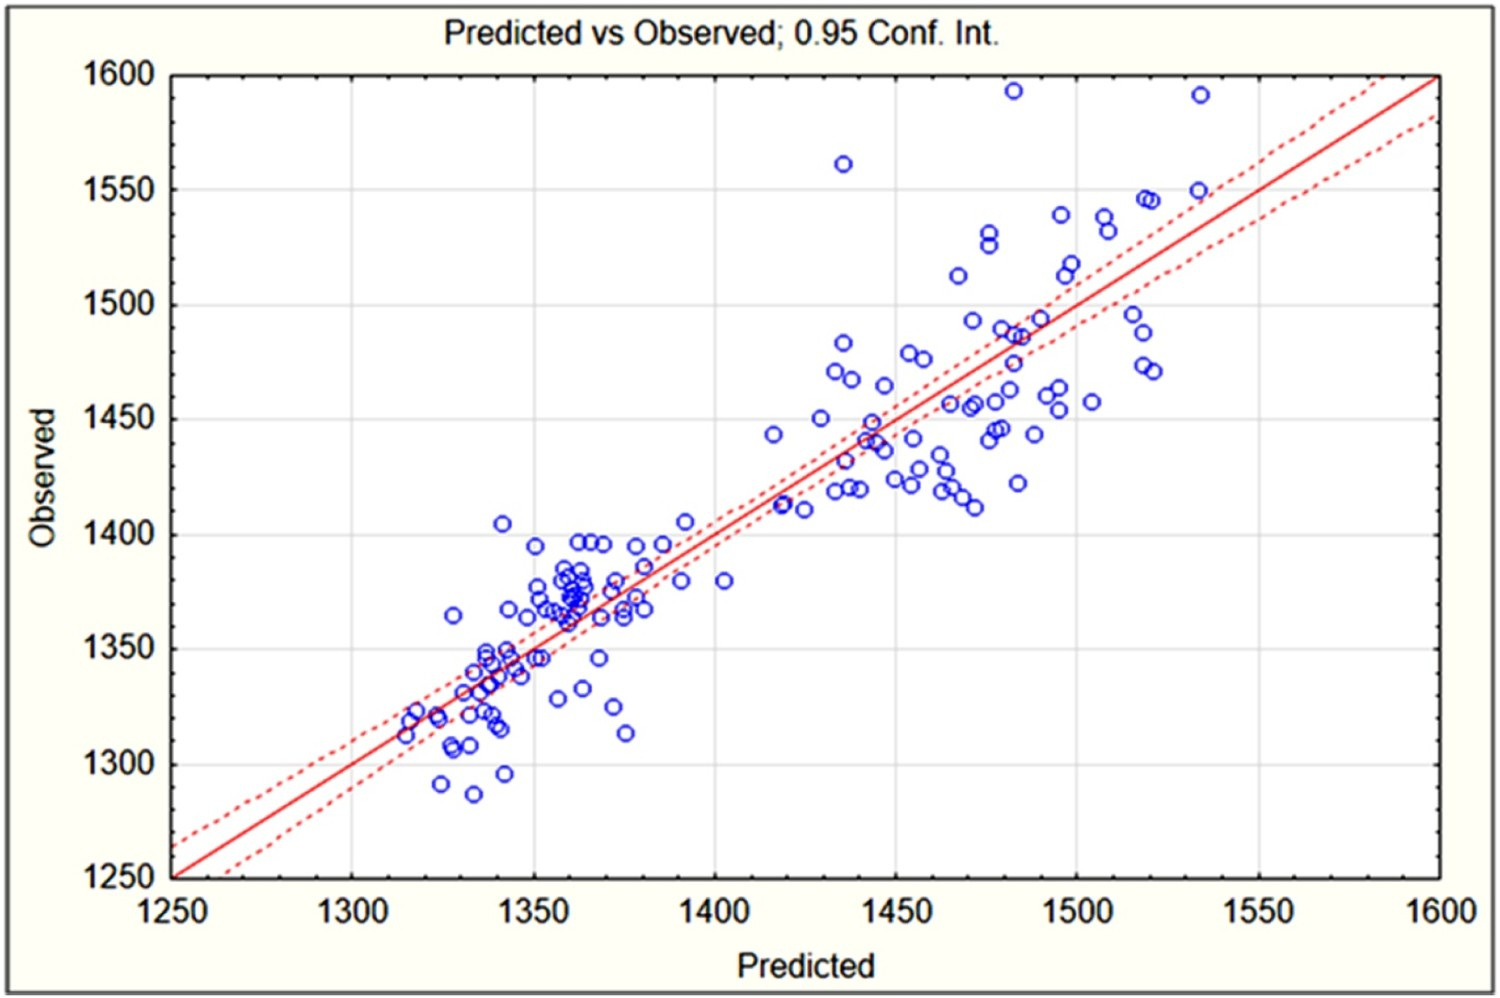
It is noteworthy to mention that, the difference between the observed and the predicted values of ACT is minimal for ACT < bp.
Artificial neural network (ANN)
Different neural network architectures with R 2 and RMSE values.
Similar to the node combination, [5 12 9 1], larger number of nodes in the hidden layer yield a R
2 ∼ 1. However, these networks tend to become over trained and fail while predicting any unknown data. In view of obtaining a generalised and robust network, the overall predictability of the network is considered an important criterion while suggesting the final model. The network corresponding to 2 hidden layers with 10 nodes each ([5 10 10 1]) is considered a preferred choice due to a consistently high R
2 value for all the data sets and a lower RMSE. The plot between the observed and the predicted values (obtained from MATLAB 7.0) for the validation and test data is depicted by Figure 5. A plot between observed and predicted values of the validation and test data using ANN.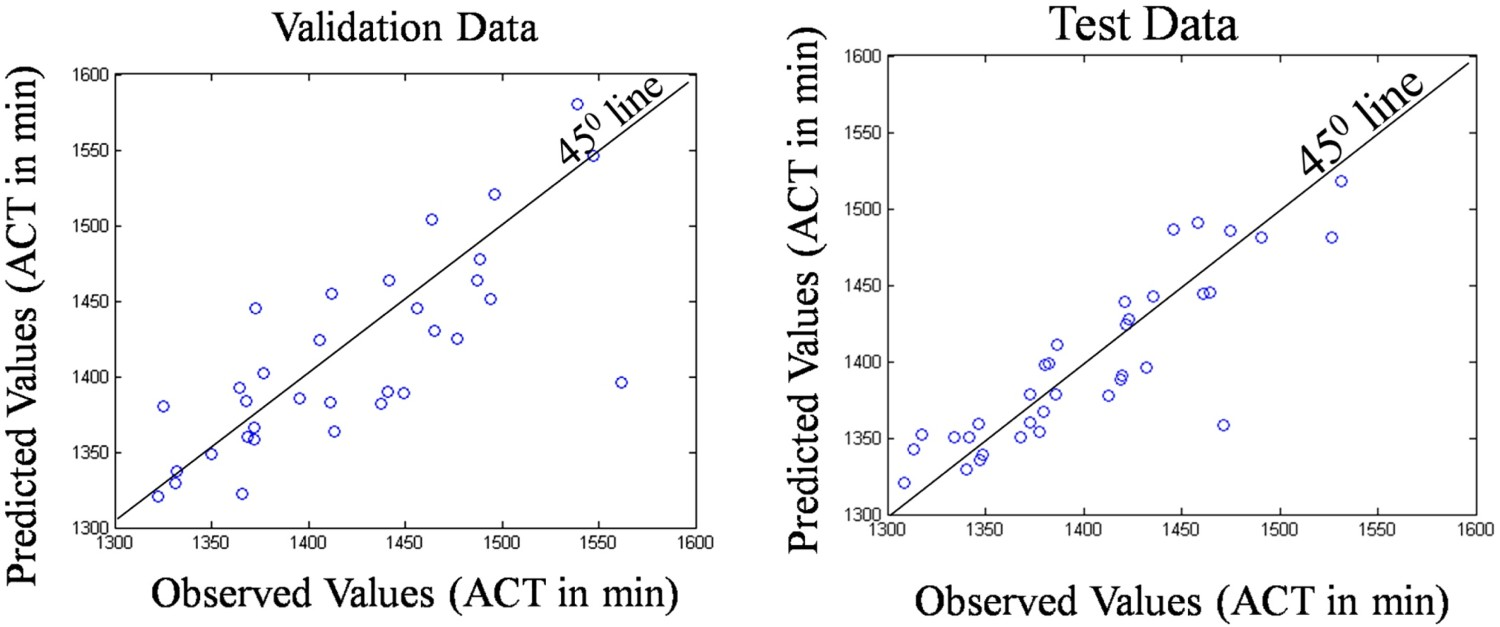
ANN vs. piece-wise regression
A detailed description of the data analysis via piece-wise regression and ANN is explained in the previous sections. It is interesting to observe that, the statistical performance of both the techniques is almost on par with each other. However, in order to extend the practical applicability of the developed model, it is essential to assess their ability in predicting unknown data. To facilitate this, input data pertaining to 10 random days of operation was selected and the performance of the models was plotted against the observed ACT (see Figure 6). Comparison of the predicted values using different statistical techniques.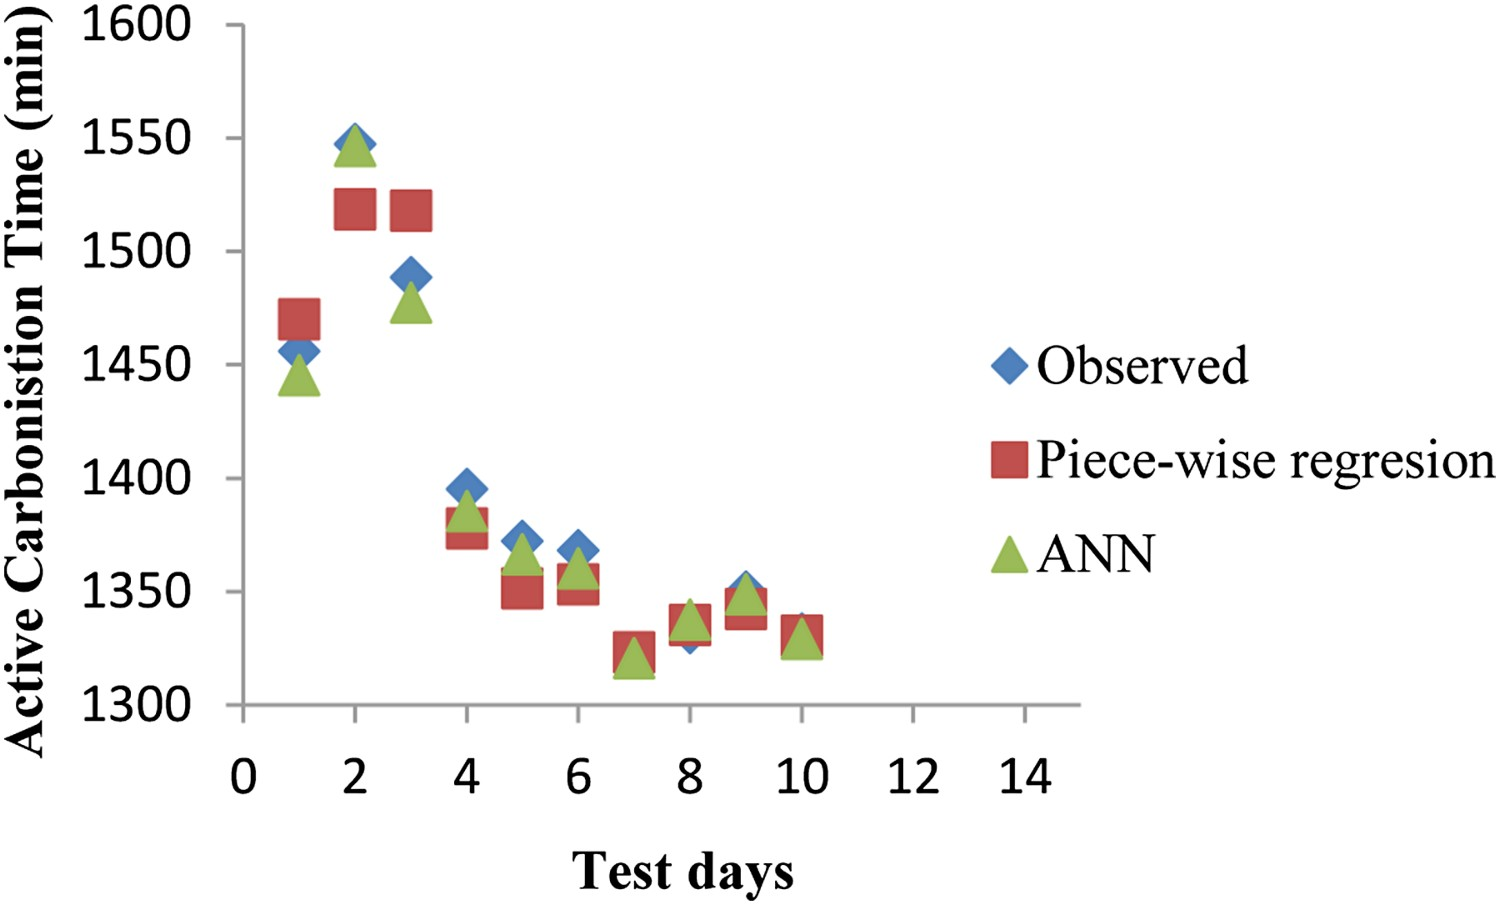
It may be noted that, under the considered test cases, both the statistical techniques predict the observed values almost accurately. However, it may be observed that, the prediction of the active carbonisation time using the piece-wise regression technique deviates from the observed values by approximately 1–3% for a few cases, specifically for ACT > bp (=1408.6 min). As afore mentioned, the magnitude of deviation exhibited by piece-wise regression may be expected to vary significantly around the break point (bp). In contrast to this observation, the model developed via ANN is almost foolproof at all instances.
Conclusion
The prediction of carbonisation time, given the coal blend properties and the operating parameters possess a huge benefit potential in terms of managing the production cycle and energy conservation while maintaining the coke quality. The data sets obtained from the coke plant (Battery 10 and 11) of Tata Steel were used for developing statistical models for this prediction. Among the numerous statistical techniques available, the model developed using piece-wise approximation and ANN predicts the ACT in the most effective way. It is noteworthy to mention that, piece-wise approximation has an edge over the ANN due to the explicit availability of the model equation. This would enable a better understanding of the effect of process parameters on the ACT. However, this model tends to deviate from the observed value, although by a small amount, for cases where the ACT is around or beyond the break point (1408.6 min). As stated above, the statistical model developed using ANN is consistently able to predict the ACT quite accurately. Therefore, the ANN model with 10 nodes each in the two hidden layers may be a preferred choice in terms of the accuracy of predicting the ACT.
Footnotes
Acknowledgement
The authors would like to thank Mr Ashutosh Bhushan, Process Technology Group, Tata Steel Ltd. and Mr Kumar Malayaz, Sr. Manager, Process Control, Tata Steel Ltd., for their support during the course of the work.
Disclosure statement
No potential conflict of interest was reported by the authors.