
Abstract
The following study investigated the dust accumulation in the bustle pipe of the shaft furnace with Areal Gas Distribution (AGD) through physical and numerical simulations. Although the experimental and numerical results were obtained from different-sized furnaces, the results had a similar tendency, where an initial dust deposition zone formed in the packed bed located in front of slots 8–12. The growth velocity of the deposition zone became larger than the descending velocity. It then spread upwards, to plug the slots, until the dust accumulation was formed. The gas velocity in the bustle pipe decreased after passing the AGD beam due to nearly 60% gas that went into the furnace through the AGD inlet. This was the primary cause for the dust accumulation in slots 8–12. Both the physical and the numerical results showed that when the blast volume increased, it effectively reduced the dust flux in each slot and decreased the clogging effect.
Introduction
Traditional blast furnace ironmaking process is the most important liquid iron producing technology. It has a long history and has evolved into a high energy efficient reactor. This process uses coke as the major fuel to reduce the iron ore. The coke making oven is a major CO2 contributor and high-quality coking-coal resources are becoming drained. This has led to the development of various alternative ironmaking processes, such as COREX, FINEX, and HIsarna. These are designed to require less coke, or even none at all [1,2]. The COREX is a smelting reduction process that was initially developed by Siemens VAI as a cost-efficient and environmentally friendly method of producing hot metal from iron ore and coal. It consists of a two-stage process with a shaft furnace (SF) and a melter gasifier (MG) [3–5], as shown in Figure 1. In recent years, the COREX-3000 has the largest plant with a design production capacity of 1.5 million tons of hot metal per year and has realised successful industrial-scale production. However, the COREX-3000 had many technical problems, because of its novelty on the production line. These problems concentrate in the upper pre-reduction SF, including uneven gas distribution, low metallisation rate, and high fuel consumption [6]. All these problems are directly related to insufficient centre gas distribution. Schematic diagram of the COREX process.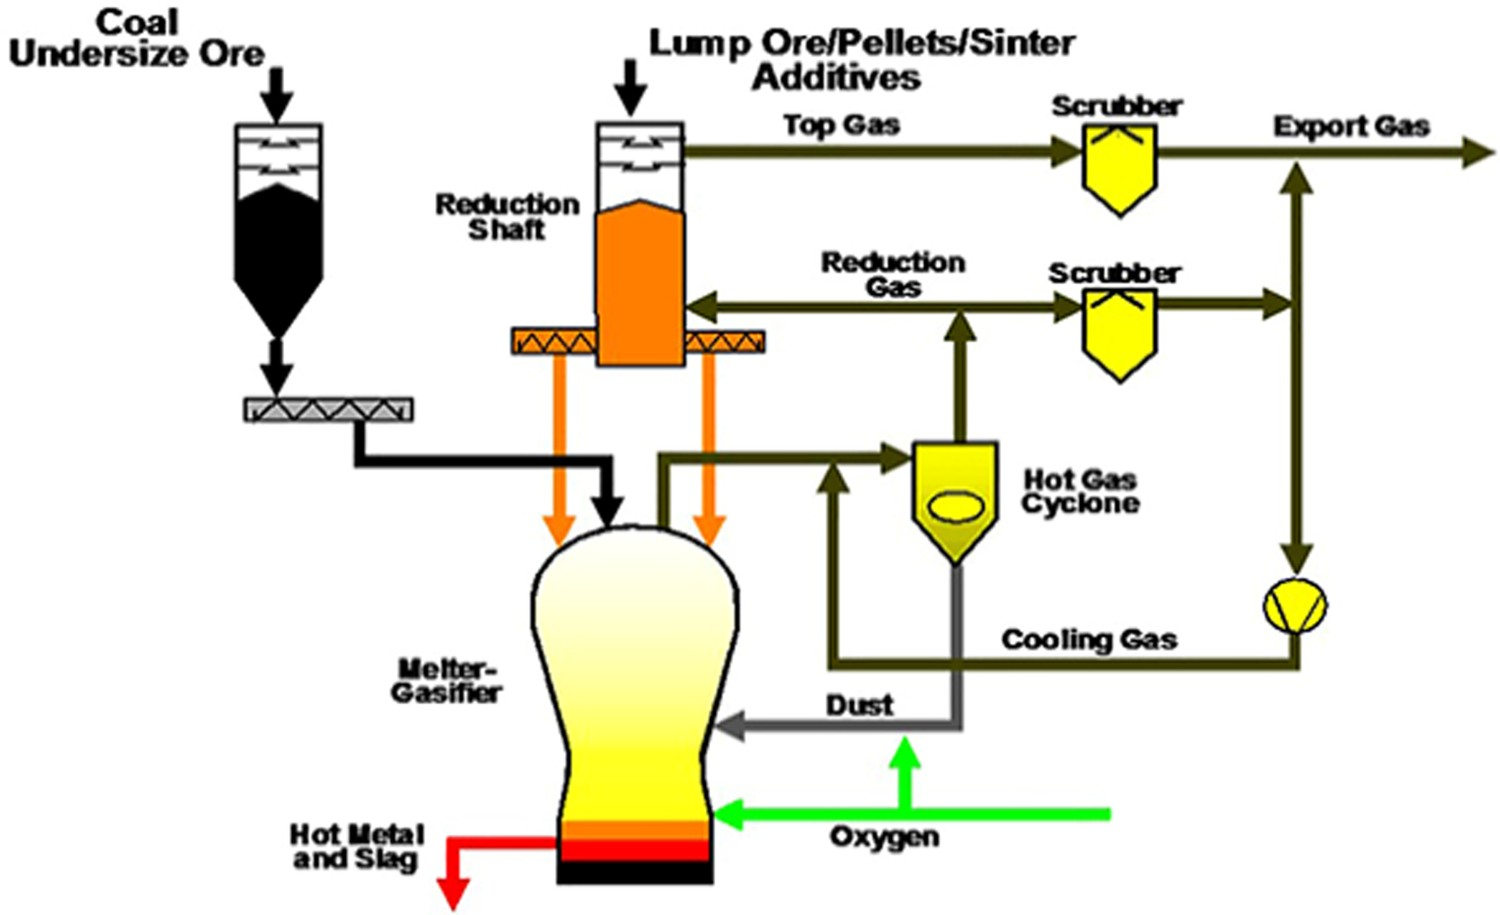
In order to improve the penetration depth of the reducing gas, the Areal Gas Distribution (AGD) was proposed and tested in the shaft furnace of the second COREX-3000. In this design, two beams are installed and the reducing gas could be blasted into the shaft centre via the triangle-shaped void, which is generated downstream of the AGD beams, due to the solid flow [7,8]. Although the AGD technology has been proven to effectively promote central gas distribution and improve the reduction rates in the plant, it led to dust accumulation in the bustle pipe [9,10]. The generated gas in the MG inevitably carries much dust, see Figure 1. The generated gas then enters the hot gas cyclone for dedusting. The large dust is removed and the reduction gas is considered roughly cleaned. A dust load of 20 g/m3 is blasted into the shaft furnace through the bustle pipe. The initial gas distribution is complicated and tiny dust particles could be deposited in the packed bed, which would form a blockage near the slot. The blocked region may continue to grow, spreading into the bustle pipe. This directly affects the smoothness and performance of the SF. Although the gas distribution [11,12], the mass and energy transfers [13], the solid flow, and the segregation behaviour [14] in the SF with AGD have been studied in detail, the dust accumulation in the bustle pipe of the SF has not been studied. There have been experimental and numerical studies that explain gas-fine flow and fine particle blockage in a packed bed [15–20], but the understanding of the gas-fine flow in the SF bustle pipe and the initial position of the dust accumulation remains unknown.
In this work, physical and mathematical modelling were performed for the gas-dust flow in the bustle pipe of SF in order to better understand dust accumulation behaviour. The initial chocking slots in the bustle pipe were identified. The effect of the blast volume on dust accumulation was studied. These findings are expected to be useful for the control and optimisation of the shaft furnace operation.
Experimental
The similarity theory states that the geometric similarity is initially guaranteed. A 1/20 scale semi-cylindrical model of the COREX-3000 shaft furnace was used to observe the dust accumulation phenomenon in the bustle pipe. Figure 2(a) depicts the schematic diagram of the experimental apparatus. The shaft body was composed of perspex. Particles were charged into the model from the top to maintain a certain bed height. They were extracted from five screw dischargers. The rate of the particle extraction was controlled by induction motors. Powders were supplied from a dispenser at a constant rate. The powders were introduced to the gas stream before the inlet. Gas was added with a blower. The gas flow rate was measured with a flow meter. The bustle pipe of the cold model had 2 AGD inlets and 40 slots, as shown in Figure 2(b). The two-phase flow of the gas and the powders were initially blown into the bustle pipe. They then flowed into the SF through the AGD inlets and slots. A schematic diagram that illustrates the gas flow from the bustle into the furnace is shown in Figure 2(c). The evolution of the dust accumulation was recorded with cameras in the quarter region of the bustle pipe. Schematic diagram of the semi-cylindrical apparatus (a), outside view of the bustle pipe (b), and schematic diagram of the gas distribution in the bustle pipe (c).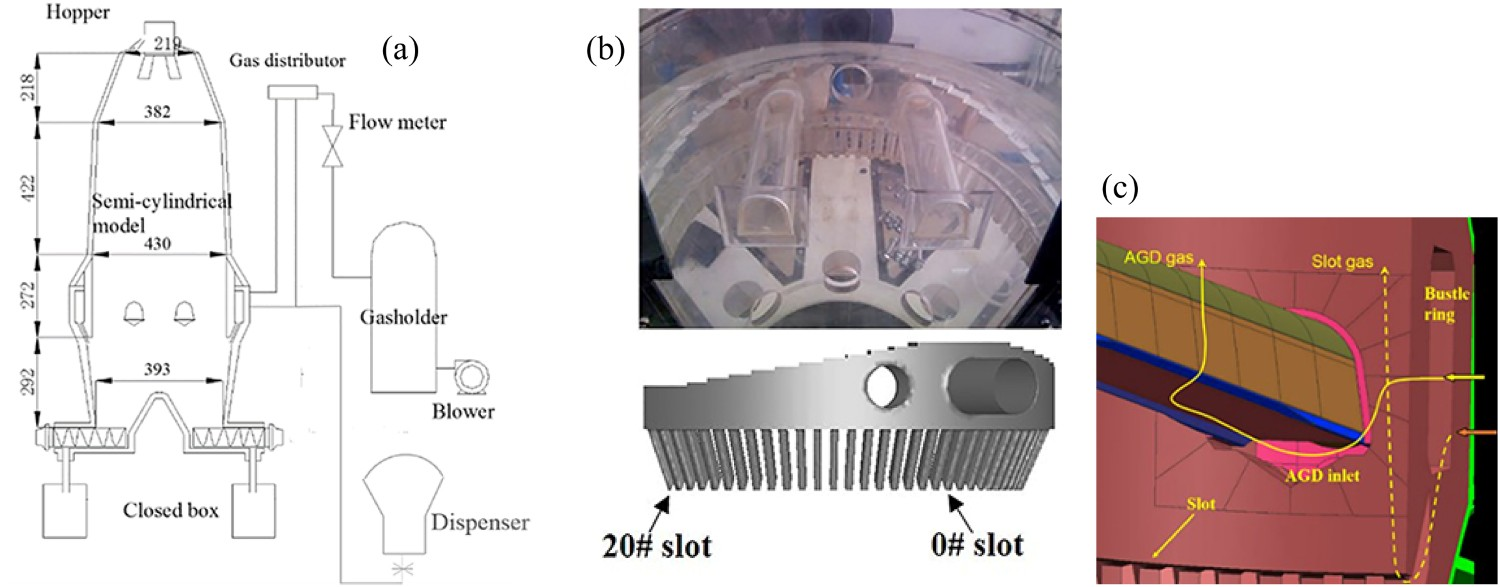
The dynamic similarity between the model and the prototype was successful. This was performed by considering the various dominating forces, such as inertial, gravitational, and viscous forces. The Reynold number was correlated between the inertial force and the viscous force. These numbers should be set in the same state (laminar or turbulent). The inertial and the gravitational forces were primarily responsible for the fluid flow. These were taken into consideration when determining the model parameters. The Froude number was the most important non-dimensional parameter and was made equal in the prototype and in the model. The physical properties, particularly the repose angle of corn (diameter: 3 mm, bulk density: 720 kg/m3, repose angle: 36°) were approximately equal to the average of the coke (bulk density: 500 kg/m3, repose angle: 43.5°) and the pellet (bulk density: 2000 kg/m3, repose angle: 32°). Grains of corn were used to simulate the burden materials. The glass beads (diameter = 90 μm, density = 2200 kg/m3) had nearly the same gravity of the dust in the actual SF (75 μm diameter) that were used in the current experiments.
Mathematical model
Because of the complexity of the flow and mass and heat transfer of gas–solid phases in a shaft furnace, the following assumptions are made for establishing the mathematical model: As the mean descent velocity of burden is extremely small compared with that of reduction gas, the furnace is treated as a fixed bed; The effect of chemical reaction and heat transfer on gas flow are neglected;
The Ansys-Fluent 13.5 commercial software was used in the study. The dust motion was calculated by using the discrete particle model (DPM). The basic mathematical model equations that described the phenomena under examination are as follows:
Continuity equation:
Momentum equation: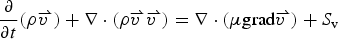
Turbulent kinetic energy k equation:
Turbulent energy dissipation rate ε equation:
The constants used in the k-ε model were: C1ε = 1.44, C2ε = 1.92, C μ = 0.09, σ k = 1.0, and σ ε = 1.3.
The trajectories of the dust were predicted by integrating a force balance on the dust. This force balance equated the dust inertia with the forces acting on the dust, and is shown as follows: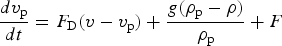
Here, μ is the molecular viscosity of gas; C D is the drag coefficient of the dust.
The geometry and the mesh system of the shaft furnace with AGD beams are shown in Figure 3. A uniform velocity for the gas-dust was given at the inlet based on the blast volume. The blast volume is obtained through the product of gas consumption of per iron and production rate of the COREX process. The dust particles with the same properties as the actual production (sizes ranged from 10 to 90 μm, with a density ρ = 3800 kg/m3) were injected into the shaft furnace from the inlet. It was assumed that the particles were reflected when they came in contact with the walls, escaped once reaching the top outlet, and exited the system once they enter the bottom of the domain. The furnace geometry and the mesh system.
Results and discussion
Characteristics of dust accumulation
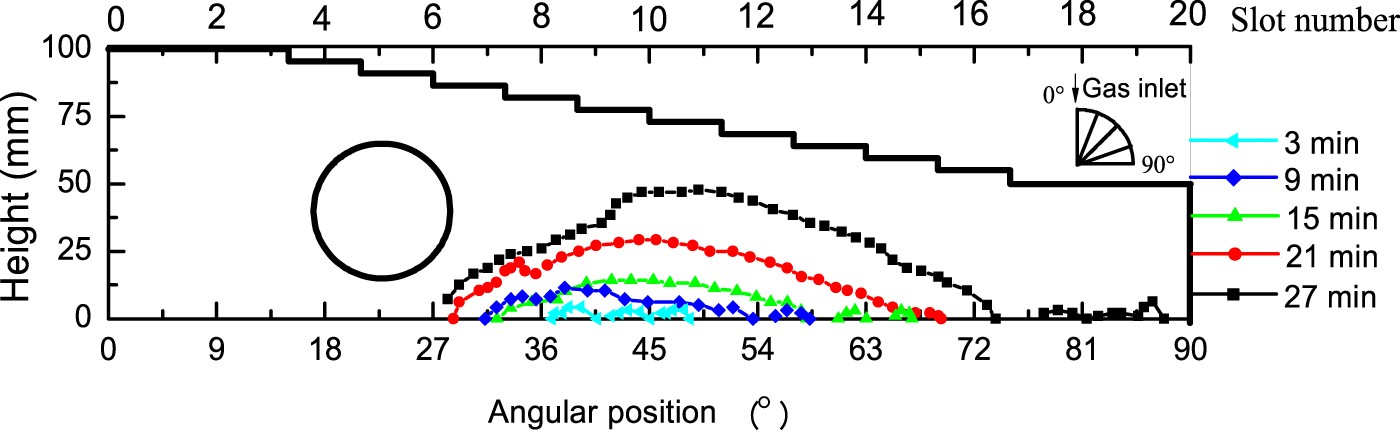
Typical experiment results are shown in Figure 4. The corresponding profile of the dust accumulation region in the bustle pipe is shown in Figure 5. In this case, the blast volume and discharging rate was 65 Nm3/h and 5.83 r/min. This represented a blast volume of 235,000 Nm3/h and a melting rate of 120 t/h in the actual furnace operation. The slot located below the gas inlet was numbered 0# and the slot located farthest from gas inlet was number as 20#. The angle between the two adjacent slots was 4.5°. There was a large amount of dust deposited in the packed bed in front of slots 8–12 at t = 3 min. As the dust was continuously injected, the voids of the packed bed continued to be filled with the dust. The initial deposition zone was formed. As the growth velocity of the deposition zone became larger than the descending velocity, the dust deposition zone spread upward and plugged the slot. The 8–12# slots were filled completely by the dust at t = 9 min. The dust accumulation area was seen on the bottom of the bustle pipe. The accumulation area continued to grow in the bustle pipe as time went on, until the dust particles developed into a mountain-shaped area. The peak of the mountain-shaped area expanded to the top of the bustle pipe. The left corner of the pile expanded to the distal end. This resulted in 14# and 15# slots becoming blocked by dust at t = 24 min. Owing to the limited capacity of the powder spray in this study, the dust injection stopped at t = 27 min. This was after the initial clogging position and the evolution of the dust accumulation process was determined. Distribution of powders in bustle pipe zone at blowing rate 65 Nm3/h, discharging rate 5.83 r/min. Profile of the dust accumulation at a blowing rate of 65 Nm3/h, discharge rate of 5.83 r/min.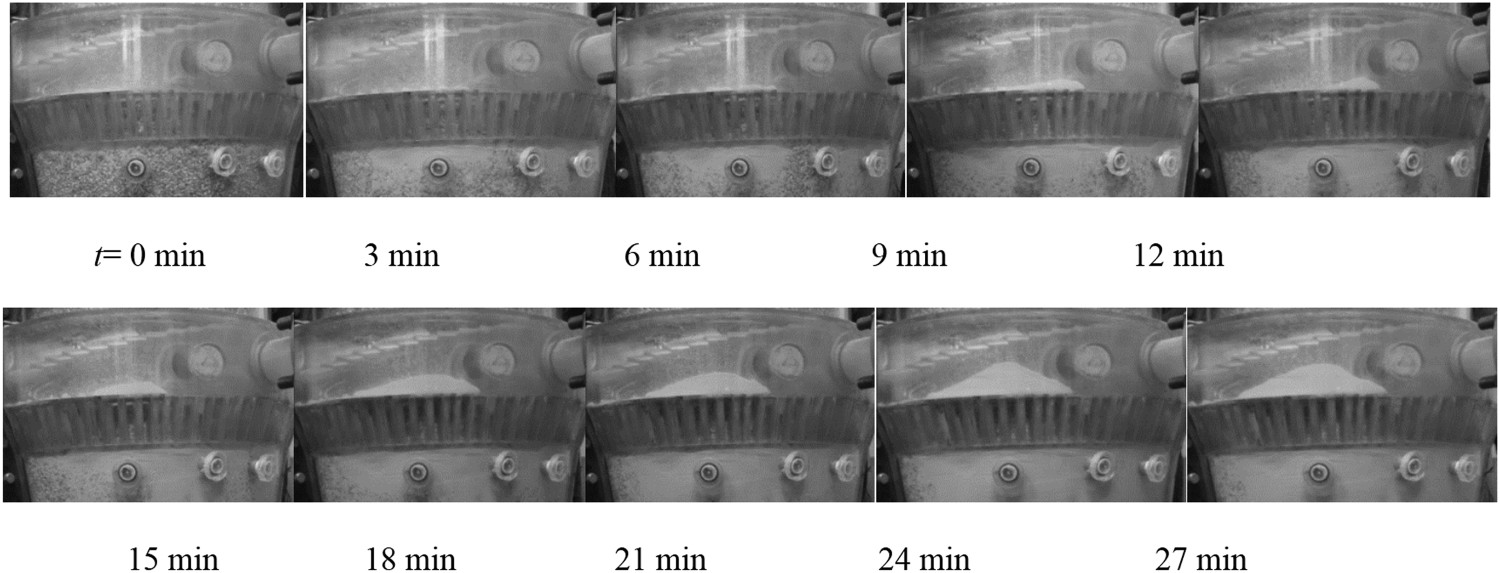
The mathematical modelling of the dust movement in the bustle pipe of shaft furnace was used as a good visualisation tool. Figure 6 shows the dust distribution in the shaft furnace under a blast volume of 235,000 Nm3/h. The distribution of the dust was discussed in the quarter region of the bustle pipe as the dust was injected into the bustle pipe through the left half of the gas inlet. A majority of the dust entered the shaft furnace through the AGD inlet and followed the gas flow upward. The dust deposits were predominantly distributed in the slots immediately after passing the AGD. The dust distribution is detailed in Figure 7. It can be seen from Figure 7(a) that as the dust diameter increased, the dust deposition rate increased. The dust diameter d < 30 μm had a ratio 4.7% of the deposited dust. When the diameter was d > 50 μm, the ratio reached 47.8%. This can be easily explained that larger diameter results in a higher gravity, which could increase the inertia of the downward movement. Thus, in COREX shaft furnace practical production, the larger diameter dust would induce the blockage of the packed bed near slot. The distribution of deposited dust from the various slots is shown in Figure 7(b). The proportion of deposited dust in the various slots was uneven when the AGD beams were added. The ratio in the 8–12# slot regions was higher than that in the other slots. About 57.34% of the deposited dust appeared in the packed bed in front of 8–12# slots. This indicated that the choking of the gas slots could have initially started in the 8–12# slot positions. This phenomenon was consistent with the experimental result seen in Figure 4. The deposited dust concentration in the 8–12# slots is likely caused by the variation of the gas velocity in the bustle pipe. Trajectory of the dust in the shaft furnace. The proportion of deposited dust with various sizes (a), and the ratio of deposited dust in various slots (b).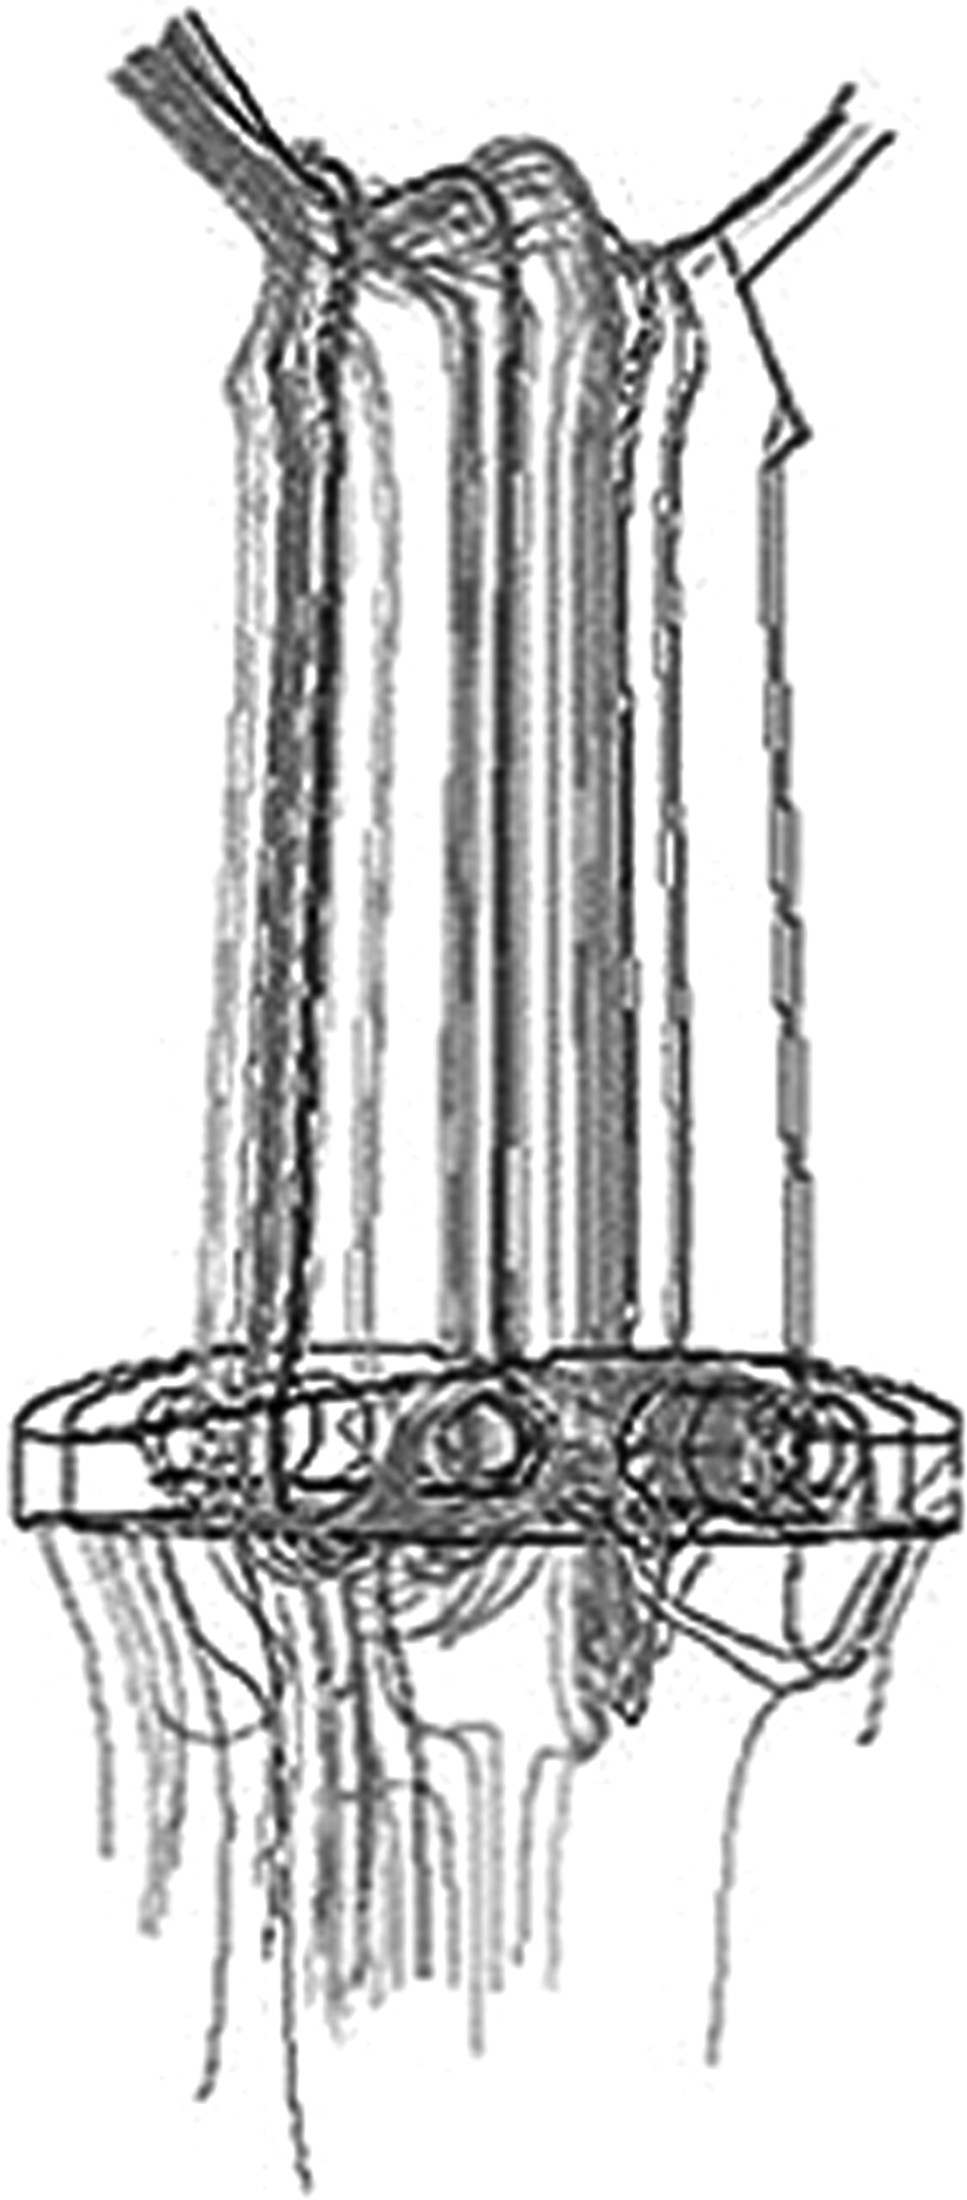
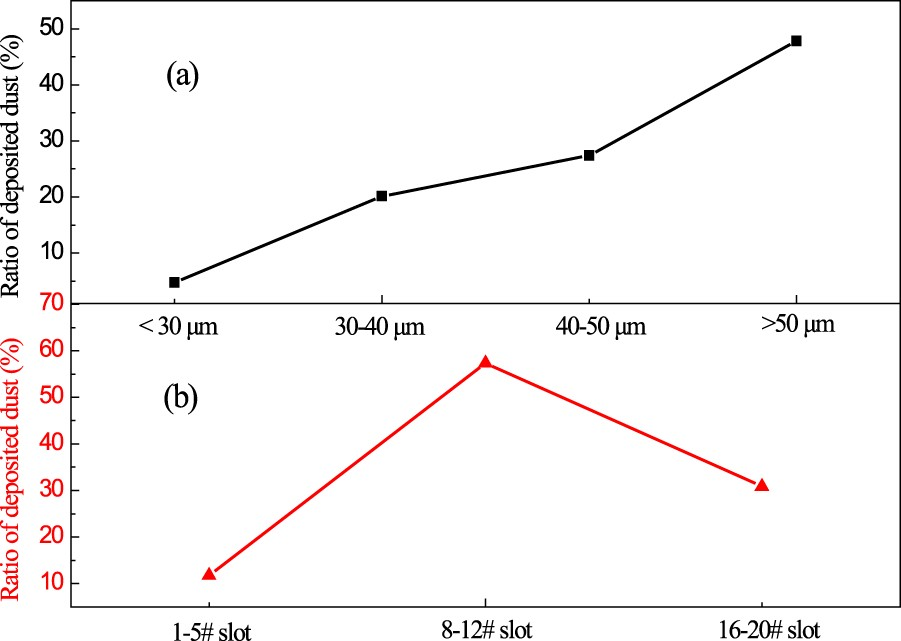
Figure 8(a) depicts the gas vector flow in the bustle pipe. When the AGD was added, the gas vector flow becomes more complicated, particularly around the AGD tube. After the gas passed around the top of the AGD tube, it moved along the tangent of the tube. The main direction of the gas vectors around AGD tube points began at slots 8–10#, where the initial zone for dust particles accumulation was located. Details of the gas velocity magnitude distribution in the bustle pipe are shown in Figure 8(b). The average velocity in the bustle pipe before AGD was 11.06 m/s. After the gas passed through the AGD beams, the gas velocity in the bustle pipe sharply decreased. This was due to the nearly 60% gas flow into the furnace through the AGD inlet. The phenomenon was also found in Ref. [11,12]. The average velocity in the 8–12# slot regions was 3.58 m/s. This low velocity resulted from an inability to entrap the dust in the bustle pipe. Some dust escaped from the gas stream and settled on the bottom of bustle pipe, while other dust particles flowed with the gas into the packed bed through the slot. Owing to low-velocity gas-dust flow in packed bed, the percolation diffusion capacity of the dust is weak. Further considering the interaction of dust in the voids of packed bed, the low-velocity dusts are easily blocked in the packed bed in front of the slot. It should be pointed out that although the gas velocity in slot 16–20# is nominal, the dust flux in these regions is small. Thus, there is less dust accumulation in slot 16–20# during initial steps. Gas vector flow (a), and velocity magnitude (b) in the bustle pipe.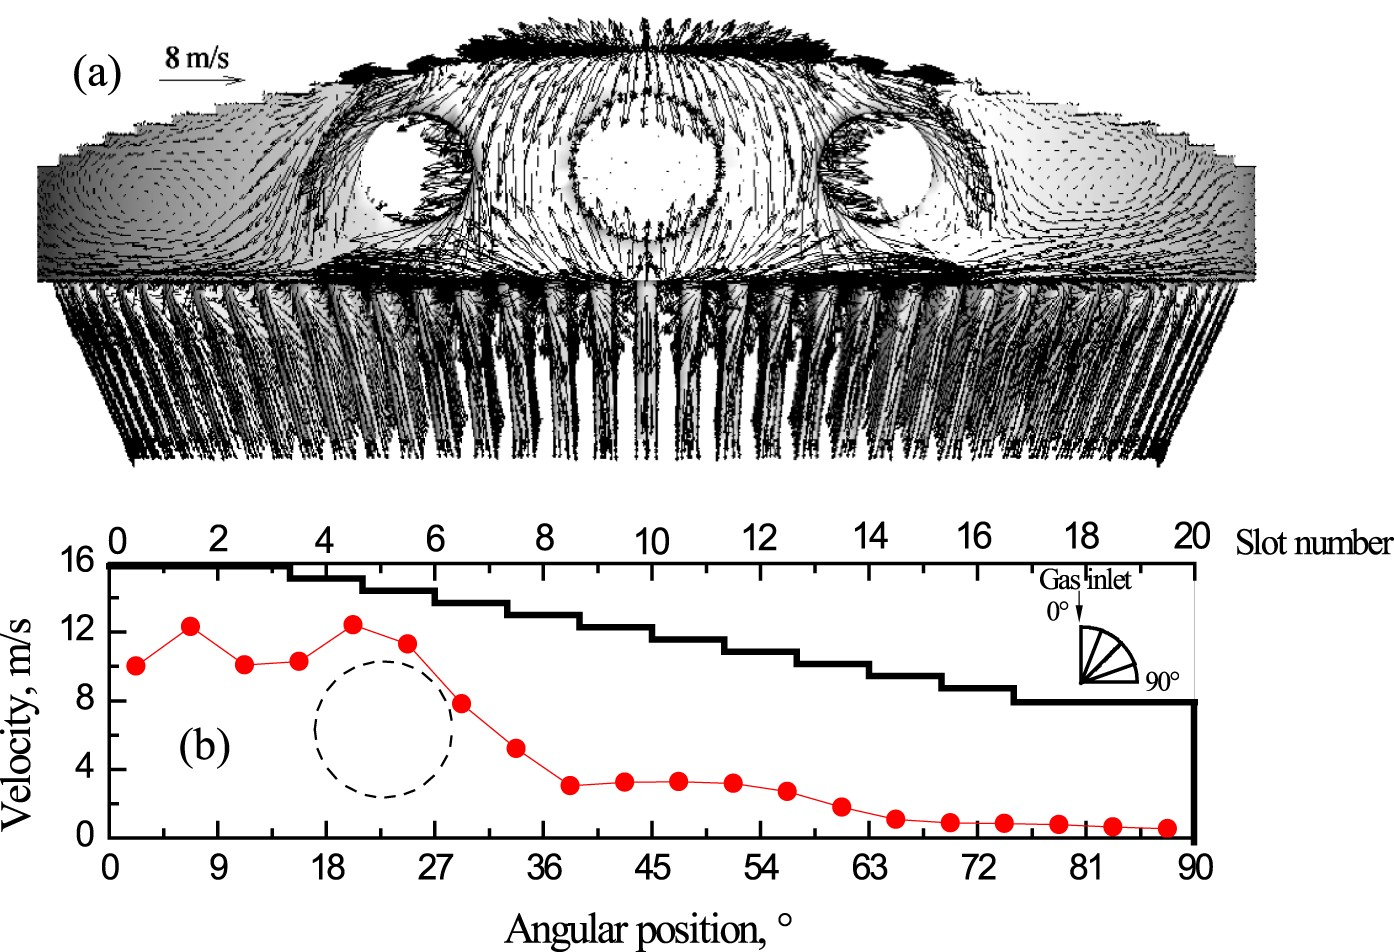
Effect of blast volume
The influence of the blast volume on dust accumulation was initially discussed in our physical simulation. Figure 9 depicts the dust distribution at t = 2 min under various blast volumes. The larger the blast volume was, the further the dust was blown in the bustle pipe. The initial area of the dust in the packed bed increased as the blast volume increased. When the blast volume was large, such as Q = 78 Nm3/h, the dust was able to flow into the packed bed through the furthest slot. The wider the dust distribution was, the smaller the dust flux in each slot was when the dust flow rate remained the same. This suggested that the increased blast volume was effective at reducing the dust flux in each slot, while decreasing the clogging effect. Dust distribution in packed bed at t = 2 min when the discharging rate was 7.29 r/min for various blast volumes: (a) Q = 52 Nm3/h, (b) Q = 65 Nm3/h, and (c) Q = 78 Nm3/h.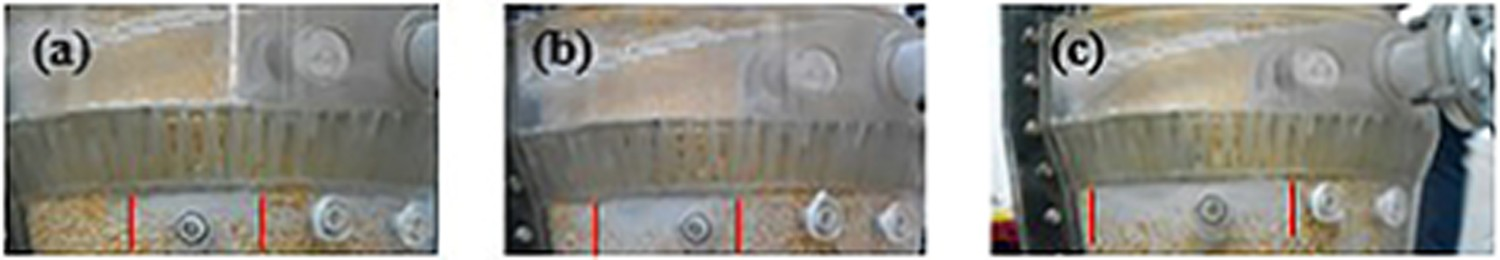
Figure 10 shows the evolution of the dust accumulation under various blast volumes. There was no dust accumulation observed in the bustle pipe when the blast volume was 78 Nm3/h (Figure 10(a)). This was caused by the smaller dust flux and the larger gas velocity for the gas-dust flow in the packed bed. The dust was able to penetrate deeper into the voids and the dust deposits were decreased. This would result in reducing the upward spreading speed of the clogging zone, and no dust accumulation would be found in the bustle pipe. As the blast volume decreased, the dust accumulation in the bustle pipe was more likely to occur. The dust accumulation was visible in the bustle pipe when the blast volume was 65 Nm3/h. The initial dust accumulation in the bustle pipe ranged from 8# slot to 12# slot. While comparing with the results under the same blast volume as shown in Figure 5, the dust accumulation in Figure 10(b) was relatively small. This was caused by a larger discharge rate. The descending velocity of the dust deposition zone in the furnace increased with the increase of the discharging rate. This meant that the deposition zone was more likely to move downwards, rather than to spread into the bustle pipe. The increased descending velocity of burden near the slots was an effective method that lessened the impact of the dust accumulation. However, this method should be controlled under a certain scope to obtain a sufficient gas–solid reduction reaction. Profile of the accumulation of dust at a discharging rate of 7.29 r/min for the various blast volumes: (a) Q = 78 Nm3/h, (b) Q = 65 Nm3/h, and (c) Q = 52 Nm3/h.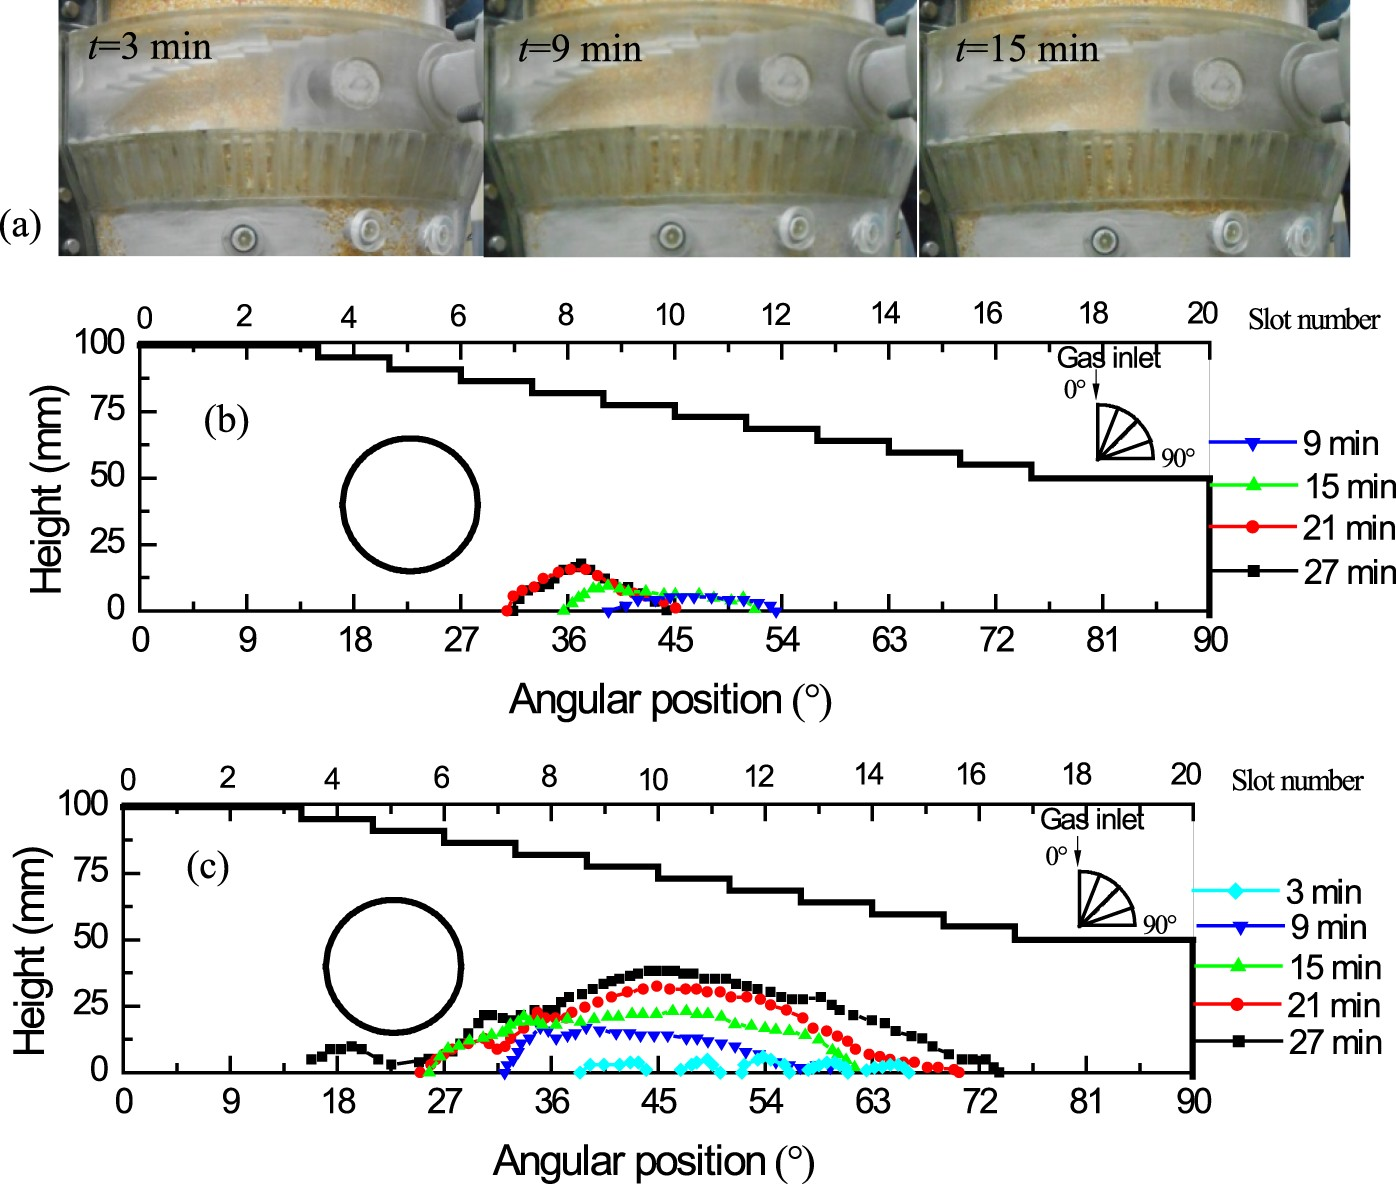
A large amount of dust accumulation on the bottom of bustle pipe was found when the blast volume was decreased to 52 Nm3/h. Dust settled on the bottom platform between the slots in the bustle pipe, beginning at 8# slot. Less dust could enter the furnace through the far-end slots. The dust accumulation in the bustle pipe was distributed from the 7# slot to the 13# slot at t = 9 min. This was larger than that in Figure 10(b) at the same time. Dust was continuously injected and the accumulation area continued to grow in the bustle pipe, resulting in more slots becoming blocked. The final peak of the mountain-like dust accumulation area was located near the 10# slot position.
Figure 11 shows the moving track of the dust in the shaft furnace under various blast volumes. When the blast volume increased from 188,000 to 282,000 Nm3/h, the percentage of the deposited dust to the injection dust decreased from 33 to 27%. Quantitative analysis of the influence of blast volume on the dust deposition rate in different regions is shown in Figure 12. The per cent of deposited dust to the injection dust in 8–12# slots was larger than in the other regions. This indicated that slots 8–12 were the initial position for dust accumulation. The deposition rate in this region decreased from 19 to 16% when the blast volume increased from 188,000 to 282,000 Nm3/h. As the blast volume increased, the gas capacity for the training dust in the bustle pipe increased. The deposition rate in 1–5# slots decreased from 9 to 2%. The deposition rate increased from 5.5 to 10% in the 16–20# slot regions. These results showed a similar tendency that was discussed in our physical simulation, even though the numerical results and the experimental results were obtained from different-sized furnaces. Trajectory of the dust under various blast volumes: (a) 188,000 Nm3/h and (b) 282,000 Nm3/h. Effect of blast volume on dust deposition rate in different regions.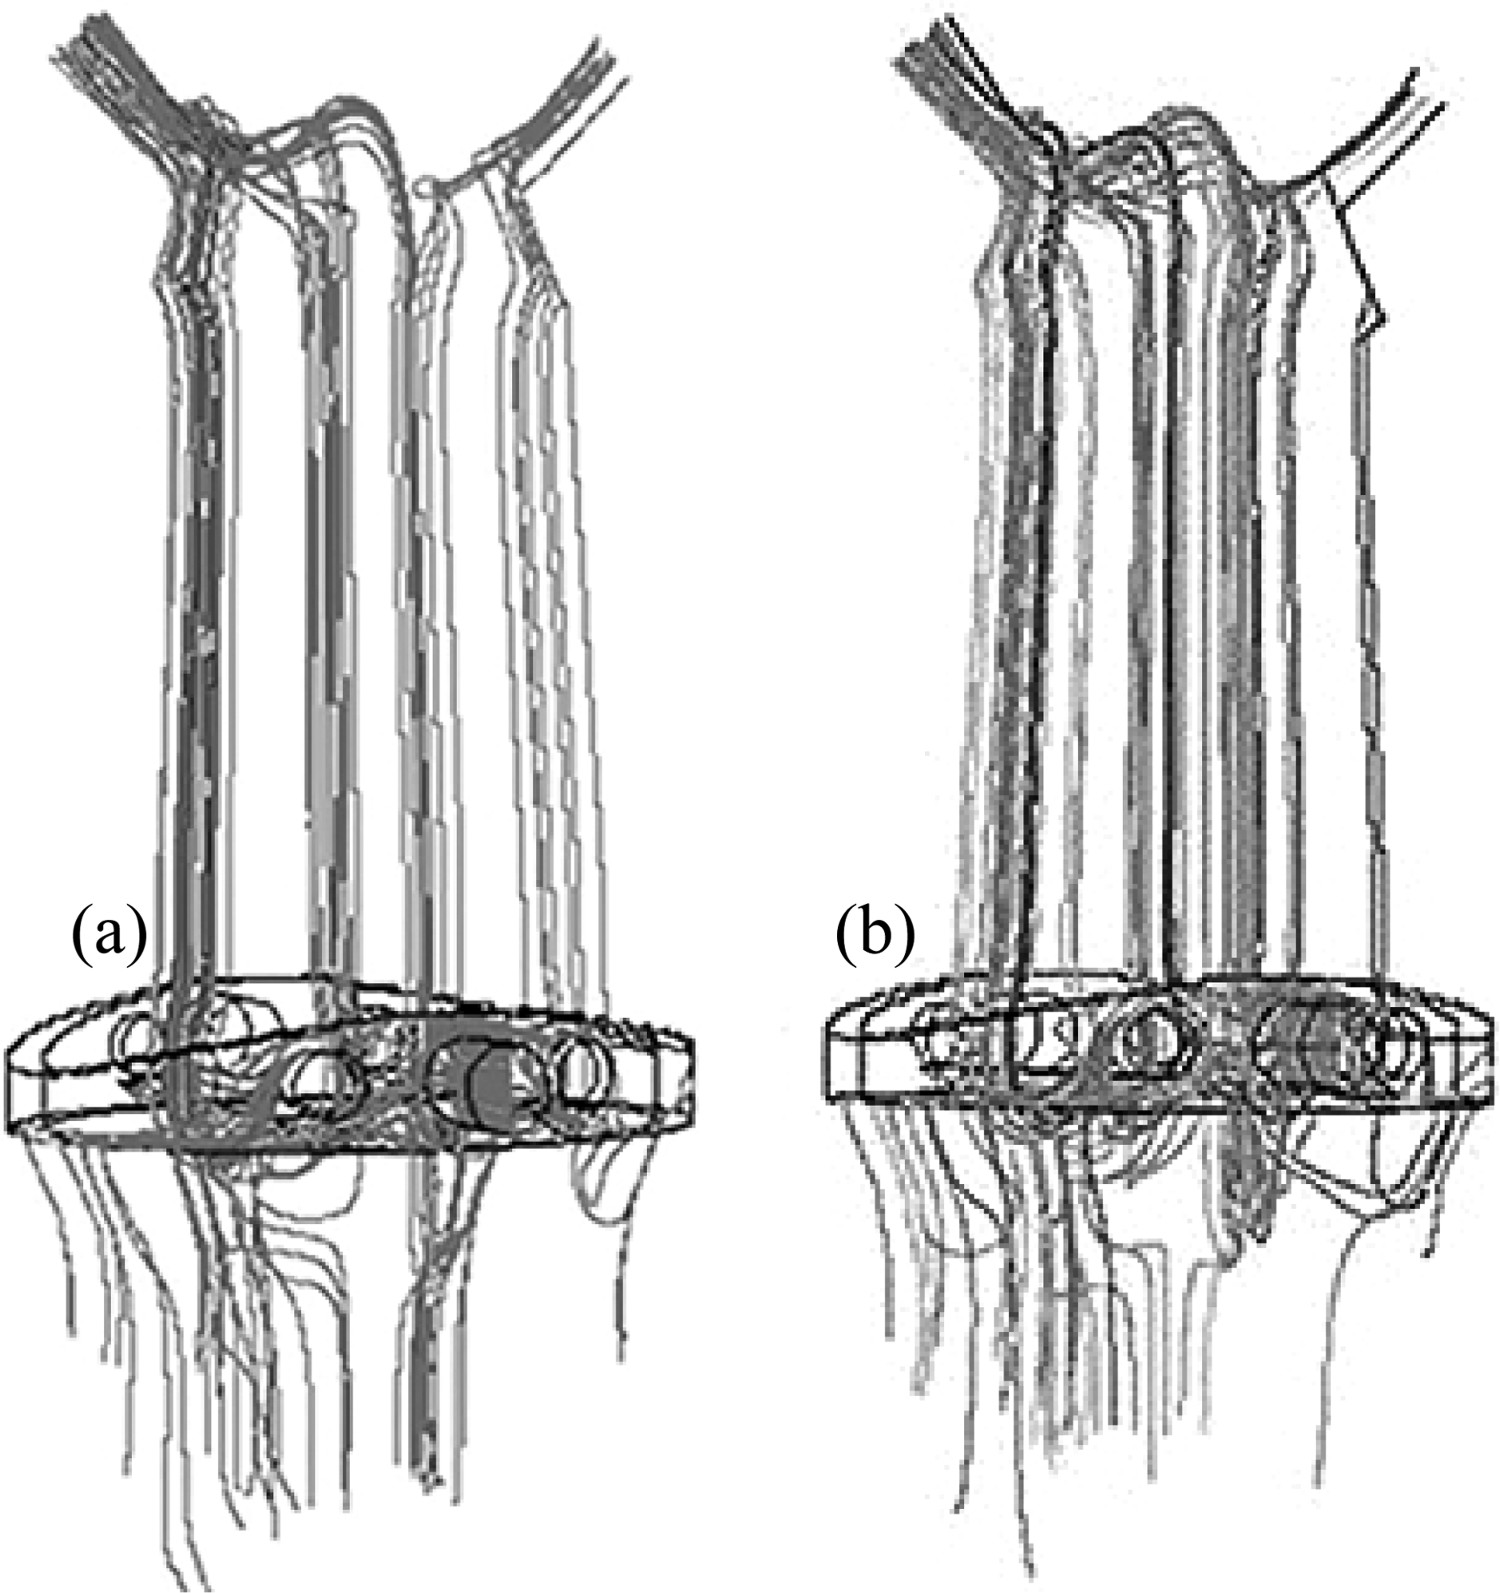

The mechanism of dust accumulation
The mechanism of dust accumulation in the bustle pipe could be described as the installation of AGD that directly affected the gas distribution and the dust motion behaviour in the bustle pipe. After the gas-dust passed the AGD tube, the gas velocity decreased sharply. The inertial effect resulted in a majority the dust flowing into the packed bed through 8–12# slots. The initial deposition zone was formed in front of 8–12# slots. If the growth velocity of the deposition zone was larger than the descending velocity, the dust deposition zone would spread upward and plug the slot. Dust accumulation in the bustle pipe gradually formed as dust was continuously injected. A schematic diagram of the accumulation of dust in the bustle pipe is shown in Figure 13. Schematic diagram of the accumulation of dust in the bustle pipe of shaft furnace.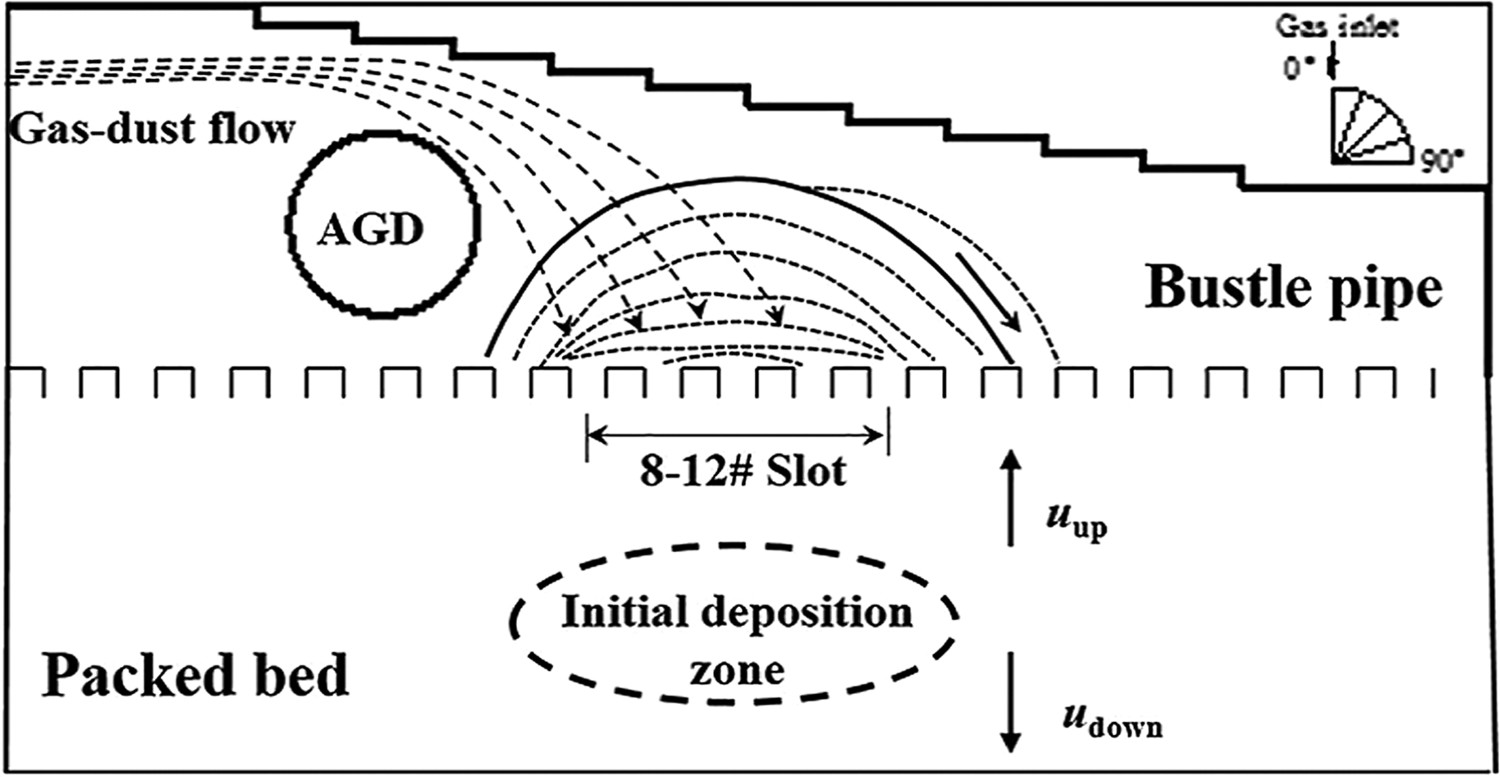
In order to reduce the frequency of dust accumulation in the bustle pipe, additional efforts should be made in at least three ways. The first lies in optimisation the AGD arrangement to reduce the AGD effect. The second is the reduction of the cross-sectional area of the bustle pipe and slot to obtain a high gas velocity. The third is the improvement of the hot gas cyclone efficiency. These efforts could reduce the demand of dust accumulation.
Conclusions
The dust accumulation in the bustle pipe of a shaft furnace was studied by both a physical and a mathematical model. The effect of the blast volume on dust accumulation was investigated. The initial dust deposition zone was formed in front of the 8–12# slots, and the deposition zone spread upwards and plugged the slot when the growth velocity became larger than the descending velocity. Dust accumulation in the bustle pipe gradually formed as dust was continuously injected. The initial dust accumulation in the bustle pipe ranged from the 8# slot to the 12# slot. The gas velocity decreased sharply after passing the AGD due to nearly 60% gas flow into the furnace through the AGD inlet. This was the main reason for dust accumulation in the 8# to 12# slot regions. Increasing the blast volume was effective in reducing the dust flux in each slot, as well as decreasing the clogging effect. The results could be useful for design, control, and optimisation of the shaft furnace operation.
Footnotes
Disclosure statement
No potential conflict of interest was reported by the authors.