
Abstract
A novel gas blowing mode with different flowrates for two plugs of metallurgical ladle is explored and studied through a sophisticated water model. The results show that this mode can efficiently decrease the mixing time and the total area of the slag eye for most cases, as compared with the conventional mode with same flowrates for two plugs. Generally, a relatively close angle between the porous plugs and a small radial position are beneficial to a decrease in the mixing time of bath, while a relatively far plug radial position leads to a smaller slag eye. In addition, tracers fed from the middle of the dual plugs are proven to be very beneficial to the mixing of the ladle. The slag layer will prolong the mixing time due to its consumption on the stirring energy compared with the situation without slag.
Introduction
Ladle metallurgy in the steelmaking process exerts a significant effect on the quality of the steel. Argon gas stirring, as one of the most cost-efficient methods, is widely adopted to homogenize the chemical composition and temperature of the molten steel, along with deoxidation, desulphurization and removing inclusions [1–4].
The gas flow is commonly injected into the liquid steel through porous plugs at the bottom of the ladle. In the process of ladle refining, the slag layer on the top of molten steel plays a vital role in improving the steel-slag interface reaction, decreasing heat loss and keeping the steel from reoxidation. However, it has been frequently observed in practical operations that the rising argon bubble flow breaks the top slag layer and exposes molten steel to air through an open slag eye [5], which can lead to reoxidation and nitrogen pickup of the molten steel. Additionally, slag entrapment or exogenous inclusions may occur in steel in this situation due to over intensifying the argon blowing [6,7]. With this consideration, a proper argon bubbling strategy should be designed in advance for the refining process of a given size ladle.
Presently, two porous refractory plugs are usually arranged in a large-capacity ladle for an efficient argon bubbling [8]. The positions and relative angle of the plugs will have a great impact on the gas driven flow in molten steel [1,9].
There have been many studies carried out for the argon bubbling process, through a water model [1,2,4,9] or mathematical simulation [6,10–12], which includes various aspects, such as gas injection and transport [13–16], and stirring and mixing [17–24], together with the top slag behaviour [25–30]. A review of the previous work on this topic has been given in detail [31]. As to concerns with ladle argon blowing through double plugs, the investigations or practices so far have mostly focused on the same flowrate regulation for the two plugs. This conventional gas blowing mode, S-Mode hereafter, has shown disadvantages, such as the gas columns colliding and interfering with each other in the ladle, which result in a partial energy dissipation and a decreased stirring efficiency. Additionally, the top slag of the ladle can be easily entrapped into molten steel in S-Mode case, due to the collision of the two gas columns. On this account, we recently introduced a new blowing mode called the D-Mode, in which a different flowrate is designed for each plug [31]. With D-Mode blowing, a weak gas flowrate was adopted to stir the stagnant zone at the bottom of the ladle, while a strong one was used to stir the whole ladle through forming a big circulation flow. Accordingly, the energy dissipation of the gas stirring can be decreased to some extent. In our former water model experiments for a given 120t prototype ladle, the D-Mode blowing practice has been proven as an effective way to shorten the mixing time as compared with the S-Mode [31], which means a higher refining efficiency and lower production cost can be expected with the new stirring mode.
To further optimize the efficient D-Mode stirring, with special consideration of the slag eye control to minimize steel reoxidation and of the choice of the position of alloy added or alloy-wire fed to promote the mixing, a newly designed water model is given in the present paper. The effects of bottom blowing modes, with various relative locations of the dual plugs and an optimal match of the two gas flowrates, will be investigated for the 120t industrial ladle.
Experimental
Experimental principle
Geometrical size of the ladle.
According to the similarity principle, the Froude numbers (Fr′) for the water model and prototype ladle should be equal, which is given by

Based on 
The gas flowrate of the water model can be determined by Equation (3) based on the prototype flowrate. Three model total flowrates of 8.14, 12.22 and 16.29 × 10⁻³ m3 min−1 were chosen in this experiment, and they correspond to 400, 600 and 800 × 10−3 m3 min−1 in the prototype usually adopted in virtual production.
Experimental setup and procedure
The water model setup is shown in Figure 1. The mixing behaviour was investigated by a popular conductivity method. Metered nitrogen was used as the stirring gas to inject into the bath through porous bricks at the model ladle bottom. 70 × 10−6 m3 of saturated KCl solution was added into the bath as a tracer. Two electrodes were installed, with one at the active zone of the bath top and the other at the stagnant zone of the bath bottom to determine the conductivity of the tracers. In previous studies [9,20,24,32], only one electrode was applied, which possibly led to location dependent experimental results. For this consideration, two electrodes are adopted in the present work to reveal the overall mixing time. The output signals of the electrical conductivity meters were recorded by a computer with the aid of a multifunctional monitoring system. Water model setup.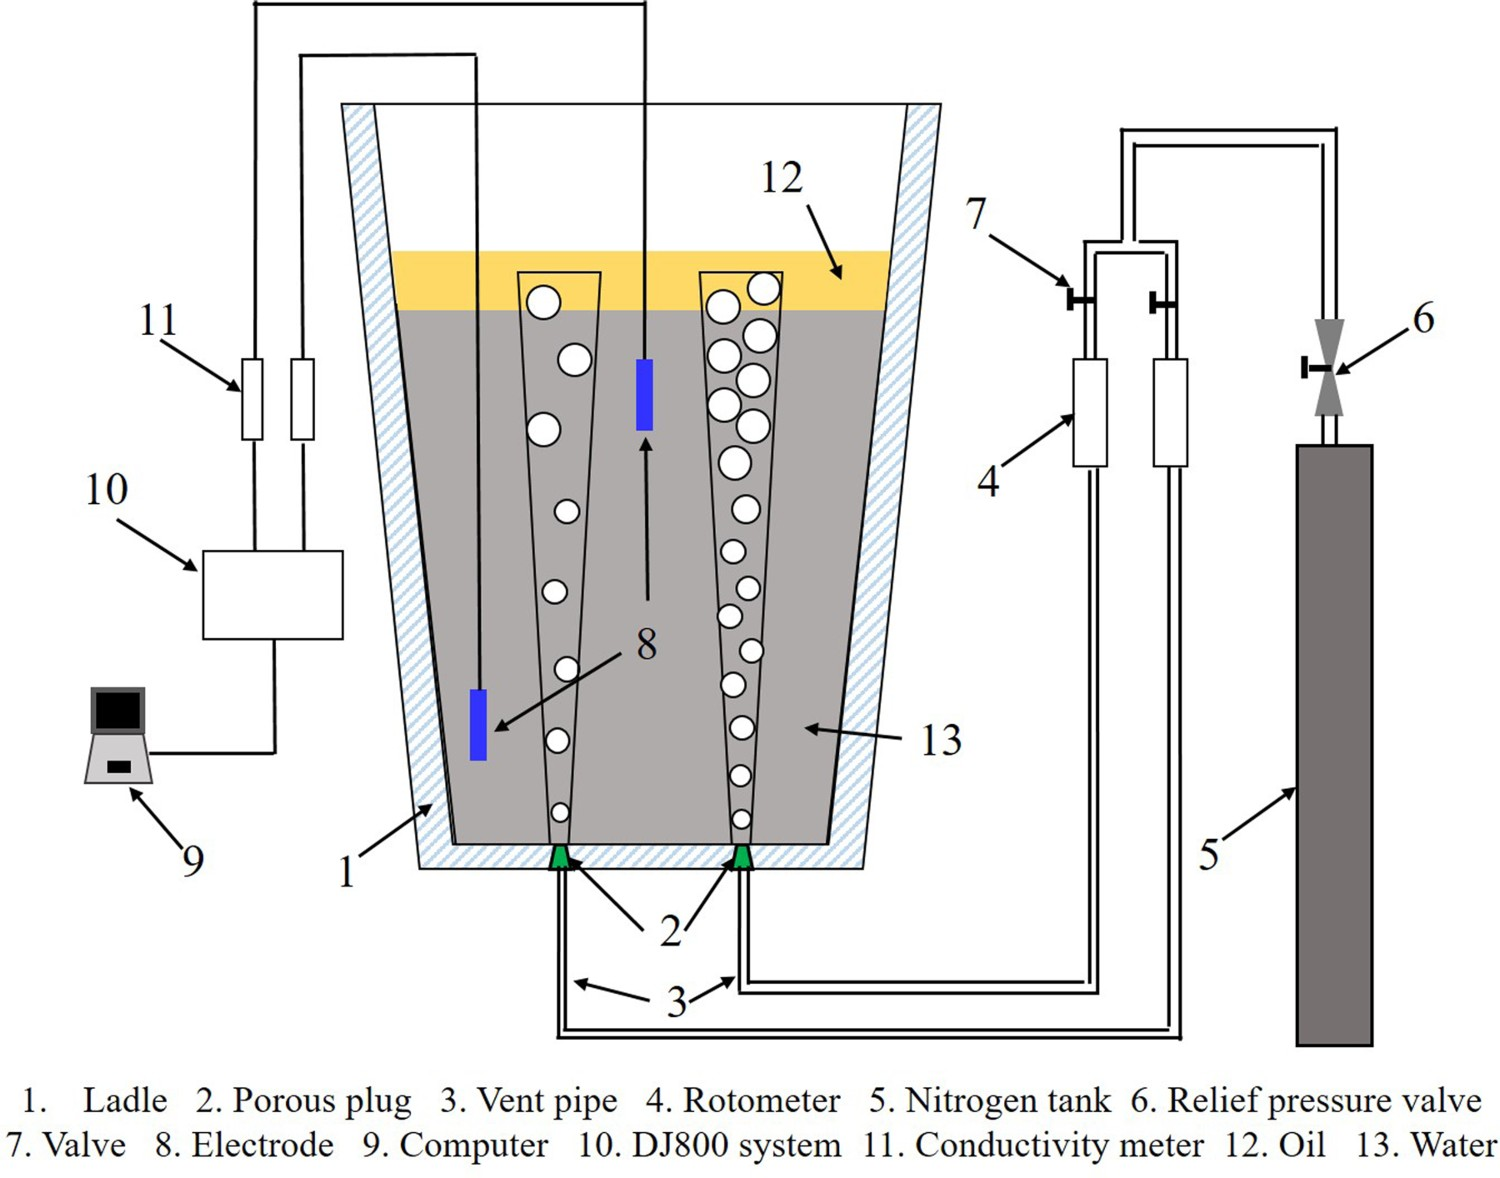
The mixing time τm is adopted as the longest time beyond which the changes of the electrical conductivities of two electrodes are less than 5% of the steady state after the addition of a tracer. Every experiment was repeated three times, taking their average as the final mixing time.
Experimental variables.
Figure 2 shows the arrangement of the two porous plugs, in which T1, T4, T7 and T10 were located at 0.55R (R is the radius of the model bottom) from the centre of the model bottom, T2, T5, T8 and T11 at 0.64R, as well as T3, T6, T9, T12 at 0.7R. These positions were combined at different relative angles. The two plugs in the prototype ladle are at T5 and T8, with 90° of relative angle. For the sake of flow erosion and washing on the ladle wall, the positions from 0.7R to the wall were not designed in the present experiment. Plug locations in the model ladle.
Results and discussion
Effect of tracer feeding location on mixing time for the D-Mode
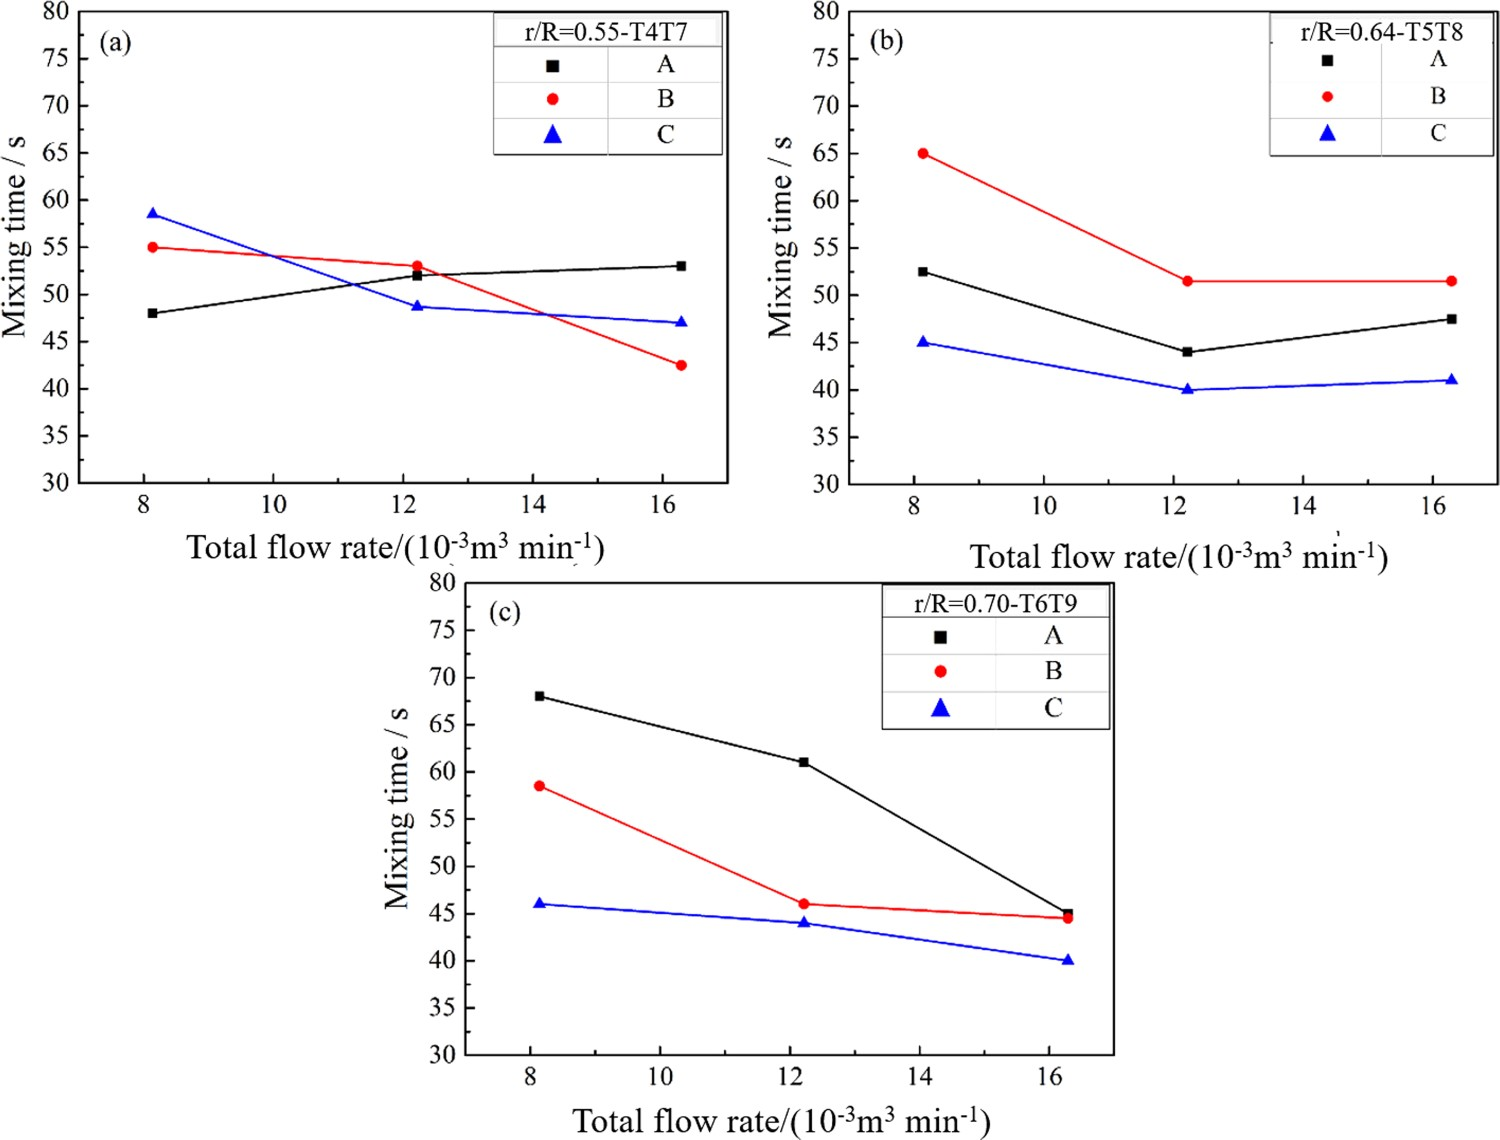
In actual ladle refining operations, lump alloys or Al wires/Ca wires/Ca–Si wires are usually added to deoxidize, alloy or modify non-metallic inclusions in molten steel. Usually, the feeding position of the alloys is casual in most steel plants. In fact, their homogenization and reaction rate should be dependent on their feeding position or operation, which then affects their metallurgical effect, especially for D-Mode blowing. To clarify the effect, the tracers were added from three different positions, which were the top of the weak gas plume (annotated as Position-A), the top of the strong gas plume (Position-B) and their middle location (Position-C) to simulate the positions of the alloys or wires in the present study. The mixing time was used to characterize the mixing effect. A shorter time suggests a higher production efficiency and a smaller temperature drop.
Figures 3 and 4 illustrate the changes of mixing time with the total flowrates for different feeding positions of the tracers, in which Figure 3 is for the cases for a 45° relative angle between the double plugs and Figure 4 for those with 90° of relative angle. It is seen from the two figures that the mixing time of Position-C is generally the shortest except for the cases 0.7R–T3T12–8.14 × 10⁻³ m3 min−1 (plug position 0.7R, combination of T3 and T12 in Figure 2, total gas flowrate 8.14 × 10⁻³ m3 min−1) and 0.55R–T4T7–8.14/16.29 × 10−3 m3 min−1. This can be explained as follows. When the relative angle is 45° or 90°, the two gas plumes will interfere with each other due to their close distance. When the tracers are added from Position-A or Position-B, they will swing upwards due to the driving of the gas flow, which makes some of the tracer flow to one side of the gas plume and some to the opposite side. Therefore, the trace cannot go into the ladle interior directly. While tracers added from Position-C can enter into the ladle along with the down-stream and disperse quickly. This finding suggests that, in actual production, alloys or deoxidation agents should be added from Position-C for better mixing effect, rather than Position-A or -B. Effect of tracer feeding location (Position-A, -B and -C) on the mixing time at a 45° relative angle and different plug positions (r/R). Effect of tracer feeding location (Position-A, -B and -C) on the mixing time at a 90° relative angle and different plug positions (r/R).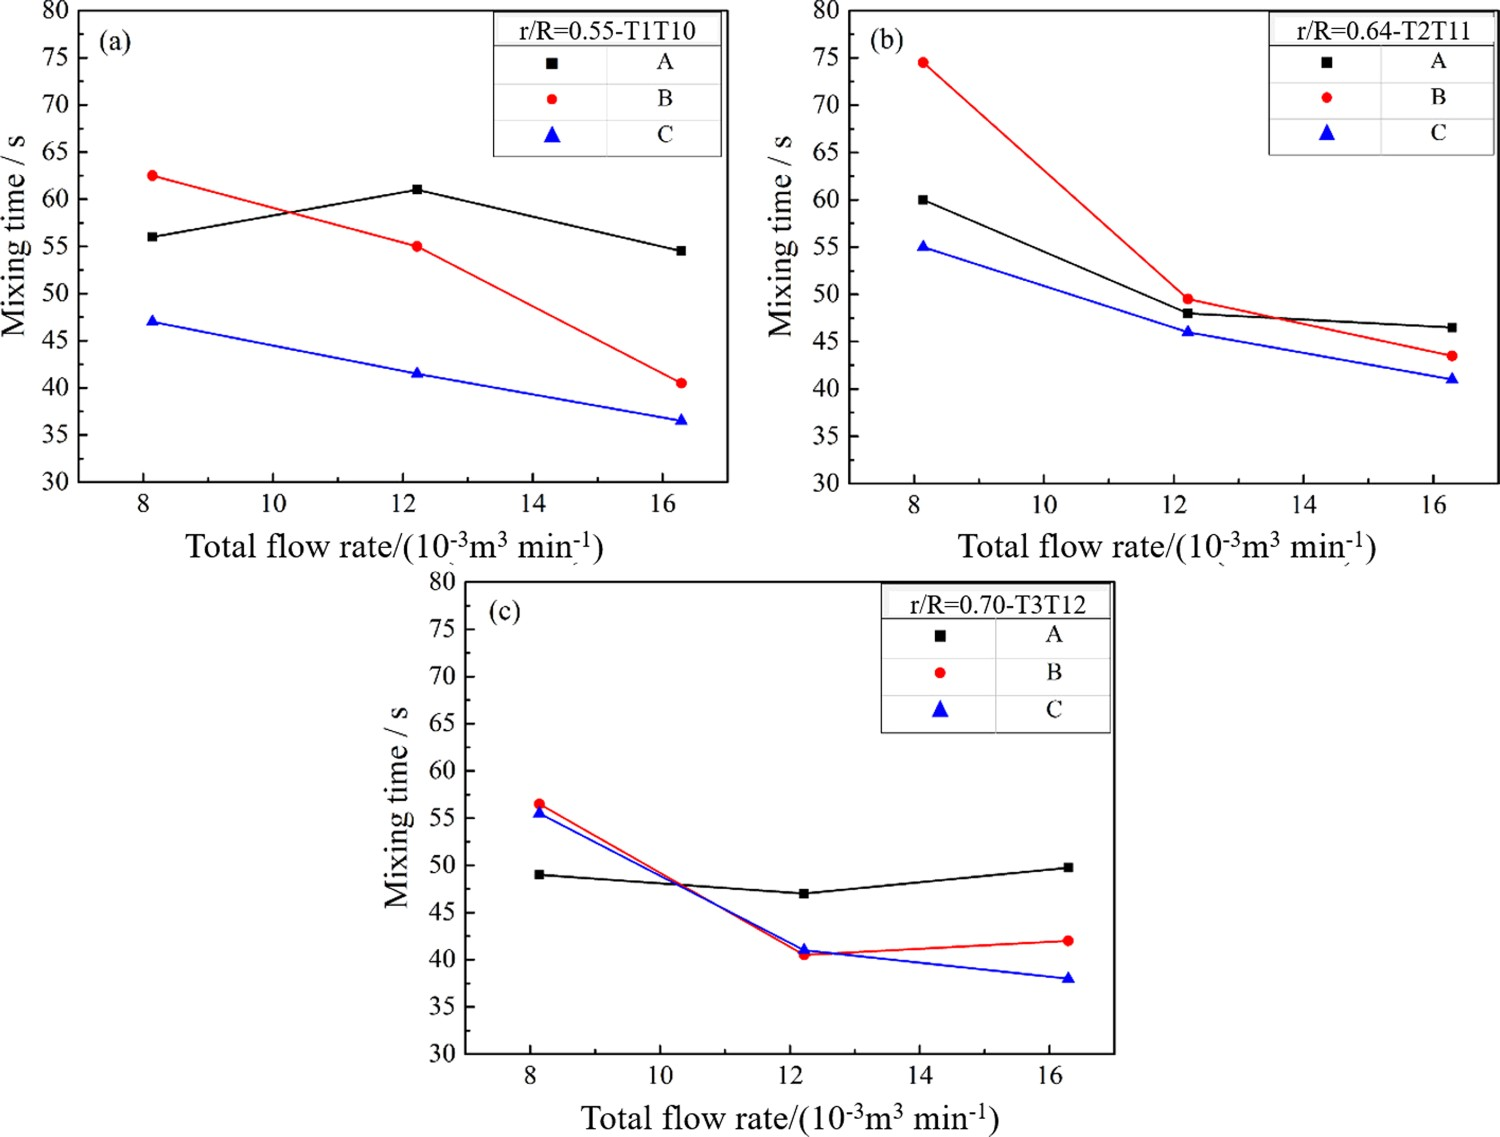
Effect of plug location on mixing time for the D-Mode
In our published article [31], only one plug location was studied for the D-Mode, which is not overall for the whole ladle. In the present work, three plug locations with 0.55R, 0.64R and 0.7R were designed and studied.
According to the above results, Position-C is chosen as the tracer feeding location in the following studies. Figure 5 indicates the effect of the porous plug location on the mixing time at different relative angles. It is seen that there are various influences for the different plug relative angles. When the angle is 45°, the mixing time at position 0.55R is the shortest at 36 s (Figure 5(a)); while at the other three angles, the shortest mixing time mostly appears at 0.64R, and the time has an extending tendency when the plugs are moved to 0.7R, as shown in Figure 5(b,d). Effect of plug location on the mixing time at different relative angles, (a) 45°, (b) 90°, (c) 135°, (d) 180°.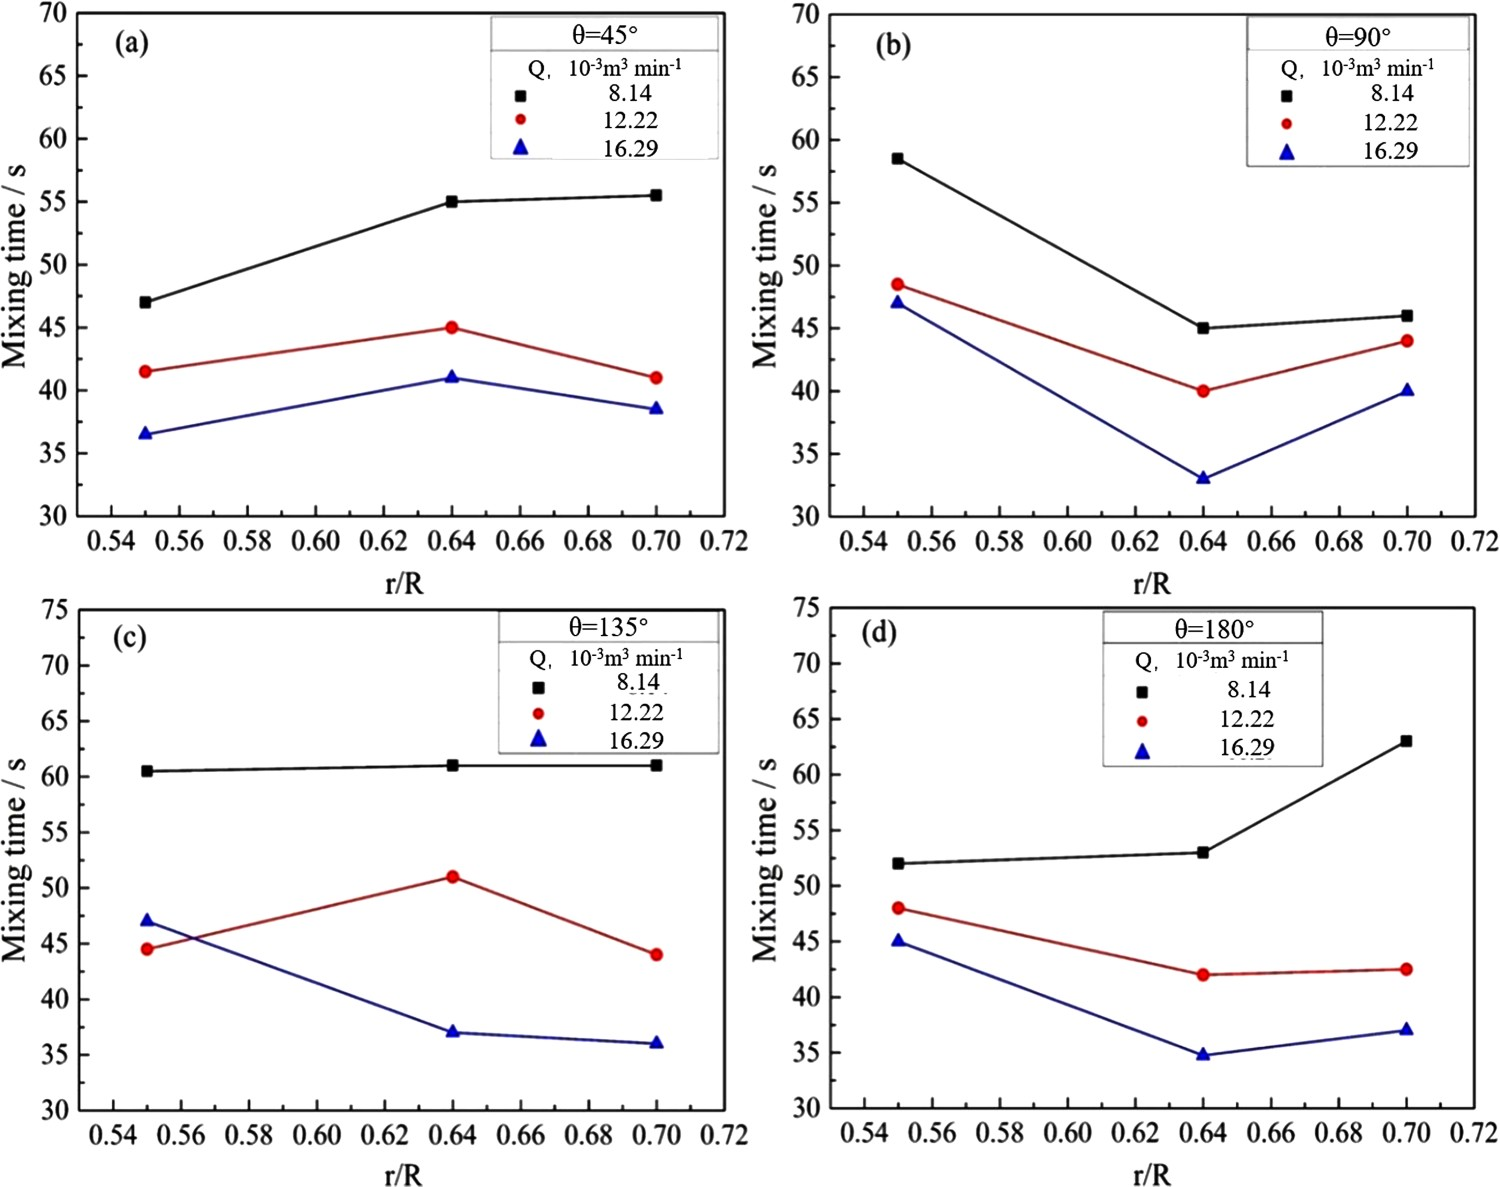
This phenomenon is likely attributed to the effect of circulation flows. When gas is blown into a ladle bath from the two porous plugs, circulation flows will be formed between the ladle wall and gas plume, as well as between the two gas plumes. The circulation flows between the plumes will collide and interact with each other, which will more or less dissipate the stirring energy. Additionally, the ladle wall will also take in some stirring energies. The bath mixing is finally correlated to the stirring effect of the circulation flows in the ladle. A larger circulation flow between the ladle wall and gas plume is always observed in the case where the plug location is near the ladle centre or at a smaller relative angle of both the plugs. Accordingly, a quick mixing effect was achieved while the relative angle was at 45° together with the plug location at 0.55R, as compared with the locations 0.64R and 0.7R. However, the mixing time for 0.7R is shorter than that of 0.64R, which is probably induced by the less energy dissipation from the gas plume interference due to a relatively long distance between the two plugs.
Reference [31] studied the change of the mixing time of the S-Mode at a 45° relative angle for the same prototype ladle as in the present study and a different similarity ratio (1:3); the results are shown in Figure 6. Comparing Figure 6 with Figure 5(a), the change of mixing time against plug position and gas flowrate is basically identical between the D-Mode and S-Mode, i.e. the mixing time exhibits the shortest at 0.55R and the longest at 0.64R, and it reduces with the increasing flowrate. Effect of plug location on the mixing time of the S-Mode at three gas total flowrates and 45° from reference [31].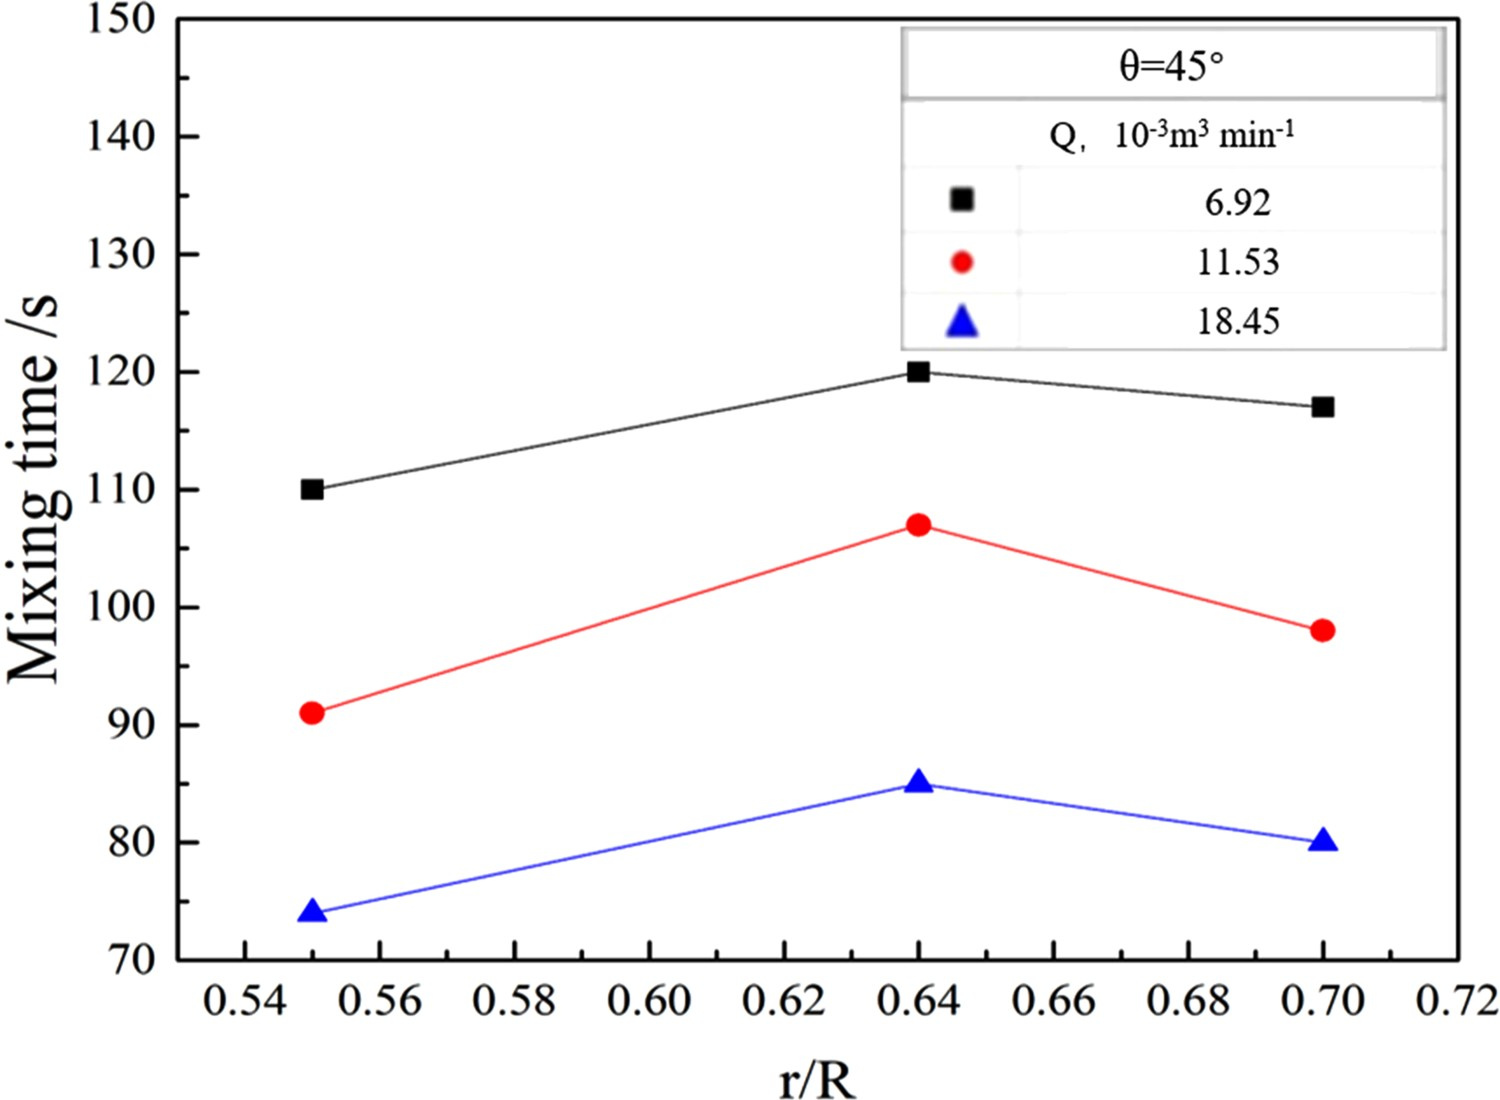
From Figure 5, the mixing time at 0.64R is the shortest when the relative angle of the plug is 90°. With a further increase of the relative angle, the mixing time varies irregularly due to the complex interaction of these circulation flows. Based on the experimental results, the mixing time of the case 0.64R–90°–16.69 × 10⁻³ m3 min−1 is the shortest with only 33 s. For most cases, the change in the rate of mixing time with the plug position becomes small from 0.64R to 0.7R, compared with from 0.55R to 0.64R.
Effect of the relative angles between porous plugs on mixing for the D-Mode
The effect of the relative angle between the plugs (θ) on mixing time is shown in Figure 7. The mixing time change is complex with increasing relative angles. Effect of the relative angle of the plugs on the mixing time, (a) plug location 0.55R, (b) 0.64R, (c) 0.70R.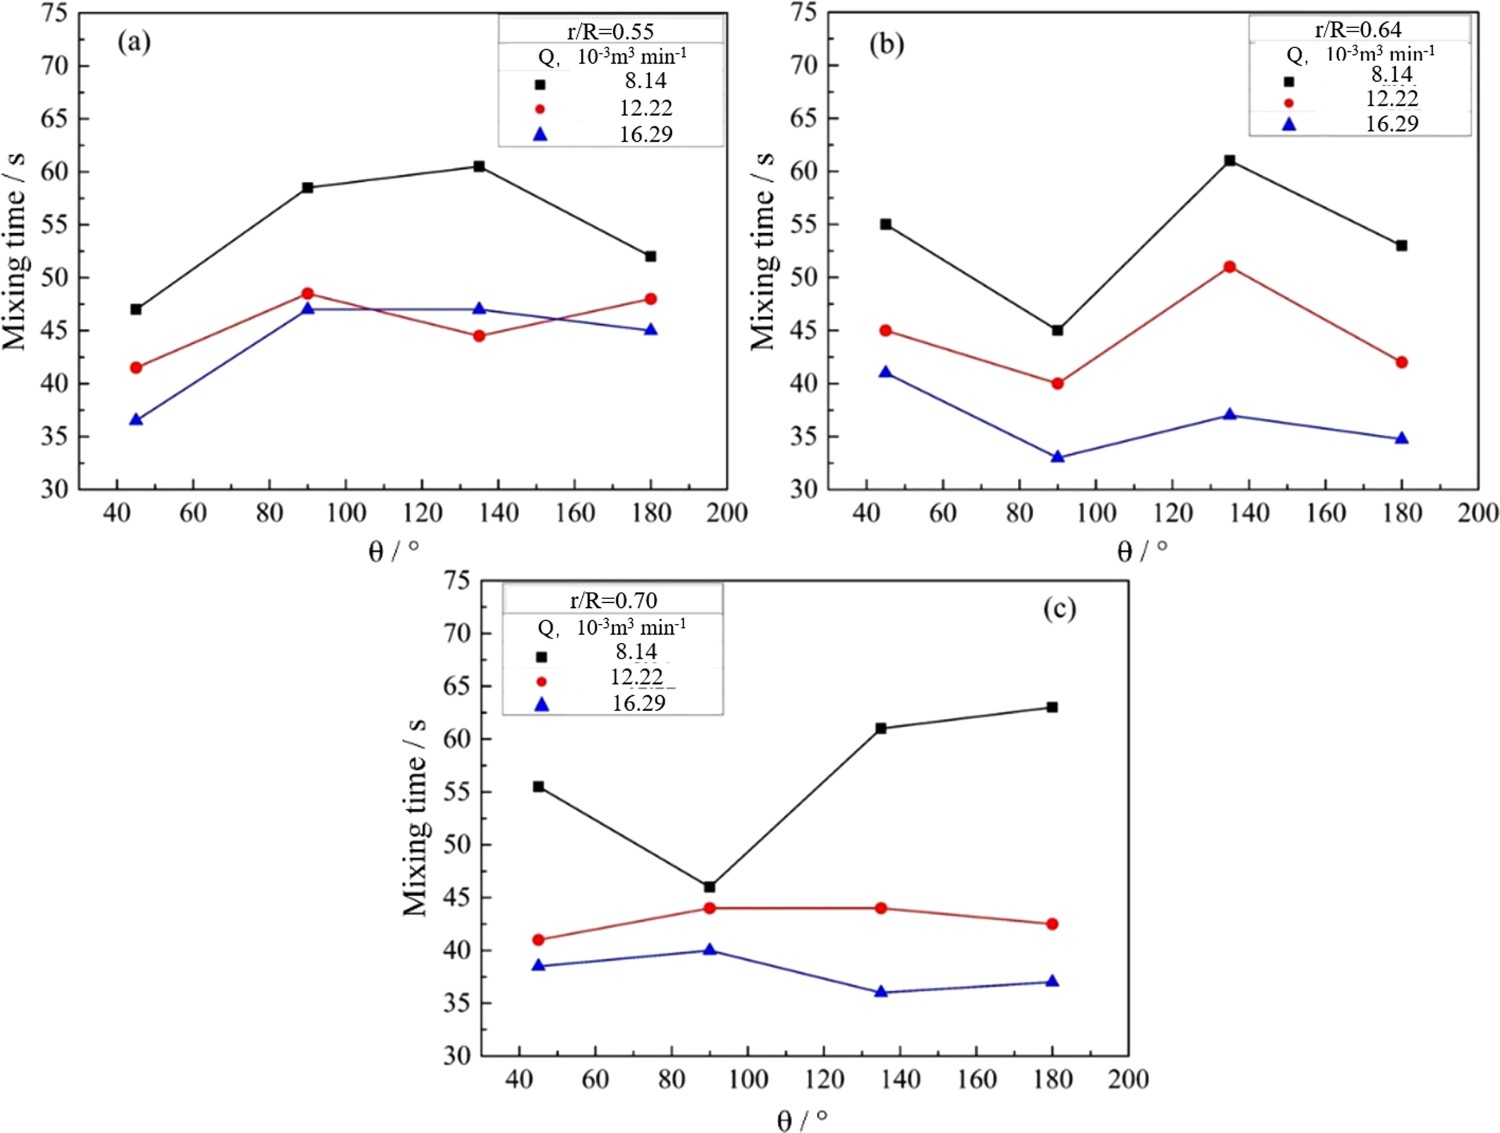
From Figure 7(a), when the plugs are located at 0.55R, the mixing time of 45° is shorter than that of other angles. When the relative angle increases to 90°, the mixing time obviously prolongs. However, its change rate slows down from 90° to 180°. This is possibly because, when at 45° and 0.55R, the circulation flow between the plume and ladle wall is larger, which is beneficial to an improvement in the mixing effect. Additionally, due to the short distance between two plugs at this situation, the weak plume will be swallowed up by the strong one to form a large circulation stream. With the increase in the relative angle, the distance between the two plugs increases, and the circulation flow between the ladle wall and gas plume will shrink, and the interference between the gas plumes intensify accordingly, which leads to a decreasing stirring energy and a longer mixing time. When the plug angle reaches 180°, the energy loss between the plumes is reduced due to the increasing distance between the plugs, and thus the mixing time shortens at the gas flowrates of 8.14 and 16.29 × 10⁻³ m3 min−1, as compared with a 90° relative angle.
When the plug positions are 0.64R, as shown in Figure 7(b), the relative angle of 90° exhibits the shortest mixing time, which should be similar to the results from the double action of the circulation flows between the ladle wall and gas plume, as well as between the two plumes. The change of mixing time with relative angle is relatively smaller at 0.7R (Figure 7(c)), except for the case 90°–8.14 × 10⁻³ m3 min−1. Owing to the farther distance between the plugs compared with 0.55R and 0.64R, the difference between the interference from plumes under various angles is decreased.
Effect of gas flowrate on the mixing time for D-Mode
The effect of the gas flowrate on mixing is shown in Figure 8. The mixing time decreases significantly with an increasing total flowrate for almost all the gas blowing locations and angles. As has been realized, the stirring energy plays a key role on melt mixing in the ladle, which depends mainly on the gas flowrate [29,31]. Some studies, however, also point out that there is a critical value for the mixing time by simply increasing gas flowrate. In the case that the flowrate reaches a critical value, the mixing time may increase instead of further decrease [1] or stay the same [32], which can be explained as lost work involved in the redundant stirring energy due to the formation of an open slag eye. The critical stirring energy is surely dependent on the ladle capacity and geometry. In the present gas flowrate range for the given ladle, however, the melt mixing time shows a decreasing tendency with an increase in the gas flowrate, except for the case of 0.55R–135°–16.29 × 10⁻³ m3 min−1. Effect of gas flowrate on the mixing time at different plug locations.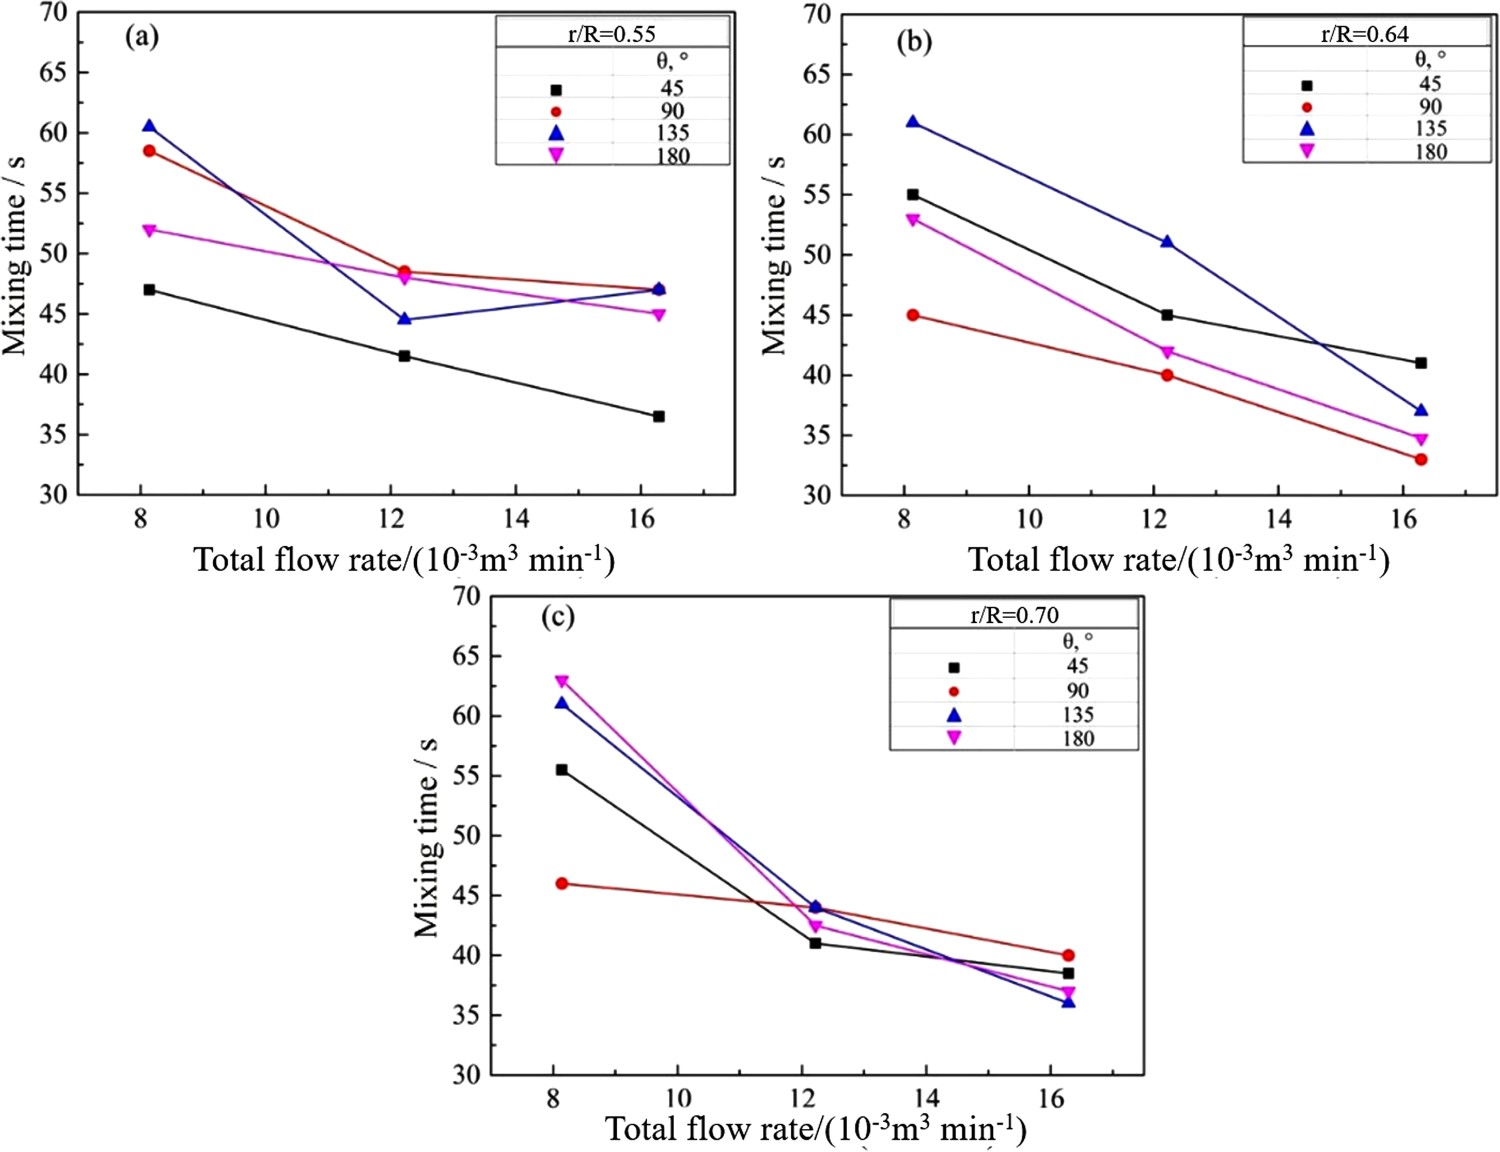
Comparison of the two gas blowing modes on mixing
Figure 9 compares the change of mixing time with the total gas flowrate between the two modes (S-Mode and D-Mode). It is seen that, at the same total flowrate, the mixing time of the D-Mode is shorter than that of the S-Mode in most cases. Comparison of the change of mixing time with the total gas flowrate between two modes, (a) plug position 0.55R, (b) 0.64R, (c) 0.70R.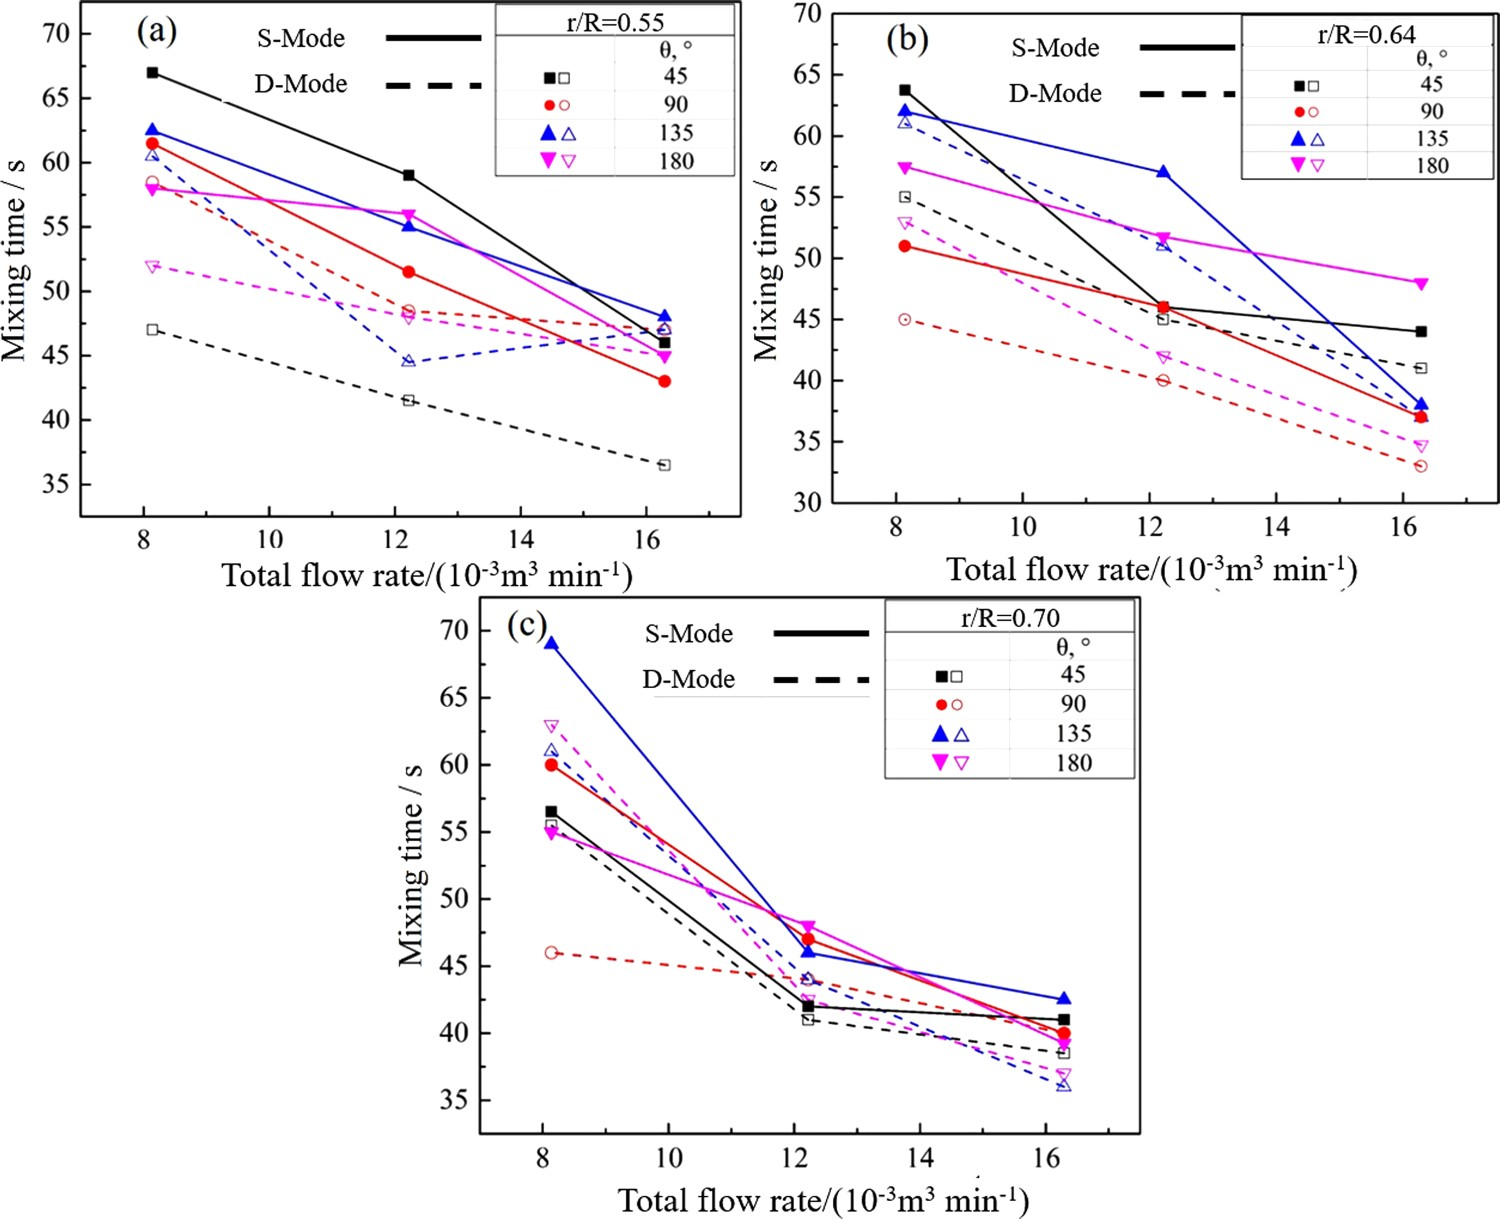
To understand their differences, an ink experiment of case T5T8 (90°–0.64R–16.29 × 10⁻³ m3 min−1) was carried out with equivalent ink being added from the top of gas flow of each plug as described in reference [31]. Flow fields with obvious differences were observed, as given in Figure 10, in which the two plumes of the S-Mode (Figure 10(a)) are almost symmetric, along with the symmetric back flows at the top of the liquid as marked in the figure. These back flows collide and interfere with each other, which will consume some stirring energies. In the case of the D-Mode, as shown in Figure 10(b), its stronger gas plume first arrives at the top liquid, and then develops to the weak plume side. Accordingly, there is a decreased gas plume collision or stirring energy dissipation in this situation. Consequently, more stirring energies can be used to mix the liquid in the ladle for the D-Mode, and a lower mixing time can be achieved as well. Comparison of the flow field between the two modes for case T5T8 [31], (a) S-Mode, (b) D-Mode.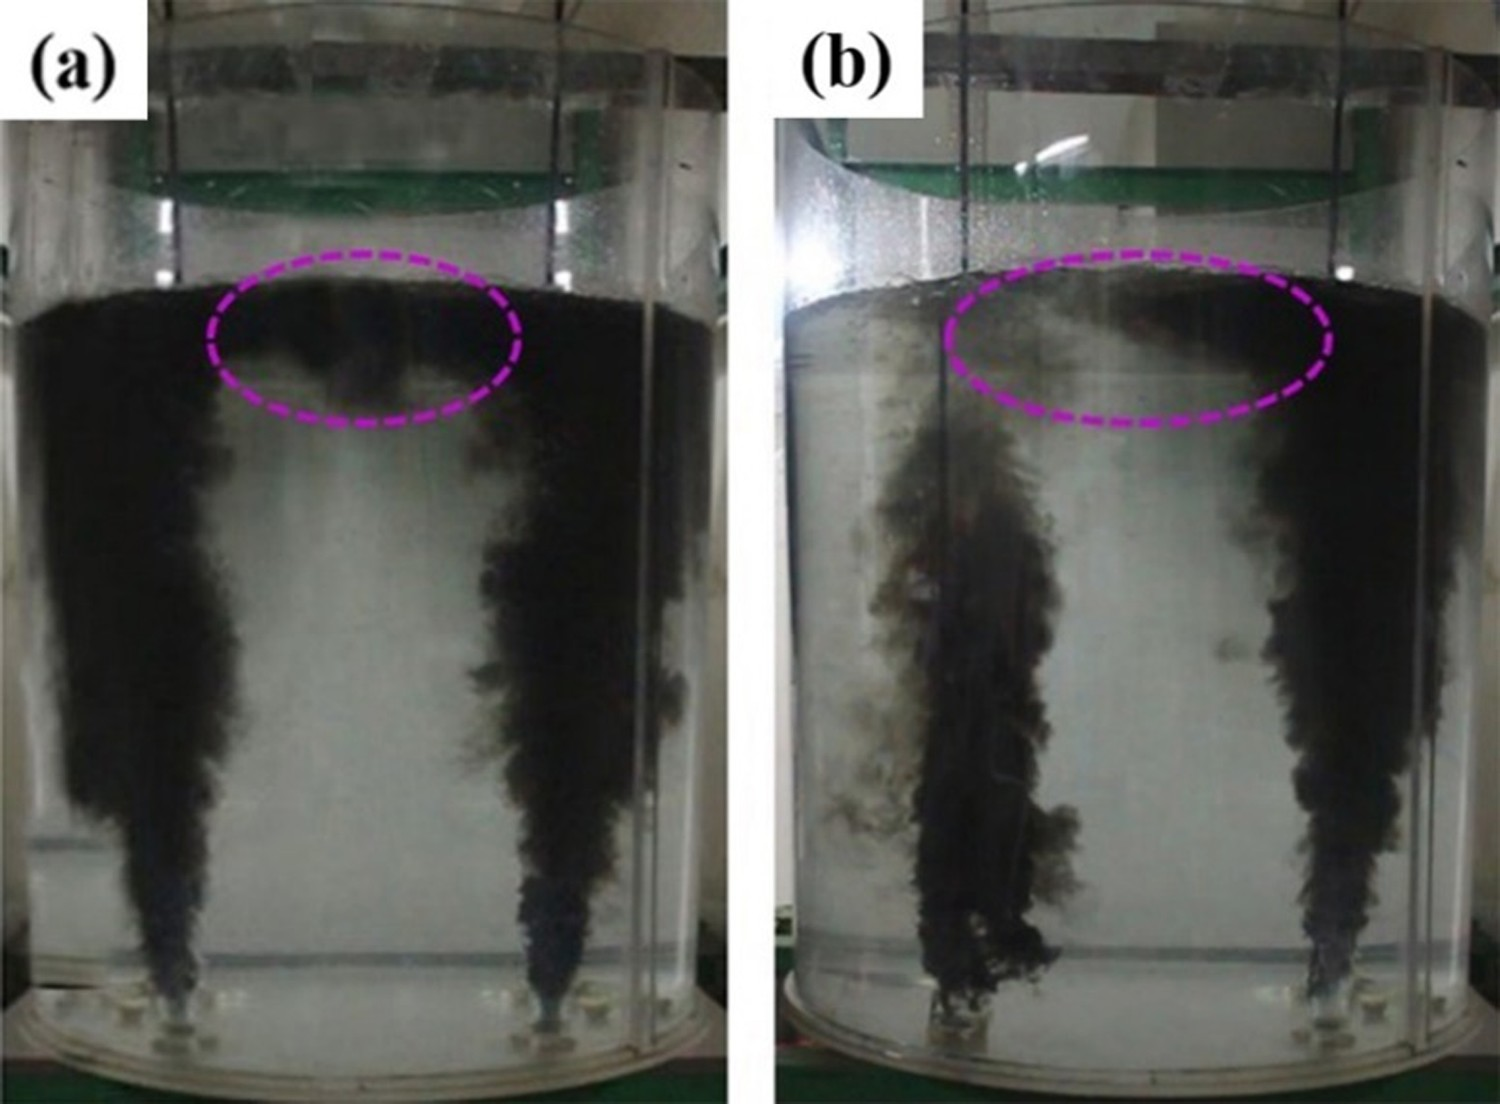
Effect of slag layer on mixing for the D-Mode
To explore the effect of the slag layer on the ladle mixing, cases T5T8 (0.64R–90°) and T2T5 (0.64R–180°) were chosen to compare the change of mixing time at three gas flowrate levels with and without slag. According to the similarity principle, the slag was simulated by a plant oil of thickness 38 mm. It is seen in Figure 11 that the mixing time of the liquid obviously prolongs under the situation with the ladle slag. The smaller the flowrate is, the larger the difference of mixing time between with and without the slag. Since part of stirring energy is consumed by the slag layer or lost through slag eye, the energy to stir the molten liquid is decreased and the mixing time is prolonged. Comparison of the mixing time of cases T5T8 and T2T5 with and without slag.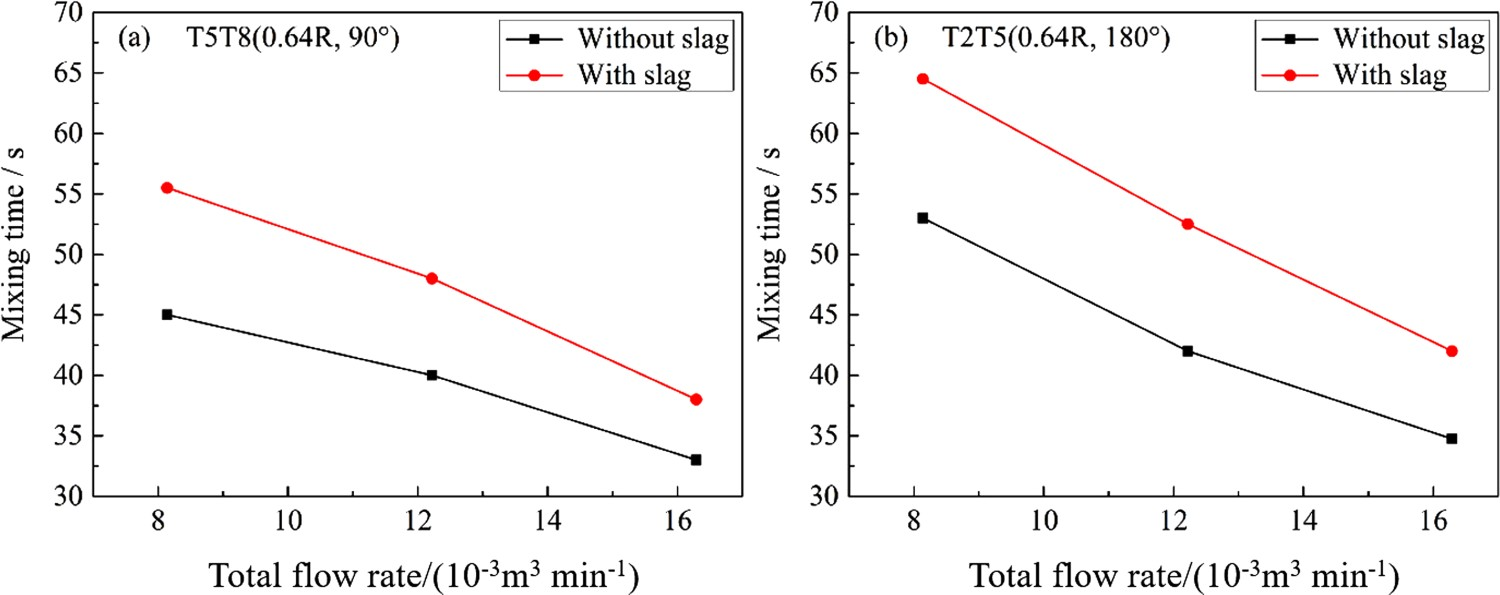
Effect of gas blowing modes on slag eyes
As mentioned above, the D-Mode can shorten the mixing time compared with the S-Mode. But the slag eye size in D-Mode blowing may be larger too at a given total flowrate due to its one dominant gas plume, which possibly results in an increasing reoxidation of liquid steel, together with nitrogen pickup from the top air. Moreover, a stronger turbulence in this case may cause slag entrapment, and bring about exogenous inclusions in the steel. Therefore, it is necessary to compare the change of slag eye size between the two modes at various gas blowing parameters. Figure 12 illustrates the area proportion of two slag eyes in the total slag surface area at different relative angles, gas flowrates and plug positions, as calculated by a PhotoShop processing software based on the measurement of slag eye diameters. It is seen that, for most cases, the proportion of slag eye of the D-Mode is smaller than that of the S-Mode, which indicates that the D-Mode has advantages over the S-Mode in both mixing time and slag cover. The proportion of slag eye in the D-Mode first decreases and then increases with the increasing relative angle of plugs at the same flowrate. Comparison of the area proportion of slag eyes between the two modes.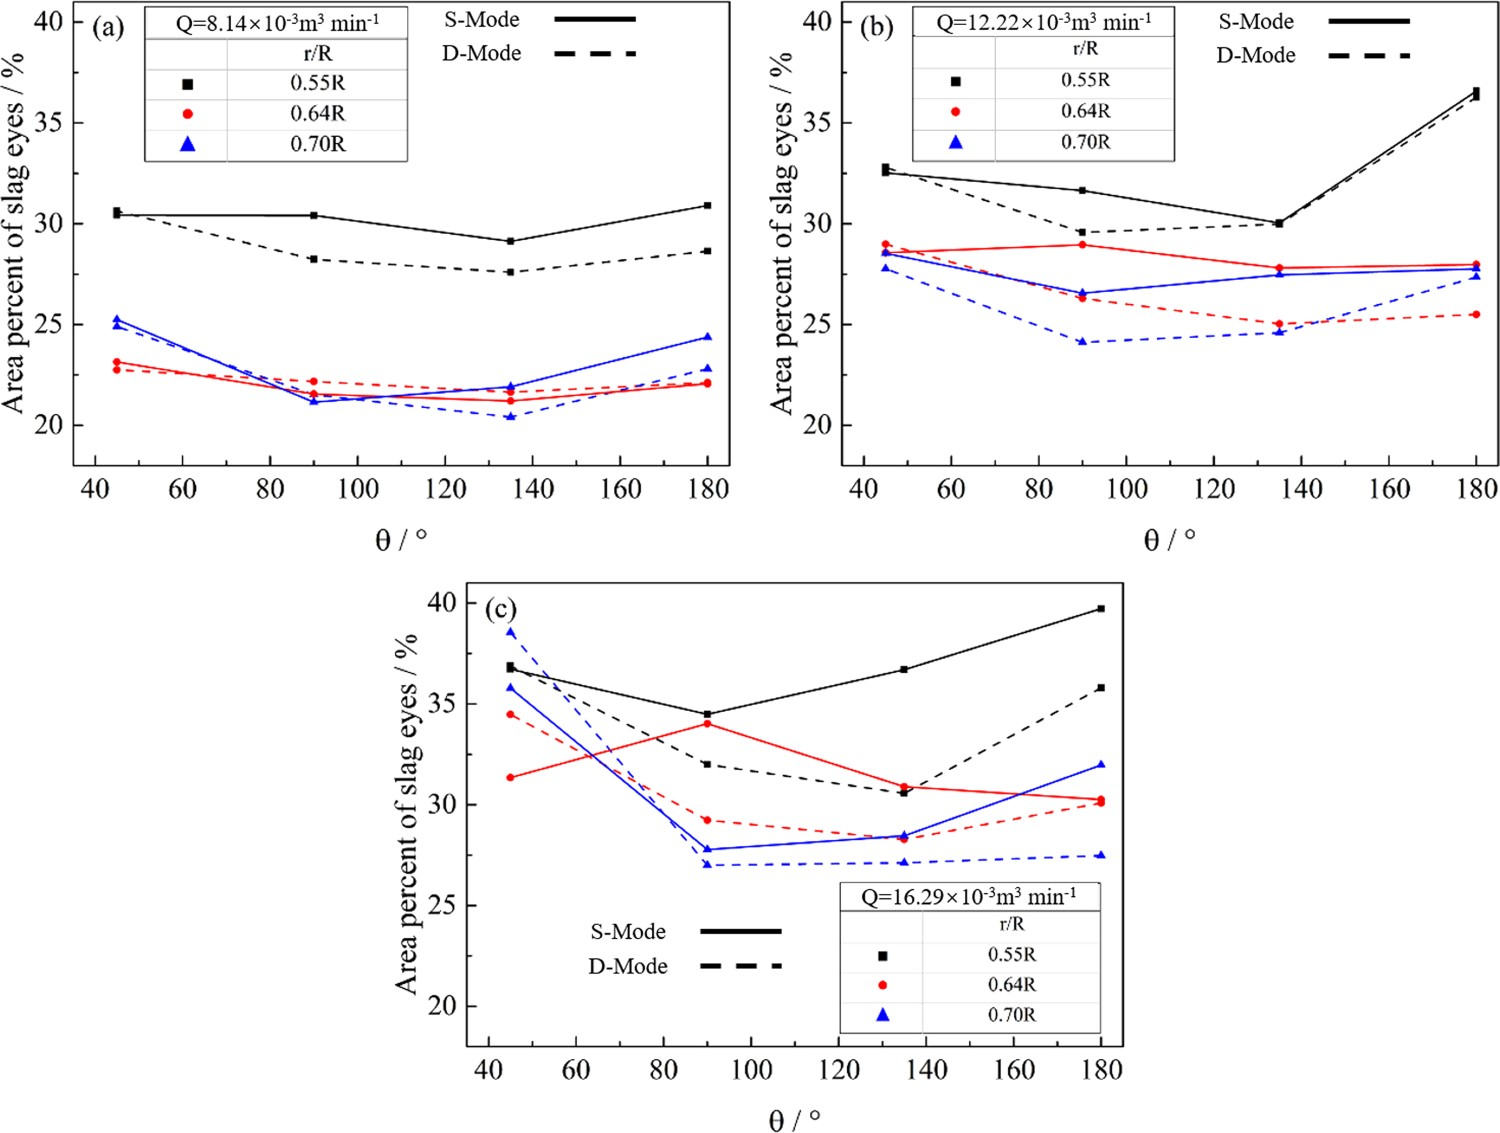
Figure 13 shows the shapes of slag eyes at different relative angles with a fixed plug position of 0.55R and a gas flowrate of 2.04 (the weak one) plus 14.25 × 10⁻³ m3 min−1 (the stronger one). It is seen that, at 45°, two small slag eyes converge into a larger one with an approximately round shape, and the exposed area accounts for 32.80% of the total slag surface area. When the relative angle increases to 90°, the area of slag eye decreases to 29.57%; it presents an ‘8-shape’ with one larger and the other smaller. When the relative angle reaches 135°, two slag eyes can be separated independently, and the shapes become irregular; the exposed area is approximately 29.98%. A sharp increase occurs, with the slag eye proportion reaching 36.26%, as the angle increases to 180°. This should be the result for two plumes farther away from each other at 180° than at the other angles; the energy dissipation from their collision is impaired, while the energy to push slag increases correspondingly. Under this situation, the shape of the slag eyes becomes regular again. The mixing times of these cases are 42, 48, 44 and 47.5 s, respectively, as shown in Figure 7(a), which are not the shortest mixing times among all designed cases. Shapes of slag eyes of the D-Mode blowing at different relative angles:(a) 45°, (b) 90°, (c) 135°, (d) 180°.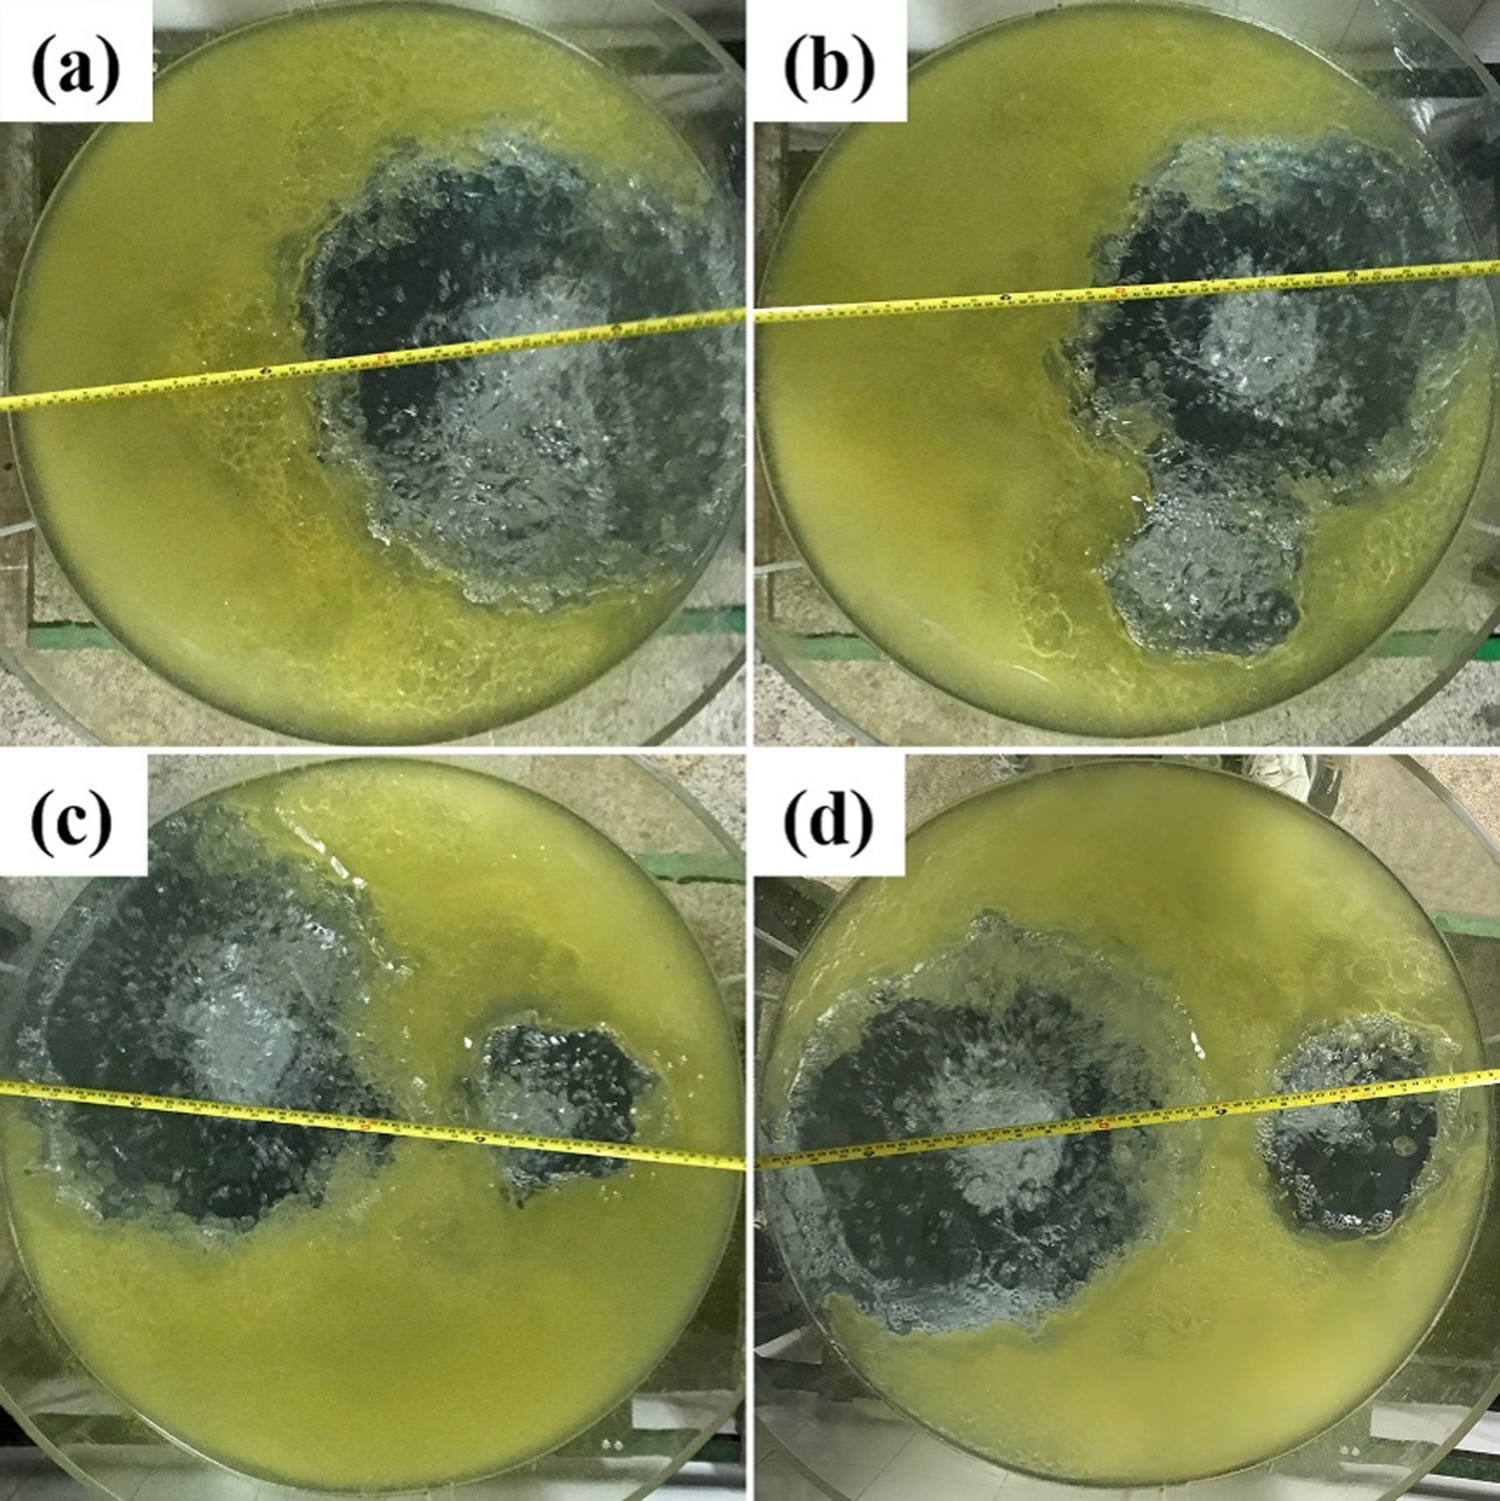
From Figure 12, it can also be seen that, at the total flowrates of 12.22 × 10⁻³ m3 min−1 and 16.29 × 10⁻³ m3 min−1, the exposed areas of the slag eyes of the two modes generally decrease with plug position from 0.55R to 0.70R due to the obstacle of the ladle wall and its adsorption of the stirring energy. The slag eye is the smallest at 0.7R–90° and 0.7R–135°. When at 45° and 8.14 × 10⁻³ m3 min−1, the two modes present minor differences in slag eye size, whereas the differences enlarge with an increase in the total flowrate.
Conclusions
A novel bottom dual plugs blowing mode has been explored through water models for a more efficient ladle metallurgy. For a 120t ladle, the effect of various D-Mode parameters on the mixing and top slag eye of the ladle was investigated experimentally as compared with conventional S-Mode bottom blowing, in which the dual plugs are located at 0.55–0.70R, with different relative angles (45–180°) and total gas flowrates (8.14–16.29 × 10⁻³ m3 min−1). The following conclusions can be drawn: both the ladle mixing and its exposed area of slag eye are remarkably affected by the bottom blowing modes. For most cases, the D-Mode can decrease the mixing time and slag eye area under given gas flowrates, compared with the S-Mode. The shortest mixing time is obtained in the case 0.64R–90°–16.29 × 10⁻³ m3 min−1, while the smallest slag eye size is in the case 0.7R–135°–8.14 × 10⁻³ m3 min−1; the tracer mixing in the ladle is greatly influenced by its feeding position. Feeding in the middle of the dual plugs with the D-Mode blowing can shorten the mixing time, and should be recommended as the right position at which to add alloys or deoxidation agents in industrial applications; the ladle mixing time is prolonged with its slag layer addition, which can more or less absorb the stirring energy. The smaller the gas flowrate is, the larger the difference of mixing time between with and without slag.
Footnotes
Disclosure statement
No potential conflict of interest was reported by the authors.