
Abstract
The continuous cooling transformation (CCT) diagram of 30CrMo steel simulated by compact strip production process was constructed. And the effect of austenite deformation on the CCT behaviour was investigated. The results showed that the microstructure gradually transformed from proeutectoid ferrite and pearlite to bainite and martensite with the increase of cooling rate, accompanying a refined microstructure and an increasing hardness. When the cooling rate was lower than 0.1°C s−1, the desired microstructure of ferrite and pearlite could be obtained. And the austenite deformation strongly promoted the formation of proeutectoid ferrite, which led to a decreasing hardness of deformed steel. When the cooling rate was larger than 10°C s−1, the fully martensite microstructure was obtained. And the austenite deformation inhibited martensite transformation, resulting in a decrease of the martensite transformation starting (M s) temperature from 391°C to 368°C.
Introduction
30CrMo steel is now widely being used as structural materials due to its excellent properties, such as high strength, high toughness and high hardenability [1,2]. It is mainly produced by conventional hot rolling but the segregation, surface decarburization, inhomogeneity of microstructure, etc. usually existed, which reduced the mechanical performance and significantly shortened its service life [3–5]. Compared with the conventional hot rolling process, due to the rapid solidification and the shorter soaking time of thin slab, the compact strip production (CSP) was superior in the production of middle and high carbon alloy steels, such as 30CrMo steel [6–8]. And our previous study also found that the microstructure of hot-rolled 30CrMo steel produced by CSP process is finer and more homogeneous [9].
For the hot-rolled 30CrMo steel, the desired microstructure is ferrite and pearlite with a low hardness which is beneficial to the coiling and uncoiling processes. The microstructure of bainite or martensite should be avoided. Therefore, in this paper, the continuous cooling transformation behaviour of 30CrMo steel simulated by CSP process was studied and the critical cooling rate for austenite to ferrite and pearlite was obtained. Moreover, the effect of austenite deformation on the microstructure evolution and hardness was also explored.
Experimental details
The chemical composition of the experimental steel was (wt-%): 0.32 C, 0.2 Si, 0.6 Mn, 1.0 Cr, 0.18 Mo, ≤0.035 P, ≤0.035 S, ≤0.03 Cu and Fe balance. After vacuum melting and casting, a 50 kg ingot was prepared and forged into 150 mm × 120 mm × 100 mm billets. There billets were subsequently homogenized at 1200°C for 2 h, followed by hot rolling into 60 mm thickness plates. The dilatometric specimens were machined into cylindrical samples of 8 mm × 12 mm (diameter × height).
The dilatometric experiments were conducted on a Thermecmastor-Z thermal simulation testing machine to simply simulate the CSP process as shown in Figure 1. All specimens were first austenitized at 1150°C for 5 min with a heating rate of 5°C s−1 to obtain the coarse austenite grains. Two stages compression deformation were performed at 950°C and 890°C using a strain rate of 5 s−1, and compressed 50% and 30%, respectively. Then, the specimens with and without austenite deformation were both cooled to room temperature at different cooling rates (0.05, 0.1, 0.2, 0.5, 1, 2, 5, 10, 20°C s−1). The thermal expansion curves were recorded. The starting and ending transformation temperature points of different phase transformation were found out by the tangent method for drawing the dynamic and static CCT diagrams of the 30CrMo steel [10]. Static CCT (a) and dynamic CCT (b) processing route diagrams of 30CrMo steel.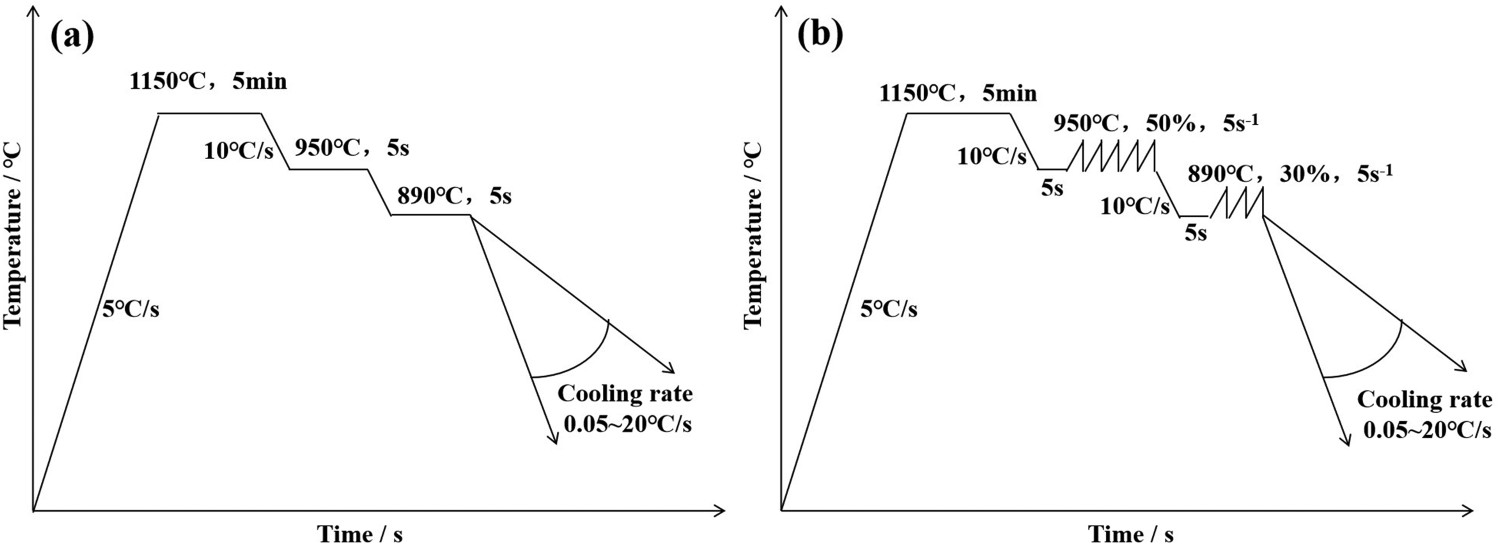
After the dilatometric tests, the microstructures of samples were characterized by German Axiplan2 Imaging Zeiss optical microscope (OM) and a Nova 400 Nano scanning electron microscope (SEM). Vickers hardness (HV) of each sample was measured by the HV-1000B type hardness tester with a load of 500 g and the value was taken an average of five different points of each sample. Moreover, the volume fraction of different phases in steel under different cooling rates was determined by ProImaging software based on the binary extraction method [11].
Results and discussions
Effect of cooling rate on transformed microstructure
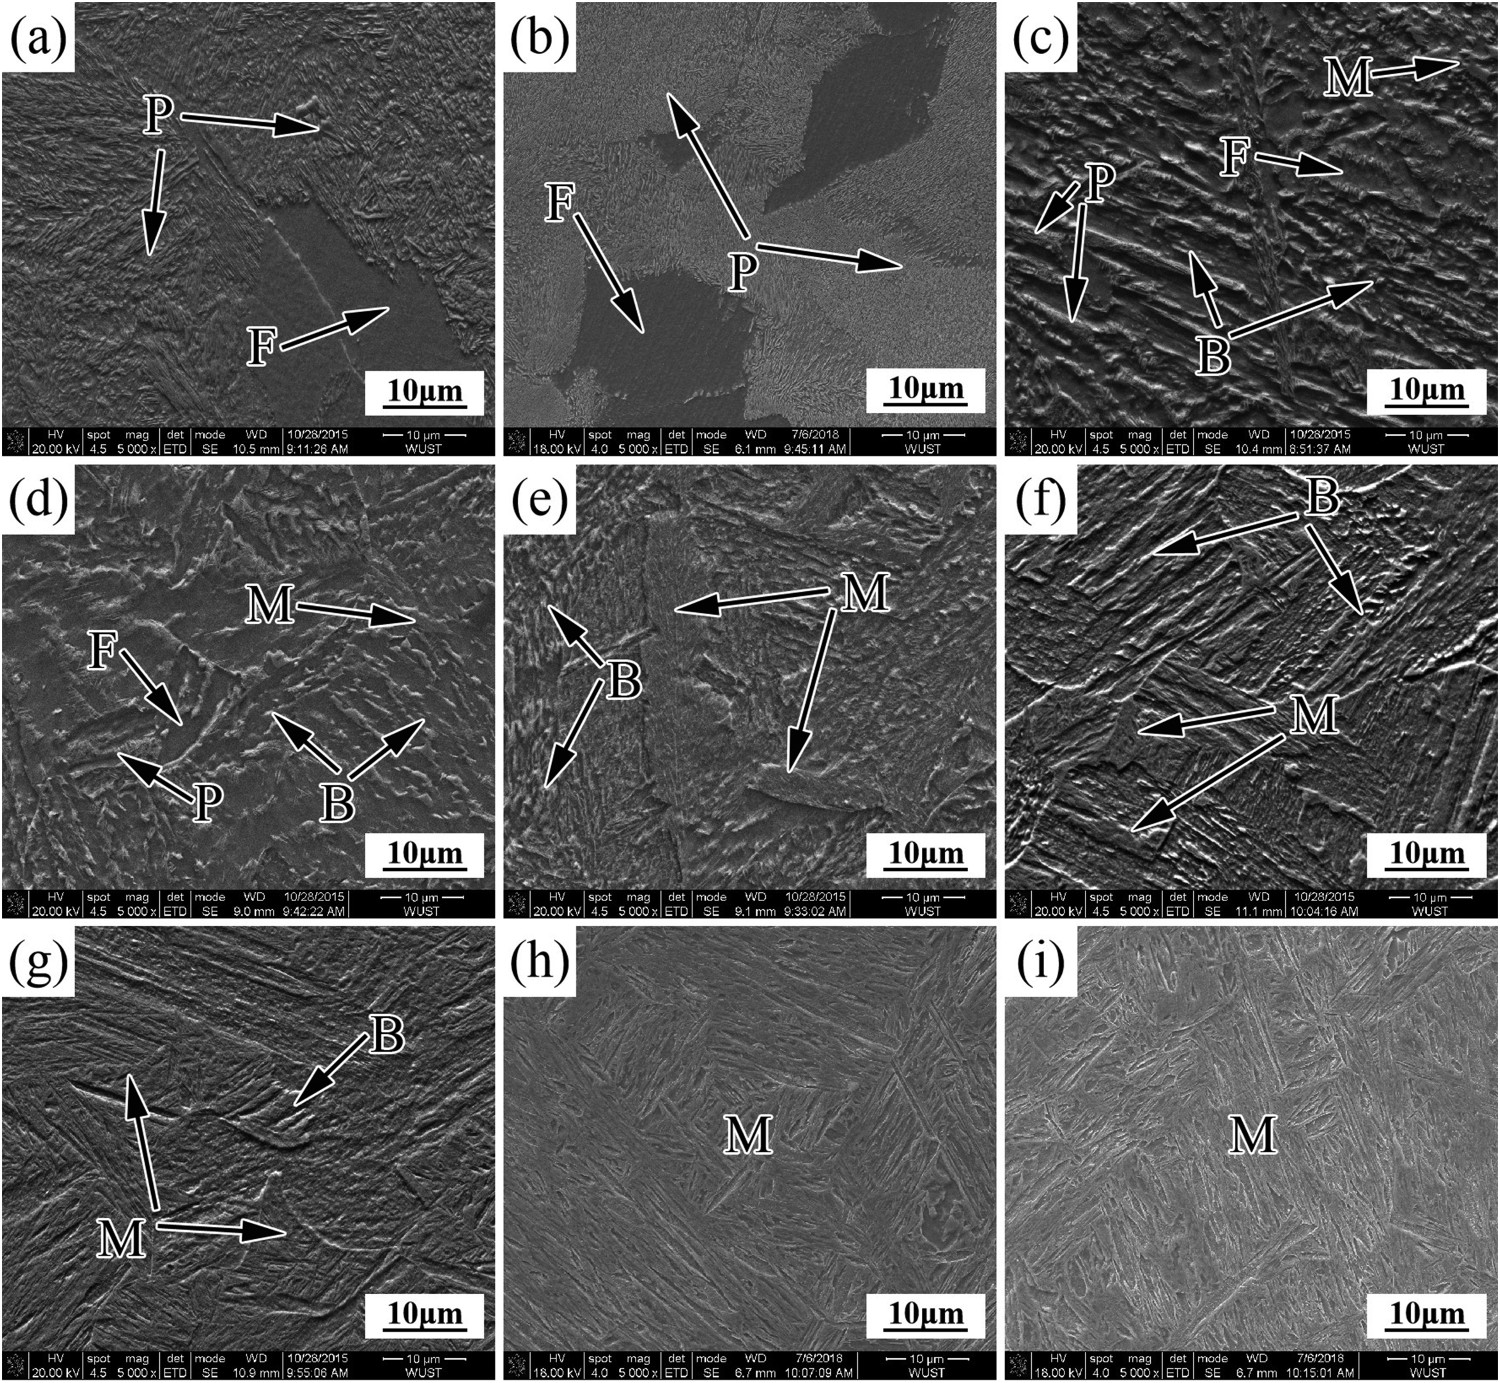
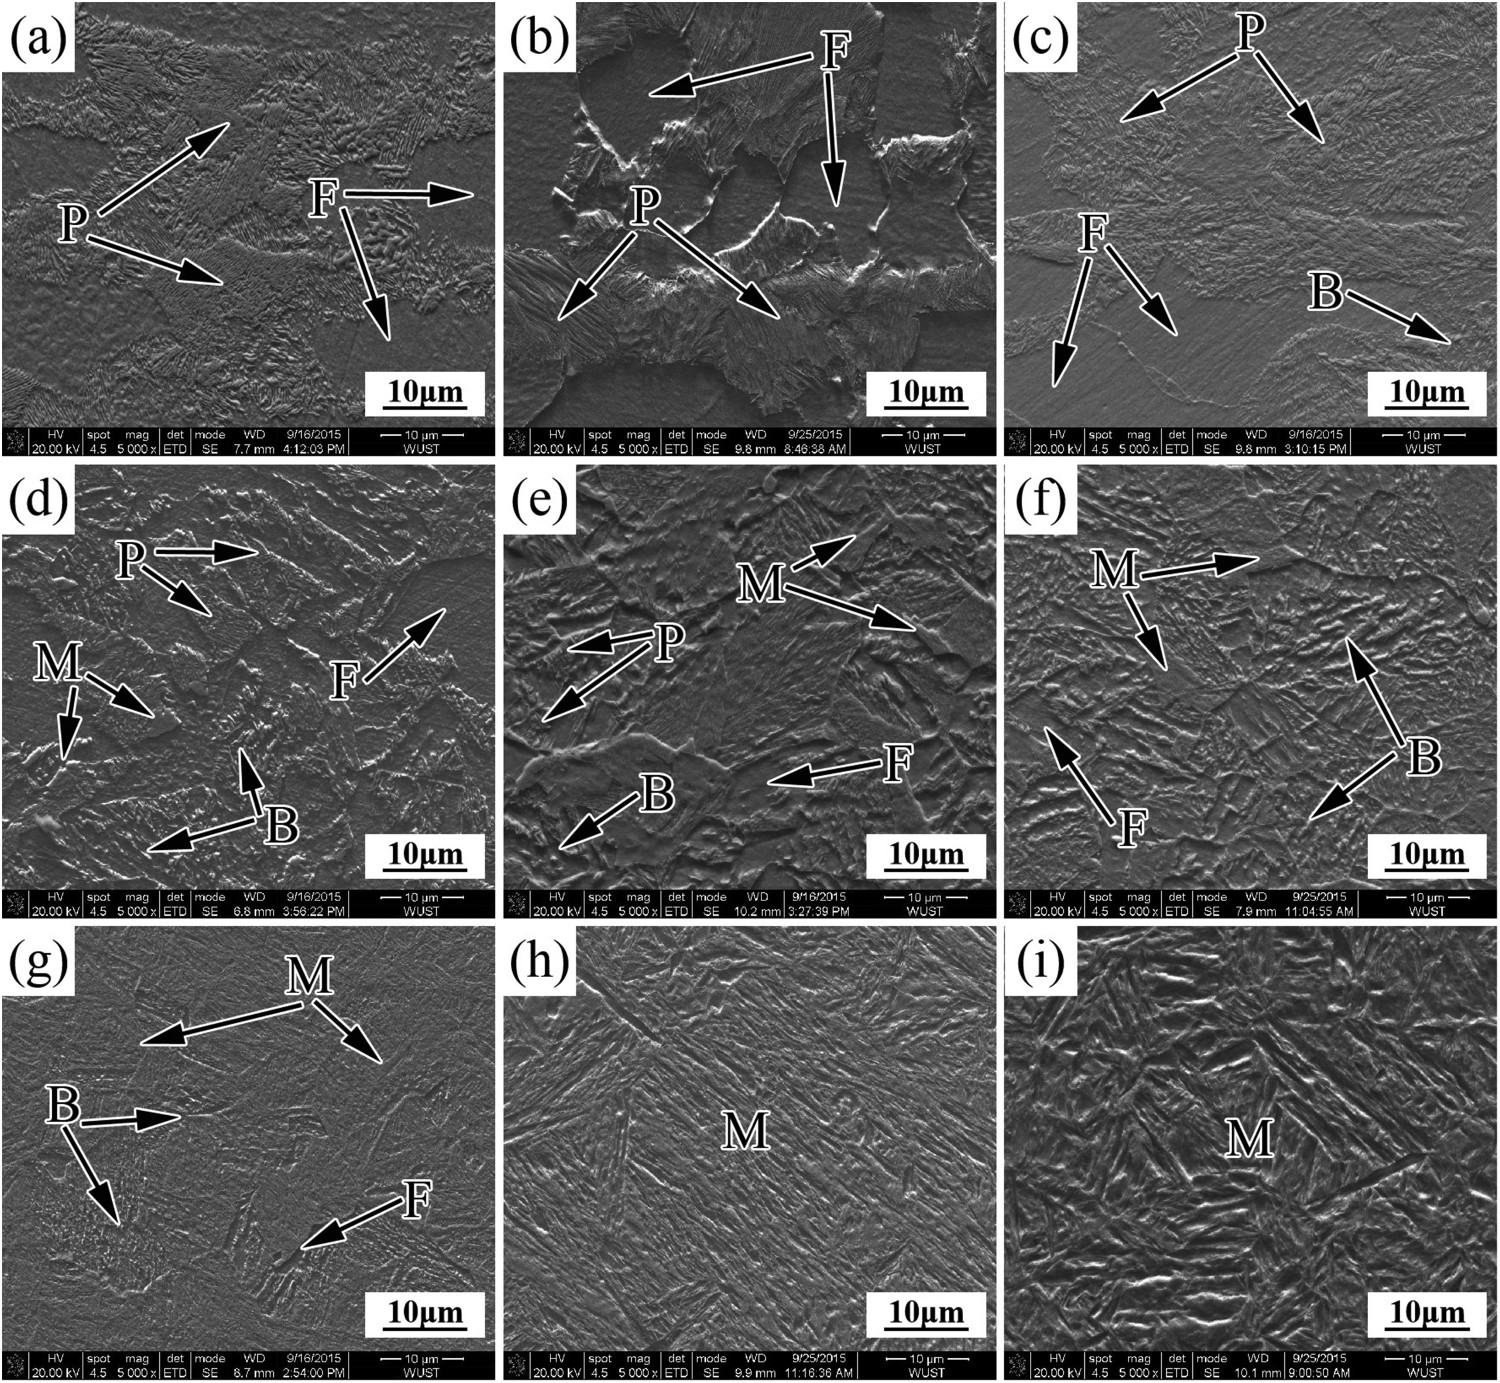
Figures 2 and 3 illustrate the OM and SEM micrographs of the samples without deformation cooled at different rates. It can be seen that when the cooling rate is in the range of 0.05–0.1°C s−1, the microstructures of samples are composed of polygonal proeutectoid ferrite and lamellar pearlite. And the polygonal proeutectoid ferrite mainly distributes along the prior austenite grain boundary. Its volume fraction decreases with the cooling rate increasing. When the cooling rate increases to 0.2°C s−1, the phase transformation of austenite to bainite and martensite would also take place. And the microstructure of the steel is composed of polygonal proeutectoid ferrite, lamellar pearlite, bainite and martensite. Moreover, with the cooling rate further increasing to the range of 1–5°C s−1, the proeutectoid ferrite transformation and pearlite transformation are completely suppressed. And with the cooling rate further increasing, the bainite transformation is also suppressed. Thus, the fully martensite microstructure is obtained when the cooling rate is larger than 10°C s−1. OM images of samples without deformation cooled at rate of (a) 0.05°C s−1, (b) 0.1°C s−1, (c) 0.2°C s−1, (d) 0.5°C s−1, (e) 1°C s−1, (f) 2°C s−1, (g) 5°C s−1, (h) 10°C s−1 and (i) 20°C s−1. SEM images of samples without deformation cooled at rate of (a) 0.05°C s−1, (b) 0.1°C s−1, (c) 0.2°C s−1, (d) 0.5°C s−1, (e) 1°C s−1, (f) 2°C s−1, (g) 5°C s−1, (h) 10°C s−1 and (i) 20°C s−1.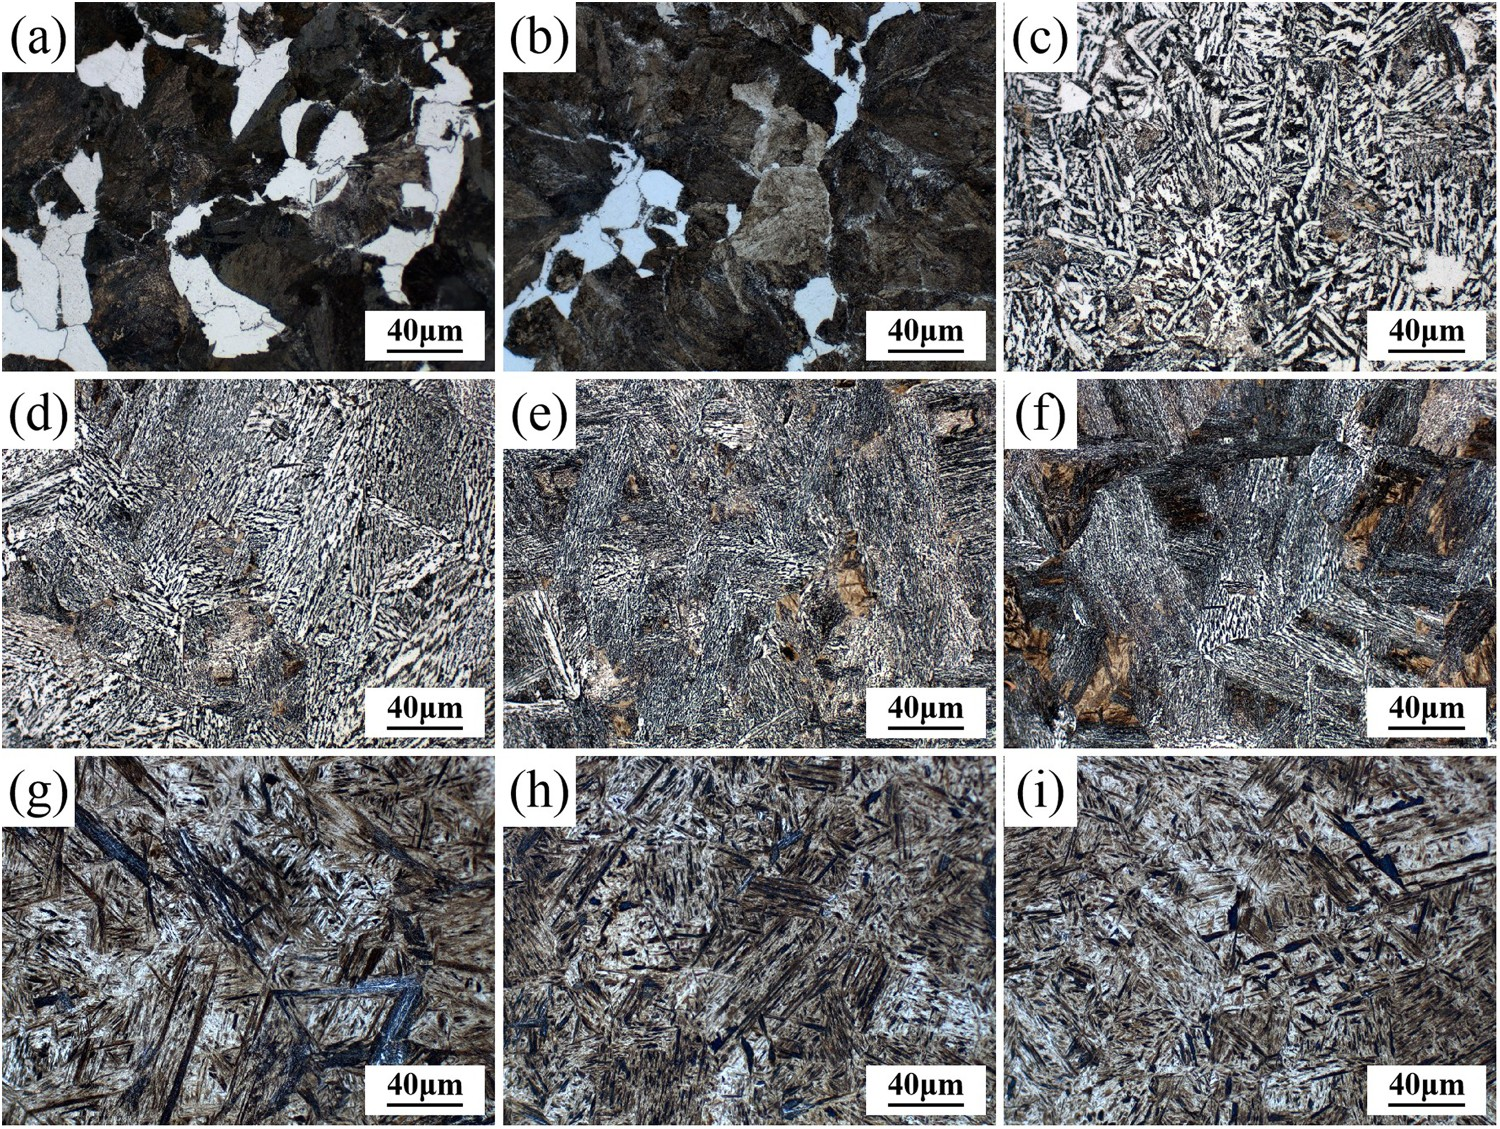
Effect of austenite deformation on transformed microstructure
The OM and SEM micrographs of the deformed samples cooled at the same rates are shown in Figures 4 and 5. It can be seen that the microstructures of samples cooled at 0.05°C s−1 to 0.1°C s−1 are similar to the samples without deformation, but the polygonal proeutectoid ferrite and lamellar pearlite in deformed samples are obviously refiner. With the cooling rate increasing to 0.2°C s−1, only a small amount of bainite is found in the steel. The microstructure, which is different from the sample without deformation, is composed of polygonal proeutectoid ferrite, lamellar pearlite and bainite. And the martensite can be found in the samples after cooling at the rate of 0.5°C s−1. Moreover, the phase transformations of austenite to polygonal proeutectoid ferrite and lamellar pearlite are not completely suppressed until the cooling rate is larger than 10°C s−1. Thus, the polygonal proeutectoid ferrite, lamellar pearlite, bainite and martensite coexist in the steel when the cooling rate is in the range of 0.5–5°C s−1. And when the cooling rate is larger than 10°C s−1, the fully martensite microstructure is obtained. OM images of deformed samples cooled at rate of (a) 0.05°C s−1, (b) 0.1°C s−1, (c) 0.2°C s−1, (d) 0.5°C s−1, (e) 1°C s−1, (f) 2°C s−1, (g) 5°C s−1, (h) 10°C s−1 and (i) 20°C s−1. SEM images of deformed samples cooled at rate of (a) 0.05°C s−1, (b) 0.1°C s−1, (c) 0.2°C s−1, (d) 0.5°C s−1, (e) 1°C s−1, (f) 2°C s−1, (g) 5°C s−1, (h) 10°C s−1 and (i) 20°C s−1.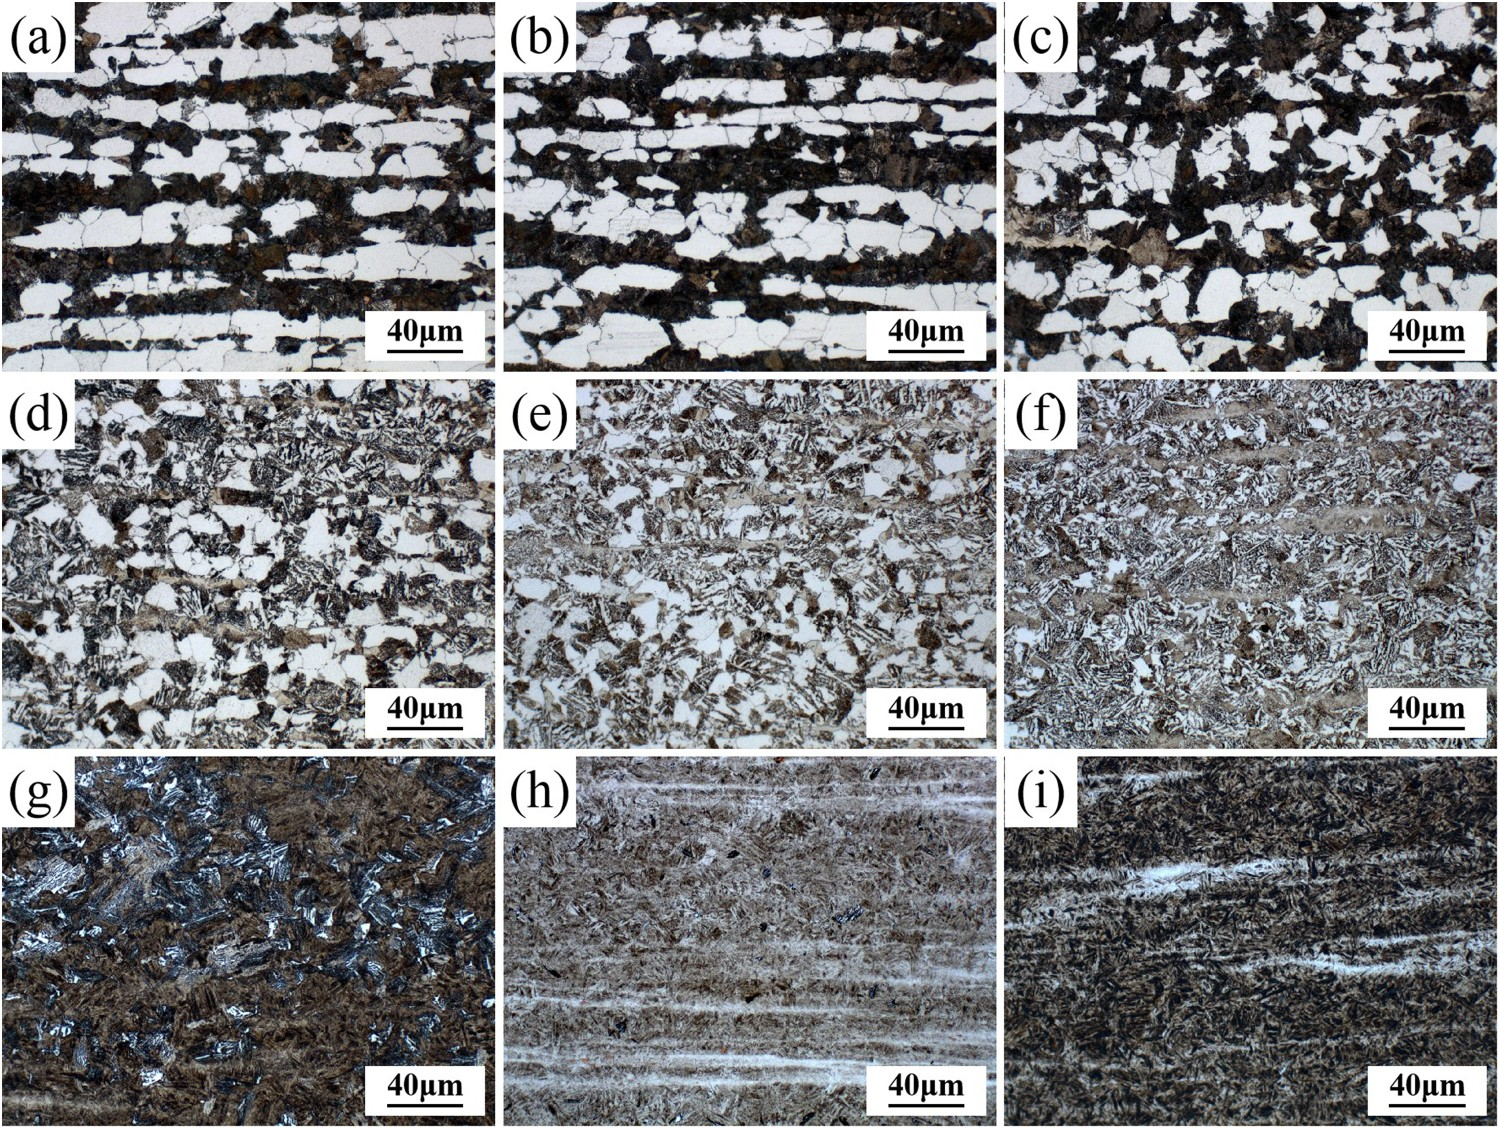
Static CCT and dynamic CCT curves
According to the results of thermal expansion curves measured by dilatometry and the microstructures of samples cooled at different rates, the static and dynamic CCT diagrams of experimental steel are constructed as shown in Figure 6. It is obvious that the phase transformation regions of static and dynamic CCT diagrams are similar and both can be divided into proeutectoid ferrite and pearlite transformation region (600 ∼ 750°C), bainite transformation region (400 ∼ 600°C) and martensite transformation region (below 400°C). In comparison with the static CCT diagram, the proeutectoid ferrite and pearlite transformation region in the dynamic CCT diagram moves toward the left side due to an increase in the cooling rate for obtaining ferrite and pearlite from approximately 0.5°C s−1 to5°C s−1. And the proeutectoid ferrite transformation temperatures increase when the experimental steel cooled at 0.2°C s−1 and 0.5°C s−1. The bainite transformation region changes little, and the martensite transformation region moves toward the bottom left side. The martensite transformation starting temperature (Ms) decreases from 391°C to 368°C. CCT curve of 30CrMo steel: (a) static CCT; (b) dynamic CCT.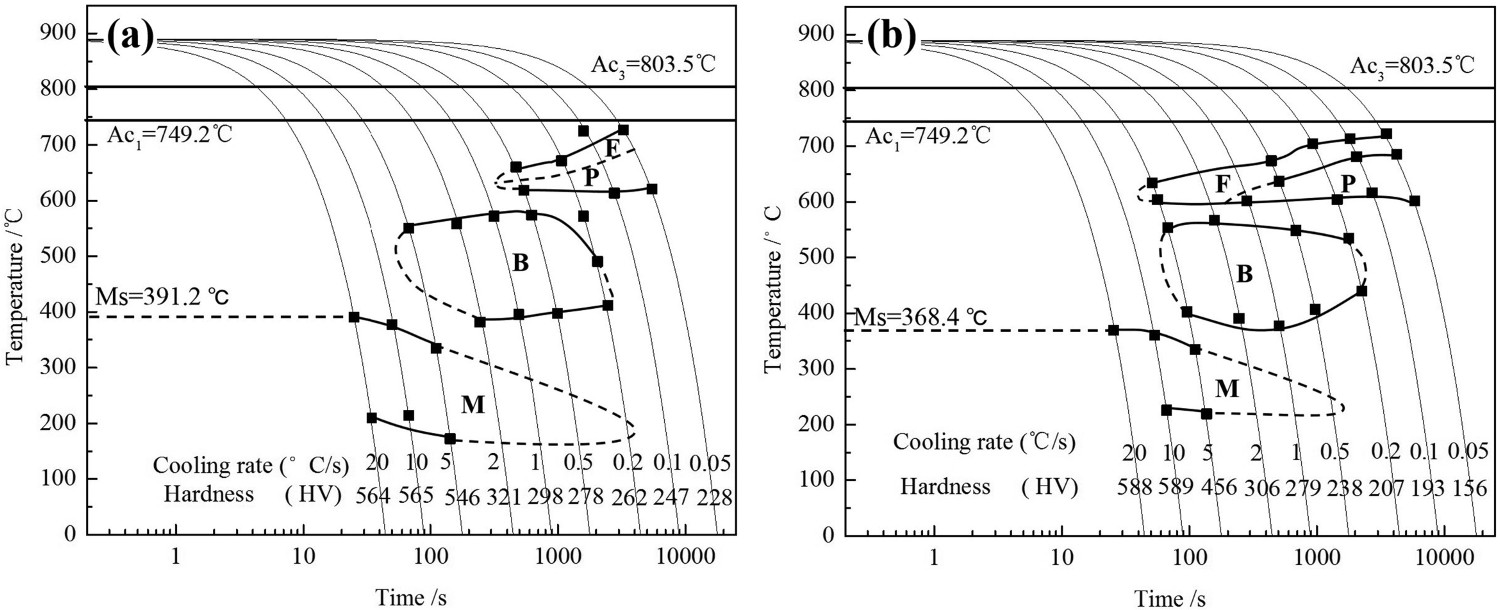
Effect of austenite deformation on the ferrite transformation
Figure 7 shows the volume fractions and average grain sizes of ferrite in the samples with and without deformation cooled at different rates. It can be seen that with the cooling rate increasing, the volume fraction and the average grain size of ferrite decreased. The larger volume fraction and finer grain size of ferrite are obtained in the deformed sample. When the cooling rate is 0.05°C s−1, the volume fraction and the average size of ferrite in the deformed sample are 49.6% and 13.0 µm, respectively. Moreover, when the cooling rate is larger than 1°C s−1, the ferrite in the sample without deformation disappears, but there is 30% volume fraction of ferrite in the deformed sample. Combined with the CCT diagrams as shown in Figure 6, it can be basically determined that the increase in the cooling rate can inhibit ferrite transformation while the austenite deformation will promote the ferrite transformation. As a diffusive transformation, the increase in the cooling rate can increase the degree of supercooling for ferrite transformation, resulting in the driving force for nucleation increasing, which is conducive to the ferrite transformation and refining the grains. However, it can also shorten the residence time of supercooled austenite in the high-temperature region and suppress the atoms diffusion, which inhibits ferrite transformation. Volume fraction and average grain size of ferrite in experimental steel cooled at different rates.
For deformed samples, the dislocation density in matrix significantly increases. And the deformation storage energy will be introduced which mainly depends on the dislocation energy and can be described as [12]: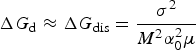
Effect of austenite deformation on the pearlite transformation
Figure 8 shows the pearlite volume fractions of the samples cooled at different rates. It first increases (0.05∼0.1°C s−1) and then decreases (0.2∼20°C s−1) with the cooling rate increased. Combined with the results shown in Figures 6 and 7, it can be found that when the cooling rate is smaller than 0.1°C s−1, the pearlite transformation plays a dominant role in the steel. And it is promoted by the cooling rate increasing. In addition, for the deformed sample, as the austenite deformation strongly promotes the formation of proeutectoid ferrite, the pearlite transformation is accordingly inhibited. Thus, the pearlite volume fraction of deformed sample is much less than that of the sample without deformation. When the cooling rate is in the range of 0.2–2°C s−1, both the ferrite and pearlite transformation are inhibited by the cooling rate increasing. But the pearlite volume fraction of deformed sample is significantly larger than that of the sample without deformation, which means that the austenite deformation promotes not only ferrite transformation but also pearlite transformation [18]. Pearlite volume fraction of experimental steel cooled at different rates.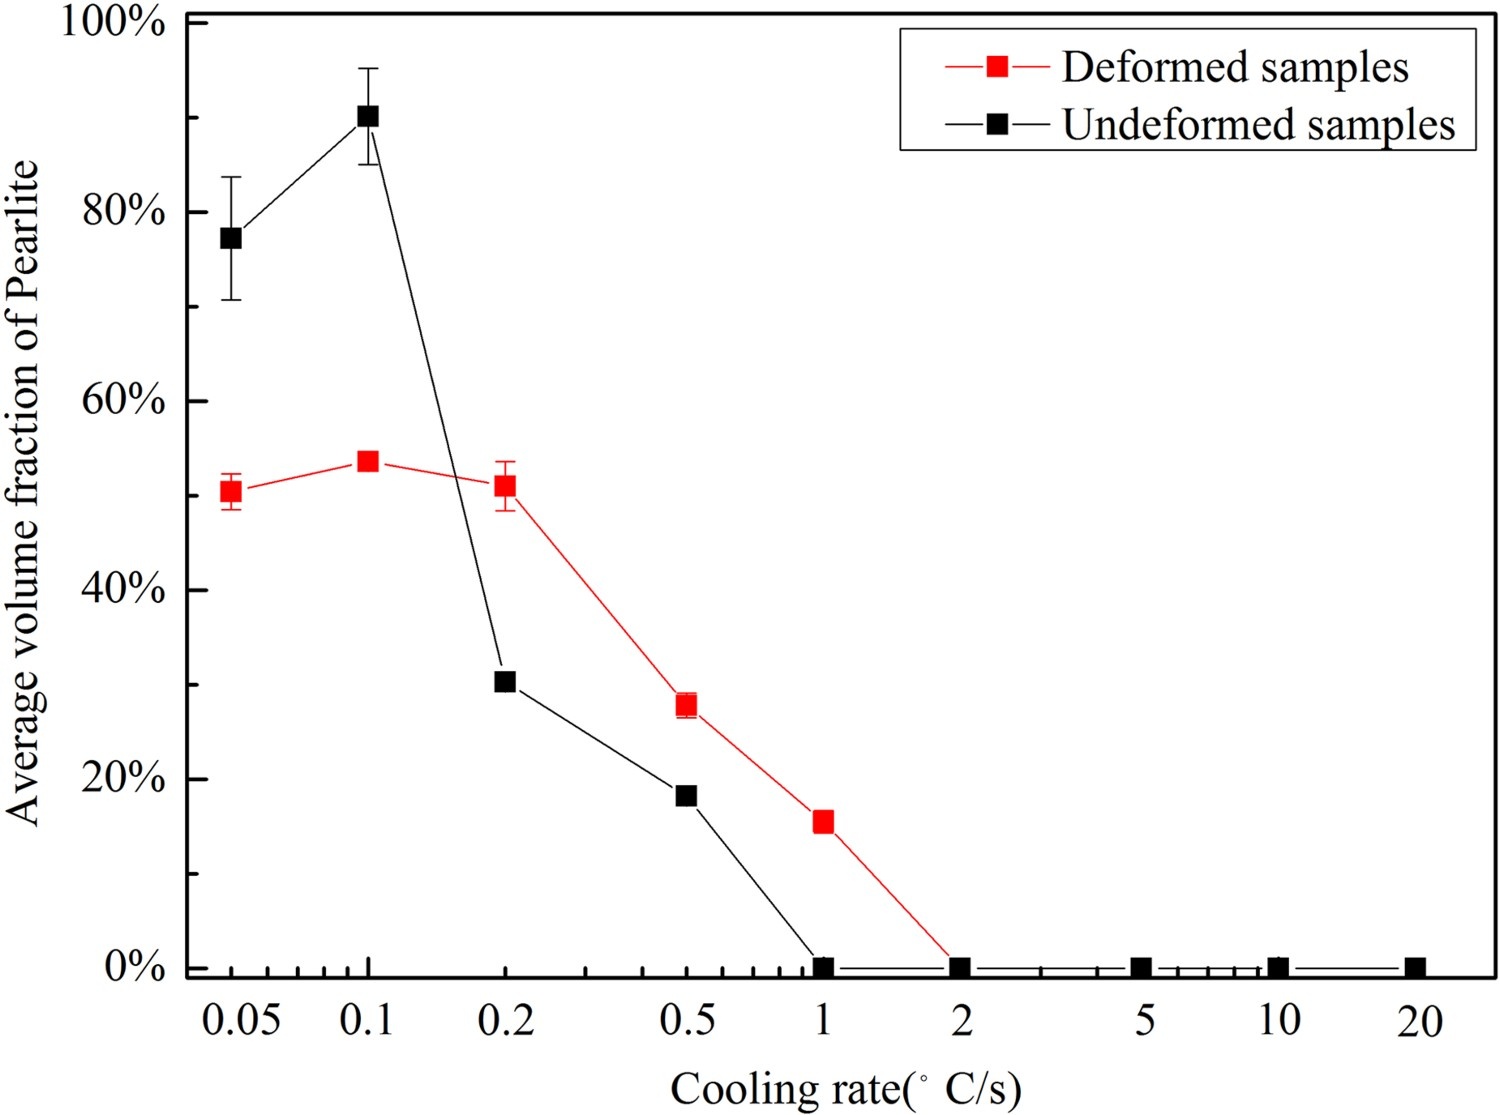
Effect of austenite deformation on the bainite transformation
Figure 9 shows the bainite volume fraction of experimental steel varied with cooling rate. As the bainite transformation is determined by the degree of supercooling and the diffusion of carbon atom, the increase in the cooling rate will lead to the driving force increasing which is conducive to the bainite transformation but also shorten the carbon atom diffusion time. Thus, with the cooling rate increasing, the bainite volume fraction of experimental steel increases first and then decreases. For the deformed samples, the bainite volume fraction is significantly less than that of the sample without deformation due to the most of austenite in matrix has been transformed into ferrite and pearlite. In addition, Hu [19] reported that bainite transformation might be retarded by austenite deformation due to the retardation of growth by dislocation debris in deformed austenite. Bainite volume fraction of experimental steel cooled at different rates.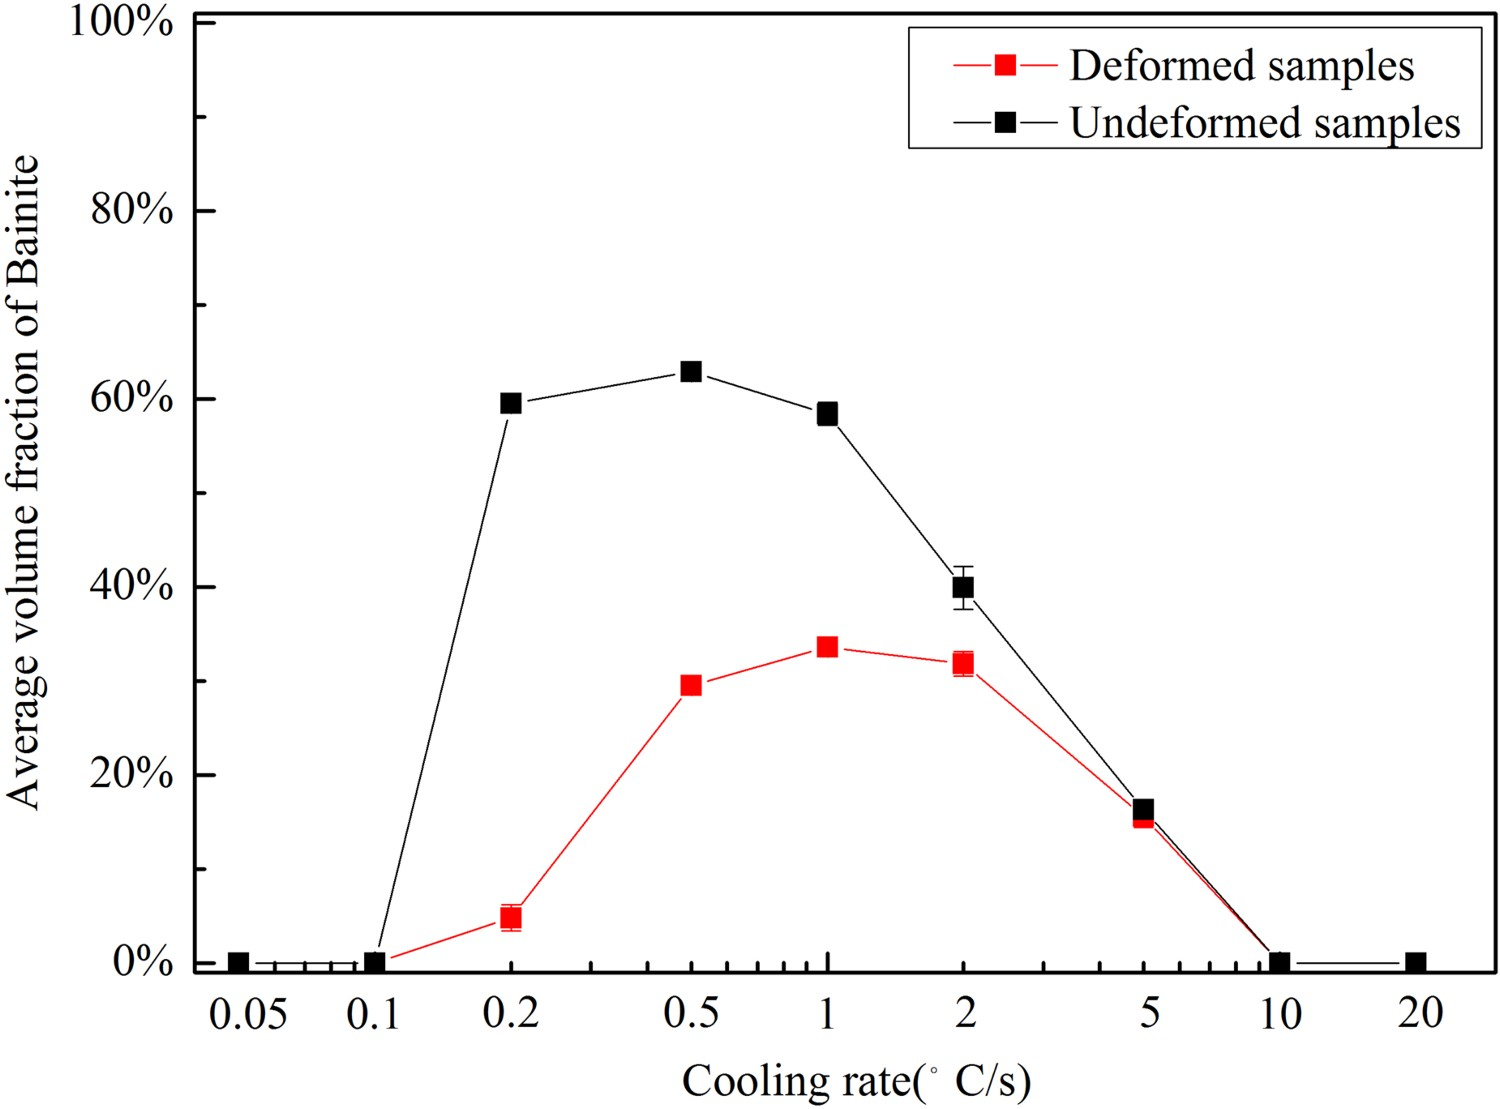
Effect of austenite deformation on the martensite transformation
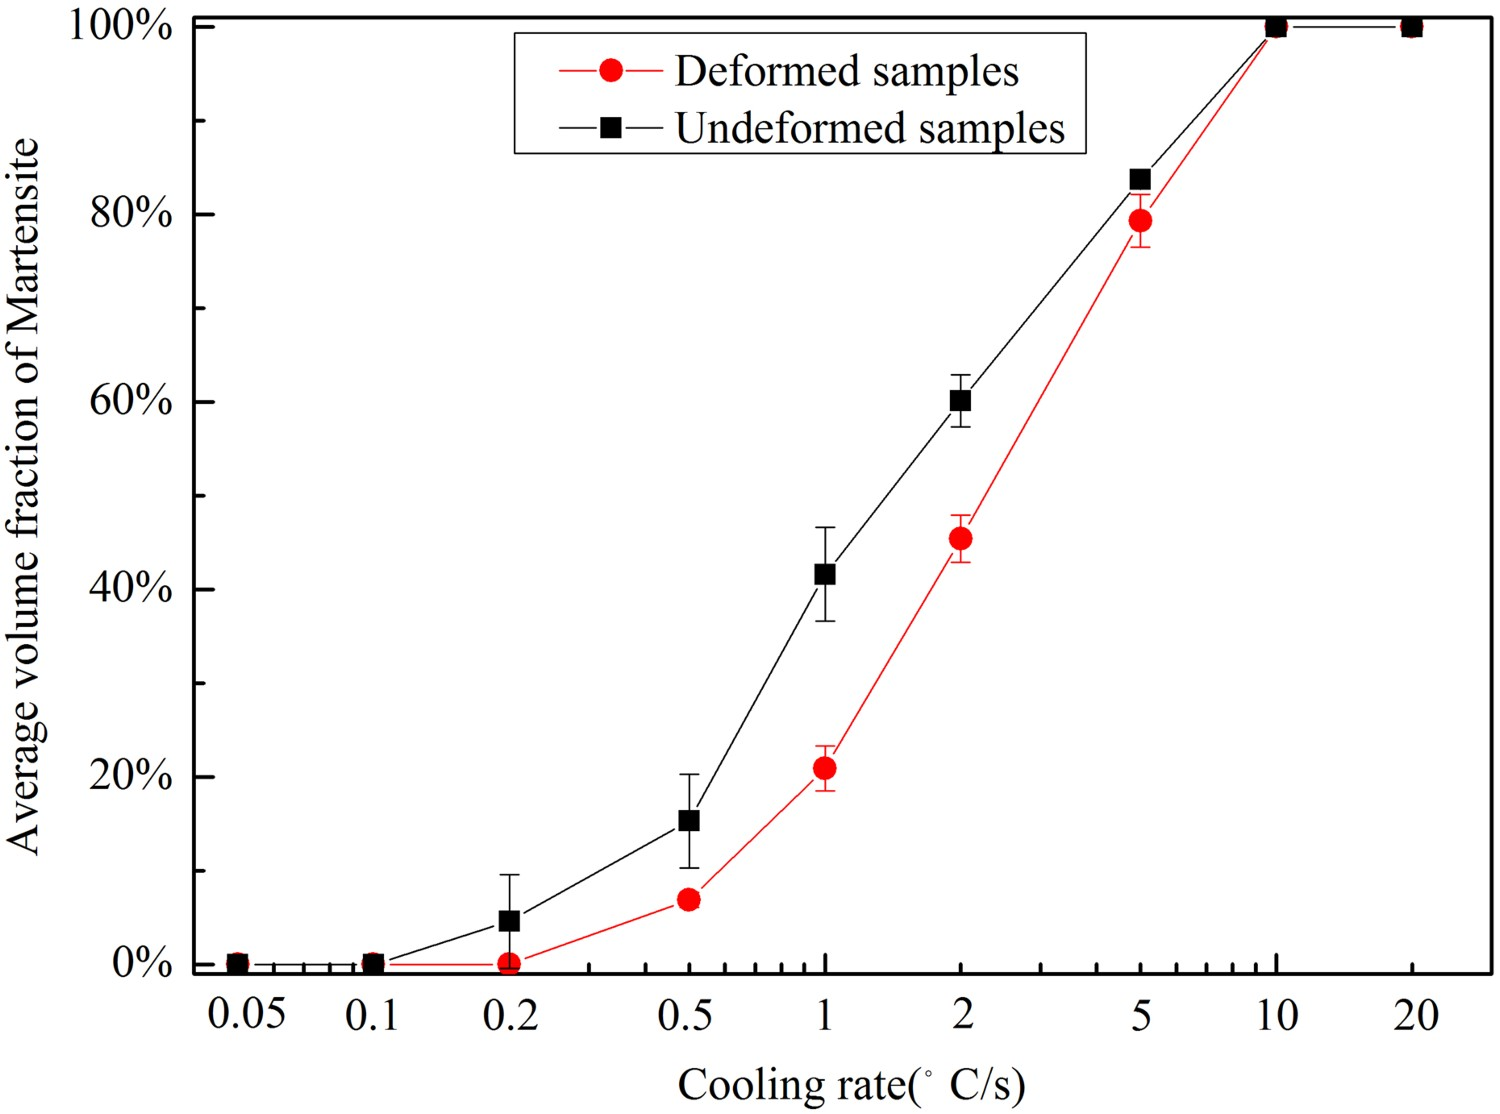
Figure 10 shows the martensite volume fraction of experimental steel varied with cooling rate. It increases with the cooling rate increasing and exhibits S-shaped. And the martensite volume fraction of the sample without deformation is higher than that of deformed sample under the same cooling rate. It is well known that the higher cooling rate, the more martensite volume fraction will obtain in steel. In addition, previous studies [20,21] indicated that austenite deformation could increase the mechanical stabilization of austenite and enhance the austenite by increasing the crystal defects, thus inhibiting martensitic transformation. Meanwhile, austenite deformation could refine the austenite grain size and increase the grain boundary area, which was conducive to the occurrence of diffusive transformation and hinders the martensite transformation [22,23]. Moreover, Yang [24] confirmed the dependence of the M
s on the austenite grain size by the Fisher model. And the relationship between M
s and austenite grain size can be described as: Martensite volume fraction of experimental steel cooled at different rates.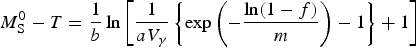
Effect of austenite deformation on the hardness of experimental steel
The hardness of experimental steel cooled at different rates is shown in Figure 11. It is well known that the hardness of steel depends on its microstructure, and the hardness of martensite and bainite is higher than that of ferrite and pearlite. Thus, with the cooling rate increasing, the amount of bainite and martensite increases, resulting in the hardness of experimental steel gradually increasing. In addition, when the cooling rate is smaller than 0.1°C s−1, although the microstructure of experimental steel consists of ferrite and pearlite, the hardness of undeformed sample is significantly higher than that of deformed sample. It is mainly attributed to the larger pearlite volume fraction of undeformed sample. And when the cooling rate is in the range of 0.2–5°C s−1, the larger volume fraction of bainite and martensite of undeformed sample leads to the higher hardness. Moreover, when the cooling rate is higher than 10°C s−1, the microstructures of the samples with and without deformation are fully martensite. But the austenite deformation can refine the martensite and increase the dislocation density in martensite, resulting in the higher hardness in deformed samples [22]. Hardness of experimental steel varied with cooling rate.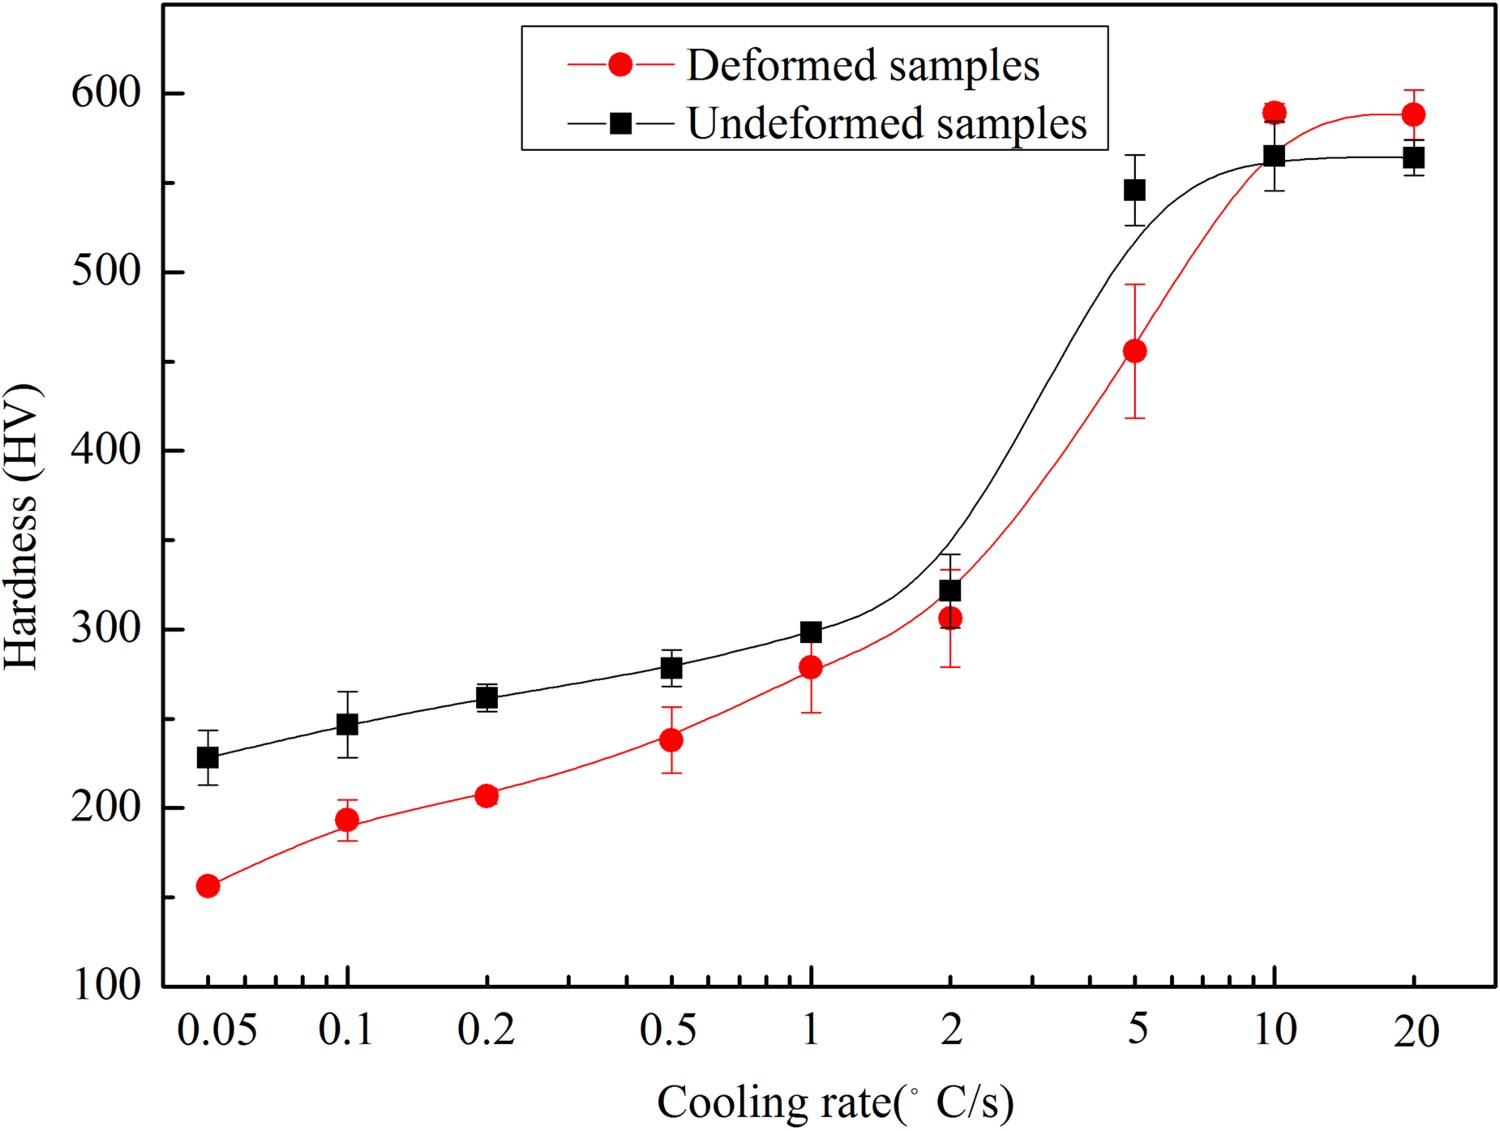
Conclusions
The dynamic CCT diagram of 30CrMo steel simulated by CSP process is constructed. The desired microstructure of proeutectoid ferrite and pearlite with a lower hardness can be obtained in the 30CrMo steel cooled at a rate of smaller than 0.1°C s−1. The austenite deformation can promote the proeutectoid ferrite and pearlite transformation and refine the microstructure of 30CrMo steel. And its effect on the proeutectoid ferrite transformation is more obvious. The M
s temperature of 30CrMo steel is 391°C. The austenite deformation inhibits the martensite transformation of 30CrMo steel and decreases the M
s temperature to 368°C. When the cooling rate is larger than 10°C s−1, the fully martensite microstructure is obtained.
Footnotes
Disclosure statement
No potential conflict of interest was reported by the author(s).