
Abstract
MnS inclusions in steels usually have many kinds of morphology. It is difficult to accurately obtain the characteristics of inclusions by two-dimensional observation due to the complex morphology of sulphides in steel, especially the type II MnS inclusions. In this study, the three-dimensional morphology of sulphide in high sulphur steel was investigated by using non-aqueous solution electrolytic etching. Inclusions with a circle and ellipse morphology in two-dimension show more complex morphology in three-dimension. The differences in the distribution, size, shape of sulphides between the two-dimensional and three-dimensional state in the high sulphur steel were studied. Compared with the statistical results of inclusions in two-dimension, the diameter and area in three-dimension are larger than those in two-dimension. Moreover, the proportional function between the size of inclusion in two-dimension and that in three-dimension is proposed.
Introduction
The element S is usually added to steels to form MnS inclusions for the purpose of improving machinability [1,2], retarding grain growth [3,4] and inducing intragranular ferrite [5,6]. The machinability and mechanical properties of steels are strongly influenced by the morphology of MnS inclusion [7]. The irregular MnS inclusion, such as rodlike, chain-like, dendritic MnS (type II) inclusion [8], may cause the deterioration of transverse impact properties [9]. Globular (type I) and angular MnS (type III) inclusion with uniform distribution are more beneficial to the steel properties compared with type II MnS inclusion [10–13]. Therefore, it is very important to acquire the detailed information of MnS inclusions such as the morphology, size and distribution accurately for the better control of sulphides and the improvement of steel properties [14].
Two methods are often used to examine inclusions in steels. One is the two-dimensional (2D) investigation of inclusions on a polished surface of a steel sample. The other is the three-dimensional (3D) investigation of inclusions obtained by using ultrasonic testing, electromagnetic testing, reagents, and electrolysis [15,16]. However, the size of MnS inclusion determined by 2D observation cannot represent the true size, especially for those irregular shaped [17]. The 3D analysis of inclusions provides more reliable results than the 2D analysis of inclusions on the metal cross-section [18]. However, those methods are only used to determine the morphology of MnS and to classify sulphides according to their morphology. The size of MnS inclusions was not measured, and the relationship between 2D and 3D was seldom analysed. In the service of the steel, the steel properties may be quite different in different directions, such as the rolling direction and the direction perpendicular to the rolling direction, the difference of which is usually caused by the elongated MnS inclusion. The parameter that really affects the steel properties ought to be the projection size of the inclusions in these directions.
In the present study, the 3D morphology of MnS inclusions in 1215 steel was obtained by non-aqueous solution electrolytic etching. The projection size of 3D inclusions perpendicular to the observation surface was counted by Image-Pro Plus 6.0 software and compared with the size of inclusions with 2D morphology. The relationship between the size of inclusion in 2D and that in 3D is proposed according to the statistical result, providing a reference for the further analysis of the steel properties.
Material and methods
Chemical composition of 1215 steel (wt-%).
Steel samples with an observation area of 10 mm × 10 mm were machined from the steel plate. The position of the steel sample taken from the plate was located at the quarter of the side length in the center and the observation surface was parallel to the casting direction, as shown in Figure 1. The surface of the samples was polished by 400#, 800#, 1000#, 1500# and 2000# silicon carbide abrasive papers and diamond paste. The samples were cleaned with alcohol and then dried. The 2D morphology and distribution of inclusions on the polished surface of the steels were analysed by scanning electron microscope. Schematic diagram of sampling.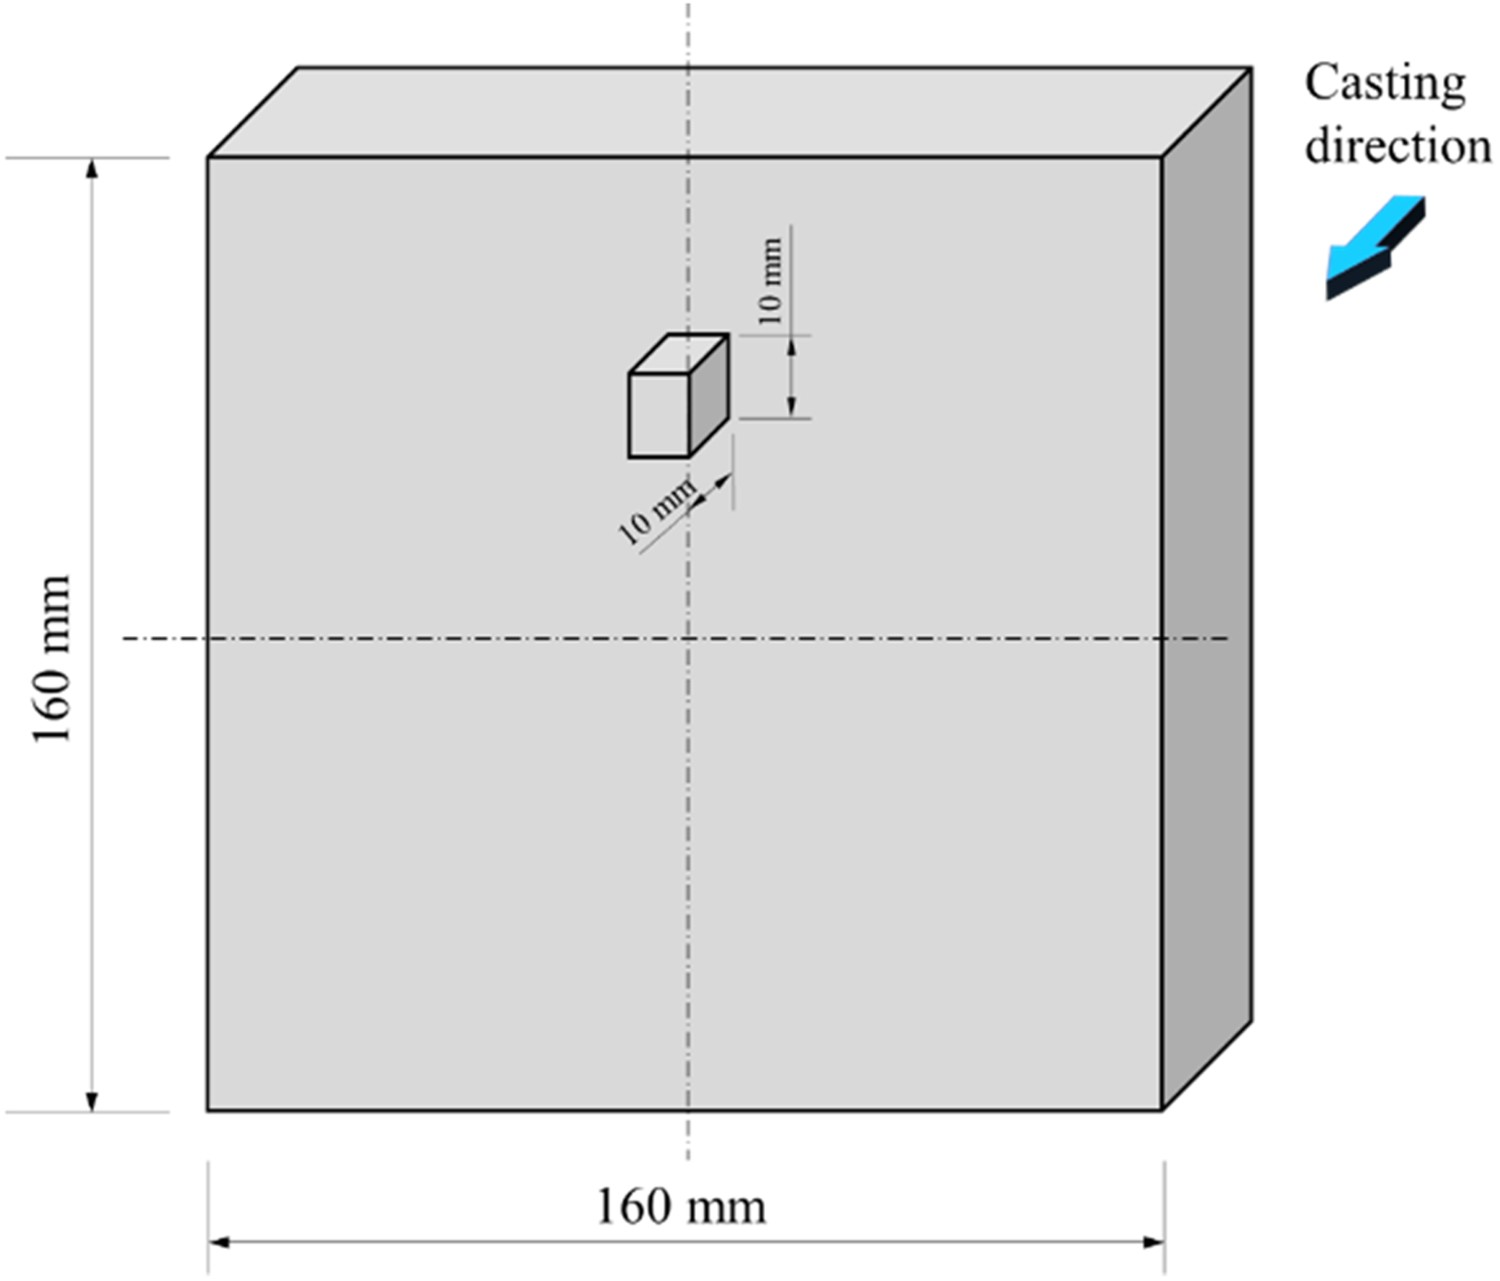
Except for the 2D analysis, the samples were electrolytically etched in 10% AA non-aqueous solution (1% tetramethylammonium chloride-10% acetylacetone-89% methanol), preparing for the 3D analysis. The electrolytic experimental device is shown in Figure 2. Schematic of the electrolytic device.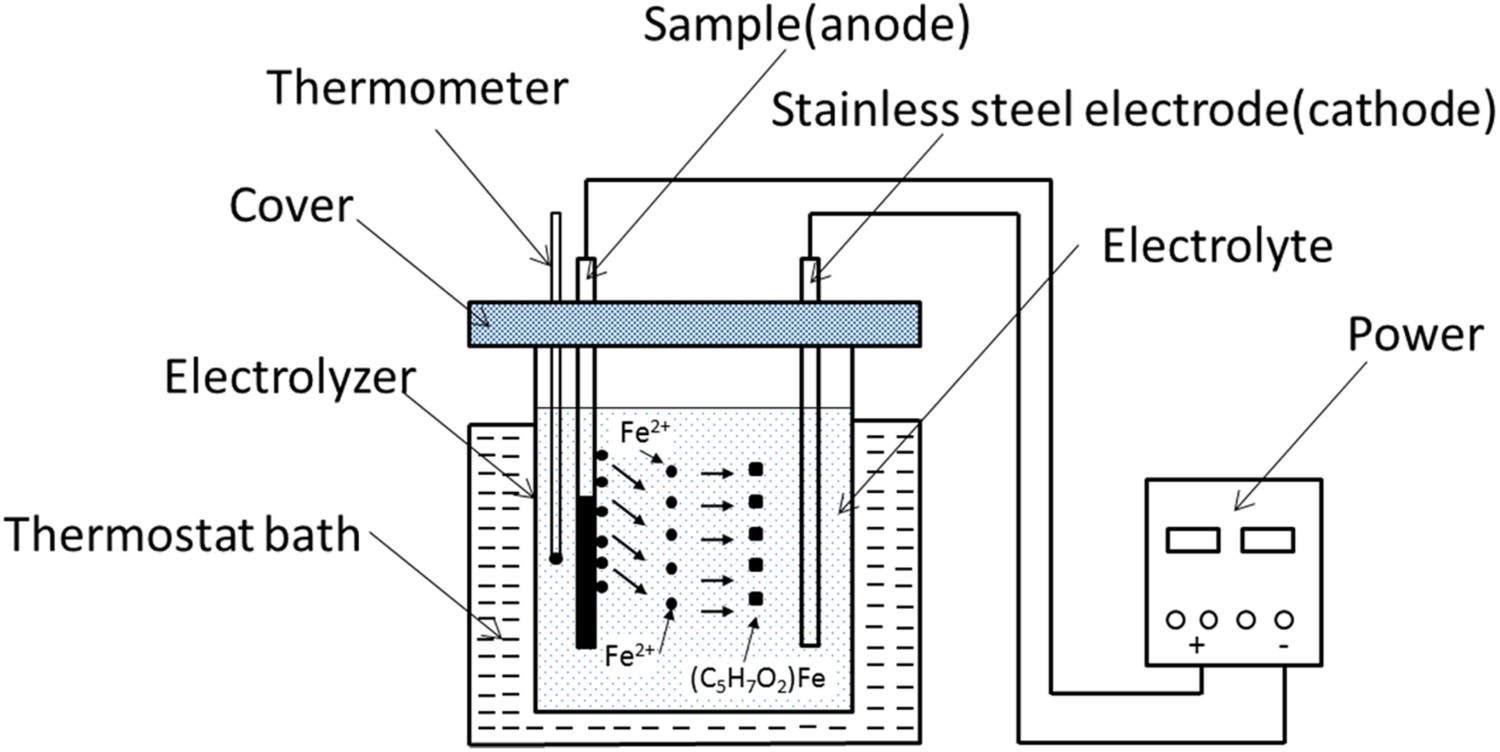
In the electrolytic etching process, stainless steel electrode was used as the cathode, the 1215 steel sample was used as the anode. The sample was etched for 25 min at 0°C. After electrolytic etching, the steel sample was cleaned in alcohol by ultrasonic cleaner and then dried. Scanning electron microscopy (Phenom TM) was adopted in observing the 3D morphology of inclusions. SEM images of MnS inclusions in 1215 steel were captured at a magnification of 1000×. The Image-Pro Plus software was used to make statistics of inclusions.
Results and discussion
Morphology and distribution of inclusions
Figure 3 shows the distribution and morphology of MnS inclusions on the polished surface of the steel sample. The distribution of MnS inclusions was uniform. The teardrop-shaped or rodlike inclusions were categorised as type II MnS, and the spherical inclusions were type I MnS. From the 2D view, there are more type I inclusions than type II inclusions. It is approximately 80.7% for type I inclusions and 19.3% for type II inclusions. 2D SEM images of MnS inclusions in 1215 steel.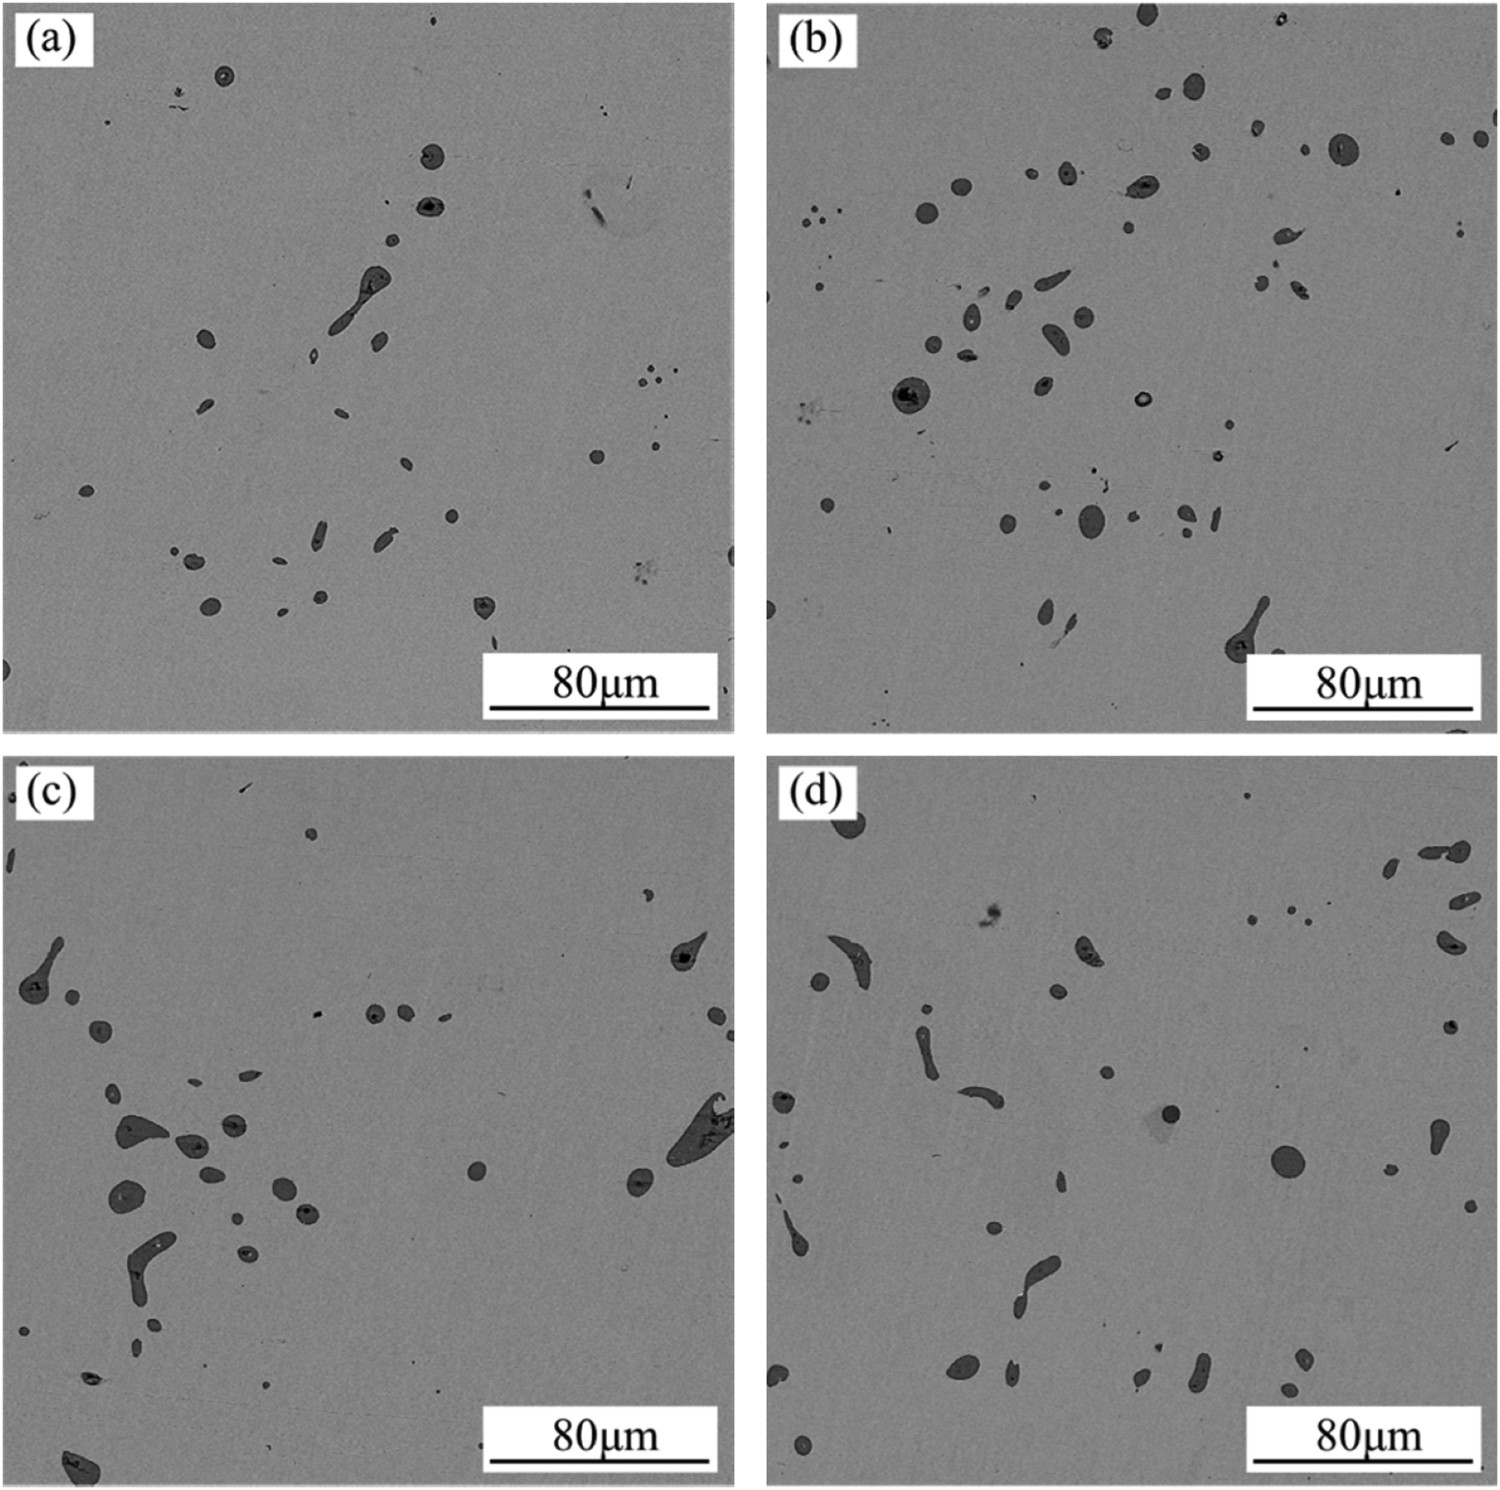
After the 2D analysis of MnS inclusions, samples after electrolytic etching were observed by SEM. The results are shown in Figure 4. 3D SEM images of MnS inclusions in 1215 steel.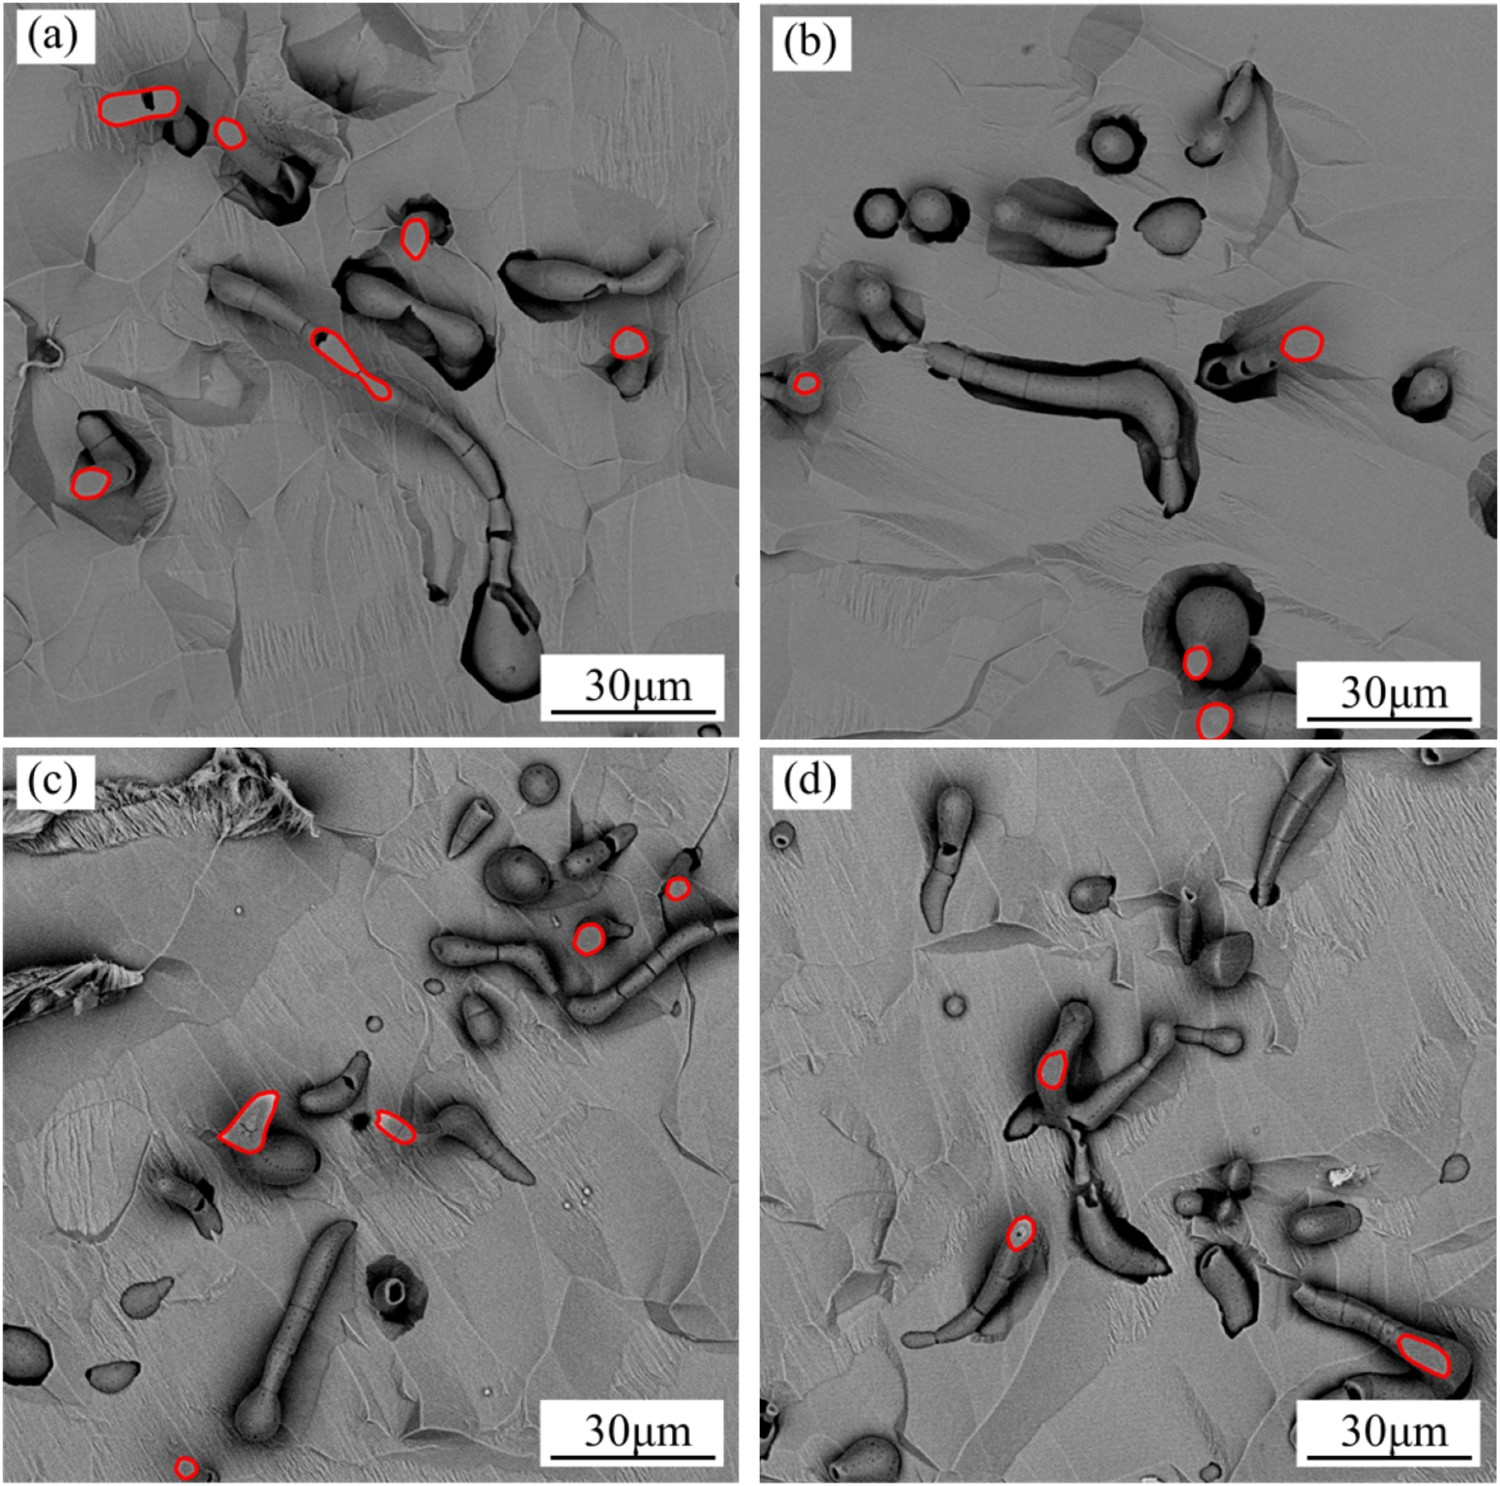
As shown in Figure 4, there is two distinctive morphology of MnS inclusions: Type I with spherical shape and type II with rodlike shape in the steel. The estimated number percentage is 1.6% for the former and 98.4% for the latter, quite different from the 2D observation. In Figure 4, some inclusions have a complete morphology, while other inclusions have flat surfaces, which seem to be in the same plane. The flat surfaces of the inclusions, shown with red profile, ought to be caused by the polishing of the original steel surface. After electrolytic etching, the inclusions with a height larger than the etching depth will still embed in the steel matrix, therefore show the present morphology.
Composition analysis of inclusions
In the 2D analysis of inclusions, energy dispersive spectroscopy (EDS) was employed to detect the inclusions. The EDS results of four inclusions, shown in Figure 5(a), are listed in Table 2. Except for the steel matrix element Fe, the atomic ratio of Mn to S in all inclusions is approximately 1:1, indicating that these are typical MnS inclusions. The EDS mapping result of the 3D inclusions shown in Figure 5(b) also verifies this. The total amount of inclusions in the steel is calculated by FactSage 7.3 using the databases of ‘FactPS’, ‘FToxid’, ‘FSstel’. The results show that 0.9768% MnS and 0.01487% Al2O3 will be generated at room temperature. The amount of Al2O3
− is much less than MnS. Besides, the Al2O3 mainly exists inside the MnS, as shown the tiny black particles in Figure 3. For the sake of simplicity, the Al2O3–MnS complex inclusion is roughly considered as MnS inclusion. The SEM images and EDS mapping result of inclusions in 1215 steel. Composition of #1–#4 inclusion (at.-%).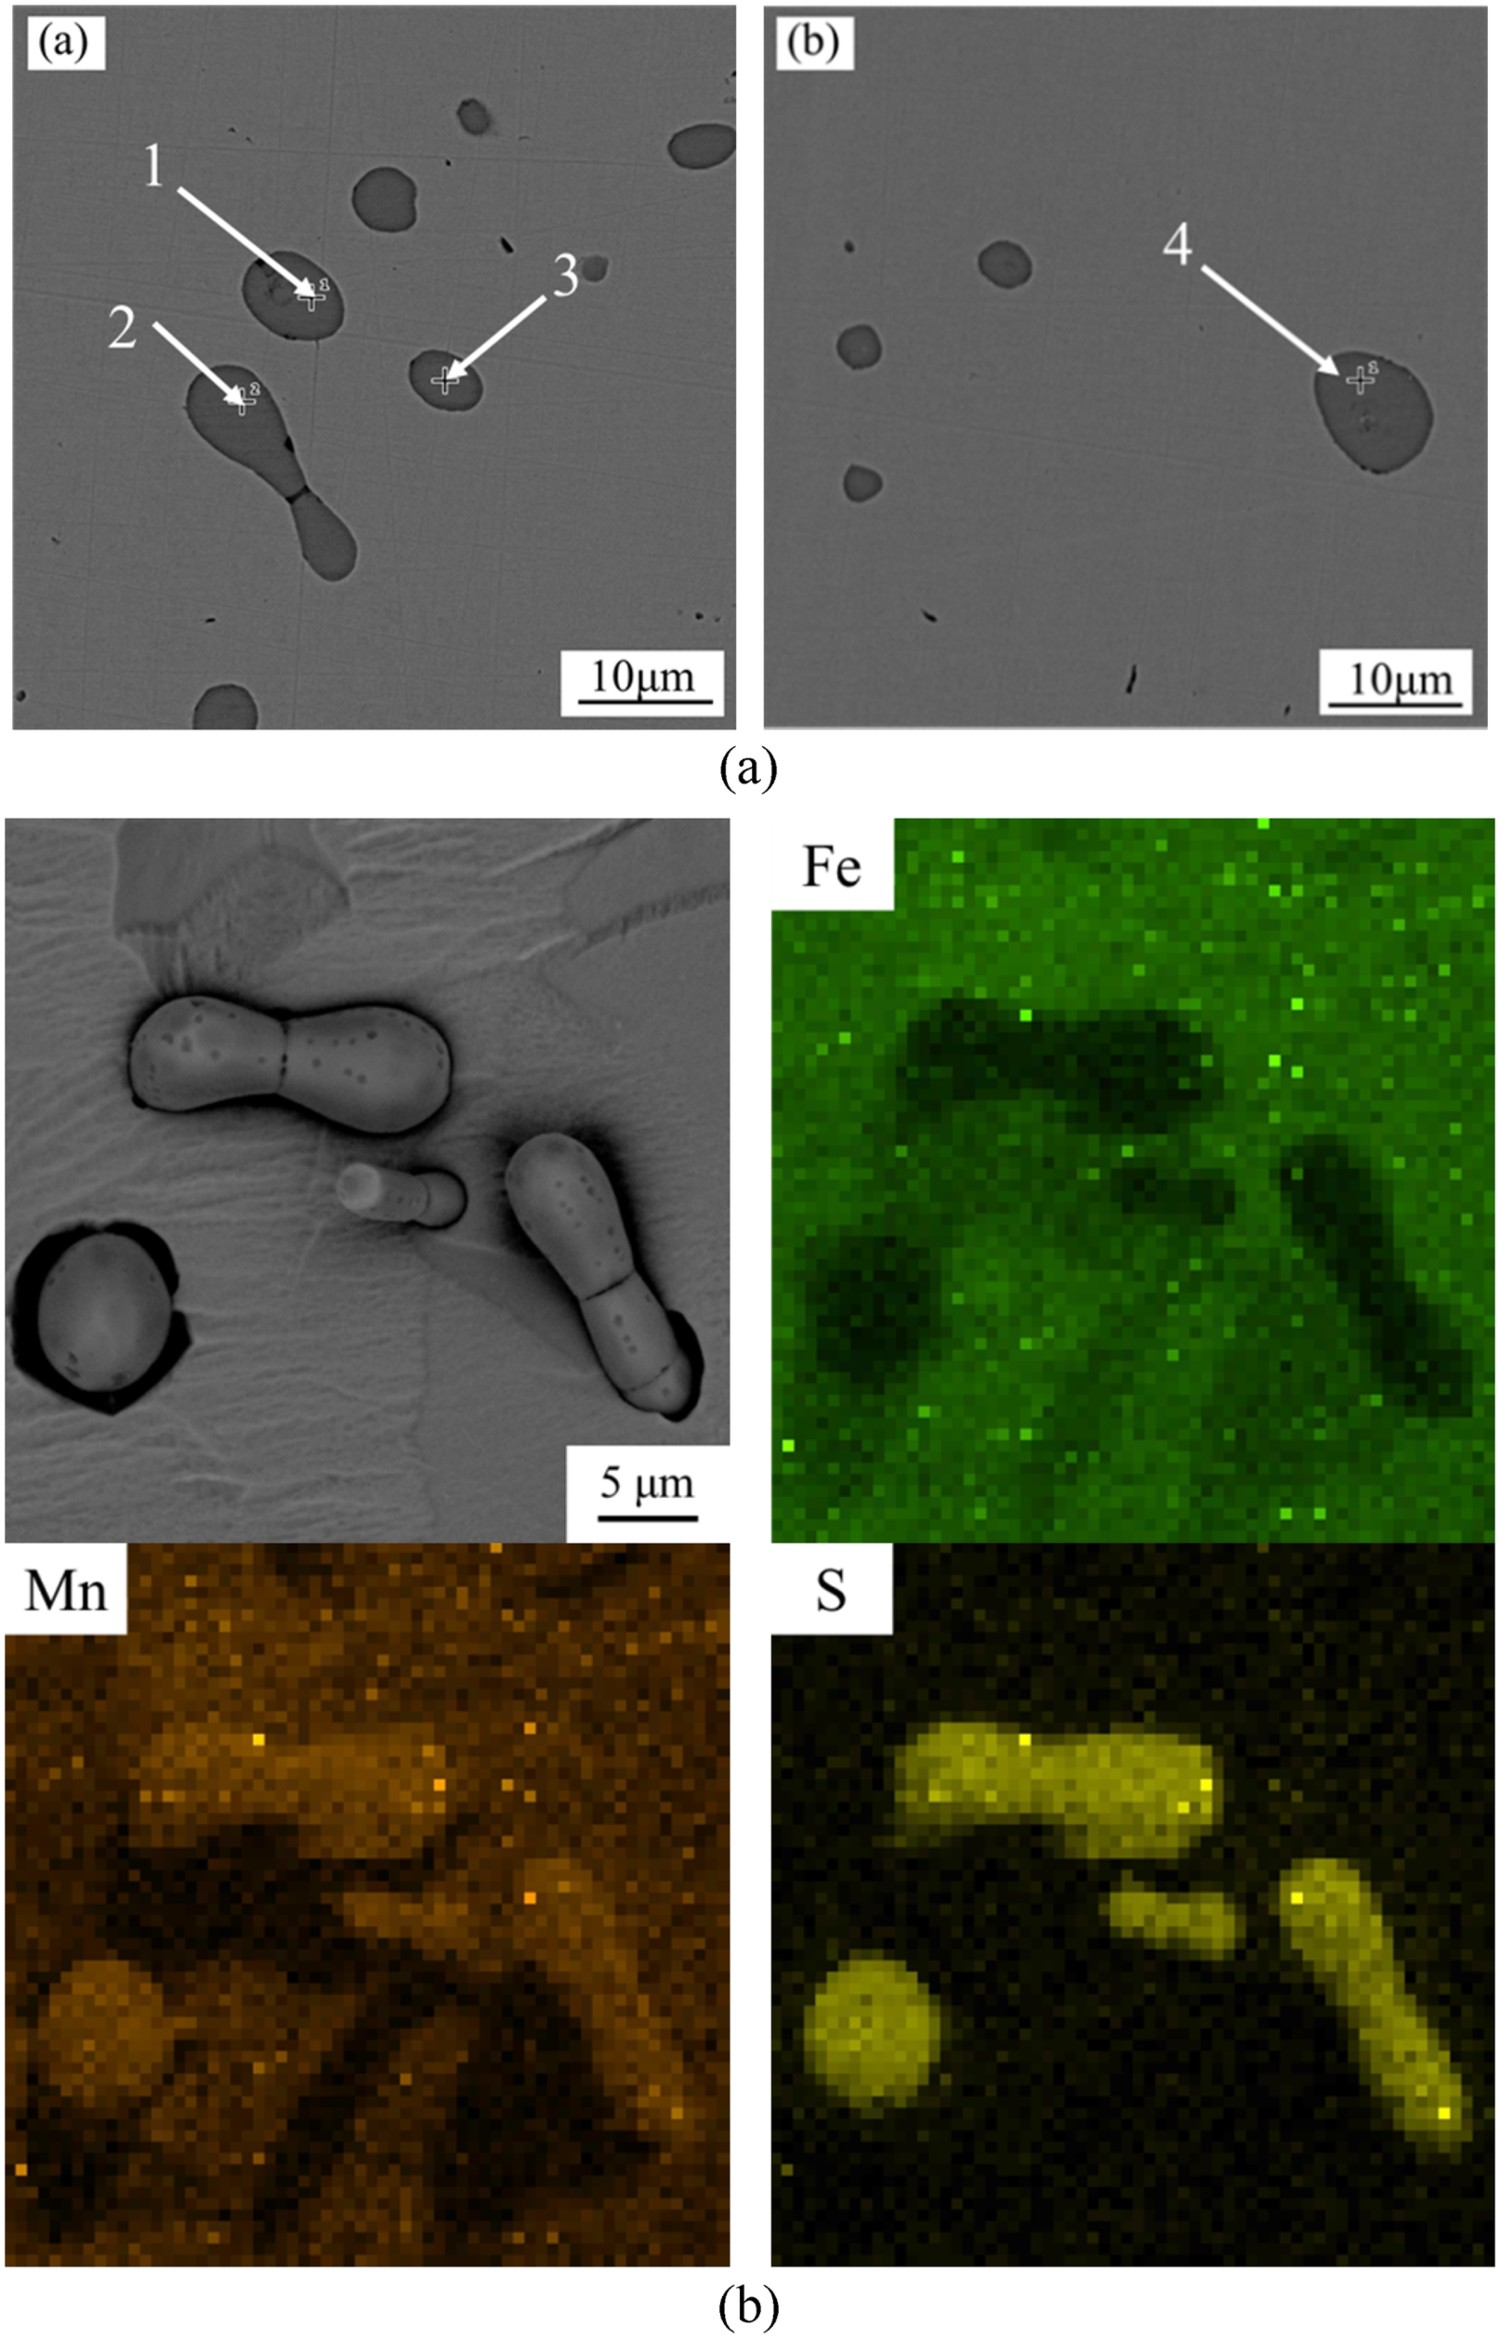
Statistics of inclusions
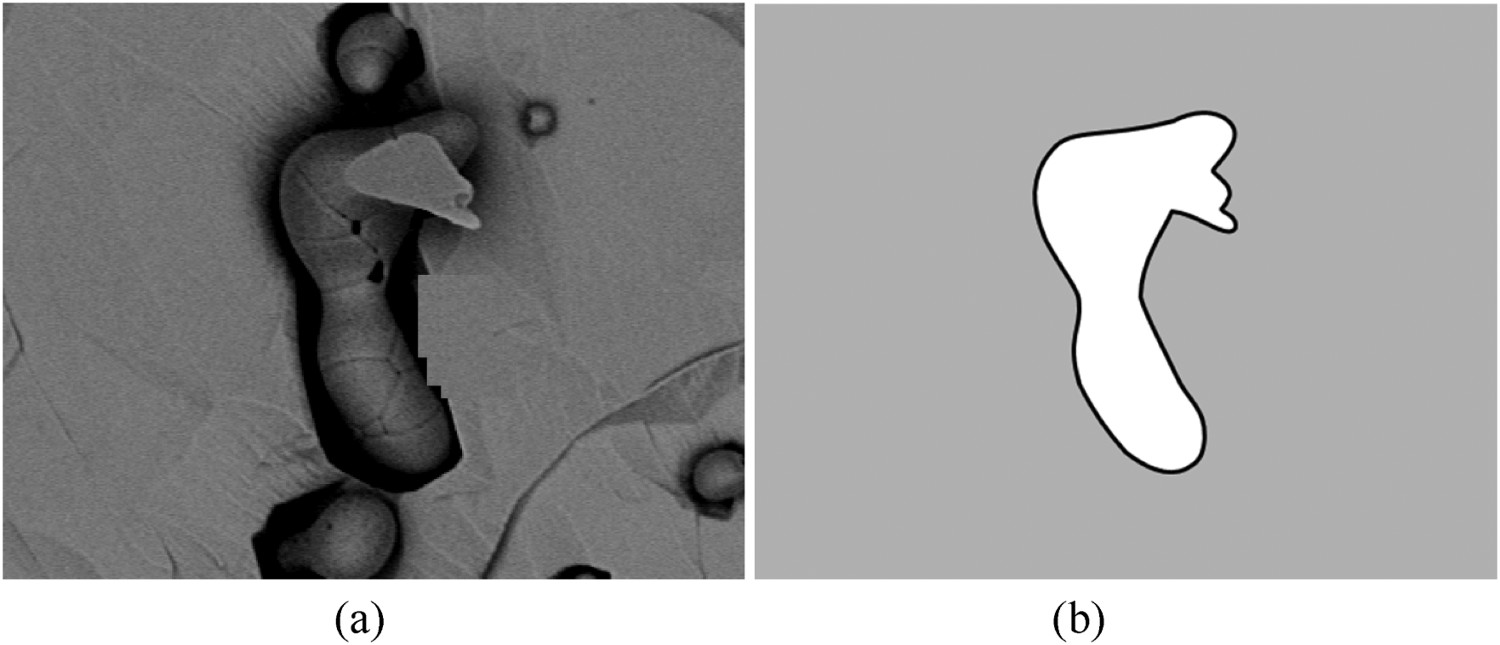
In order to investigate the relation between the size of MnS inclusions in 2D and the projection size in 3D, Image-Pro Plus 6.0 software was used to make statistics of inclusions in 15 SEM images. Images used for the statistics were captured at a magnification of 1000×. The schematic of the measurement of length, width and mean diameter are shown in Figure 6. The length and width of the inclusion are the Feret diameter along the major and minor axis of the inclusion, respectively. The mean diameter is the average length of diameters measured at 2° intervals and passing through inclusion’s centroid. The 2D size of inclusions was measured on the polished surface of the steel sample according to Figure 6, while the 3D size was measured on the etched surface of the sample based on the projected outline shown in Figure 7, which was then measured according to the same method shown in Figure 6. In both cases, more than 1000 inclusions were counted. The average length, width, diameter, area of inclusions, as well as the number density are shown in Table 3. The schematic of the measurement of length, width and mean diameter. Schematic of the projected outline of the inclusion in 3D. Statistical results of inclusions in the steel.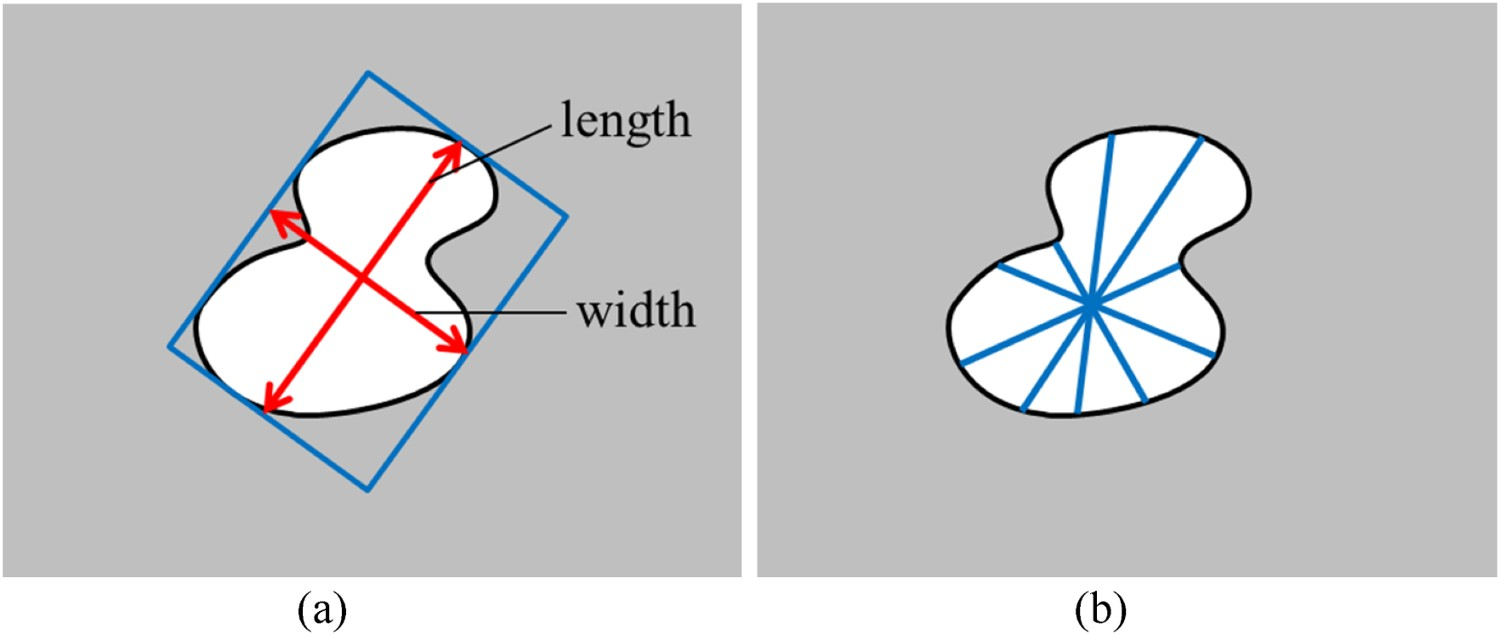
The average diameter of MnS inclusions in 2D is 5.55 μm. The diameter in 3D is 7.58 μm, 1.37 times larger than that in 2D. While the ratio of the area of inclusion is 1.76, the square root of which is 1.33, close to 1.37. Compare the length and width in 3D with that in 2D, the ratio of the size is 1.57 for the length and 1.28 for the width, indicating that the information related to the length is more likely to be hidden when the inclusions are analysed on the steel cross-section.
The number density of MnS inclusions in 2D is 445 mm−2, while that is 593 mm−2 in 3D. More MnS inclusions can be seen through the method of non-aqueous solution electrolytic etching. In the electrolytic etching process, the steel matrix gradually dissolves into the solution. Small inclusions may peel off from the steel matrix, while some new inclusions will expose. On the other hand, some large inclusions still embed in the steel matrix, leaving the original 2D morphology on top of the inclusions, as shown in Figures 3 and 4. The schematic of the inclusions after etching is shown in Figure 8. If the etched surface of the steel sample is completely flat, the number density of inclusions in 3D should be quite similar to that in 2D. However, the etched surface becomes rough, providing more surface for the embedding of inclusions. Thus, more inclusions are counted. Schematic of MnS inclusions in 3D after etching.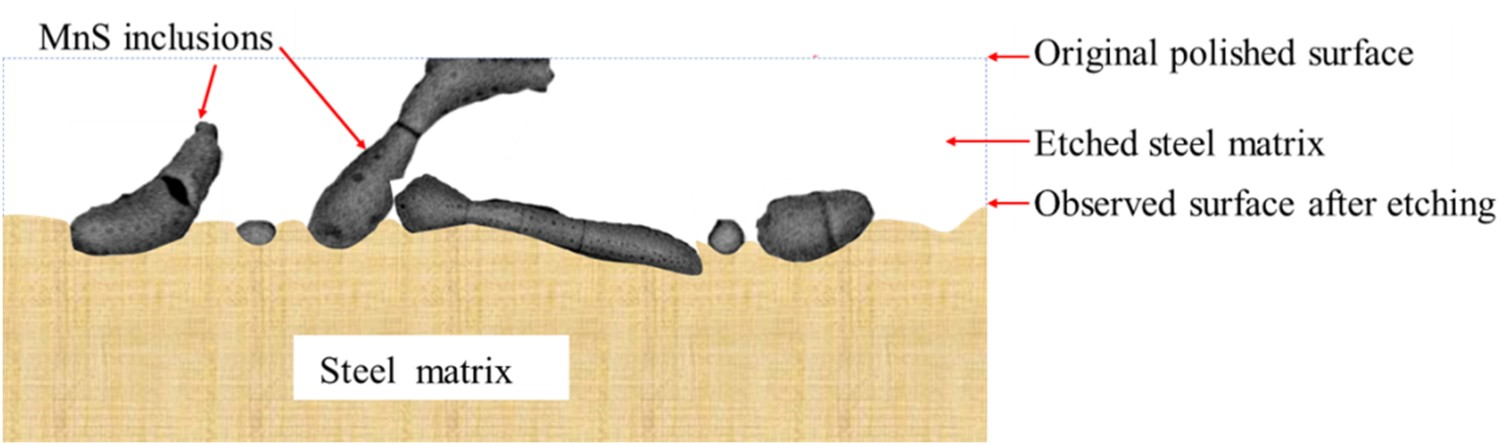
The distribution of mean diameter and area of MnS in 1215 steel in 2D and 3D are shown in Figure 9. The MnS inclusions with a diameter between 0 and 10 μm account for a large proportion (90.82%) of all inclusions in 2D. However, all the inclusions are relatively larger in 3D. The number percentage of inclusions with a diameter of 0–10 μm is only 75.28%. Similarly, the larger diameter represents a larger area. In 2D, 81.26% inclusions have an area of 0–50 μm2, whereas, it is 18.74% for the inclusions larger than 50 μm2. However, the 3D analysis results show that 41.17% inclusions have an area larger than 50 μm2, much higher than that in 2D. The distribution of mean diameter and area of MnS inclusions in the steel.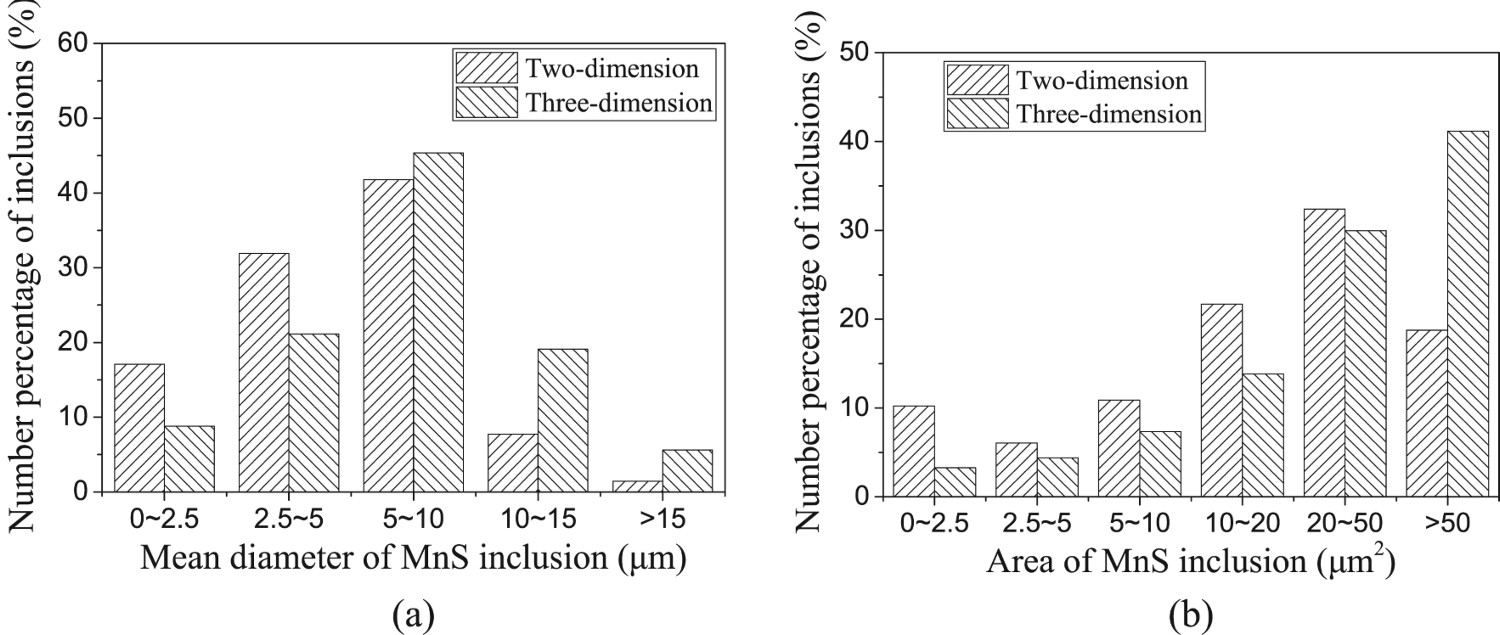
According to the above analysis, the size in 2D deviates from that in 3D. In order to establish the relationship between these two results, all the mean diameters measured in 2D and 3D are plotted in Figure 10. The horizontal axis stands for the inclusion number, which is arranged according to the mean diameter. The mean diameter and its difference of MnS in 2D and 3D.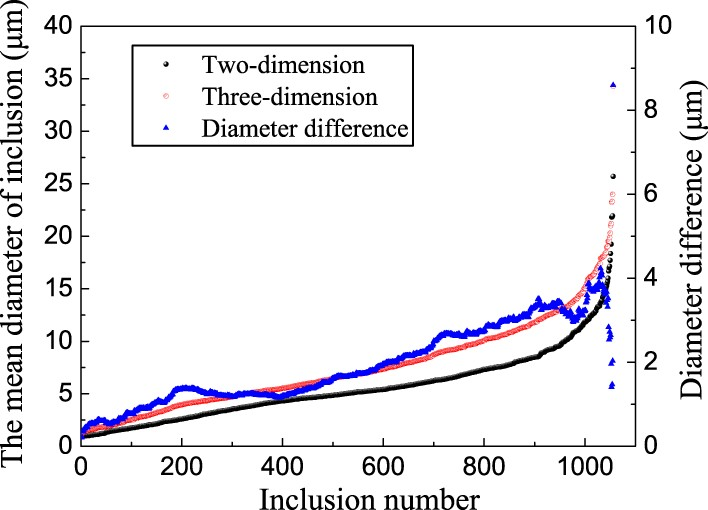
As shown in Figure 10, in the former 80% of all the inclusions, both 2D and 3D diameter increase with the inclusion number linearly. The larger inclusions only account for a small percentage, in which case, both 2D and 3D diameter increases sharply with the increase of inclusion number. The difference between the 2D and 3D diameter is also shown in Figure 10. It shows a linear increase with the inclusion number in the former 87% inclusions. The largest difference is approximately 4.2 μm, the further increase of the inclusion number leads to the decrease of the difference. It should be noted that this figure represents the distribution of inclusion diameter, rather than the comparison of diameter in 2D and 3D for each single inclusion, which may vary in a big range and has little value for the analysis of inclusions.
Relations between MnS size in 2D and 3D
As shown in Figure 10, the difference between MnS diameter in 2D and 3D increases linearly with the inclusion number in the former 80% inclusions, indicating that a linear relationship can be created between these two parameters. In Figure 11(a), the mean diameter of MnS in 2D is set as the horizontal axis, the mean diameter of MnS in 3D is set as the vertical axis. A dashed line with a slope of 1 means that the 2D diameter equals the 3D diameter. The measured data is plotted above the dashed line, indicating that the 3D diameter is larger than the 2D diameter. For most inclusions, the 2D diameter is proportional to the 3D diameter. A linear fitting line is created according to the scatters. When the diameter in 2D is smaller than 14.0 μm, the variation of the diameter in 3D follows the fitted line well. The equation of the fitted line is shown in Equation (1): The relationship between the size of MnS in 2D and that in 3D.
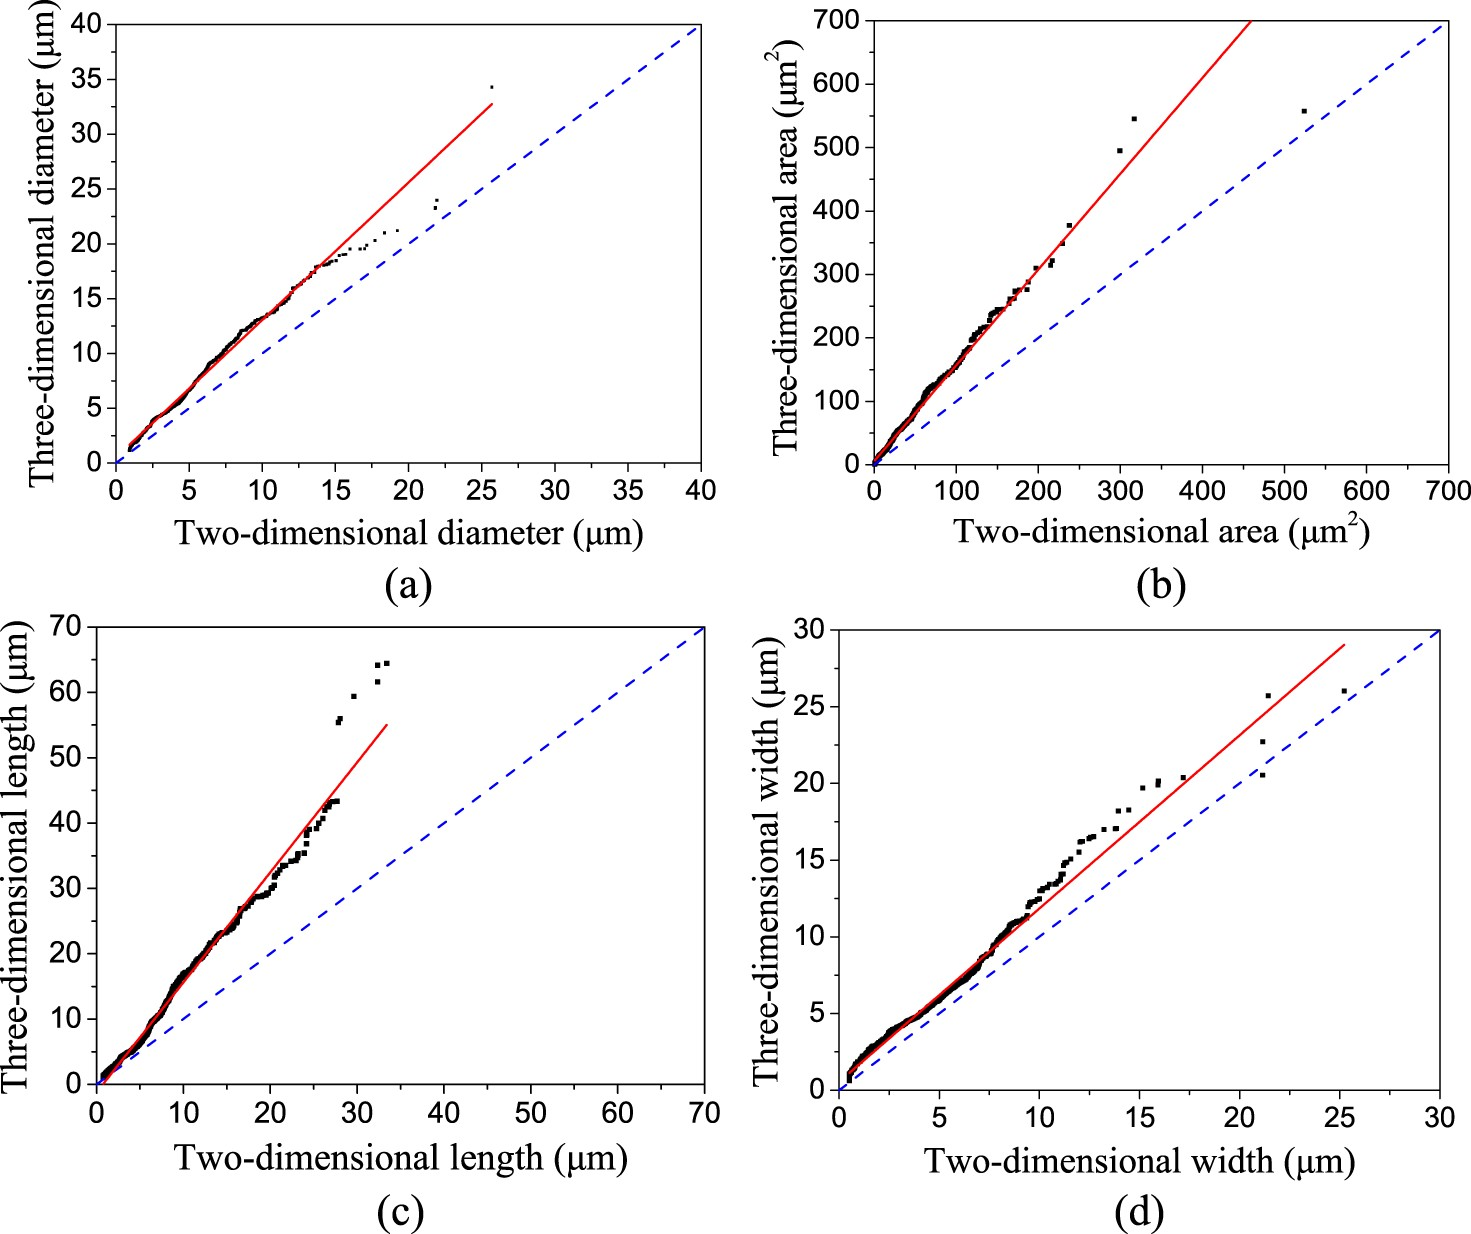
Similarly, the area, length and width of MnS inclusion in 2D also have a linear relationship with that in 3D. The scatters and lines are plotted in Figure 11(b–d). The fitted linear equations are shown in Equations (2)–(4). When the 2D size is smaller than a certain value, the line fits the scatters well. It indicates that large inclusion may show more complicated morphology and occupies a very small proportion:


As shown in Equation (3), the slope of the fitting line is 1.68, while the slope of the fitting line in Equation (4) is 1.13. Compared with the length of MnS inclusion, the difference of width in 2D and that in 3D is smaller. Because the real 3D morphology of most MnS inclusions is a long strip, which is Type II MnS in the steel. In the process of grinding and polishing, the cross-section of the inclusion has less possibility to reflect the length of the inclusion, therefore, the difference between 2D length and 3D length is large.
The size of inclusion in 2D has a certain functional relation with that in 3D, providing a convenient way to analyse the 3D morphology and size of inclusion by using a traditional method, i.e. polishing and 2D morphology analysis. The actual length and width of inclusions can be predicted in a certain range according to the parameters measured in 2D. It is of great importance to the morphology control of MnS inclusions to achieve better steel properties.
Conclusions
According to the 3D SEM observation, there are two kinds of MnS inclusions with different morphology: Type I (spherical) and type II (rodlike) inclusion in 1215 steel. The estimated number percentage is 1.6% for the former and 98.4% for the latter. The size of MnS inclusions in 3D is larger than that in 2D. The MnS inclusions with a diameter between 0 and 10 μm account for 90.82% of all inclusions in 2D, while for the projection diameter in 3D, it is 75.28%. The cross-section of the inclusion cannot represent the true size of inclusion, more reliable inclusion information can be obtained by electrolytic etching. According to the statistical results of the inclusions, the relations between the diameter, area, length and width of inclusion in 2D and 3D are proposed, providing a reference for evaluating sulphide inclusions observed on a polished surface.
Footnotes
Acknowledgements
This work was supported by the National Natural Science Foundation of China (52074179, 51874195), Center for Advanced Solidification Technology (CAST) and State Key Laboratory of Advanced Special Steel.
Disclosure statement
No potential conflict of interest was reported by the author(s).