
Abstract
The LD (Linz Donawitz) steelmaking process is the most used in the steel industry due to its high-volume capacity and low cost per ton of steel produced. However, the basic oxygen steelmaking process in LD converters is subjected to potential steel charge overflows, often called ‘slopping’. Besides yield losses, slopping events can damage the environment and expose employees to danger. More than ever, steelmaking plants need to avoid this type of event to keep producing as environmental impacts are no more tolerable by society. Steelmaking plants already use different methods to monitor and detect slopping events, but they are often limited and unreliable. Therefore, this paper proposes a multi-sensor data fusion process to generate a reliable slopping index to warn operators of potential slopping events and detect the triggered ones. The work is based on sound and image data (67 heats with 27 slopping events) collected on previous trials at a 350-ton LD converter. The Kalman filter was applied as a data fusion agent of two indexes, one resulted from computer vision analysis of the LD converter mouth (image data), the other resulted from digital signal analysis of sound captured on the converter’s hood (sound data). Fuzzy sets were applied for adaptative tuning of the Kalman filter to improve the data fusion process. Besides the increase of alarm accuracy and heat classification, the data fusion index worked better on different scenarios and produced a more reliable indicator for a slopping prevention system.
Introduction
LD converters are the most used in the steelmaking industry. About 70% of the steel produced in the world in 2018 was manufactured by the LD process [1]. This type of converter uses an oxygen blow to remove impurities from the melting pig iron and turns it on steel [2]. During this process, thick foam is generated inside the converter vessel, composed of reaction gases, slag, and liquid particles [3]. The foam plays an important role during the converter process, but an excessive increase can lead to an overflow, causing serious damage to the nearby facilities, people, and the environment. This phenomenon is commonly referenced as ‘slopping’ [2–4].
The slopping process can be avoided with a well-dimensioned vessel volume and good quality consumables [3]. However, due to the chaotic behaviour of the reaction process [5], the operation can get unstable at any moment of the blowing period and generate a high amount of foam, leading to slopping events. In that way, it is very important to monitor the actual foam level inside the vessel and act before it reaches critical levels. Adjustments on the oxygen flow, lance height, bottom blow, and additions are very effective at foam attenuation [3,5,6] but when to start these adjustments is the key point. Operators are usually supported by their experience and sensitivity to the process to start countermeasures, often taking actions too late (insufficient to avoid slopping) or too soon (reducing process yield) [6]. Therefore, implementing a system capable of monitoring foam increase and detecting the start point of a slopping event could enhance the converter operation by automatic starting countermeasures and mitigating their effects.
A common method for foam level estimation is based on sound intensity measurement. Some papers like Refs. [4 7] present the application of this method, where sound measurement from the converter are recorded and processed during the oxygen blow. The foam generated inside the vessel acts like a sound barrier attenuating its intensity. As the foam volume increases inside the vessel, the greater is the muffing effect on the sound, thus the sound intensity can indicate the foam level inside the vessel. However, the sound intensity is also affected by other different phenomena. On Ref. [8], the authors built a physical model to study the foam dynamics and sound behaviour. They equated the relation between foam level and sound intensity, achieving good results on the model. Yet, applying these equations to a real application is quite challenging. Some parameters like foam attenuation index or sound resonance effects caused by the vessel geometry are very difficult to measure and to consider on the equation, creating an unprecise estimation of foam level, as reported in Ref. [9].
Different from sound measurements, many authors present the use of images to detect sloping events and evaluate their severity. In Refs. [6 10] a camera pointed to a region under the converter is used to collect images of the overflowing material. Through image processing, they were able to quantify the slopping, detect, and classify the events. With a bit different approach, Refs. [11 12] used a camera horizontally pointed to the vessel top being able to register also very small intensity slopping. Besides the effectiveness of slopping detection, this method is not able to give advanced information for slopping prevention.
Developing an indicator that could provide information about foam generation and slopping events would be crucial for a preventive system to automatically initiate countermeasures. Therefore, this work uses the concept of data fusion to enhance information gathered from different sensors making it more reliable, available, and less redundant [13]. Multi-sensor fusion is a well-known method and is widely applied in military applications, surveillance, robotics, healthcare, navigation, and environmental monitoring systems [14–17].
Based on that, this work proposes a slopping index composed of sound and image data fusion using Kalman Filter. The sound and image data used in this paper are results of previous works [18,19] on industrial trials developed along with a steelmaking company. The novelty of this work is grounded on the adjustment of the multi-sensor data fusion using the different conditions of de LD process, resulting in a more reliable slopping indicator. The adaptation process was achieved by tuning the Kalman filter parameters with Fuzzy logic.
The paper is structured in the following order. In the second chapter, the authors explain the LD and the foaming processes. The third chapter presents an overview of the monitoring system implemented for sound and image acquisition, as well as how the data are processed, resulting in two slopping indexes. In the fourth chapter, the fuzzy tuned Kalman filter data fusion technique is introduced, resulting in another slopping index. The results and conclusion are presented in the fifth and sixth chapters, respectively.
LD converters
The main components of an LD converter are presented in Figure 1. The vessel is the structure responsible for containing the heat charge during the whole process. Inside the vessel, there is a refractory lining to keep the high temperature of the hot metal contained, besides, the vessel structure is cooled by a water-cooling system. The oxygen lance is responsible for injecting oxygen at a supersonic speed inside the bath. Oxygen is the main reaction agent in the LD steelmaking process; it is responsible for removing impurities and reducing carbon content from hot metal by an oxidation process. The sub-lance is used for taking measurements and samples of the bath while the taphole is used for pouring out the charge. LD converter main components. Adapted from Ref. [20].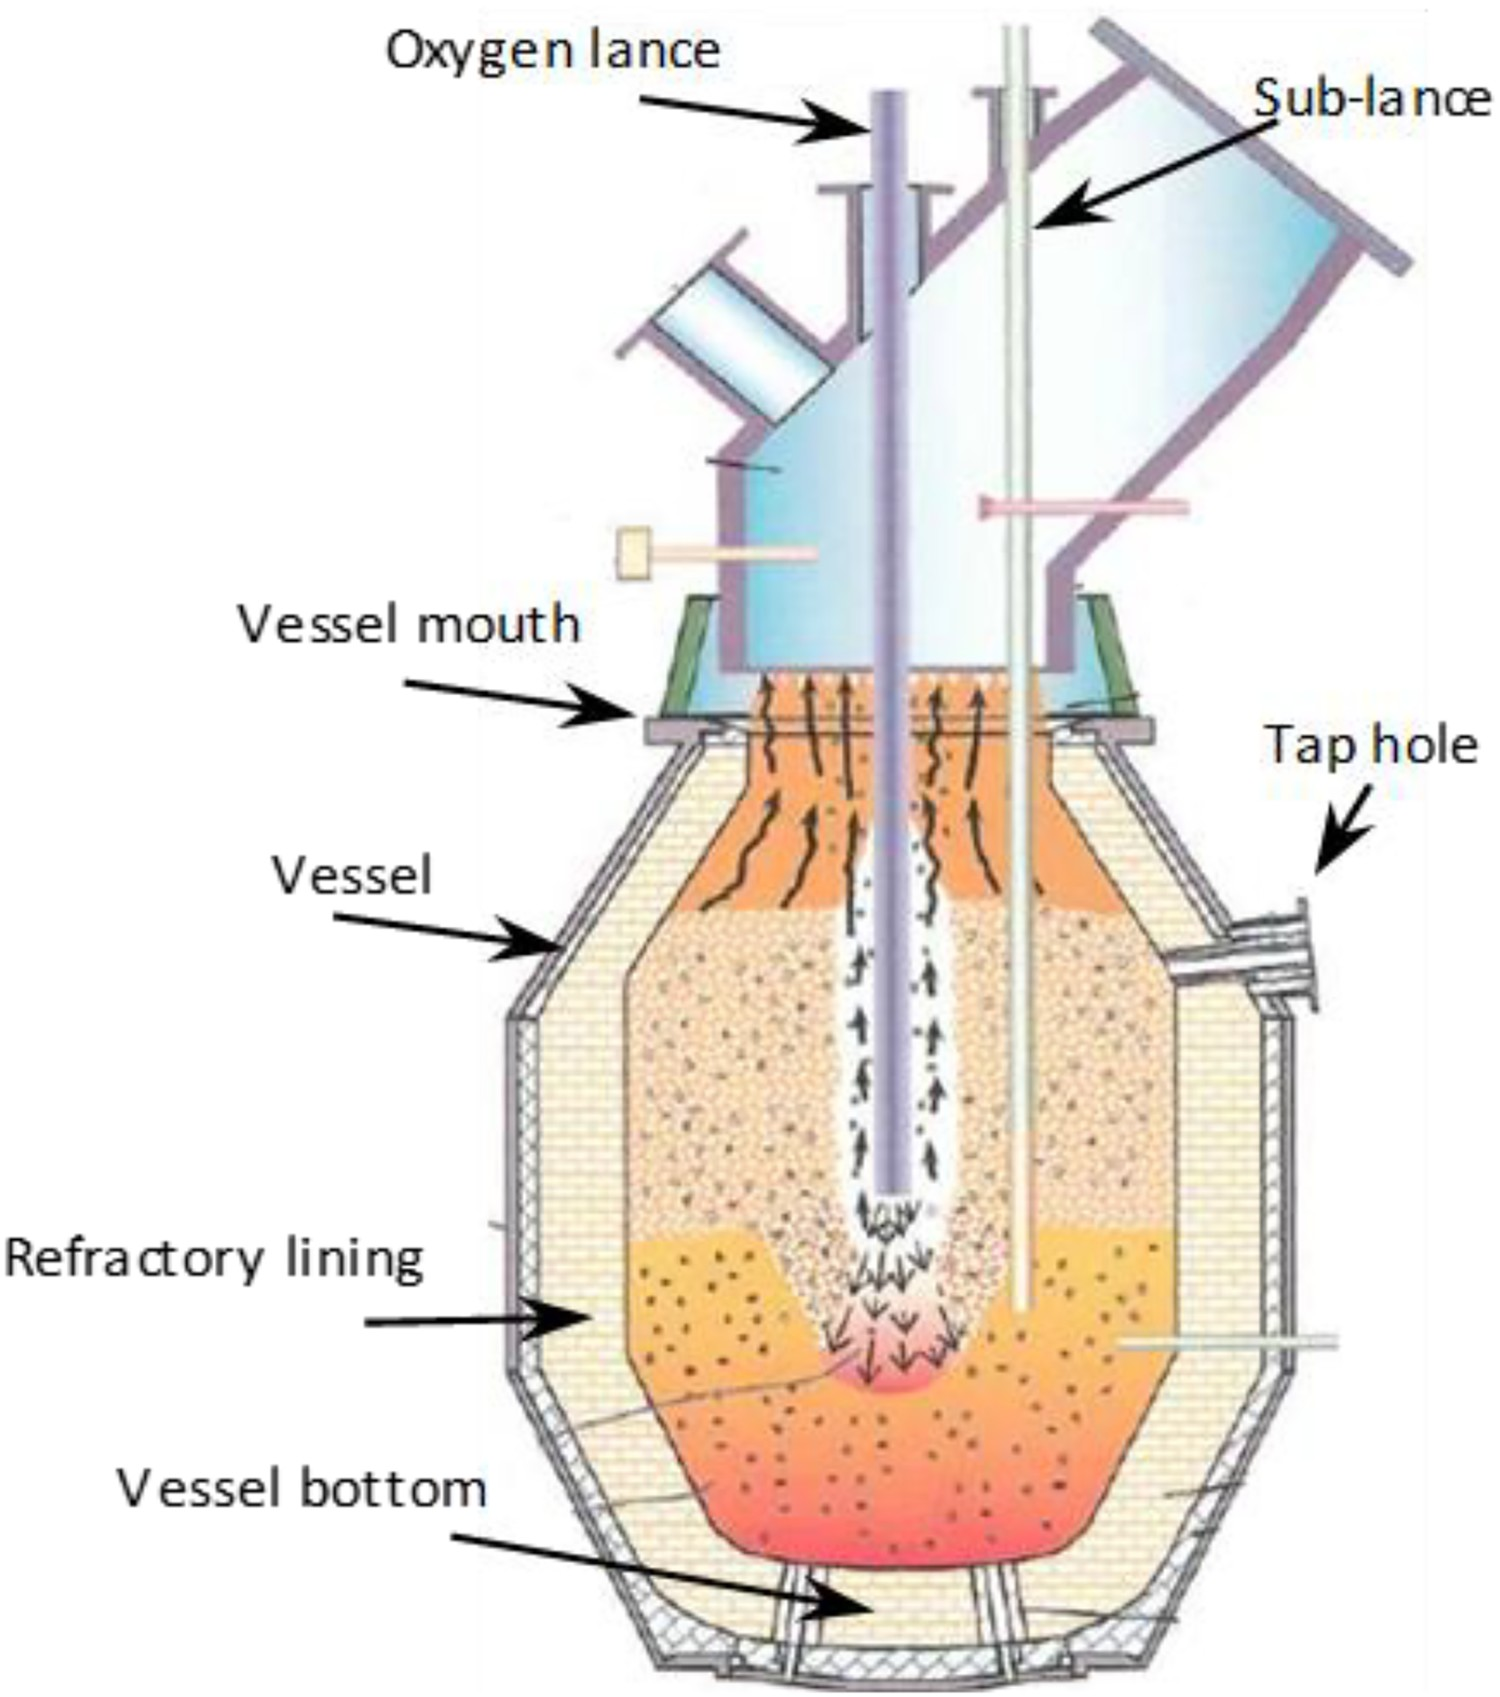
During the main blow, a foam generation process caused by the reactions between the oxygen flow and the hot metal (Figure 2) takes place inside the converter vessel. The foam is a mix of gases (CO and CO2), slag (Si, Mn, and P oxides), and metal droplets. The reaction is very chaotic and can be very intense producing a high amount of foam. If the foam volume exceeds the vessel capacity, it will overflow through the top, causing the slopping event. LD converter foaming process. Adapted from Ref. [20].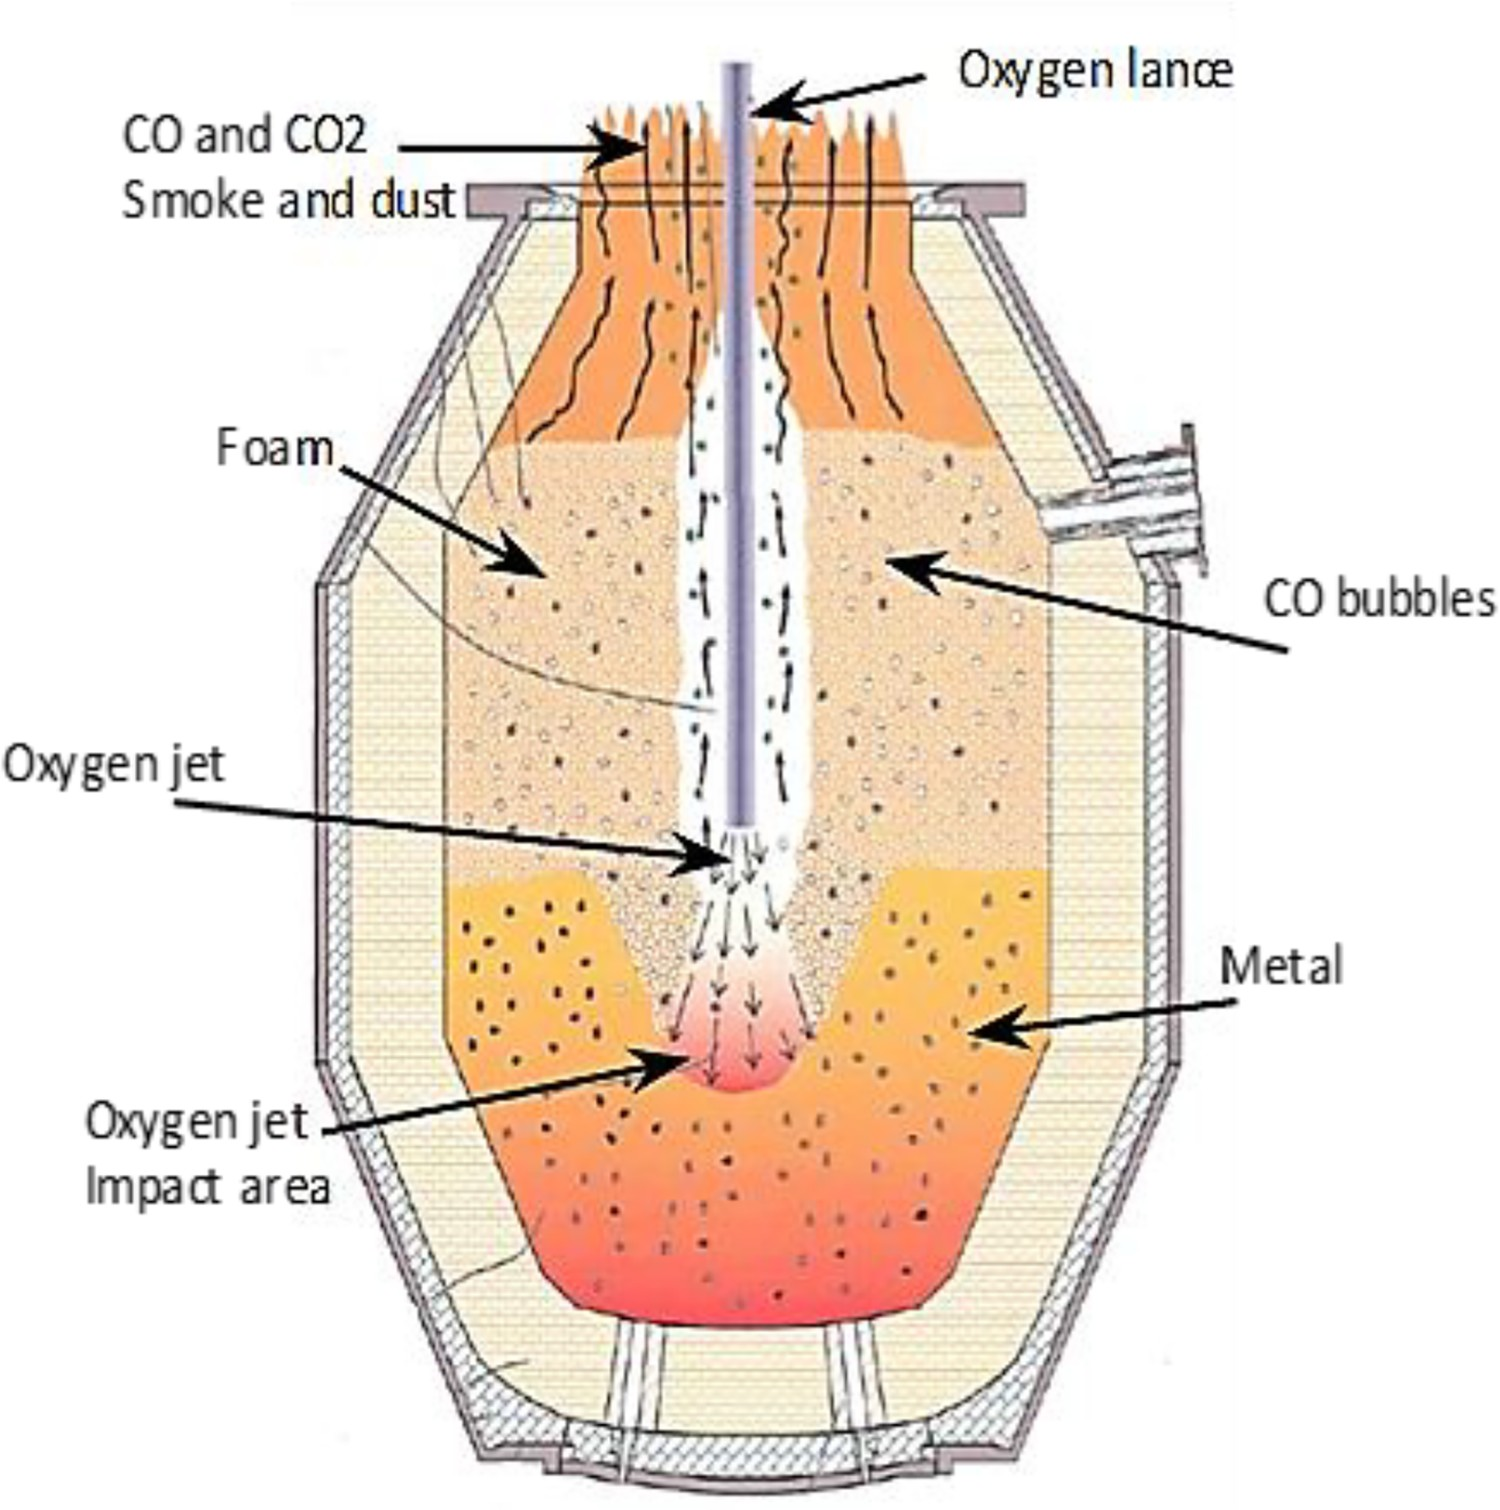
Depending on the overflow intensity, the slopping could cause significant damage to the nearby facilities and stop the whole converter process. In addition, intense slopping events can cause dust and gas emission being a critical point to the whole plant operation, subjected to high environmental fines and social disapproval. Therefore, steelmaking companies need to do their best to avoid slopping events.
Slopping monitoring system
The slopping monitoring system was developed in previous works, where both sound [18] and image [19] data were used to produce slopping indexes, with the main objective of detecting and registering the slopping occurrences of an LD converter. The data were produced in 2017 (between the 17th and 20th of October) and consist of 67 recorded Heats with a total of 27 slopping events.
The monitoring system (Figure 3) has a computer running software to control data acquisition and storage. Information from the converter PLC was used to start and stop acquisition from each heat, so only the blowing period was recorded. A microphone is located on the exhausting gas duct above the converter hood, protected by a cooling cover. An amplifier sends the analogue signal to an acquisition board that interfaces with the computer. A 2.4Mp GigE camera was positioned in front of the converter (approximately 27 m away) and connect to the computer via ethernet cable. The camera has a cover to support it in a steady position and to protect it from dust and particles. Structure of the slopping detection system. Source [21].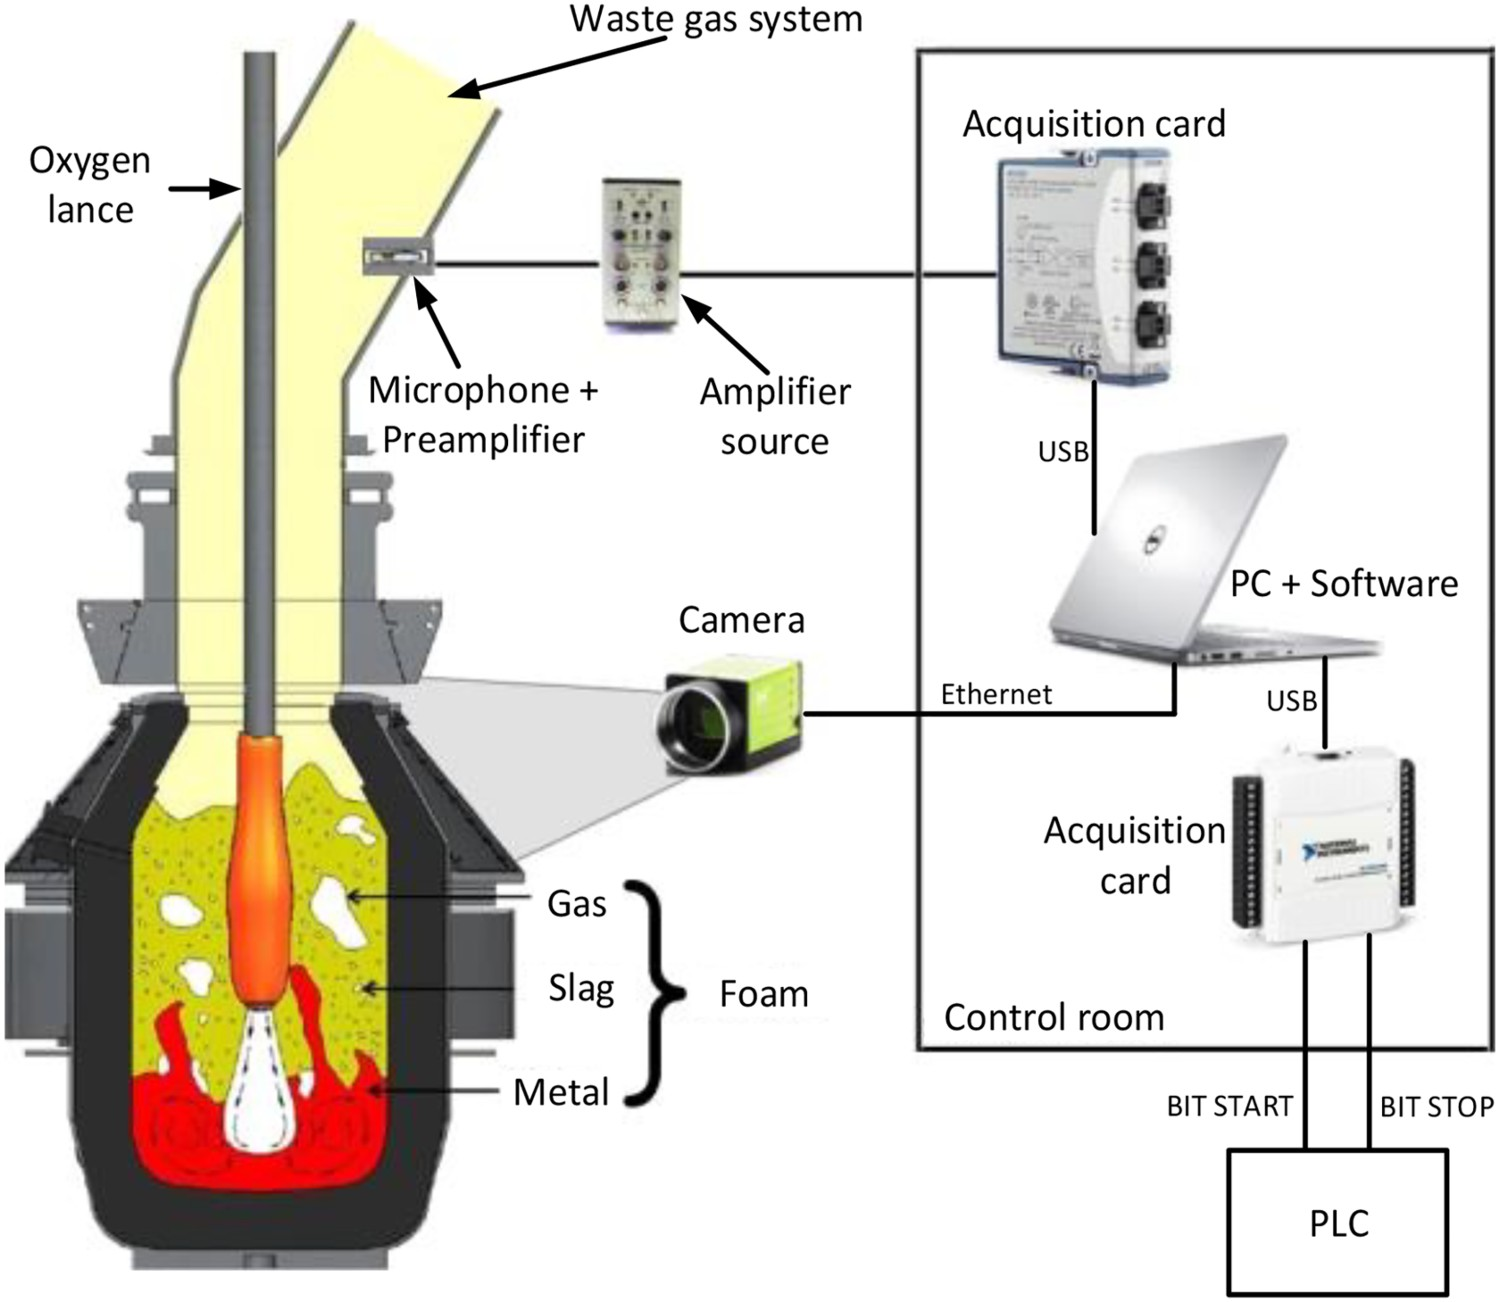
Sound slopping index
Presented on Ref. [18], the sound slopping index uses the same principle stated on Refs. [4,7] where the sound attenuation caused by the foam volume is used as a foam height estimator, hence a slopping index.
The authors present the digital processing method used for the sound index (Figure 4). First, the saturation of high peaks on the signal, followed by a frequency band-pass filter, and finally the calculation of the signal power on a constant moving time window (one second). Sound digital processing flow. Source [18].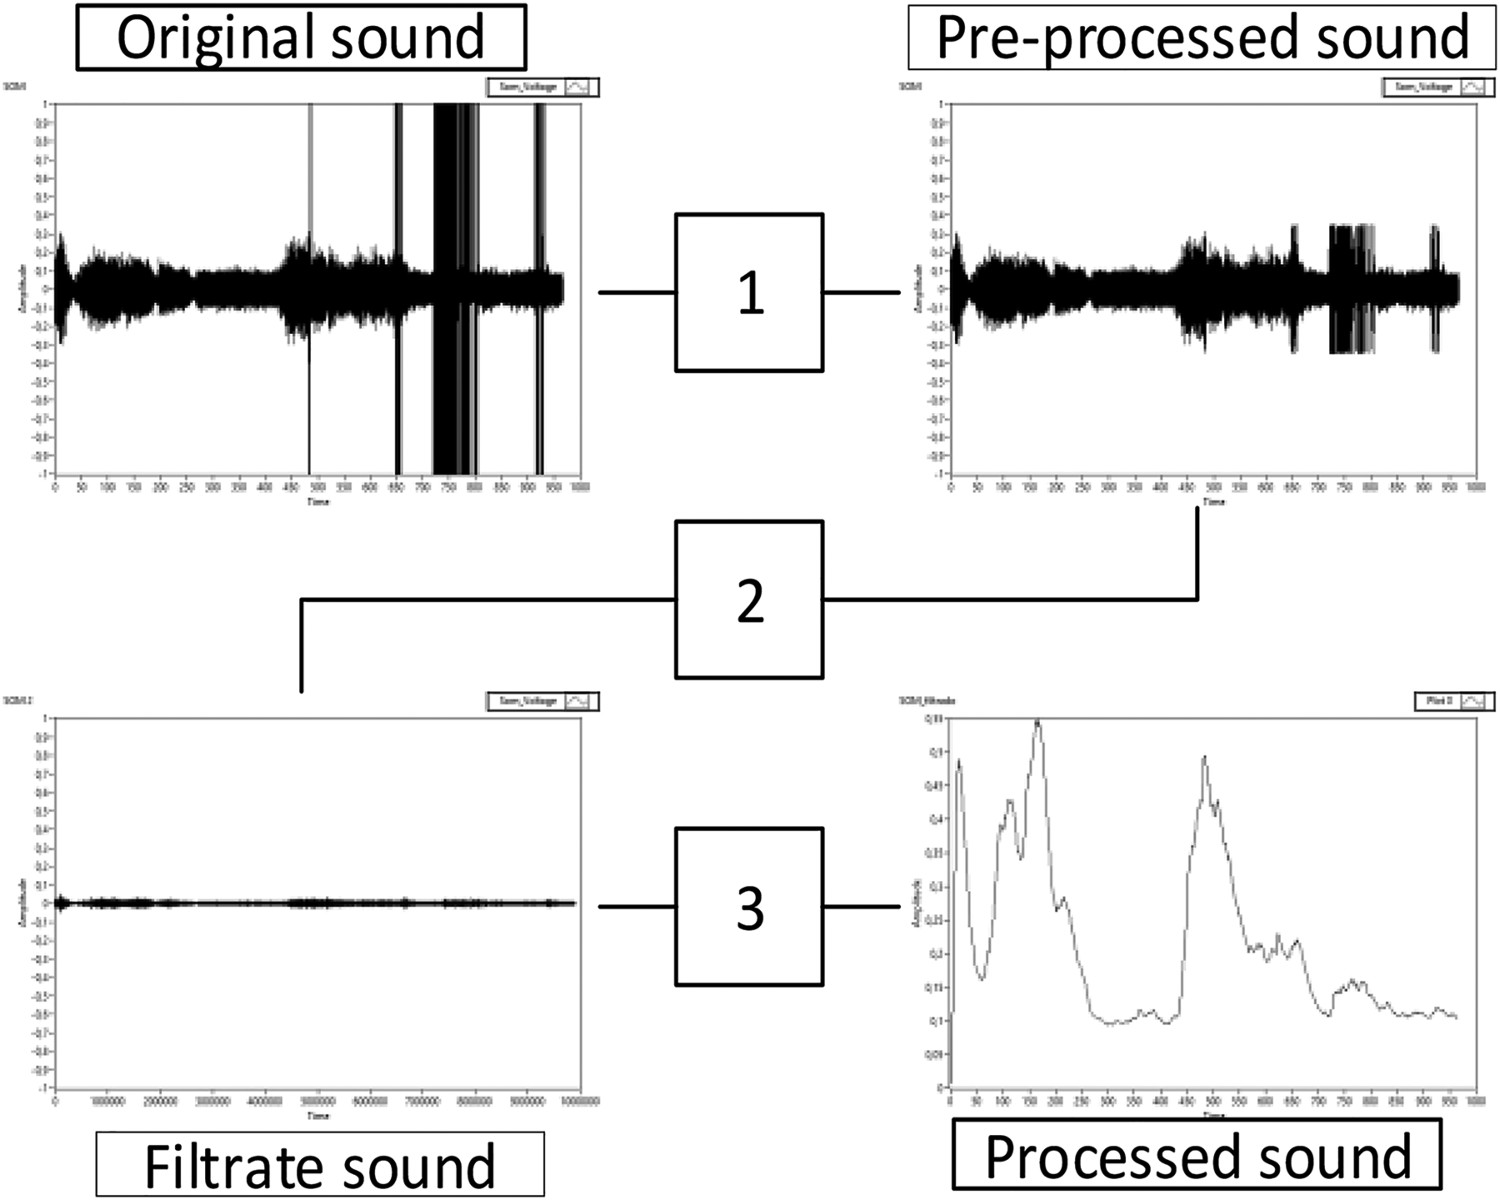
The authors presented the results based on the 67 recorded heats. The sound slopping index was able to correctly detect slopping events on 72% of the heats recorded but with a high number of false alarms (20 occasions). Despite the low performance, the index has shown a great correlation between the sound intensity and the foam generation inside the converter vessel, being more suitable as a warning indicator than a slopping detector [21]. Besides, it requires constant maintenance due to the accumulation of dust on the microphone, causing an attenuation of the sound signal and misinterpretation of the index. Another point is the influence of different variables of the LD process on the sound signal like the oxygen flow, lance height, foam characteristics [9], and that should be taken into account for an LD converter with a dynamic blowing pattern.
Image slopping index
Presented on Ref. [19], the authors used image processing to develop a slopping index to detect slopping events similar to the works [11
12]. The image processing steps can be seen in Figure 5 where tools like colour segmentation and edge detectors were used to compose the final index. Image digital processing flow. Source [19].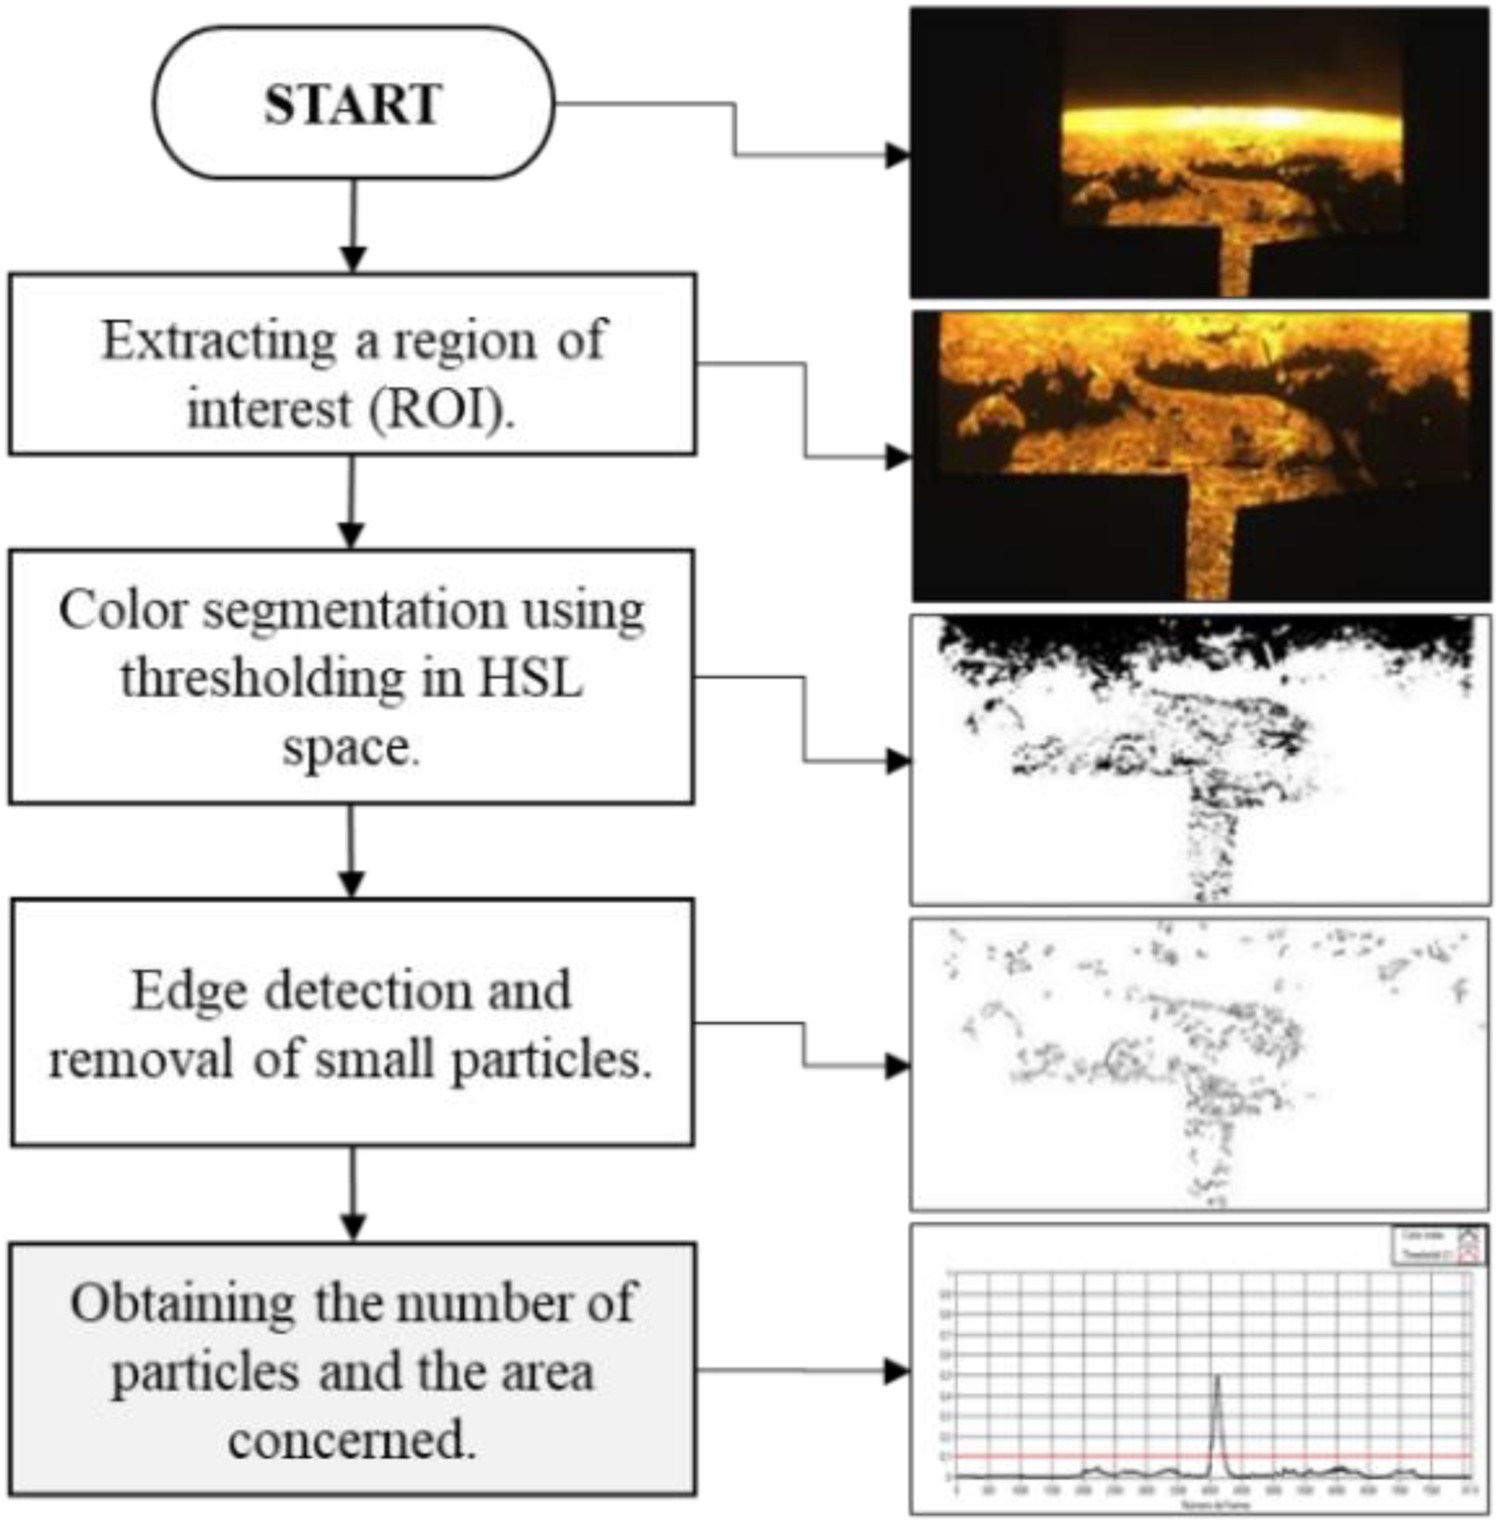
The slopping index achieved good results on slopping detection, 82% of the heats studied were corrected identified, and only seven false alarms were triggered. Despite the good results, the authors had some issues with the flames generated during the process. During some specific periods, the flames were strong enough to produce noise on the calculated index causing the system to falsely alarm. When comparing both sound and image indexes, the image index was superior in detecting slopping events. However, it was not able to produce information before the slopping event as the sound, which keeps producing an awareness of the foam level during the blowing period.
Slopping index fusion
The data fusion approach brings the benefits of each slopping indicator, producing information during the entire blowing period using the sound data and getting a strong indicator of slopping occurrence with the image slopping index. The Kalman Filter was applied to this work inspired by a similar problem faced on navigation systems [15], where different sensors are used to identify the geographic location of automobiles and aircraft. The Kalman Filter work as an optimal estimator producing more reliable information than each sensor alone [22]. Besides, the filter is relatively easy to implement.
The architecture used in this work is represented in Figure 6. The sound and image slopping indexes were used as inputs of the system. Both inputs were normalised to achieve closer values and behaviour. That was necessary because the sound index works oppositely compared to the image index. The sound intensity decreases as foam level increases, meaning the sound is at the lowest value when the slopping potential is at the highest. The image index increases during the slopping occurrence, meaning it increases along with slopping potential. Thus, the sound index signal was inverted to correctly represent a slopping index. Architecture of the fuzzy logic adaptative Kalman Filter.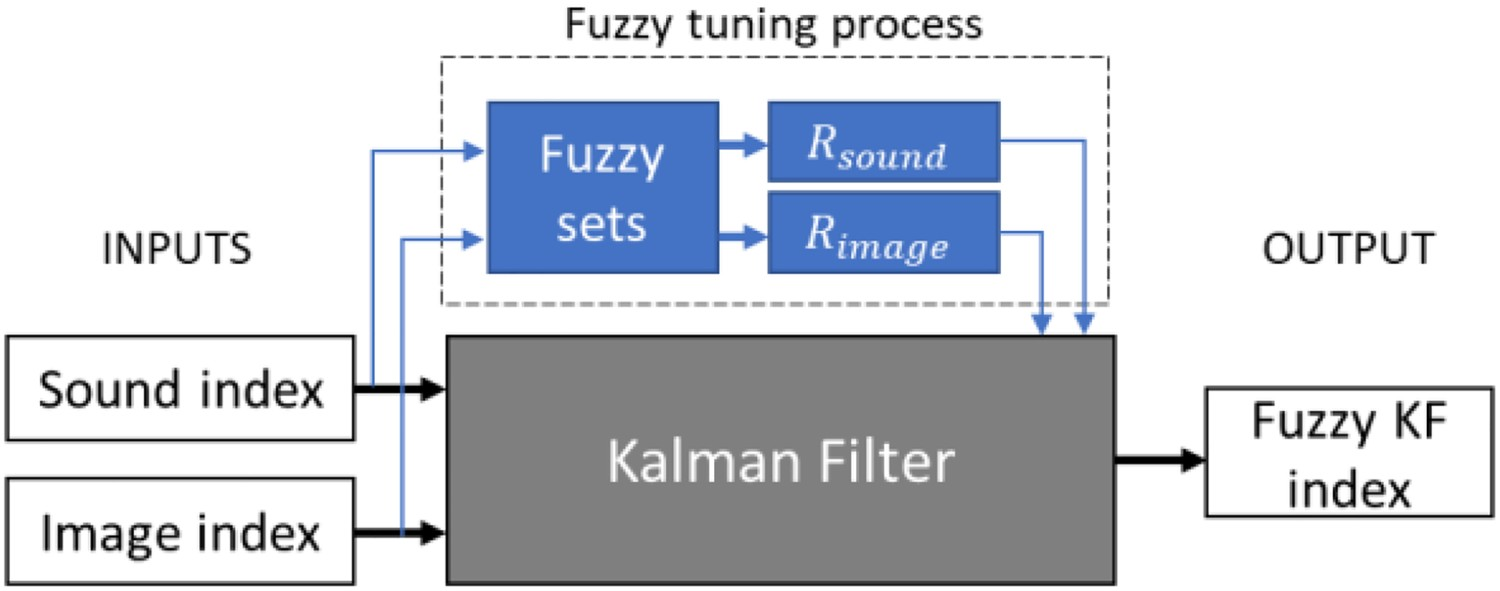
Sound and image indexes were used as input for the Kalman filter and Fuzzy system. The Kalman filter works on the data fusion process, while the Fuzzy system uses the indexes to dynamically adjust the filter parameters for better performance. The output of the Kalman Filter is the new slopping index, used to warn and detects slopping events.
Kalman filter
Kalman filter is an optimal recursive estimation algorithm that uses a dynamic model and a set of sequential measurements to estimate the state of a system variable where the filter is being applied. The filter works in two fundamental steps: Time update (where it predicts the next time state of the variable) and measurement update (where it corrects the prior estimation) [23,24]. The set of equations are presented next.
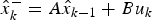
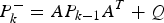


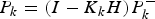
The iteration flow of the algorithm can be seen inFigure 7. An initial value is used to start the iteration. The filter begins the time update step by predicting the next time step value 


The value Kalman Filter iteration process. Source [24].


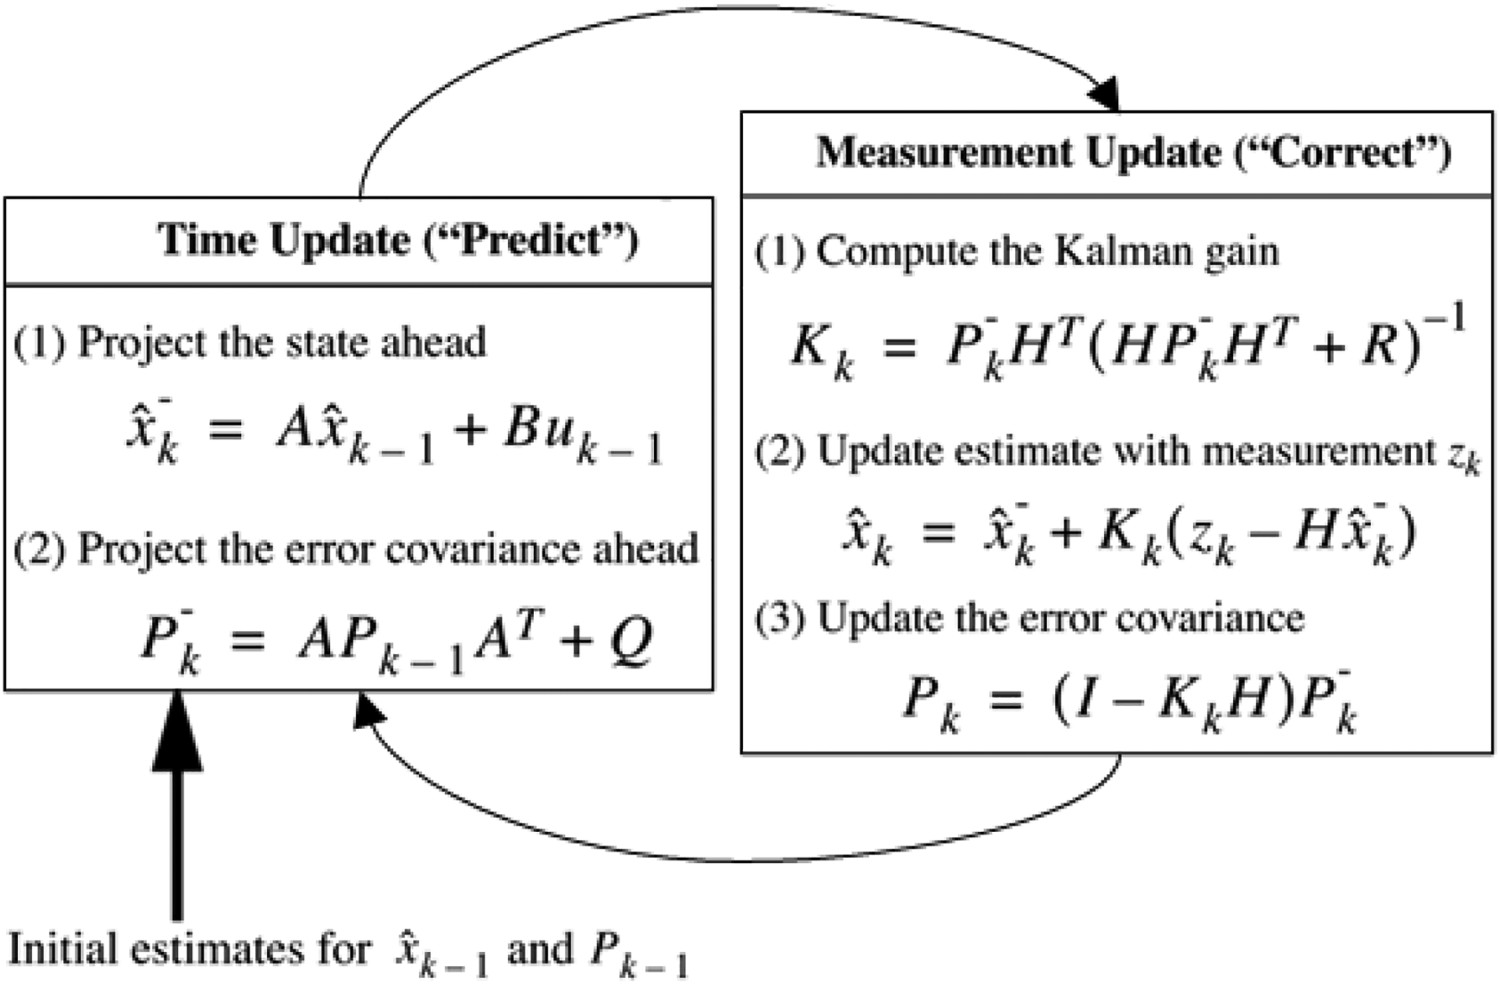
The fused data were displayed together with the sound and image indexes for comparison and analysis as shown in Figure 8. The strip lines represent the thresholds set for alert and alarm. This example represents a converter heat with no slopping occurrence. Example of the Kalman Filter fusion result for Heat 2.
Kalman filter adaptive tuning
The adaptive tuning is a way of making the filter more adaptable to different conditions on the converter process and sensors response. As discussed in Ref. [21], both sound and image slopping indexes are faulty or not precise in particular situations, thus, identifying those situations and adjusting the Kalman filter parameters will produce a more reliable slopping index.
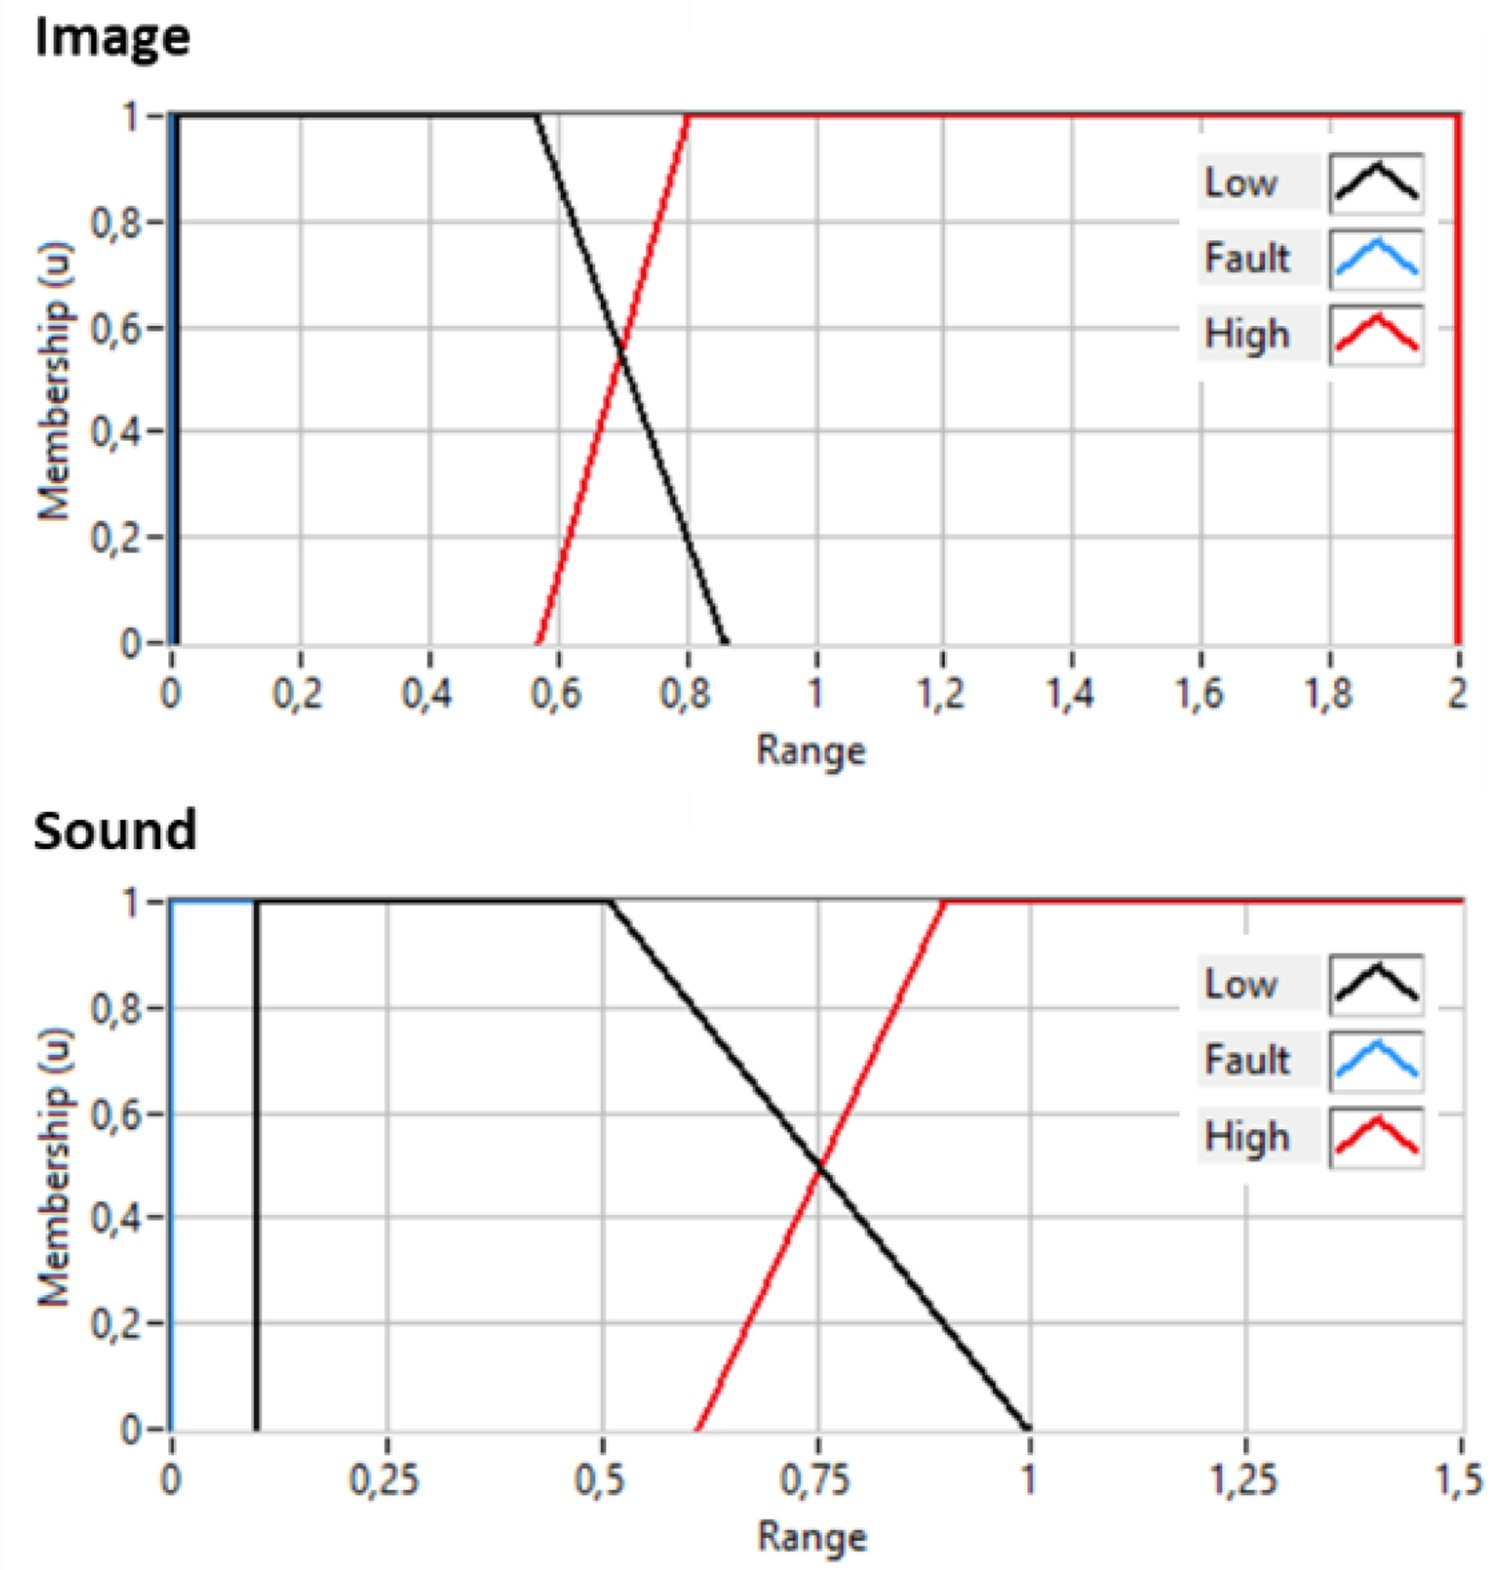
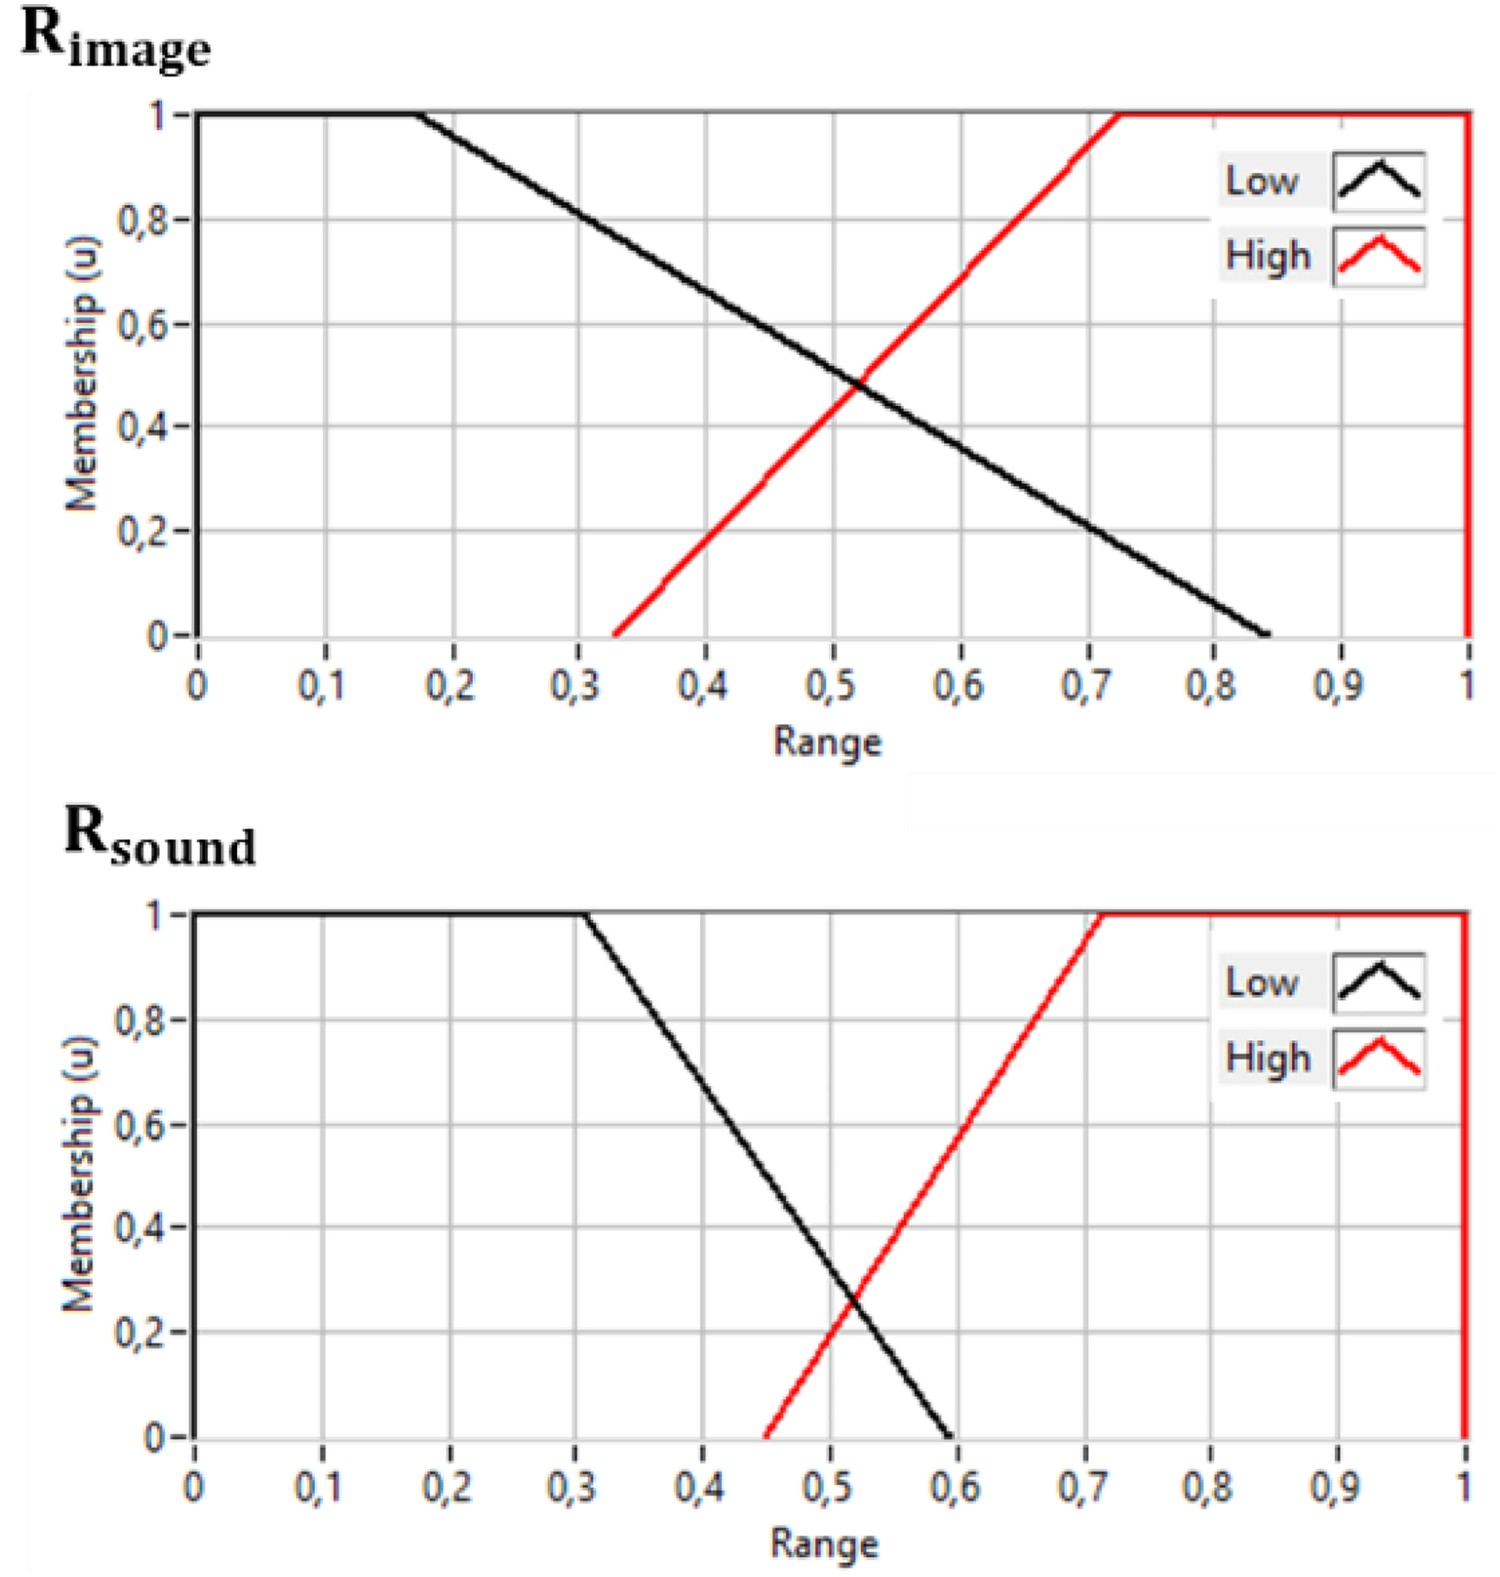
Fuzzy logic was used in the Kalman filter tuning process due to its simplicity and the capability of incorporating people's expertise in intelligent systems [16]. The tuning process is produced by the Kalman Filter Fuzzy input membership functions Fuzzy output membership functions.


The fuzzy rules were created based on different blowing scenarios and slopping index responses. Figure 11 represents four typical situations where sound or image index could strongly represent a slopping event or could simply produce a weak representation of the real foaming condition. Different blowing scenarios for application of the fuzzy set rules.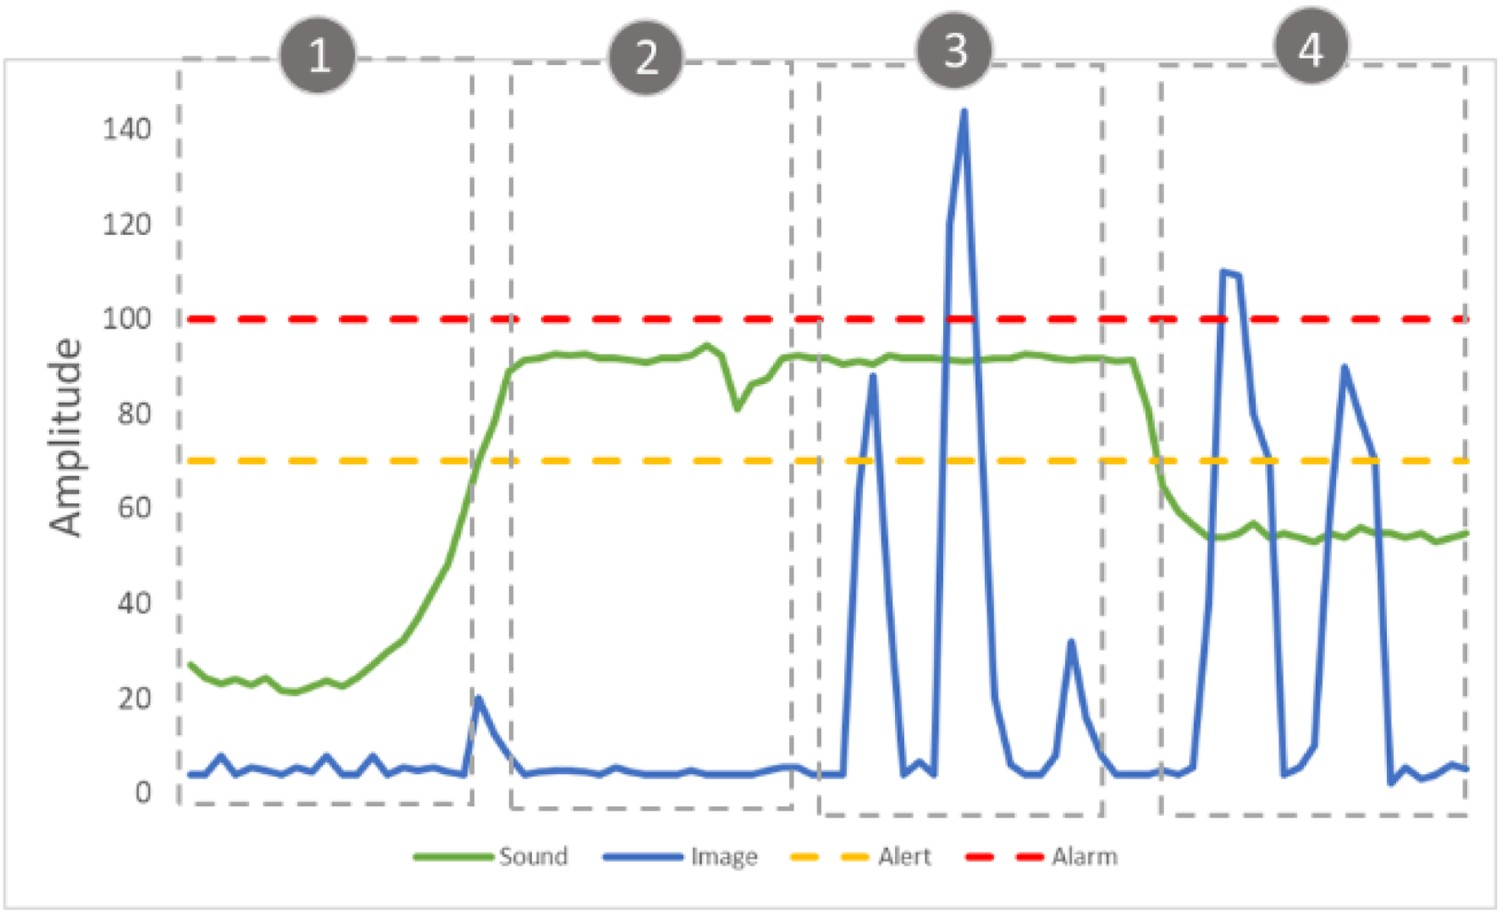
Fuzzy set rules.
In scenario 2, the high sound index represents a high foam level inside the converter indicating a warning situation. In this case, the fusion index must enable the Alert state, thus 
Scenario 3 represents a situation where slopping is likely occurring as the image index gets high together with sound. In that case, rule 3 was created to set both 
Scenario 4 represents a situation of possible false alarm triggered by the image index, where flames and other noise could create high amplitude values on the index calculation [19]. For this case, rule 4 was set to adjust 

Rules 5 and 6 were created to adjust the Kalman Filter during sensor fault, where measurements are not reliable.
Slopping warning and detection
The result of the Kalman data fusion was used as a slopping index for two purposes, warn operators of potential slopping incidence and detect the triggered ones. In this manner, the index will produce awareness to the operators during the blowing process and will enable automatic registration of slopping events. Under these circumstances, two thresholds were defined: Alert and Alarm. The Alert (70%) means that the foam level is high, slopping can occur if the foam keeps growing. Alarm (100%) means that slopping is occurring and can be used for recording the events and for starting countermeasures. The threshold values were set based on the results shown in Refs. [18,19].
To evaluate the system performance, two indicators were used: Quantity of heats correctly classified (HCC) (%) and Accuracy (%) of the alarms. For the first indicator, a ‘correctly classified heat’ happens when all the slopping events are identified by the system and no false alarm is triggered, scoring positive on the counting process. HCC is represented by Equation (6). For the second indicator, the aim is to measure the efficiency of the triggered alarms, in other words, the percentage of corrected alarms, represented by Equation (7).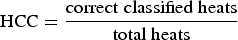
Results
Slopping indexes performance results.
Kalman filter slopping index
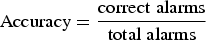
In Figure 12 it is possible to see the data fusion result for Heat 36, where the only slopping occurrence was correctly detected. This heat was correctly classified because the Kalman filter index overpassed the alarm threshold during the slopping event and did not generate any false alarm. Still, in Figure 12, it is important to notice that as the sound index gets close to the alarm threshold the Kalman index reaches the alert region showing that the foam level inside the converter is high, which could be used as a warning notification for the converter operators. Kalman filter index result for heat with slopping event.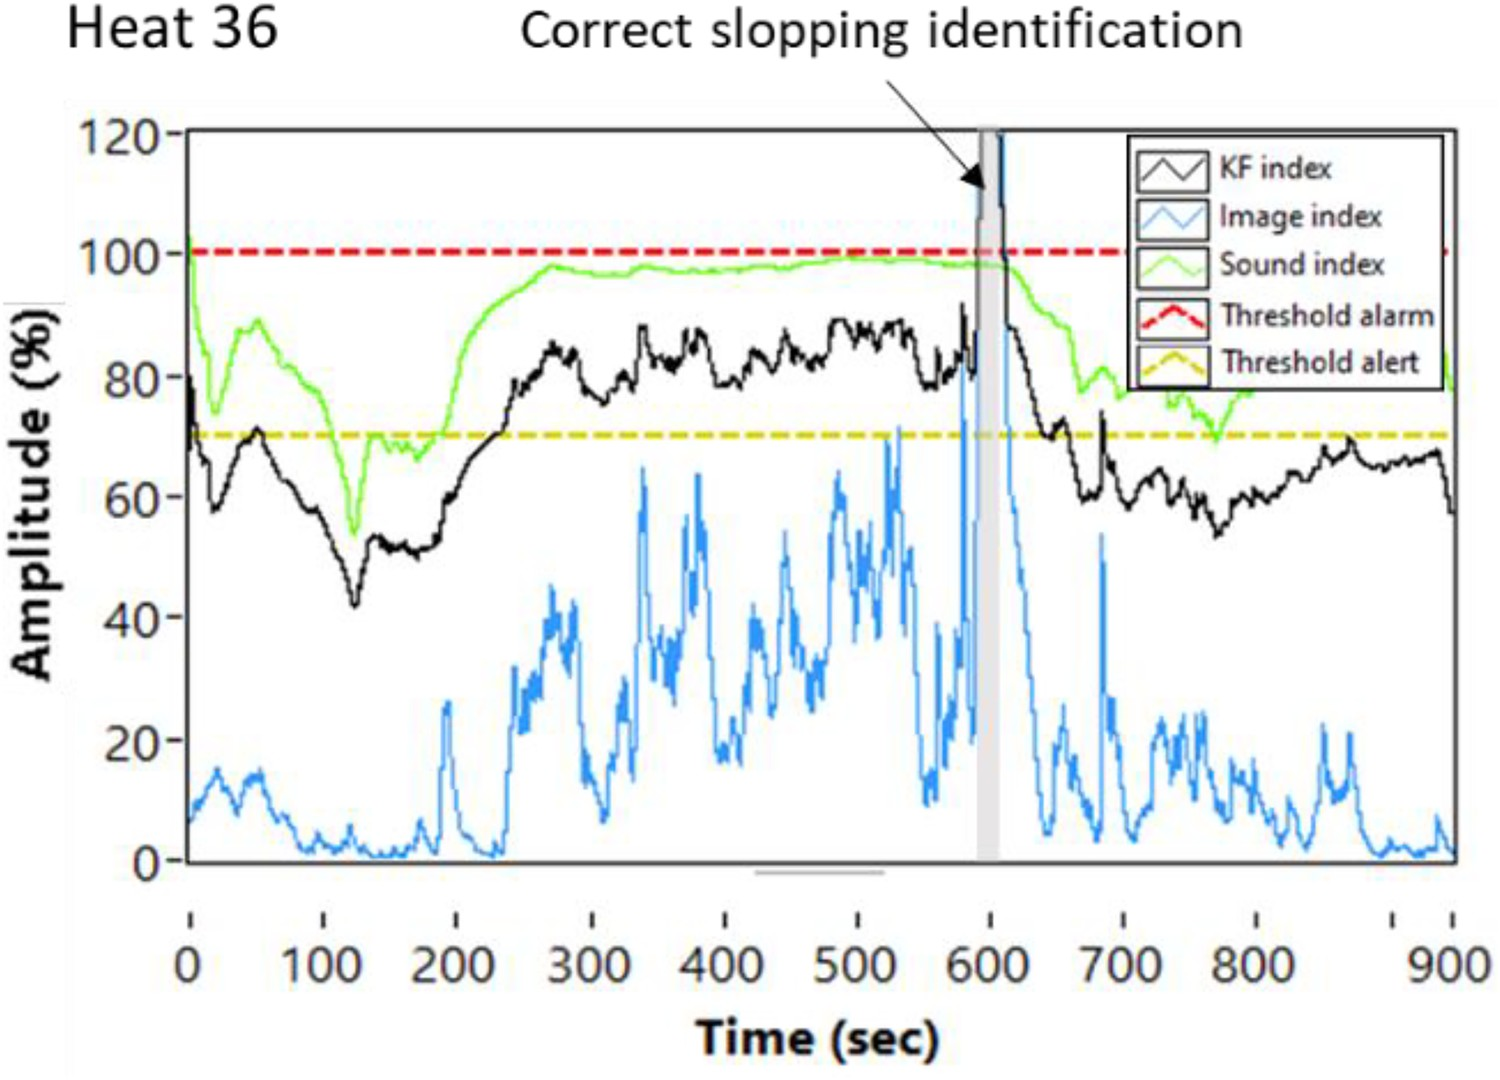
On another example, Figure 13 shows the result for Heat 11, where no slopping occurred but the image index triggered a false alarm at about 350 s of the blowing period. Because of the weak slopping indication of the sound index, the Kalman index was kept at a low level and did not trigger any false alarm. This case was an example of a correctly classified heat for the Kalman filter index. Kalman filter index result for heat with no slopping event.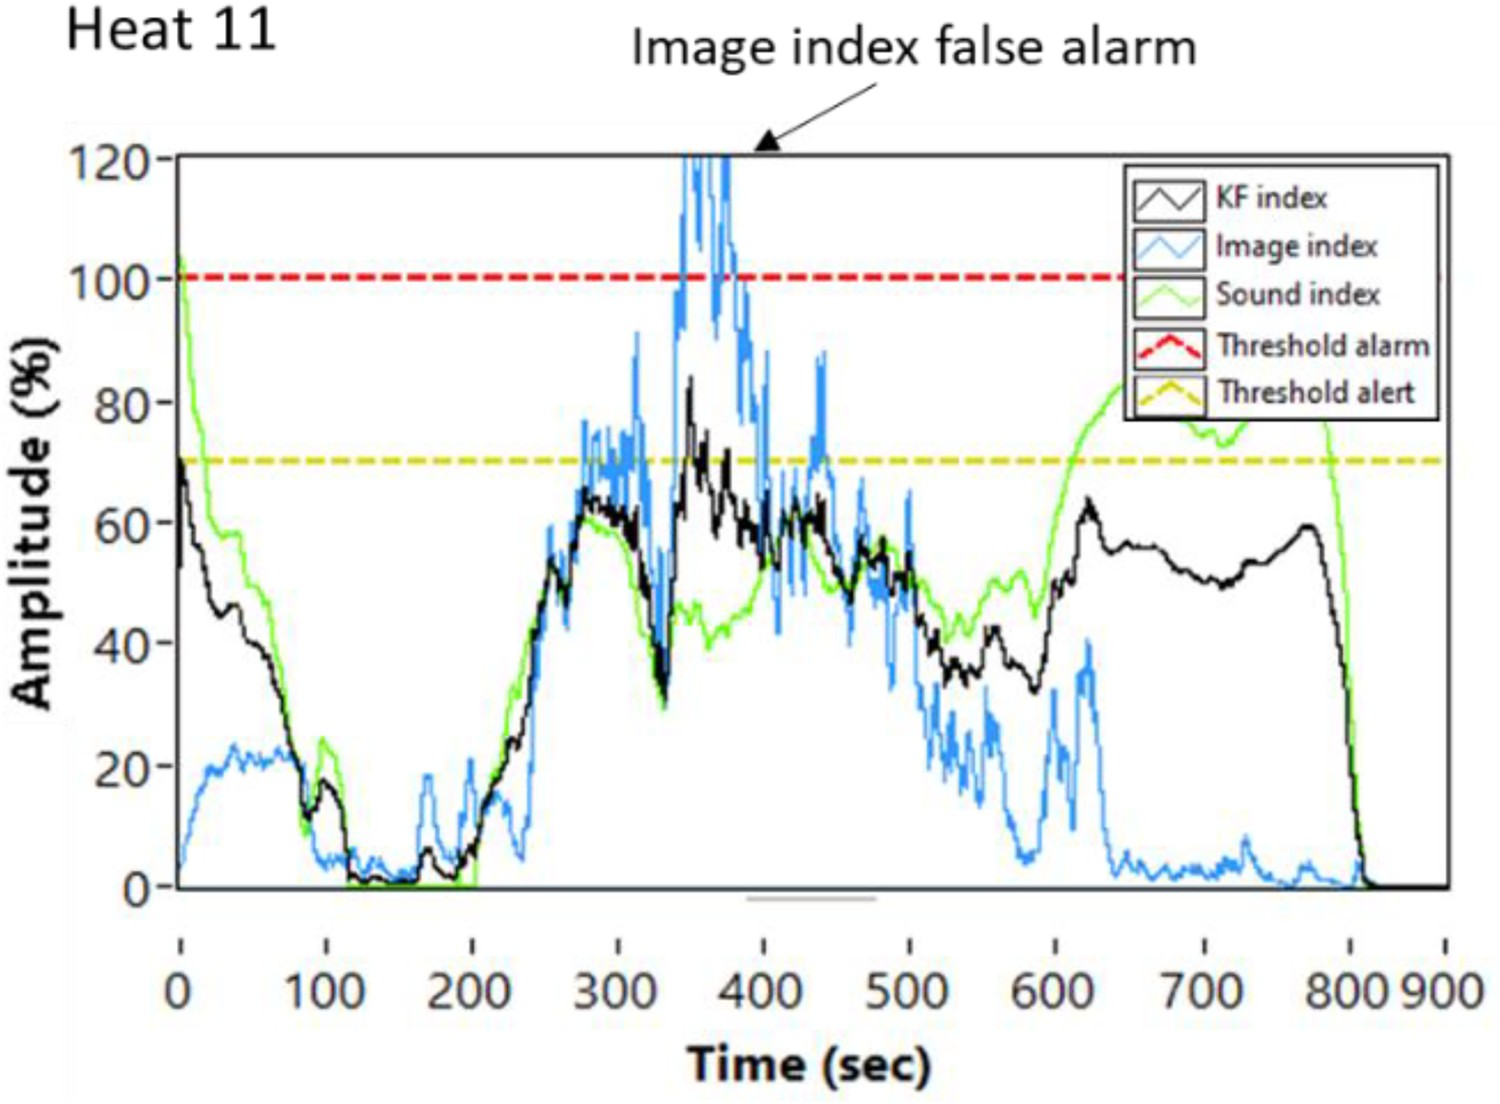
In Figure 14 there is an example where the Kalman filter index did not classify correctly Heat 5 because no alarm was triggered during the slopping event. The image index was not able to identify the slopping event due to its low intensity, thus preventing the KF index to detect it. However, the sound index was able to indicate the high amount of foam inside the converter (from 200 to 630 s of the heat) making the fusion index triggered the alert condition, again, producing information about the potential slopping occurrence. Kalman filter index result for a heat with one missed slopping event.
One of the benefits of data fusion is to keep generating information even when one or more sensors fail [13]. In that case, sensor failing was simulated during the work. Figure 15 presents the data from Heat 7 where three slopping events occurred. In this example, the image index was used alone on the data fusion process through the entire blowing period, simulating the sound sensor fail. It is possible to see that the image index spotted correctly the three slopping events while the Kalman index identified only two events and missed one. In that case, the heat would not be correctly classified by the Kalman index, however, it would produce important information for the converter operators to act. Kalman filter index result for sound sensor failure scenario simulation.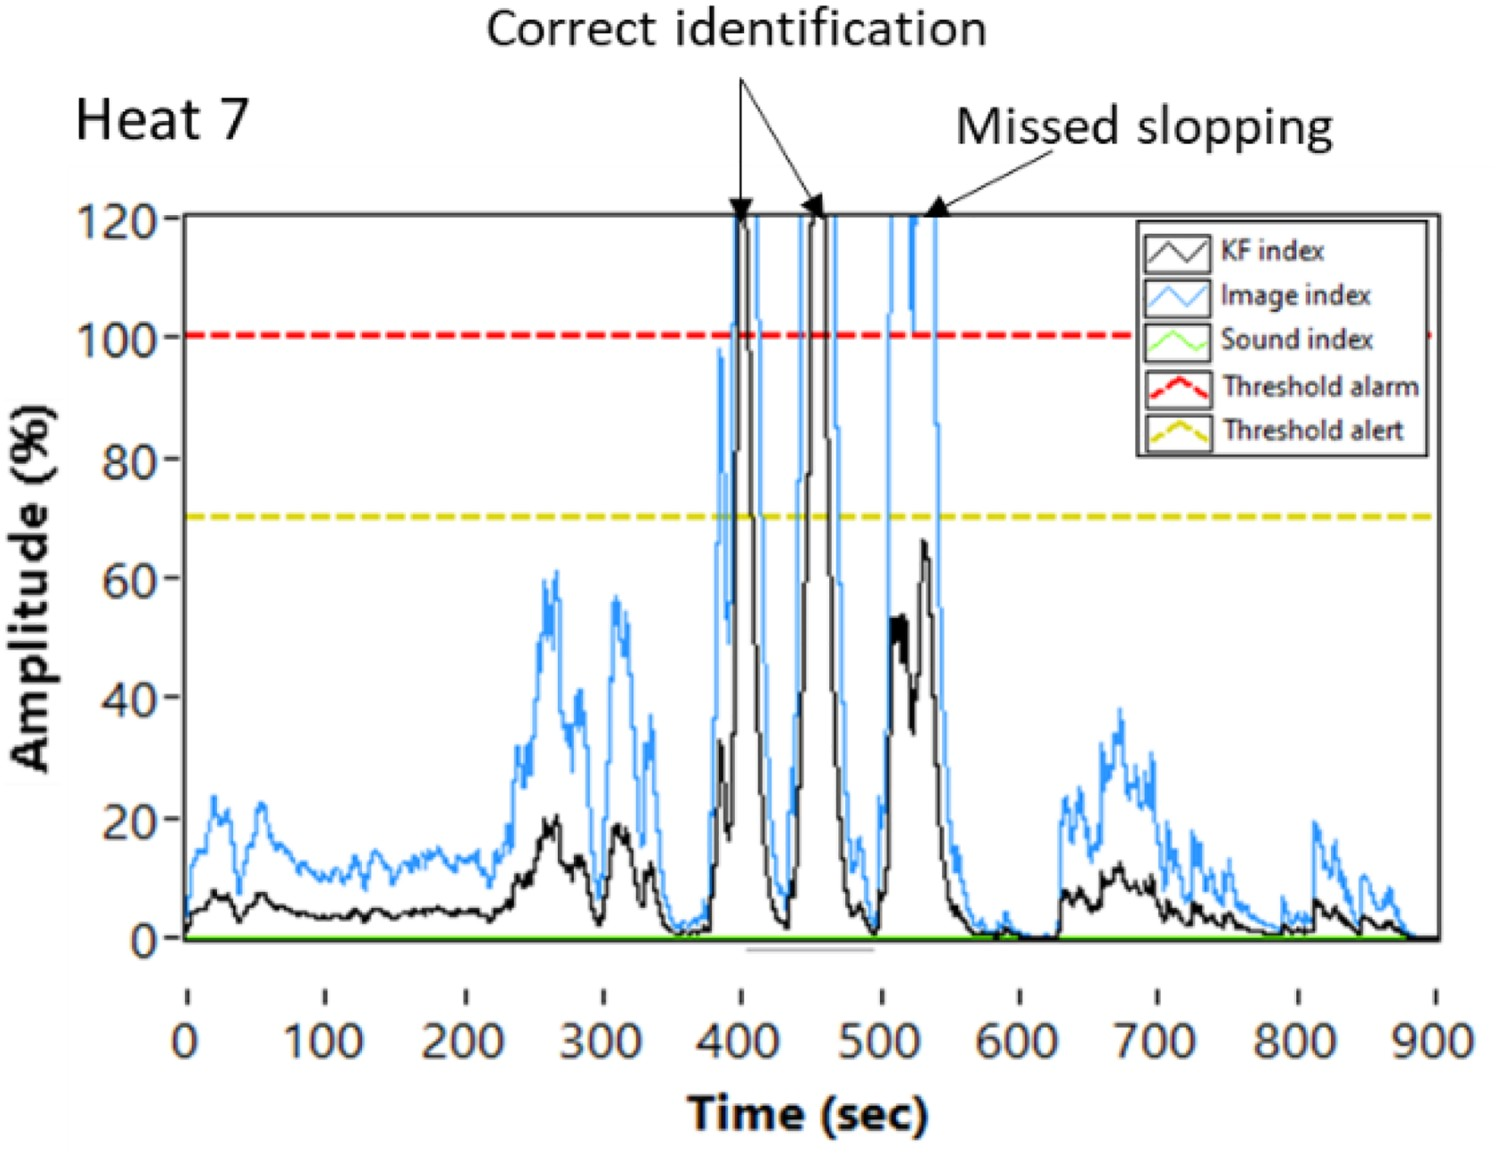
In another scenario of sensor fail simulation, Figure 16 presents a heat where only the sound data were used as input. For this case (Heat 28), two slopping events occurred, and they were not spotted by the Kalman index. The index did not even reach the alert region, meaning a weak representation of slopping potential. Kalman filter index result for image sensor failure scenario simulation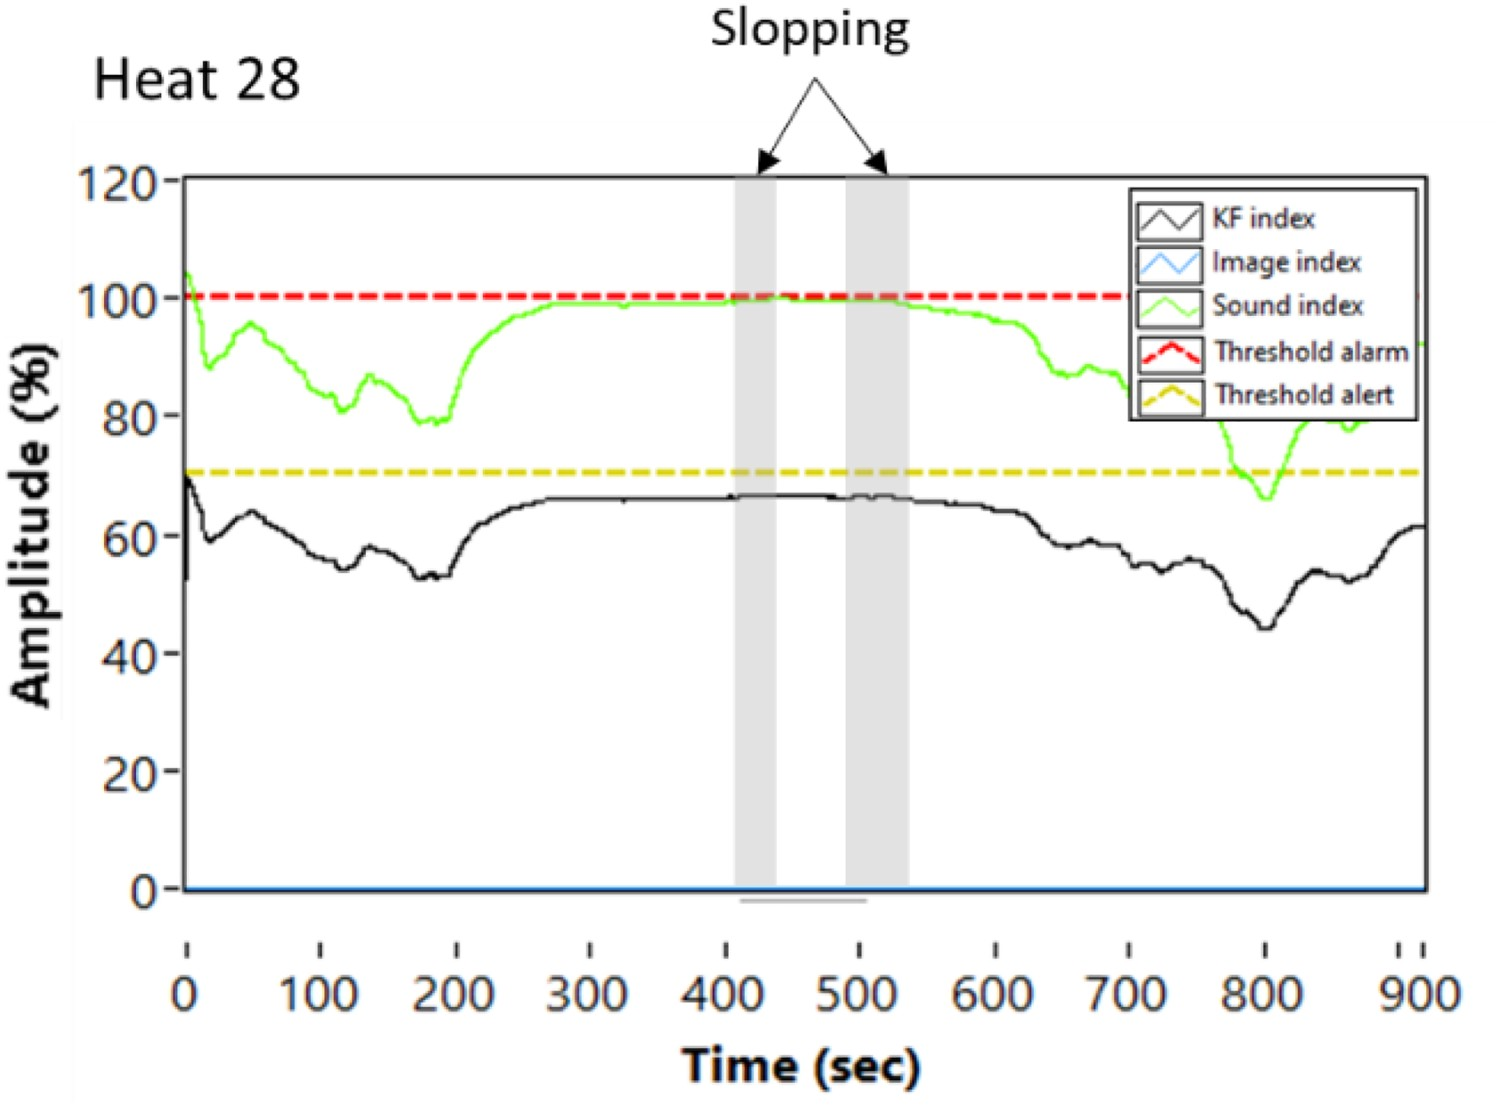
Kalman filter adaptative tuning
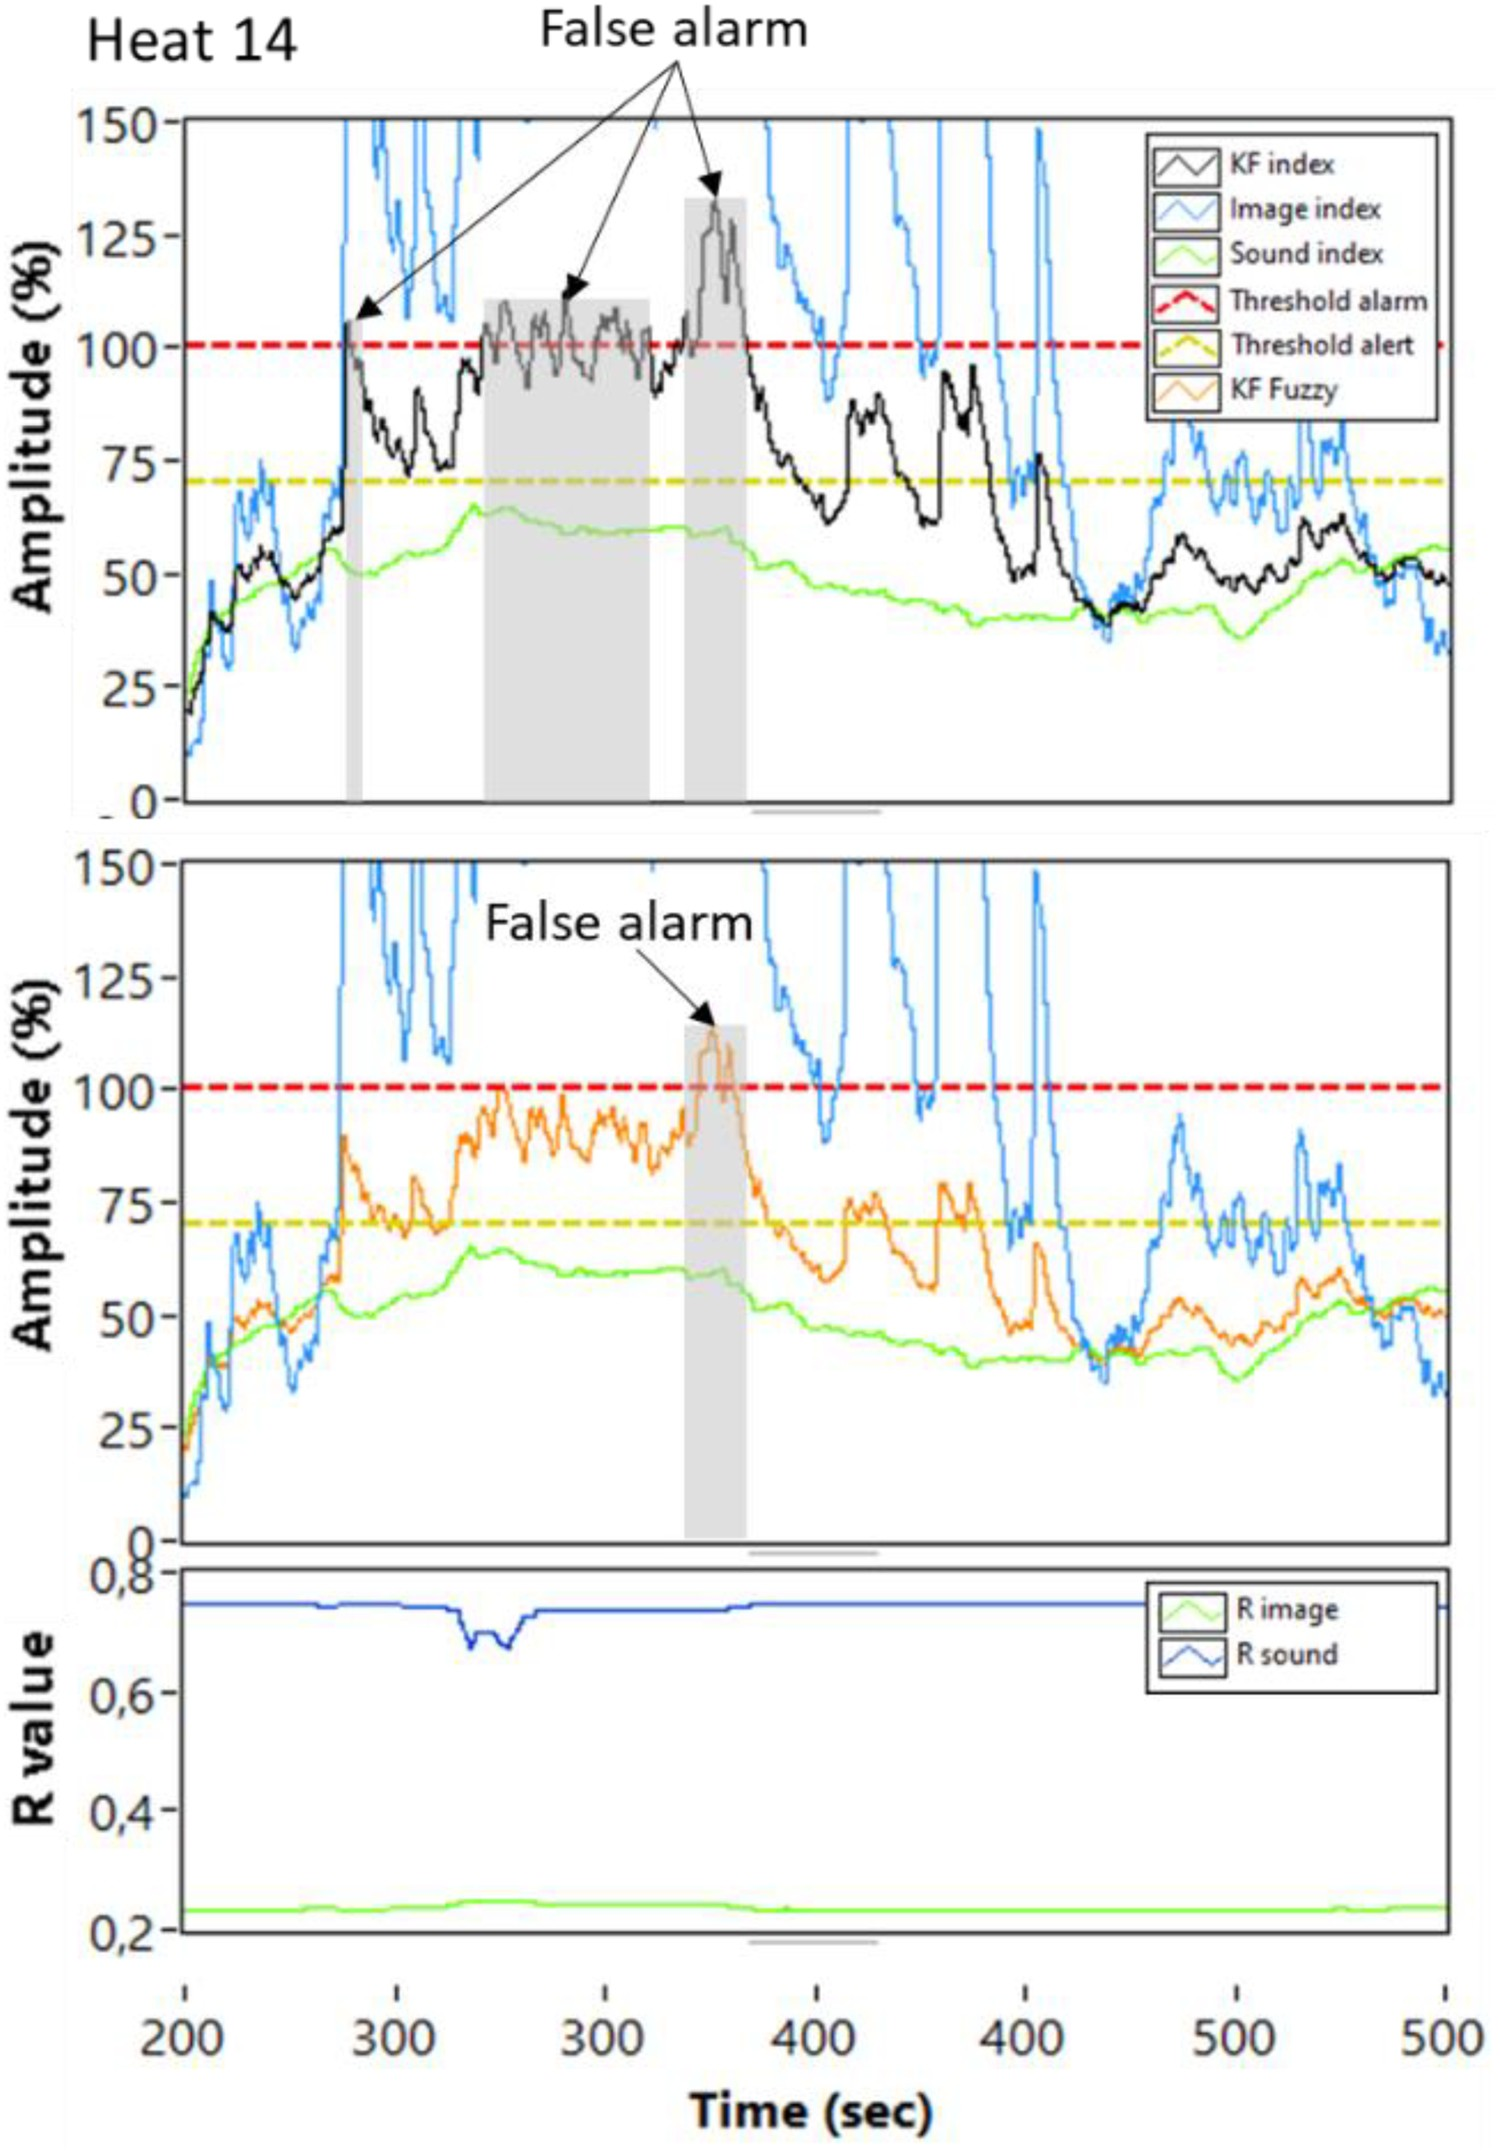
The results presented in Table 2 show a slight difference between the KF index and the Fuzzy KF index. The Fuzzy KF improved the index accuracy by avoiding only two false alarms. This comparison is presented in Figure 17. The first graph presents the Kalman filter index while the second graph presents the tuned filter index and the last graph the Example where fuzzy adjustment on the Kalman filter avoided two false alarms.

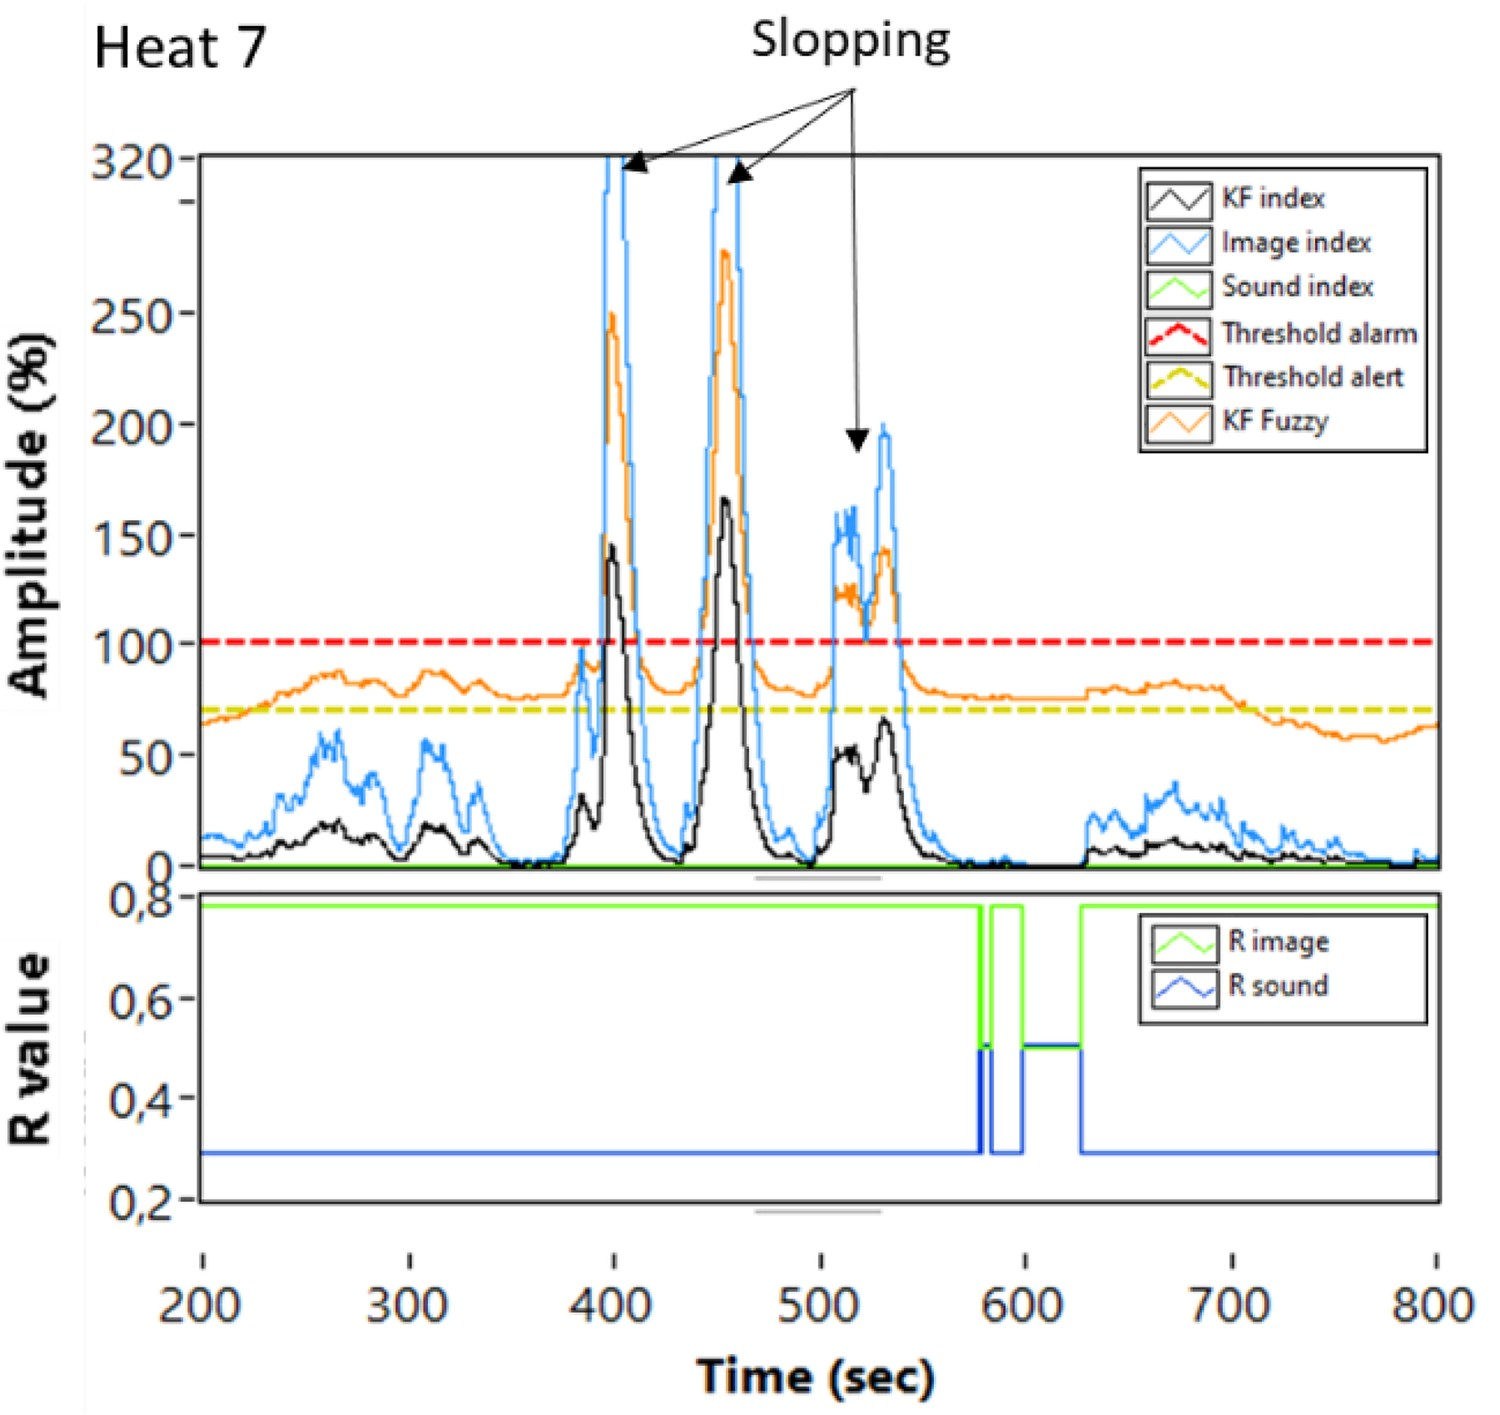
Despite the close result presented in Table 2, the fuzzy tuning brought benefits to the data fusion on a wider range of scenarios. Back to the example of sensor fail simulation (Figure 15), the fusion result with only the image index was able to identify two of the three slopping events. When the filter is tuned to respond differently to this scenario it is possible to have a better result as shown in Figure 18. The Fuzzy tuned KF index is represented by the orange curve while the normal filter is represented by the black curve. In this situation of sensor fault (sound sensor) fuzzy set rule 5 is applied adjusting Fuzzy Kalman filter index result for sound sensor fail scenario simulation.
In another scenario of sensor fault (image), the KF index was not able to identify the slopping events of the Heat 28 (Figure 16), which also did not reach the alert region, leaving operators blind during the blowing process. When the filter is adjusted to respond to the image sensor fault (fuzzy set rule 6), the result of the data fusion can reach the alert region and give awareness of the high level of foaming inside the converter vessel, presented in Figure 19. Fuzzy Kalman filter index result for image sensor fail scenario simulation.
Conclusion
This paper presented the development of a slopping indicator to provide information about foam generation and slopping occurrence through data fusion by the Fuzzy Kalman filter. The filter was dynamically tuned by fuzzy logic for better adjustment during the converter blowing process. The results were based on sound and image data collected on previous trials at a 350-ton LD converter.
Results have shown a significant improvement at slopping detection by data fusion method compared to sound and image sloping indexes separately (Table 2). Despite the lower number of correct alarms generated by the Fuzzy KF index compared to the sound index (21 against 25), the total of correctly classified heats increased (+15%) and the alarm generation accuracy was higher (+13%). Besides, the data fusion process combined the capability of the sound index to estimate the foam level (alert threshold) and the image index to identify the slopping events (alarm threshold).
The tuning process of the filter was essential to overcome specific situations that could leave blind the slopping detection system like sensor fault condition, simulated in this paper. Despite the slight improvement of alarm accuracy (+4%), the fuzzy tuning process unlocks a wide range of opportunities for filter improvement, making it more adaptable and reliable for a slopping prevention system.
As opportunities for future works, the evaluation of the Fuzzy KF index on a greater number of heats would be valuable for finer tuning of the filter on different heat conditions, maybe not experienced in this paper. Besides, the incorporation of new sensors or process variables to the data fusion could enhance the fusion index and improve the slopping prevention system.
Footnotes
Disclosure statement
No potential conflict of interest was reported by the author(s).