
Abstract
A three-dimensional numerical model consistent with physical simulations (water/oil/thymol) has been developed to explore the mass transfer behaviour of sulphur. Euler-Lagrangian and Euler-Euler, were applied to simulate the multiphase flow; compared with experimental data, the Euler-Euler method was more accurate. The small eddy model was used for mass transfer calculations. As a new type of bottom stirring scheme, the effect of central-eccentric parallel injection on mass transfer was investigated. Moving the eccentric nozzle towards the sidewall or increasing the number of eccentric nozzles decreases the mass transfer rate at a constant total gas flow rate. The mass transfer rate increases with increasing central gas flow rate under the differential flow bottom stirring scheme. The single-nozzle central injection is still considered the most superior bottom-blowing scheme. The bubble diameter has an insignificant effect on the liquid–liquid mass transfer. The mass transfer rate of thymol is weakly accelerated with increasing bubble diameter.
Introduction
Desulphurization is one of the main tasks in secondary refining. The steel is driven by the gas, and sulphur is removed from the steel to the slag. The whole process is divided into three main steps, sulphur is transferred from steel to the steel–slag interface, sulphur reacts with the oxides at the steel-slag interface, and the reaction products are transferred to the slag [1]. The interface reaction rate is speedy under a temperature of about 1800 K; thus, the mass transfer process becomes the rate-limiting step. Therefore, studying the mass transfer process of sulphur in ladle refining is crucial to improving production efficiency and producing high-quality steel.
Ladle refining is carried out at a high temperature, which is challenging to observe and measure directly, so physical and mathematical modelling are widely used as two essential research methods [2]. Physical modelling was used extensively in the early studies [3–12]. Thymol has a partition ratio higher than 350 in water/oil systems, which is very similar to the partition ratio of sulphur among steel–slag; thus, thymol is considered an ideal substitute for sulphur [3]. However, physical modelling has its natural limitations in that it cannot obtain all details of the experiment, leading to the difficulty of systematic analysis of the mass transfer mechanism. The rapid progress of computer technology in the last two decades has made it possible to calculate multiphase flow fields involving the slag phase. If the model is well validated, the numerical model can even completely replace the physical model, thus significantly reducing resource consumption. Singh et al. [13] used numerical simulation and thermodynamic software to predict the desulphurization rate of the ladle and found that the double plug purging was superior to the single plug purging. Costa et al. [14] compared the desulphurization behaviour under gas stirring and mechanical stirring by a mathematical model. Lou et al. [15] investigated the effects of different contents of aluminium, manganese, and silicon in slag and liquid steel, the arrangement of bottom-blowing tuyeres, and the height ratio of slag and metal on desulphurization efficiency by coupled CFD-SRM model. Cao et al. [16] developed a numerical model to predict the three-phase flow and desulphurization behaviour in the ladle and examined the effects of initial sulphur content, gas flow rate, and slag layer thickness on the desulphurization efficiency. Then the effects of bubble size, slag layer thickness, and gas flow rate on the volume mass transfer coefficient (vmtc) of sulphur were investigated using the small eddy model [17] in his other work [18]. Hoang et al. [19] used the Euler-Euler (E-E) method to calculate the multiphase flow field within a two-dimensional water model and investigated the effects of gas flow rate, slag layer thickness, and slag viscosity on the mass transfer rate of thymol. They established an empirical relationship between the variables and the vmtc.
The liquid–liquid mass transport behaviour in ladles has been extensively studied, but there are still not sufficient. First, previous work [3,6,20] has found that the mass transfer rate is faster under central injection than under eccentric injection. However, the mechanism remains unclear due to the limitations of physical simulations. Second, most of the work was concerned with the liquid–liquid mass transfer behaviour under single-nozzle injection. In the few works [3,13,21,22] with multiple nozzle injections, the nozzles were usually arranged symmetrically with equal gas flow rates. It would be a beneficial addition to the liquid–liquid mass transfer rules by investigating the mass transfer characteristics when multiple nozzles are arranged asymmetrically and the outlet flow rates are not equal. Last but not least, the effect of bubble diameter on liquid–liquid mass transfer remains controversial. Opposite conclusions were obtained from different works [3,5,18,23,24].
A three-dimensional model consistent with the physical experiments [25] was developed in this work. Euler–Euler and Euler–Lagrange methods were used for multiphase flow calculations; the small eddy model was applied for liquid–liquid mass transfer modelling. The effect of nozzle position on mass transfer was explained with one nozzle. The central-eccentric parallel injection was investigated in detail by varying the nozzle position, the number of eccentric nozzles, and the gas flow distribution. In addition to this, the effect of bubble diameter on the mass transfer rate was studied. This work would be a meaningful supplement to the previous mass transfer work.
Governing equations
Euler–Lagrange method
The E-L method solves the Navier–Stokes equations in the Eulerian framework for continuous phases, and the particle trajectory equations are solved in the Lagrangian framework for particle phases [26–28].
The VOF model allows the simulation of two or more incompatible fluids and is widely employed to trace the interfaces between multiple phases. In the VOF model, each fluid component shares the same set of momentum equations, and the interphase interface is traced by solving the continuity equation for the volume fraction [18]. For the qth phase, the continuity equation is described as follows: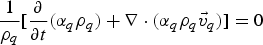


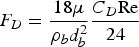
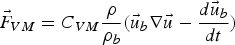
The bubble is treated as discrete particles in the DPM model. The velocity of the bubble is obtained by solving the flow field of the continuous phase and combining the flow field variables to obtain the force on each bubble, then tracking the trajectory of each bubble. The force equation can be described as: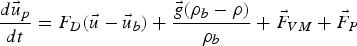


Euler–Euler method
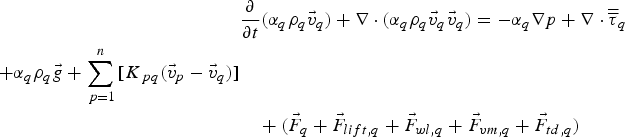
The E-E method solves the Navier–Stokes equations for continuous phases and the conservation equations for particle phases in the Eulerian framework. All phases share the same pressure. The momentum and continuity equations are solved for each phase [28]. The continuity equation for phase q is: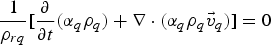


Turbulence model
The realizable k-ϵ model was chosen to calculate the multiphase turbulent flow for a more accurate estimation of the turbulent kinetic energy, and the near-wall treatment was performed using standard wall functions. The governing equations [26,27] for k and ϵ are as follows:

where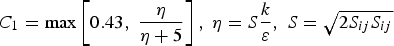
Mass transfer
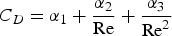
For mass transfer calculations involving multiphase flows, ANSYS Fluent provides various mechanisms such as ‘constant-rate’, ‘cavitation’, ‘evaporation-condensation’, ‘species-mass-transfer’, etc. The ‘species-mass-transfer’ is suitable for the following situations: both phases consist of mixtures with at least two species, and at least one of the species is present in both phases; the two mixture phases are in contact and separated by an interface; species mass transfer can only occur between the same species from one phase to the other [26,27]. This is consistent with the mass transfer characteristics of thymol between water and oil, so ‘species-mass-transfer’ was chosen for mass transfer calculations. The conservation equation describing each component’s convection, diffusion, and reaction sources is shown in Equations (12)–(14).
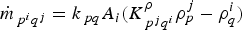
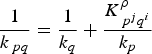


In this case, kq
was the mass transfer coefficient in water, and kp
was the mass transfer coefficient in oil. No chemical reaction was involved, and the only substance transported was thymol. Since the resistance was mainly from the transfer of thymol in water, thymol was immediately absorbed by the oil once it reached the interface. Therefore, the resistance in oil can be neglected. kq
was defined using the small eddy model [17], as shown in Equation (15).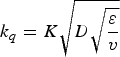
Computational domain and numerical methodology
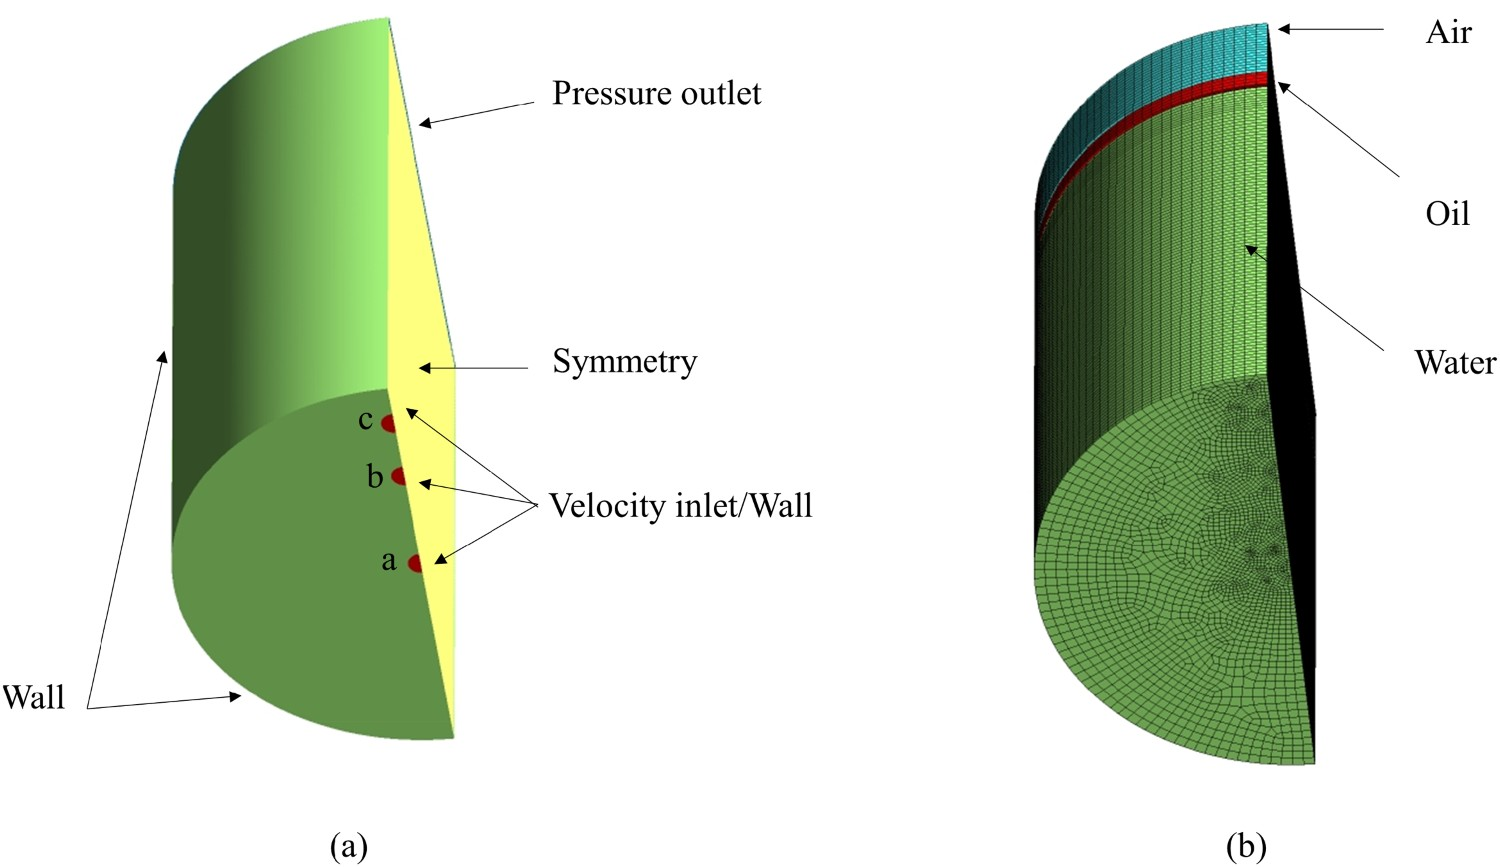
As shown in Table 1, the water model was a 1/17th scale model of the 200 t industrial ladle that satisfies geometric similarity. The gas flow rate was adjusted according to the kinetic similarity, as shown in Equation (16). Boundary conditions and mesh generation. (a) Boundary conditions; (b) Mesh generation. The dimensions of the ladle. Physical properties of the phases.
ANSYS Fluent 19.2 was employed to solve the above governing equation with a pressure-based solver. When solving multiphase flows by the E-L method, the transient solver was used, the pressure-velocity coupling was performed in PISO format, and the geo-reconstruct format was used to solve the volume fraction equation in VOF explicit format; the pressure equation was discretized using the PRESTO! scheme. The time step size was 0.001 s, and the convergence was set at 10−6 for all parameters. When it comes to the E-E method, the steady-state solver was chosen to save time, the Coupled format was selected for pressure–velocity coupling, and the volume fraction equation was solved using the Modified HRIC scheme. The UDF function (the small eddy model) was introduced for mass transfer calculations after the flow field reached a steady state. The mass transfer of thymol was calculated for 1000 time steps with a time step size of 10 s. the convergence was set at 10−6 for all parameters.
Results and discussion
Model validation
In the physical experiments [25], the air at 2.85 NL min−1 was injected from the central nozzle. Then the air escaped to the atmosphere after passing through 0.164 m of water and 0.0066 m of oil successively. Particle Image Velocimetry (PIV) was employed in fluid dynamics experiments to obtain the velocity and turbulent kinetic energy distribution at the centre plane of the ladle. In the mass transfer experiment, 125 ppm of thymol water solution and silicone oil were sequentially and quietly poured into the ladle, and then gas injection was started. The aqueous solutions were sampled at regular intervals, and the variation of thymol concentration with time was measured using a UV spectrophotometer. In order to verify the validity of the numerical model, the multiphase flow field under the central gas injection (2.85 NL min−1) was calculated using the E-L and E-E models, respectively, and compared with the experimental data. The various parameters used in the numerical calculations were in agreement with the physical experiments. The velocity and turbulent kinetic energy in the radial (0.04 m) and axis directions were selected for comparison with the experimental data in Figure 2. As shown in Figure 2(a), both methods accurately predicted the velocity outside the plume, but the E-L method overestimated the velocity magnitude of the plume compared to the E-E method. This was more evident in Figure 2(b) for comparing axial velocities in the plume region, where the maxima velocity obtained from the E-L method was about five times that of the experimental value. Figures 2(c,d) give the results of turbulent kinetic energy. The E-L method accurately predicted the turbulent kinetic energy, while the E-E method overestimated the turbulent kinetic energy in the orifice region. Since its better in agreement with the experimental values, the E-E method was chosen for the following calculations. Comparison of model predictions with experiment data [25]: (a) The water velocity in radial direction (0.04 m); (b) The water velocity in axial direction; (c) The water turbulent kinetic energy in radial direction (0.04 m); (d) The water turbulent kinetic energy in axial direction.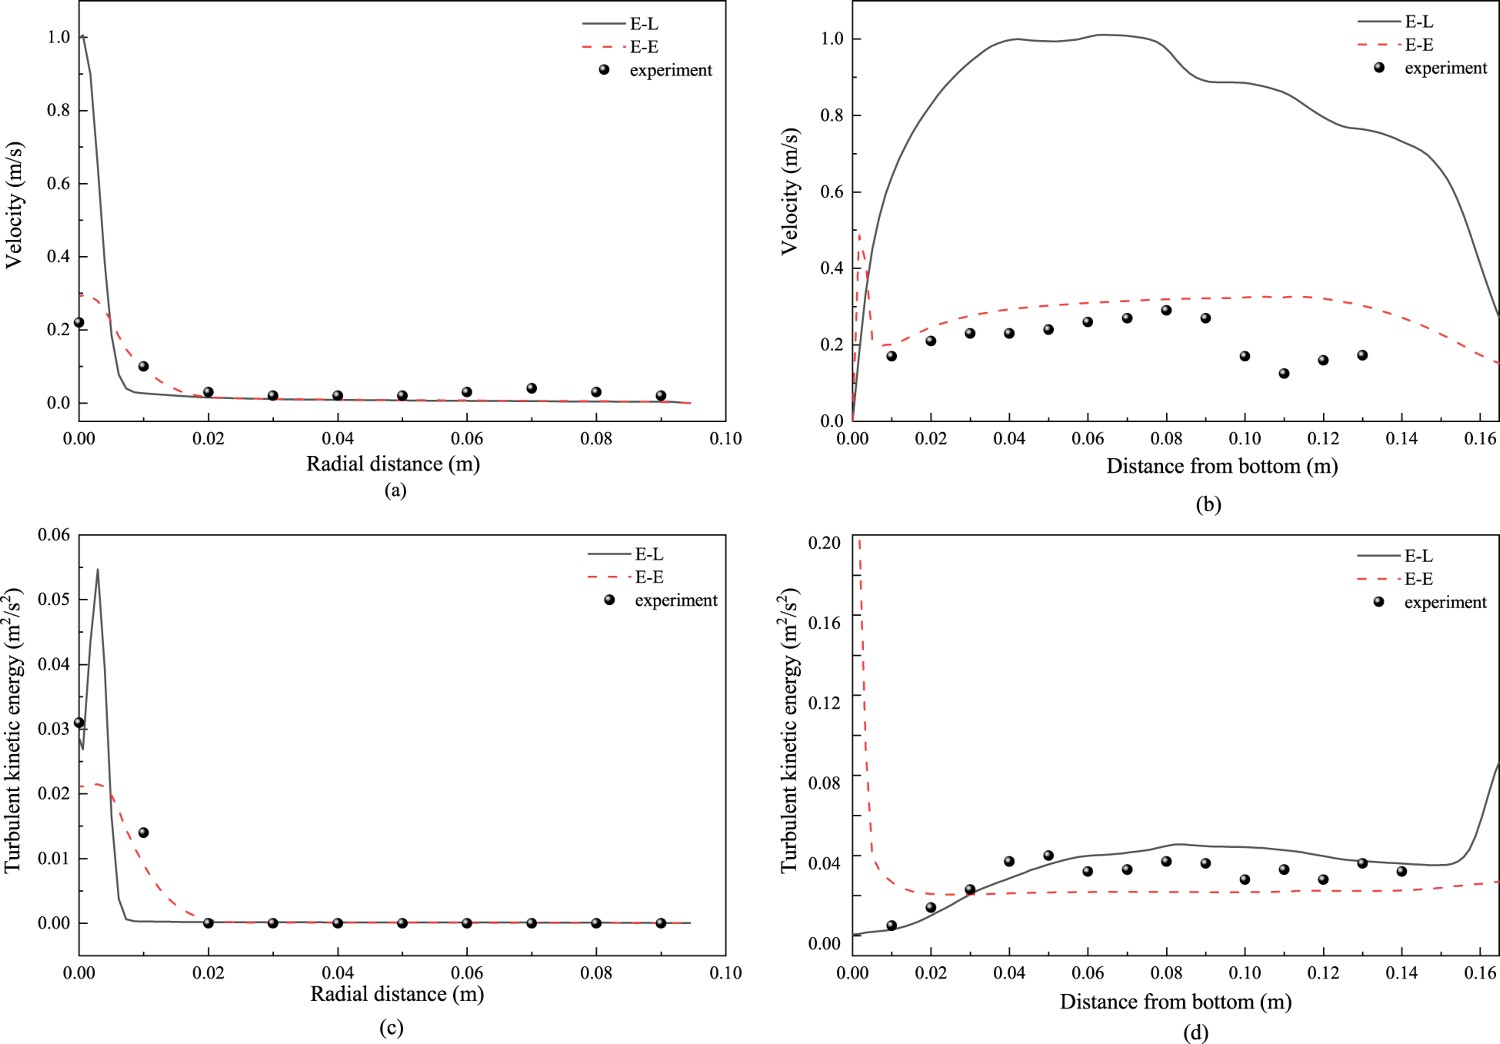
A model constant was needed before using the small eddy model. As seen in Figure 3, the thymol concentration predicted with the model constant of 0.025 better agrees with the experimental data; therefore, 0.025 was picked for the following calculations. Comparison of thymol concentration predictions with experiment data [25].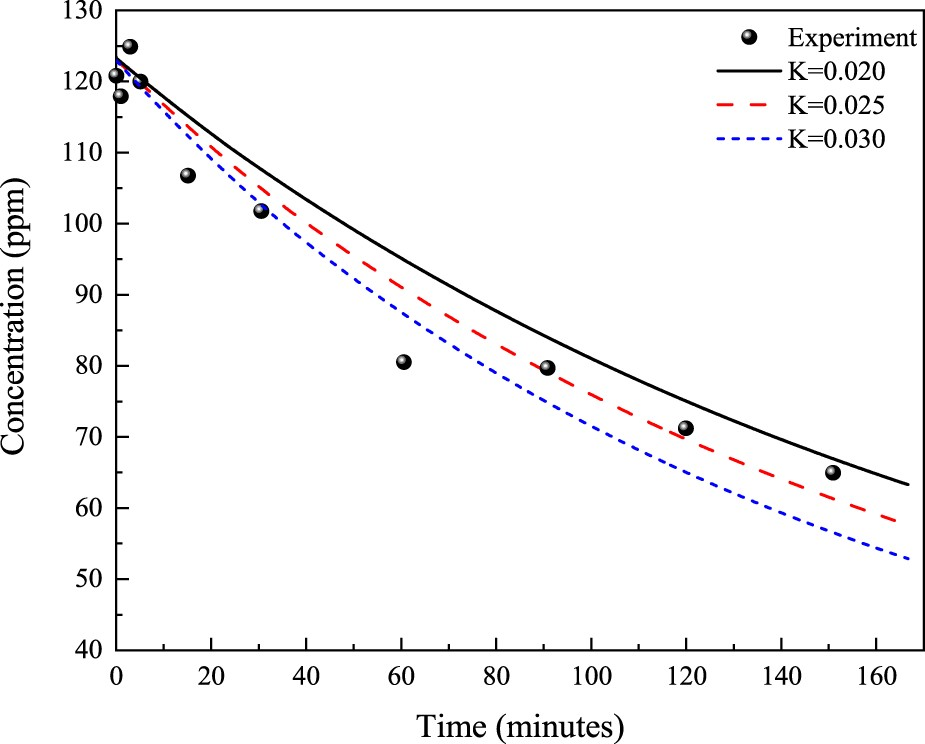
Nozzle position
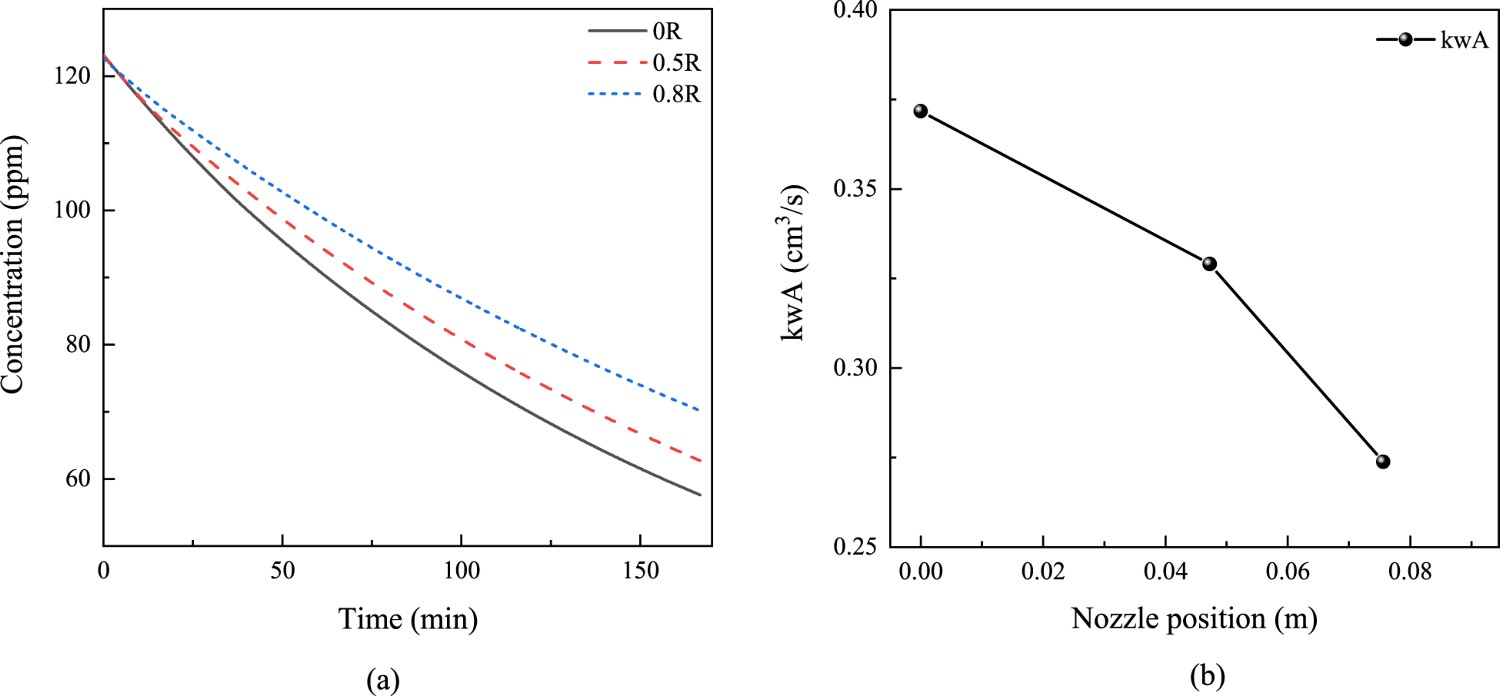
The effect of nozzle position on liquid–liquid mass transfer has been extensively studied. However, the mechanism behind still not clear because experimental details were not fully available by physical simulation. The mass transfer behaviour was investigated at single-nozzle injection by numerical simulation in this work. The gas flow rate was 2.85 NL min−1, and the nozzle position was displaced from the centre (0R) to the sidewall (0.5R, 0.8R). Figure 4(a) shows the variations in thymol concentration with time when gas was injected from different nozzle positions. As the gas was injected from the central nozzle, the thymol concentration decreased by 67 ppm over about 170 min. However, when the nozzle was moved from the centre to the 0.5R and 0.8R positions, the thymol concentration decreased by only 60 and 53 ppm, respectively. The vmtc can be obtained by Equation (17) [3]. Effect of nozzle position on mass transfer: (a) The variation of thymol concentration with time; (b) The variation of vmtc with nozzle position.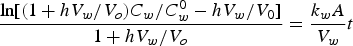
In order to understand the mass transfer mechanism, the flow field and interface shape at the two-phase contact interface are displayed, as shown in Figure 5. As Figure 5(a–c) shows, the velocity was more intense around the plume. With the increase of distance from the plume, the velocity decreased gradually. A similar pattern was exhibited for the turbulent kinetic energy as well (Figure 5(d–f)). When the gas was injected from the central position, the velocity and turbulent kinetic energy distribution in the horizontal plane were almost symmetrical along the radius direction. As the nozzle was moved from central to the sidewall, the flow field was more intense near the plume due to the barrier of the wall, and the oil layer was pushed away as a slag eye. At the same time, the velocity and turbulent energy on the other side decreased, resulting in a weaker influence on the oil layer, so the interface became flat, as shown in Figure 5(g–i). As an important factor affecting the liquid–liquid mass transfer, reducing the interfacial area usually slows down the mass transfer rate. As Figure 5(i) shows, when the nozzle position was too close to the wall (0.8R), the plume was directly cut off by the wall, and the contact area between the two phases was further reduced, leading to a further decreased in the mass transfer rate. After the above numerical calculations, the superiority of the central location for liquid–liquid mass transfer is demonstrated once again. Meanwhile, the flow field data being presented has positive implications for understanding the mass transfer mechanism. It is worth mentioning that, as the topic is often discussed together, the gas injection from the eccentric nozzle is more excellent for the mixing of the primary phase [2], which contradicts the requirements of mass transfer for the nozzle arrangement. Fortunately, the mixing in the ladle is completed in a much shorter period, while complete removal of impurities such as sulphur takes much longer, with a difference of about two orders of magnitude [19]. Moreover, an excessively eccentric nozzle position, such as the 0.8R in this case, will lead to the excessive flushing of the furnace wall by the plume. Therefore the central nozzle appears to be more required for ladle refining. Effect of nozzle position on the water velocity, turbulent kinetic energy, and the interface shape between water/oil (0.16 m): (a–c) Water velocity when the nozzle at 0R, 0.5R and 0.8R; (d–f) Turbulent kinetic energy of water when the nozzle at 0R, 0.5R and 0.8R; (g–i) The interface shape of oil layer when the nozzle at 0R, 0.5R and 0.8R.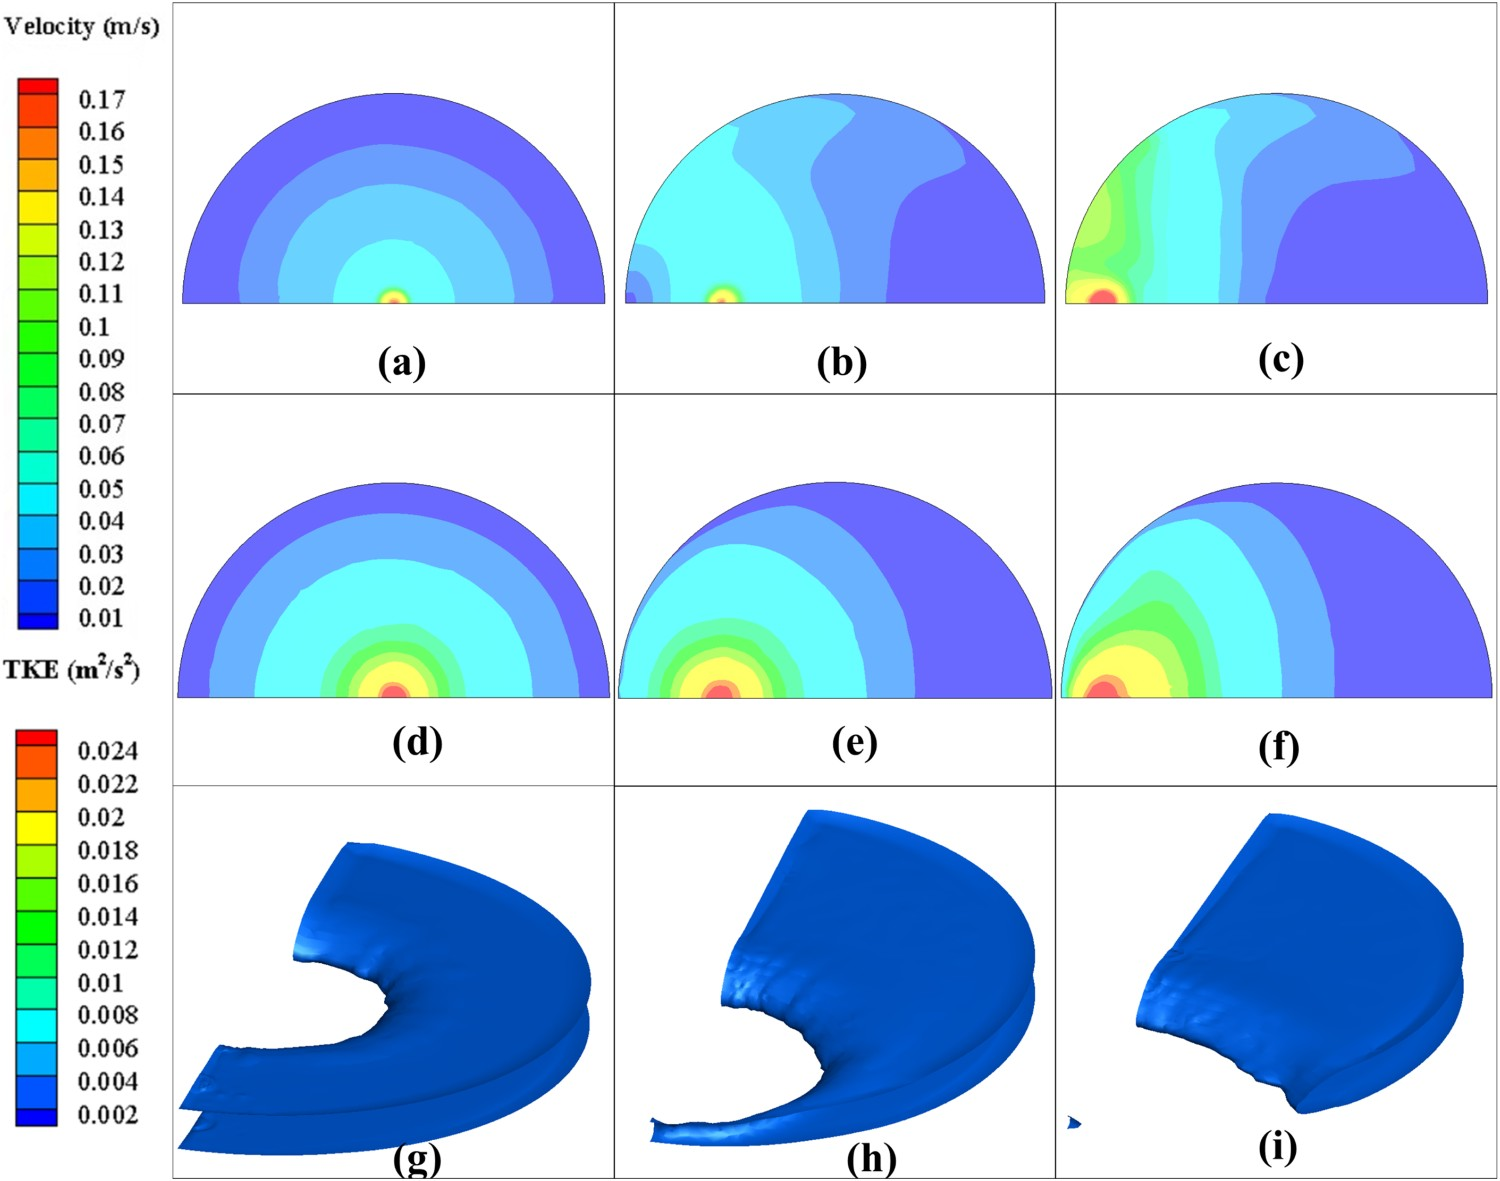
Eccentric nozzle position and number of eccentric nozzles
As a novel bottom stirring scheme, the effect of centre-eccentric parallel injection on the mass transfer behaviour was investigated. First, the effects of eccentric nozzle position and the number of eccentric nozzles on mass transfer were examined in this section. The gas flow rate of all nozzles was equal, and the total gas flow rate was 2.85 NL min−1. ‘Nozzle a’ (centre) and ‘nozzle b’ (eccentric, 0.5R) were set as velocity inlet first. The gas flow rate of each nozzle was 1.425 NL min−1. Then, the mass transfer behaviour with the injections from ‘nozzle a’ (central) and ‘nozzle c’ (eccentric, 0.8R) was calculated. Finally, three nozzles were all set as velocity inlets, each with a gas flow rate of 0.95 NL min−1. The results are presented in Figure 6. For the central-0.5R eccentric injection pattern, the concentration of thymol was reduced by 50 ppm in about 170 min. vmtc was 0.256 cm3 s−1. When the eccentric nozzle was moved from the 0.5R position to 0.8R, vmtc decreased slightly to approximately 0.242 cm3 s−1. As the air was injected from three nozzles simultaneously, the thymol concentration was reduced by only 43 ppm in 170 min, and the vmtc was further reduced to approximately 0.214 cm3 s−1. This illustrates that either the eccentric nozzle position being shifted toward the sidewall or increasing the number of eccentric nozzles leads to a decrease in mass transfer rate at a constant total gas flow rate. The mass transfer results were compared with the central injection of the single nozzle, as shown in Figure 6. The mass transfer efficiency was inferior for all three nozzle configurations by comparison with central injection, which illustrates that the central injection is the best position for mass transfer from another perspective. Effect of eccentric nozzle position and number of eccentric nozzles on mass transfer.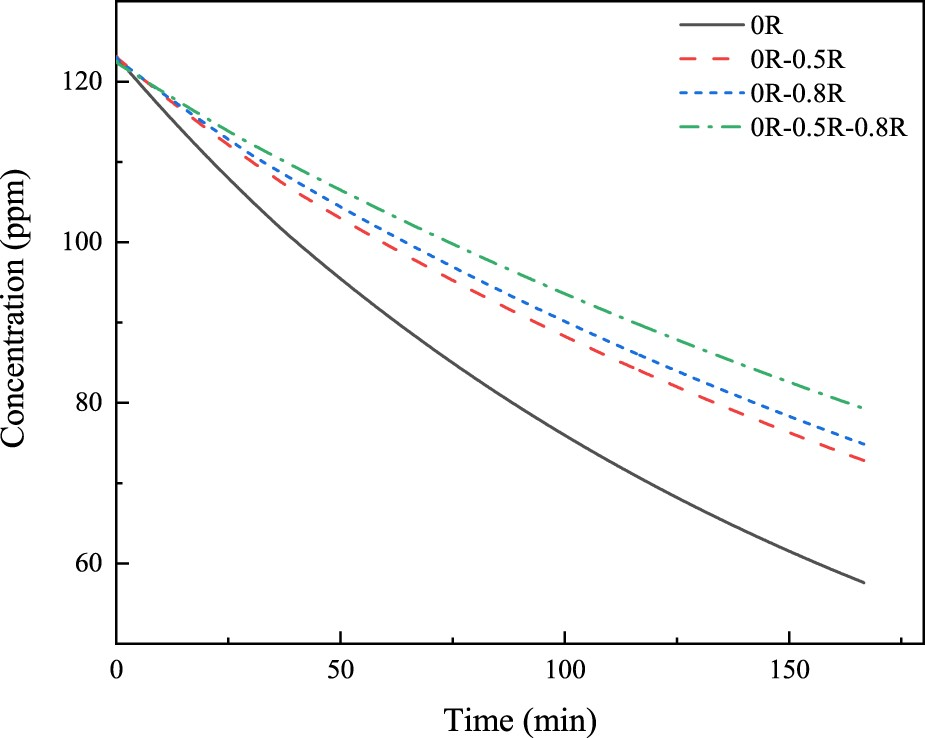
Figure 7 shows the flow field and thymol concentration distribution in the ladle. As shown in Figure 7(a–i), the velocity and turbulent kinetic energy on the plume side were enhanced as the eccentric nozzle position was moved from 0.5R to 0.8R. At the same time, a larger area with low values of velocity and turbulent kinetic energy was observed on the other side. Moreover, the eccentric plume’s velocity and turbulent energy were slightly higher than the central plume due to the obstruction of the wall. As the nozzles were increased to three, the flow field near the plume was significantly lower due to the decrease in gas flow rate per nozzle. Meanwhile, the flow field was more uniformly distributed on the plume side. Figure 7(g–i) shows the concentration distribution of thymol at 30 min. The significant effect of the flow field on the mass transfer can be observed by comparison with the velocity and turbulent kinetic energy contours. Excluding the region of the slag eye where oil and water were not in contact, the concentration of thymol was lower in the region where the velocity and turbulent kinetic energy were higher. This is because the more significant the flow field causes more substantial fluctuations in the oil layer, increasing the interfacial area and facilitating the mass transfer. In addition, the thymol concentration was higher for the slag eye and ladle interior, and the difference in concentration between the different regions was minimal, indicating that the mixing of the water phase had almost no effect on the liquid–liquid mass transfer. The details of mass transfer under multiple nozzle injections are understood with the above description. Nevertheless, this pattern does not show a more excellent mass transfer performance than the conventional central injection. Moreover, it is less pragmatic and challenging to apply to industrial production. Velocity, turbulent kinetic energy and thymol concentration of water at the central longitudinal plane and oil-water contact surface (0.16 m): (a–c) Water velocity when the gas was injected from 0R-0.5R, 0R-0.8R and 0R-0.5R-0.8R, respectively; (d–f) Turbulent kinetic energy of water when the gas was injected from 0R-0.5R, 0R-0.8R and 0R-0.5R-0.8R, respectively; (g–i) Thymol concentration when the gas was injected from 0R-0.5R, 0R-0.8R and 0R-0.5R-0.8R, respectively, at 30 min.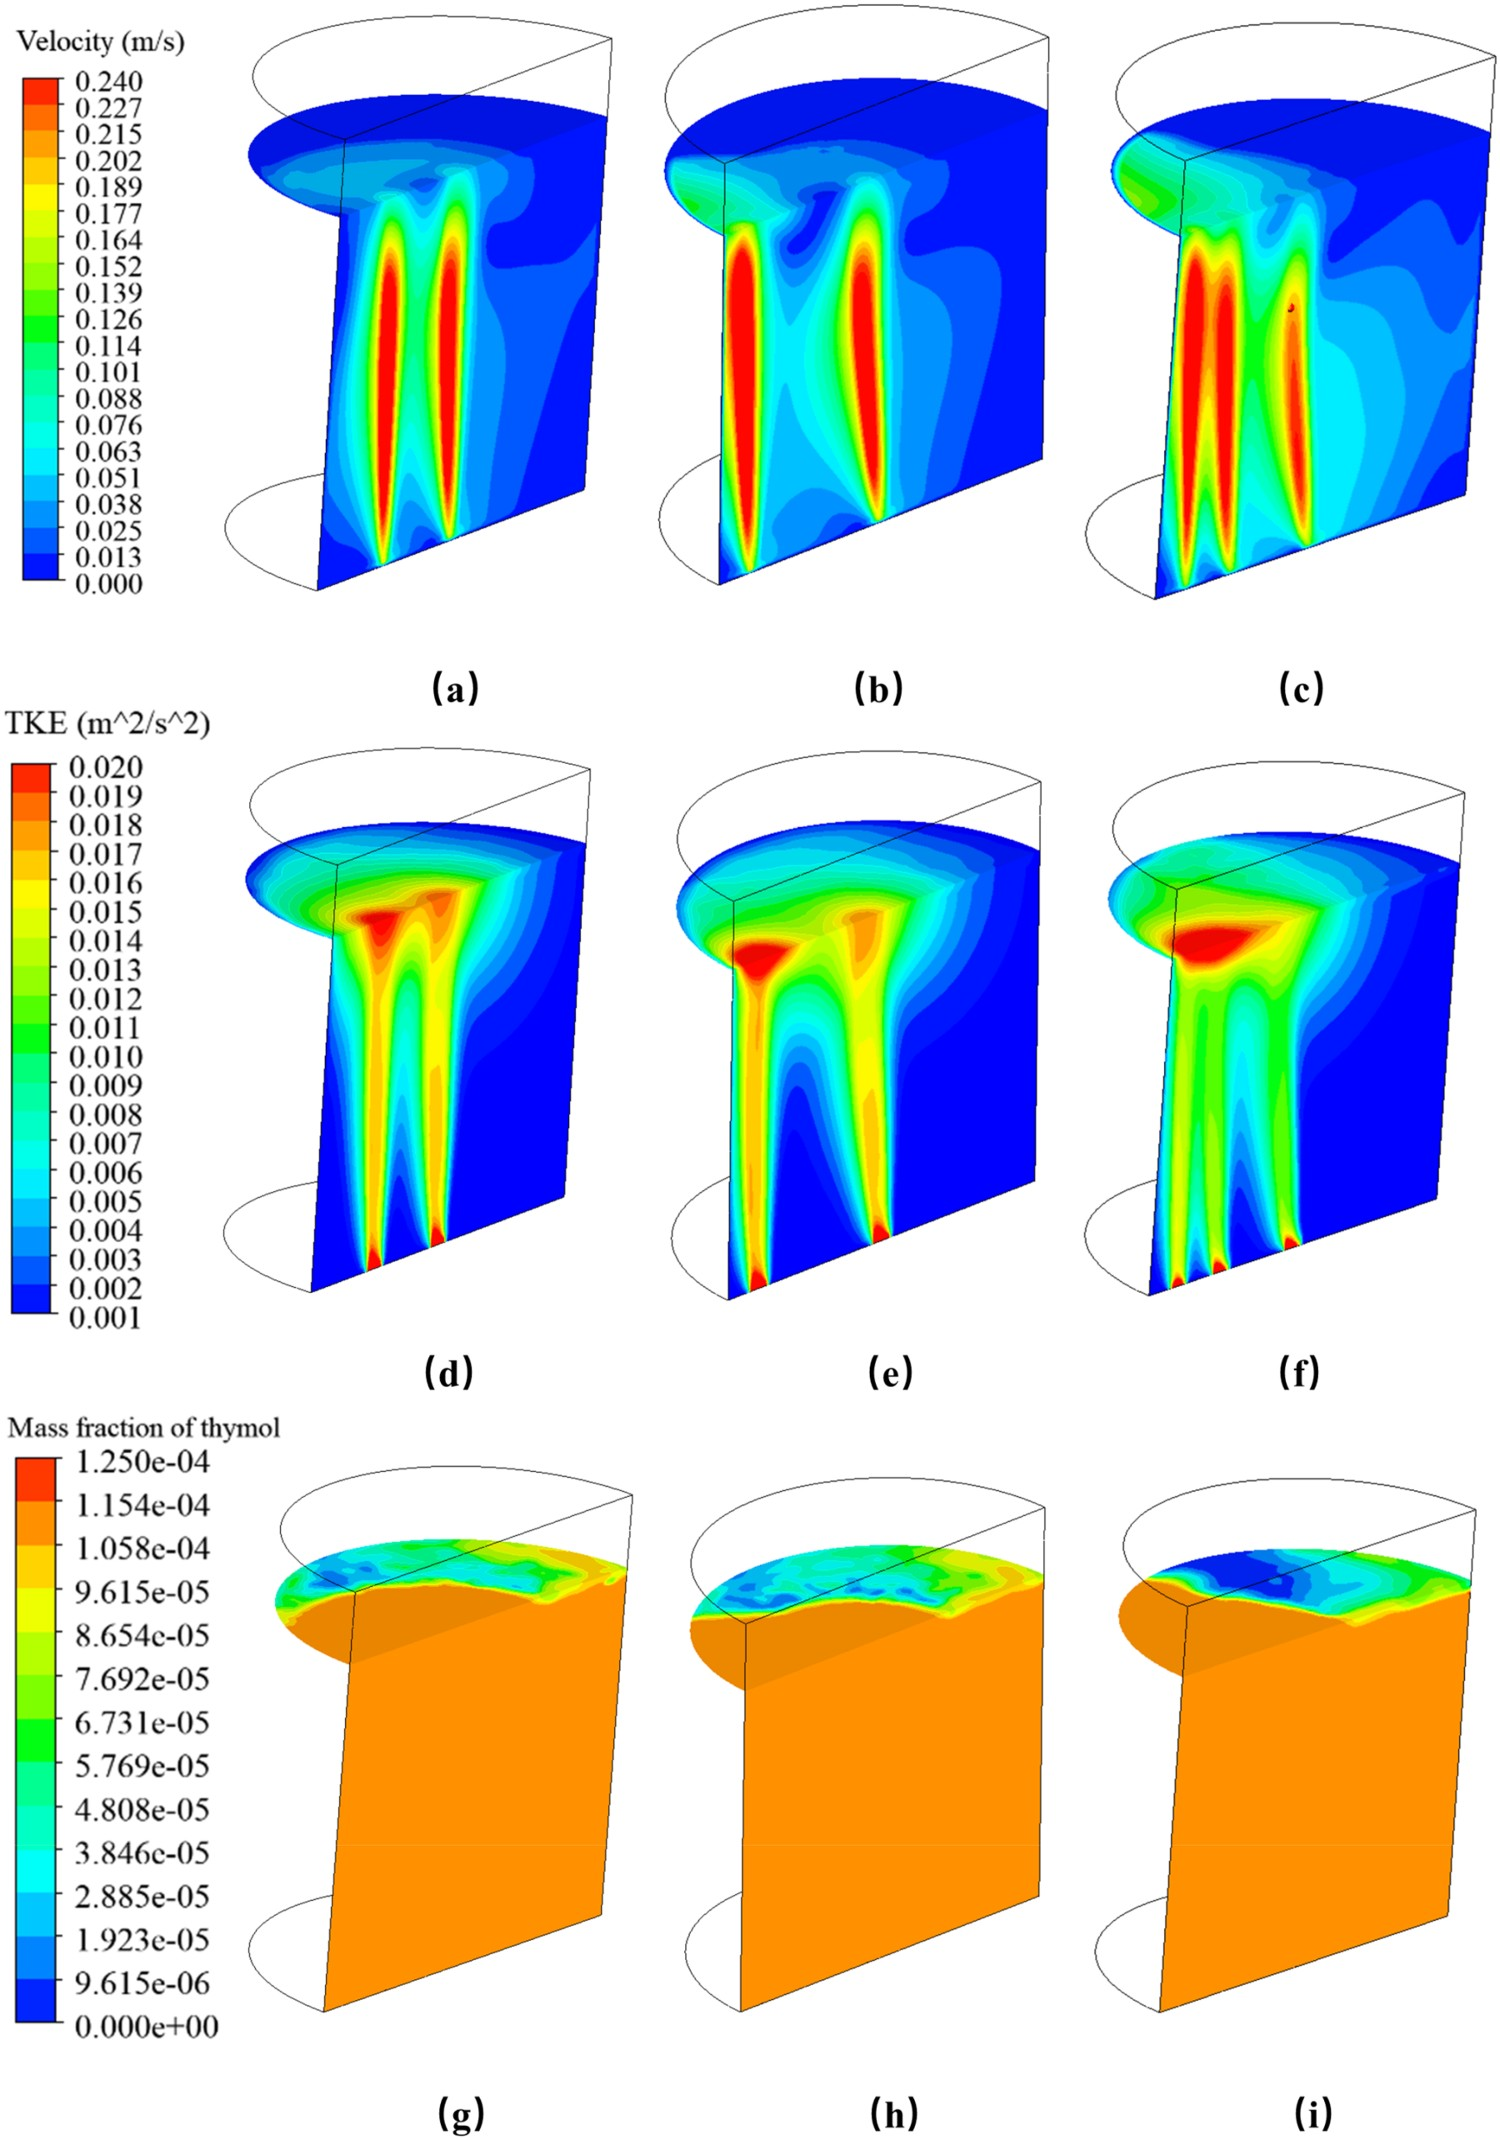
Gas flow distribution
The effect of gas flow distribution on mass transfer was investigated under the central-eccentric parallel injection pattern. The eccentric nozzle was fixed at the 0.5R position, and the total gas flow rate was kept at a constant, 2.85 NL min−1. There were three types of gas distribution: 1.8 NL min−1 for the central nozzle and 1.05 NL min−1 for the eccentric nozzle; 1.425 NL min−1 for both nozzles; 1.15 NL min−1 for the central and 1.7 NL min−1 for the eccentric nozzle. The results are illustrated in Figure 8. The mass transfer rate was fastest when the central gas flow rate was 1.8 NL min−1, and thymol decreased by about 54 ppm for about 170 min. There was a slight decrease (50 ppm) in the concentration of thymol when the two nozzles equally distributed the gas flow rate. The worst mass transfer effect of thymol was observed when the central gas flow rate was less than the eccentric flow rate, with thymol concentrations reduced by only 49 ppm. The vmtc was calculated by Equation (17), which were 0.279, 0.256, and 0.247 cm3 s−1 for three differential flow bottom stirring schemes, respectively. This demonstrates that the mass transfer rate increases with the increase of the central gas flow rate at a constant total gas flow rate. The mass transfer results were compared with the single-nozzle central injection as well. The central stirring with one nozzle showed superior performance, proving that increasing the number of nozzles does not contribute to the mass transfer efficiency at a constant total gas flow rate. Effect of gas flow distribution on mass transfer.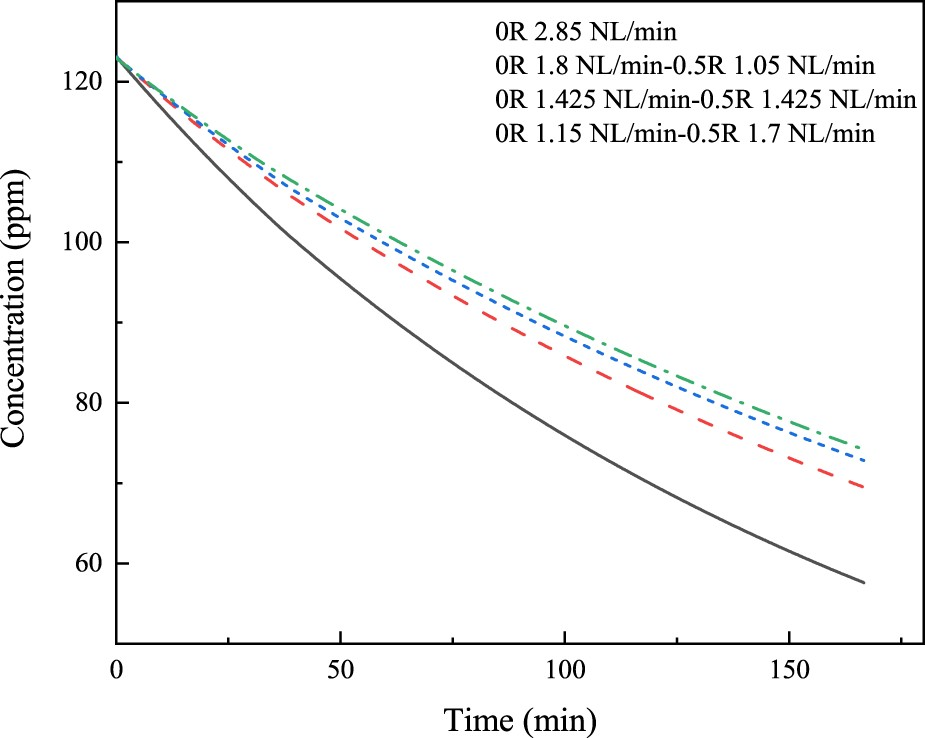
The distribution of the water flow field at the oil–water interface is crucial for liquid–liquid mass transfer. A stereogram of the flow field at the oil–water interface (H = 0.16 m) was created, as shown in Figure 9, to show the effect of the gas flow distribution patterns on the water-phase flow field more clearly. The two nozzles were distributed along the X-axis. The range from −0.1 to 0.1 m was defined in the X-axis direction, and 0 to 0.1 m was defined in the Y-axis direction. Figure 9(a–c) illustrates the velocity field, and Figure 9(d–f) presents the turbulent kinetic energy. Two peaks were observed at the central and eccentric plume positions. With the decrease of the central gas flow rate, the peak at the central position decreased, while the peak at the eccentric position increased. In the other regions outside the plume, the altitude increased on the right side (−0.1 < x < 0) due to the increase in eccentric gas flow rate; the altitude of the left side (0 < x < 0.1) decreased simultaneously. The ‘mountain’ tilted to the right side, and the oil layer was pushed to the left side by the plume. Decreasing the central gas flow rate led to a reduction in the left side’s flow field, which has a weaker effect on the oil layer, resulting in a drop in the oil–water contact area, leading to a decrease in the mass transfer rate. Velocity and turbulent kinetic energy of water at oil-water contact surface (0.16 m): (a–c) Water velocity when the central gas flow rate is 1.800, 1.425 and 1.150 NL min−1, respectively; (d–f) Turbulent kinetic energy of water when the central gas flow rate is 1.800, 1.425 and 1.150 NL min−1, respectively.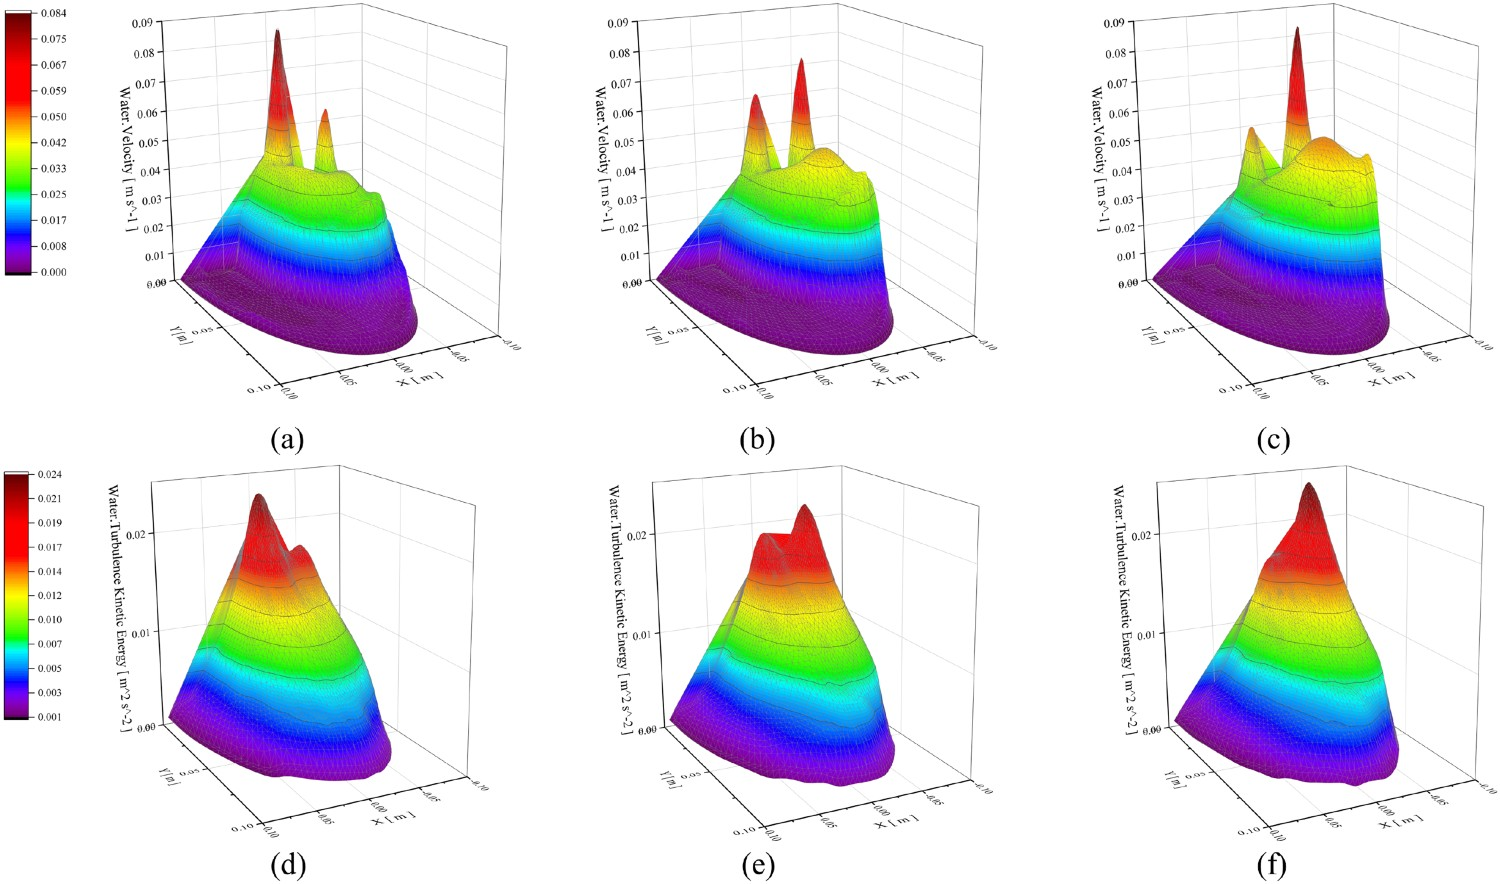
Bubble diameter
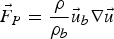
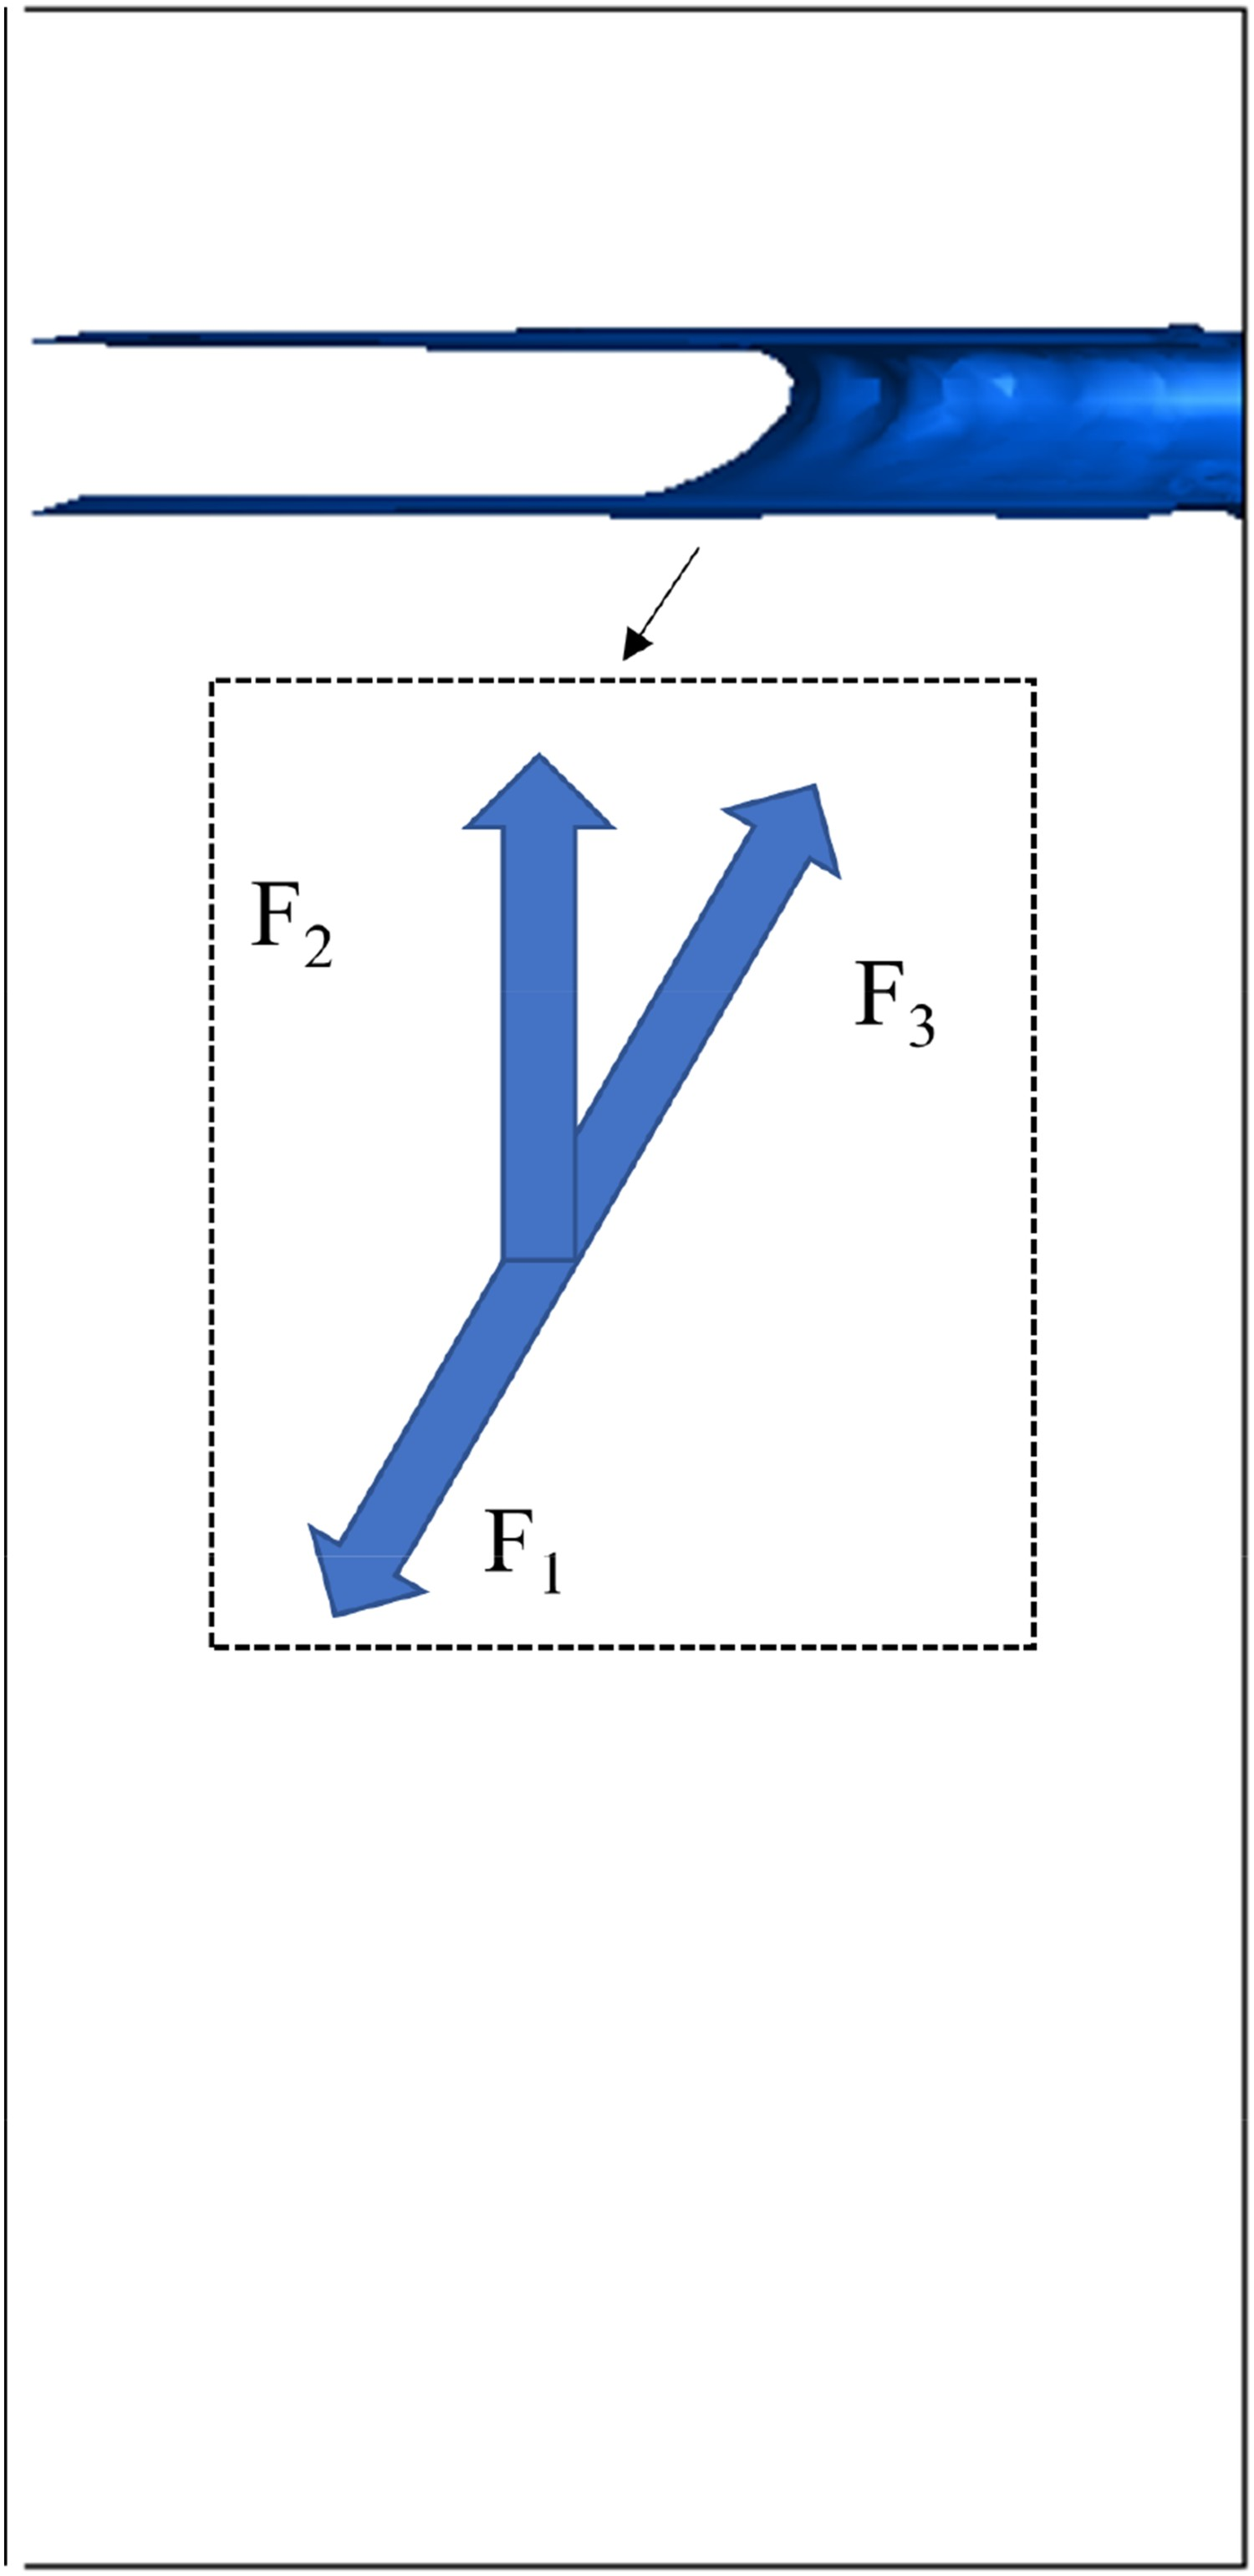
The effect of bubble diameter on liquid–liquid mass transport was explored by numerical simulations. The bubble diameters were taken as 0.010, 0.015, and 0.020 m, respectively. As shown in Figure 10(a), the final concentration of thymol decreased as the bubble diameter increased. It seems that the increase in bubble diameter has a limited effect on mass transfer, with each 0.005 m increase in diameter only decreasing the thymol concentration by two ppm. As shown in Figure 10(b), the vmtc slightly increases with increasing bubble diameter. However, different conclusions were obtained from the previous work. Richardson et al. [23] found an increase in mass transfer with increasing bubble diameter using a physical system of Hg and aqueous iron chloride. The same conclusion was obtained by Kim et al. [3] through a water/oil/thymol system. However, in the physical modelling work of Li et al. [5], the mass transfer rate decreased with increasing bubble diameter at three different gas flow rates. In his work, the water-mercury system was employed, and the bubble diameter was varied in the range of 1–6 mm. In contrast, Fruehan and Martonik [24] claimed that the bubble diameter has almost no effect on the mass transfer. It is evident that the differences in experimental parameters and experimental systems are the root cause of the opposite conclusions. Our work agrees with most of the previous work, which shows that the increase in mass transfer rate with increasing bubble diameter seems to be more accepted. The mechanism might be explained by the force model for the oil layer at the slag eye region proposed by Franz Oeters et al. [33]. As indicated in Figure 11, F1
is the inertial force of the liquid, F2
is the buoyancy force, and F3
is the surface force. The bubble breaks when it rises to the oil–water interface, and the inertial force F1
of the liquid increases with the bubble’s diameter, causing a more violent deformation and fluctuation of the oil–water interface, which increases the contact area of the two phases and thus promotes mass transfer. Effect of bubble diameter on mass transfer: (a) The variation of thymol concentration with time; (b) The variation of vmtc with bubble diameter. The iso-surface of oil with volume fraction of 0.1 (gas flow rate: 2.85 NL min−1; bubble diameter: 0.015 m).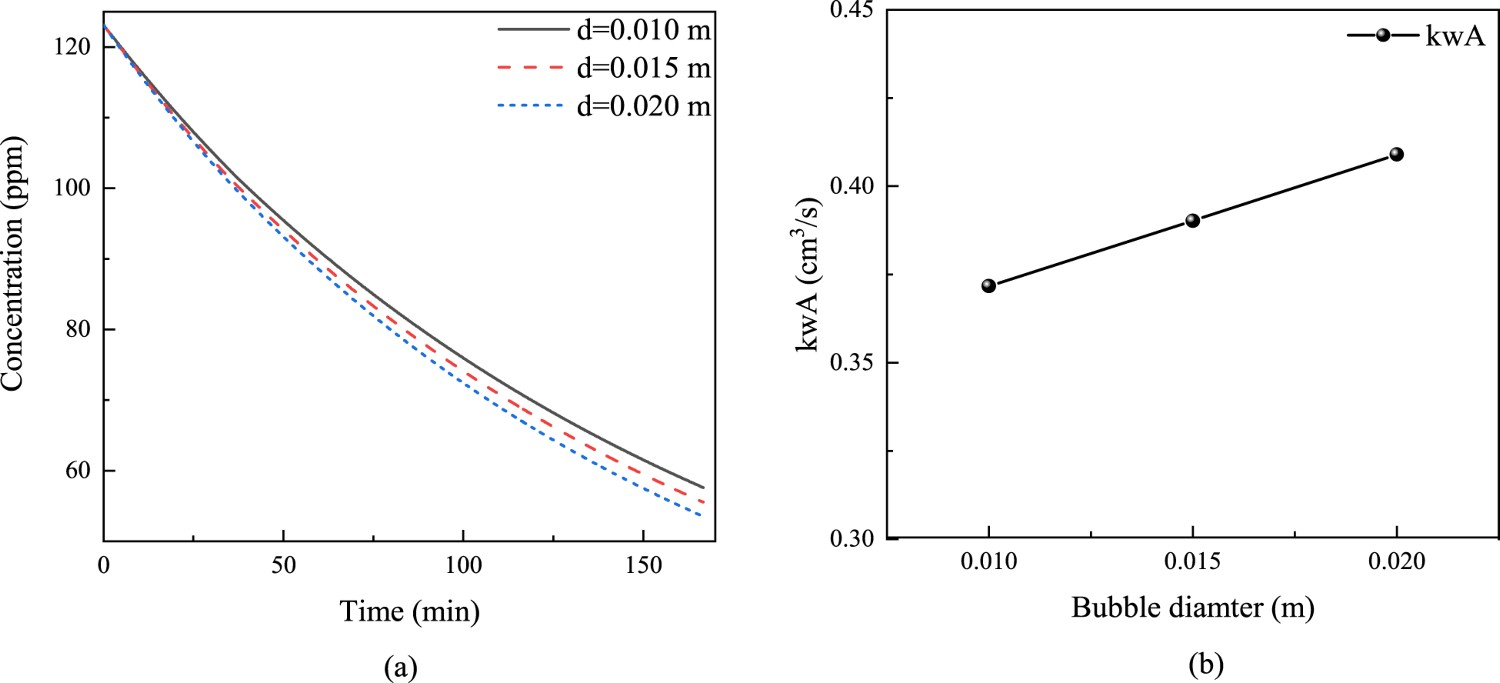
Conclusion
A three-dimensional numerical model consistent with physical simulations was developed to investigate the mass transfer behaviour of thymol between oil and water. The effect of nozzle position on mass transfer was explained in detail under single nozzle injection. The central-eccentric parallel injection pattern was investigated by varying the nozzle position, the number of eccentric nozzles, and the gas flow distribution. In addition, the effect of bubble diameter on the mass transfer rate was studied. The conclusions are as follows: The E-L and E-E methods were employed to calculate the flow field, and the E-E method shows better estimation by comparing with the experimental data. The small eddy model with a constant of 0.025 was suitable for mass transfer calculations. The mass transfer behaviour of the single nozzle injection was calculated. As the nozzle position was shifted from the centre to the sidewall, the effect of the plume on the oil layer was diminished, and therefore the liquid–liquid mass transfer rate decreased. The central-eccentric parallel injection pattern was investigated. A slight decrease in mass transfer rate was observed when the eccentric nozzle was moved from 0.5R to 0.8R. The mass transfer rate decreased further when the air was injected from three nozzles contemporaneously. The differential flow bottom stirring scheme was studied. The mass transfer rate increases with the increasing central gas flow rate, keeping the total gas flow rate constant. The multi-nozzle injection did not show superior performance compared with the single-nozzle injection. The single-nozzle central injection was still considered the best bottom stirring scheme for mass transfer when the total gas flow rate is constant. There was a minor influence of bubble diameter on the liquid–liquid mass transfer. The mass transfer rate of thymol was slightly accelerated with bubble diameter.
Finally, it should be noted that the water/oil/thymol system was employed in this work to demonstrate the validity of the model by comparison with experimental data. This work has a positive contribution to comprehending the liquid–liquid mass transfer mechanism. However, it is still doubtful whether it can represent the mass transfer behaviour of sulphur in an industrial ladle due to the more complex physicochemical phenomena in the ladle as well as the difference in properties between the water/oil/thymol and steel/slag/sulphur systems. The combination of industrial experiments and numerical simulations can be used in future work to explore the mass transfer characteristics of sulphur further.
Footnotes
Disclosure statement
No potential conflict of interest was reported by the author(s).