
Abstract
Controlled rolling and controlled cooling processes achieve high-strength alloys due to their combined effects on the grain refinement, dispersion, and phase transformations. This paper studies the dissolution of V in austenite by normalizing treatments. The samples were then annealed to form uniform, fine, and dispersed V-based precipitates which in turn facilitated subsequent phase transitions in the steel. The results showed that V fully dissolved into austenite when the steel was treated. Besides, when the steel was annealed, V precipitated in the form of V(C, N), and the V(C, N) precipitates promoted the formation of ferrite. At the same time, fine pearlite phases also formed, and the V(C, N) precipitates were distributed among the pearlite lamellae. The uniformly dispersed V(C, N) precipitates further regulated the microphase organization, refined the grains, and acted as the microalloying element, making the steel more uniform, and improving the mechanical properties of the steel.
Introduction
Thermo-mechanical control processes (TMCP), including controlled rolling and controlled cooling, are important and effective rolling technologies used to control the organization of components and morphology in steel alloys to obtain excellent properties in the final materials such as high strength and high toughness [1]. Through controlled rolling and controlled cooling, the morphology of the austenite phase formed at high temperatures is regulated, and therefore the path and transformation time of austenite to ferrite and pearlite at lower temperatures are controlled, resulting in control over the grain growth and therefore higher strength levels than conventional normalized steels [2–4]. The purpose of the controlled rolling process is to suppress the recrystallization of austenite through deformation, increase the deformation energy stored in the austenite, and improve the hardened austenite content [5–8], while the controlled cooling process controls the phase transformation of austenite in the hardened state, and the transformed structure produces corresponding changes in the steel properties after cooling [9]. In the past, there has been a continued push to produce high-strength structural steels at lower expenditure, and microalloyed steels have moved in several directions [10,11]. For low-carbon and low-alloy steels, the addition of Cr, Ti, Nb, V, and other alloying elements form precipitates at the grain boundaries and phase interfaces, and can further refine these grains are needed in order to obtain a final morphology that provides better performance [12–17].
The chromium carbide particles formed by Cr in steel are relatively small and evenly distributed. The addition of Cr makes steel stronger and harder, and Cr can also improve the corrosion resistance of the steel [18,19]. Generally speaking, the role of strong carbide-forming elements, Ti, Nb, and V, is to refine the grains and strengthen the precipitation of phases [20,21]. Owing to its high melting temperature, Ti refines grains by forming carbonitrides and preventing grain growth at high temperatures [22,23]. Nb can improve the strength of low-carbon steels, generate highly dispersed and strong carbides, refine grains, improve hardenability, and prevent intergranular corrosion [24,25]. V has a relatively strong grain refinement effect, which can improve the strength and toughness of steel, as well as improve the thermal stability of the steel. Like Nb, V can combine with C and N to form precipitated V(C, N) phases, which when dispersed, have a strengthening effect and improve the performance of steel [26–29]. In previous reports, the nucleation sequence of vanadium carbonitride homogeneous precipitates, the composition of vanadium precipitates, and the nucleation mechanism of interphase precipitation have been extensively studied [30]. Białobrzeska et al. [31] found that after austenitization at 850°C, the smallest austenite grains were seen in low-alloy steels with 0.275% V. Zhu et al. [32] added V to medium manganese steel, which significantly refined the original austenite grains and coarsened the massive austenite phase at 670°C. Anish et al. [33] reported that increasing the C and N content had an obvious precipitation strengthening effect on V microalloyed steel. At the optimal C to N ratio, the maximum precipitation strengthening effect was seen between 600°C and 650°C. Yang et al. [34] found that the precipitation mechanism in low-carbon steel was interphase precipitation at 700°C and random precipitation at 660 and 620°C. Further research was needed on both the dissolution temperature and subsequent precipitation of V and its carbides in low-carbon V microalloyed steels.
In this paper, low-carbon V microalloyed steel was studied, and the optimal process parameters to dissolve V into austenite were studied by using a normalizing treatment. The optimal time and temperature for a subsequent low-temperature annealing treatment were explored to ensure the formation of well dispersed, uniform, and fine V-based precipitates. The location of these precipitates in the samples, precipitation law, and precipitation strengthening effect on the steel were explored [35]. Through the heat treatment process, the grains were refined and their organization was optimized, which improved the mechanical properties of the steel. These results provides guidance for the controlled rolling and controlled cooling processing of steel.
Experimental
Materials
Chemical composition of test steel (wt-%).
Experimental method
The phase diagram of the studied steel based on its chemical composition was calculated using JMatPro, and the transformation temperature of each structure was determined by simulations. The dissolution curve of V in austenite was obtained by simulation calculations, and the optimal dissolution temperature was determined. Samples with dimensions of 3 × 2 × 2 mm3 were prepared using a DK77 EDM CNC wire cutting machine. After ultrasonic cleaning, the samples were sealed in an alumina crucible and measured using a NETZSCH STA 449F3 TG-DSC comprehensive thermal analyzer. DSC curves were obtained on heating to 1200°C at a heating rate of 5°C/min, followed by cooling to 300°C at a rate of 10°C/min.
To determine the optimal heat treatment process, test steel samples with a length of 10 mm and a diameter of 20 mm were prepared. The samples were placed in a DSS-80C muffle furnace and heated to 960, 1000, and 1030°C at a heating rate of 10°C/min for 30 min and then air-cooled to room temperature. The relationship between the temperature at which V dissolved into austenite and the process parameters was analyzed. The samples kept at 1000°C for 30 min and then air-cooled to room temperature were selected for subsequent experiments, and these samples were heated to 500, 530, and 560°C at a heating rate of 10°C/min and held at the desired temperature for 30, 60, and 120 min before being air-cooled to room temperature. A schematic diagram of the heat treatment processes is shown in Figure 1. After heat treatment, the samples were inlaid, ground and polished, and etched with a solution containing 4% by volume nitric acid in alcohol. The microstructures of the samples were observed and analyzed using a metallographic microscope (OM) and scanning electron microscope (SEM). Schematic diagram of test steel heat treatment process.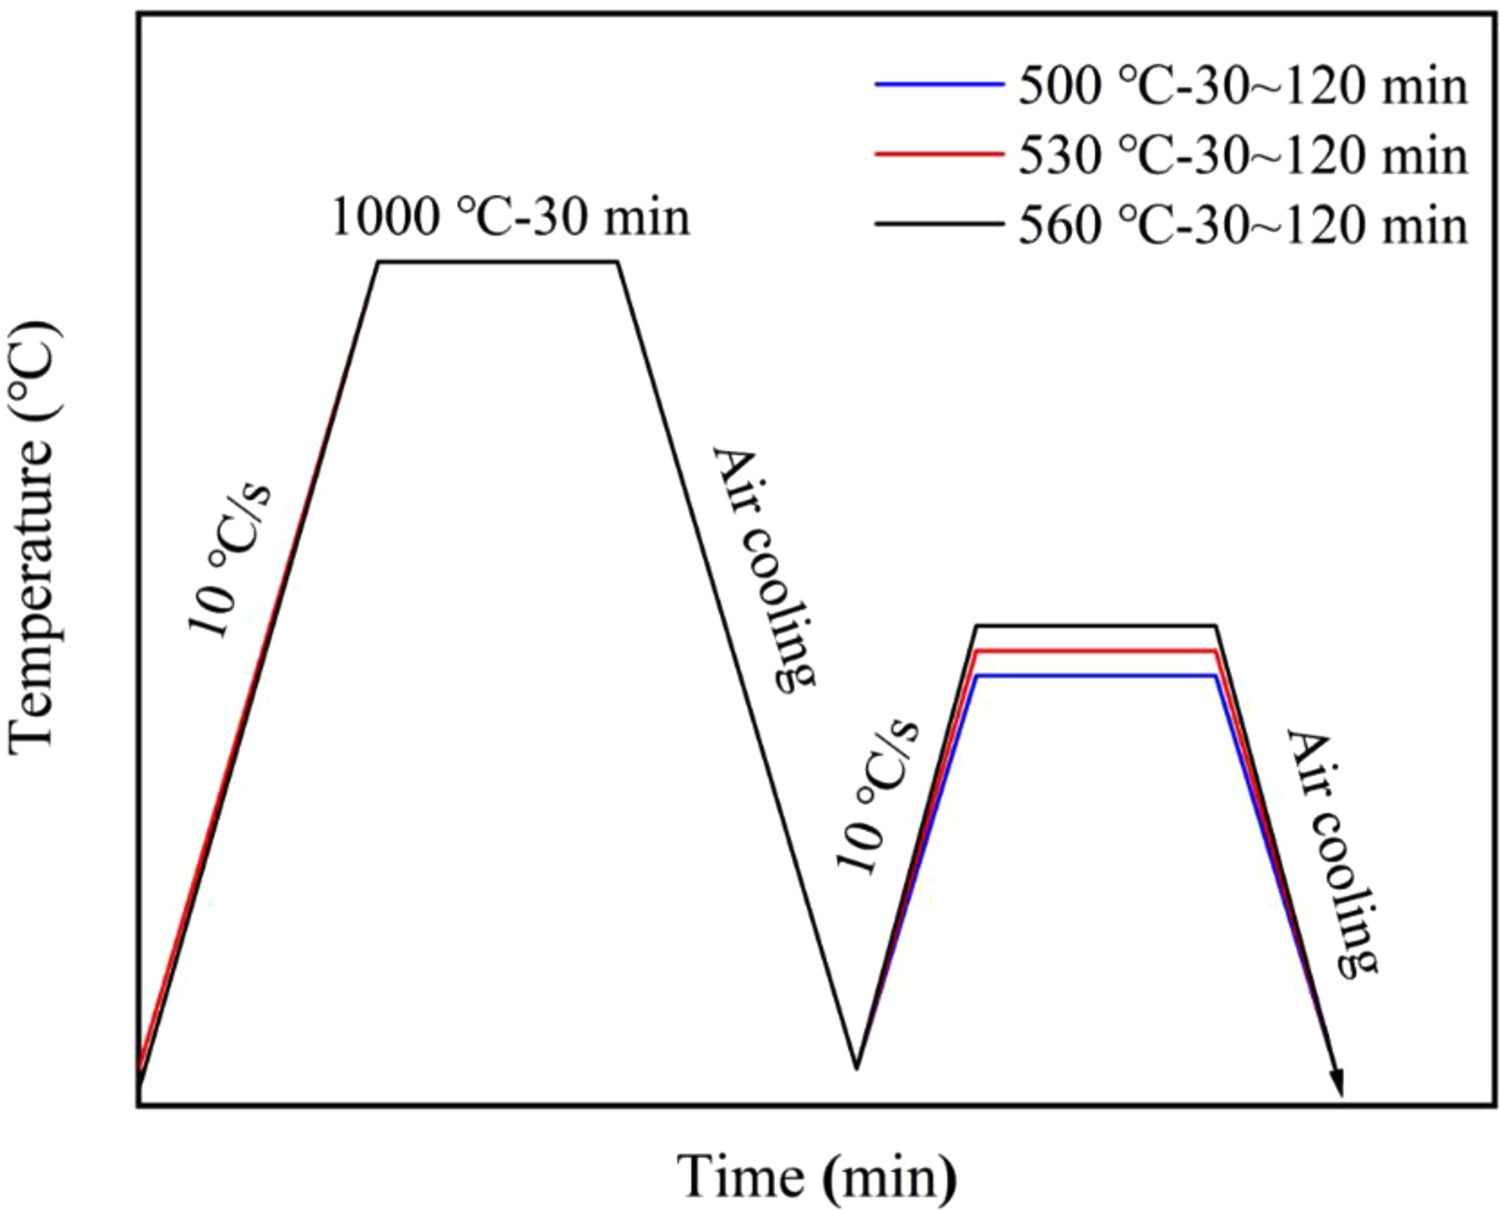
To further explore the dispersion and regularity of the precipitated phases, the steel samples were imaged with transmission electron microscopy (TEM). The TEM samples were mechanically thinned to 40 μm and then ion thinned before they were imaged using an FEI Talos F200X transmission electron microscope. Electron backscattered diffraction (EBSD) samples were prepared by grinding, mechanically polishing, and then electrolytically polishing the different steel samples. The electrolytic polishing was carried out in a mixture of 10% perchloric acid and 90% absolute ethanol using a voltage range of 20–40 V. A JEOL 6500 FEG Field Emission-Scanning Electron Microscope (SEM) was used to collect the EBSD patterns. A step size of 0.1 μm was used for the EBSD analysis to observe the grain size and orientation, as the grains were typically a few microns in width [36]. The microhardness values of the samples prepared with different heat treatment conditions were determined using a microhardness tester with a loading load of 100 g and a loading time of 15 s, and the presented value is the average value measured at 6 points on each sample, and the measurement error was within ±1.8%. The size of the samples prepared for tensile tests is shown in Figure 2. The mechanical properties of the test steel after heat treatment were measured using a WDW-300A universal tensile testing instrument at a strain rate of 10−3 s−1. Tensile sample geometry with test steel dimensions in mm.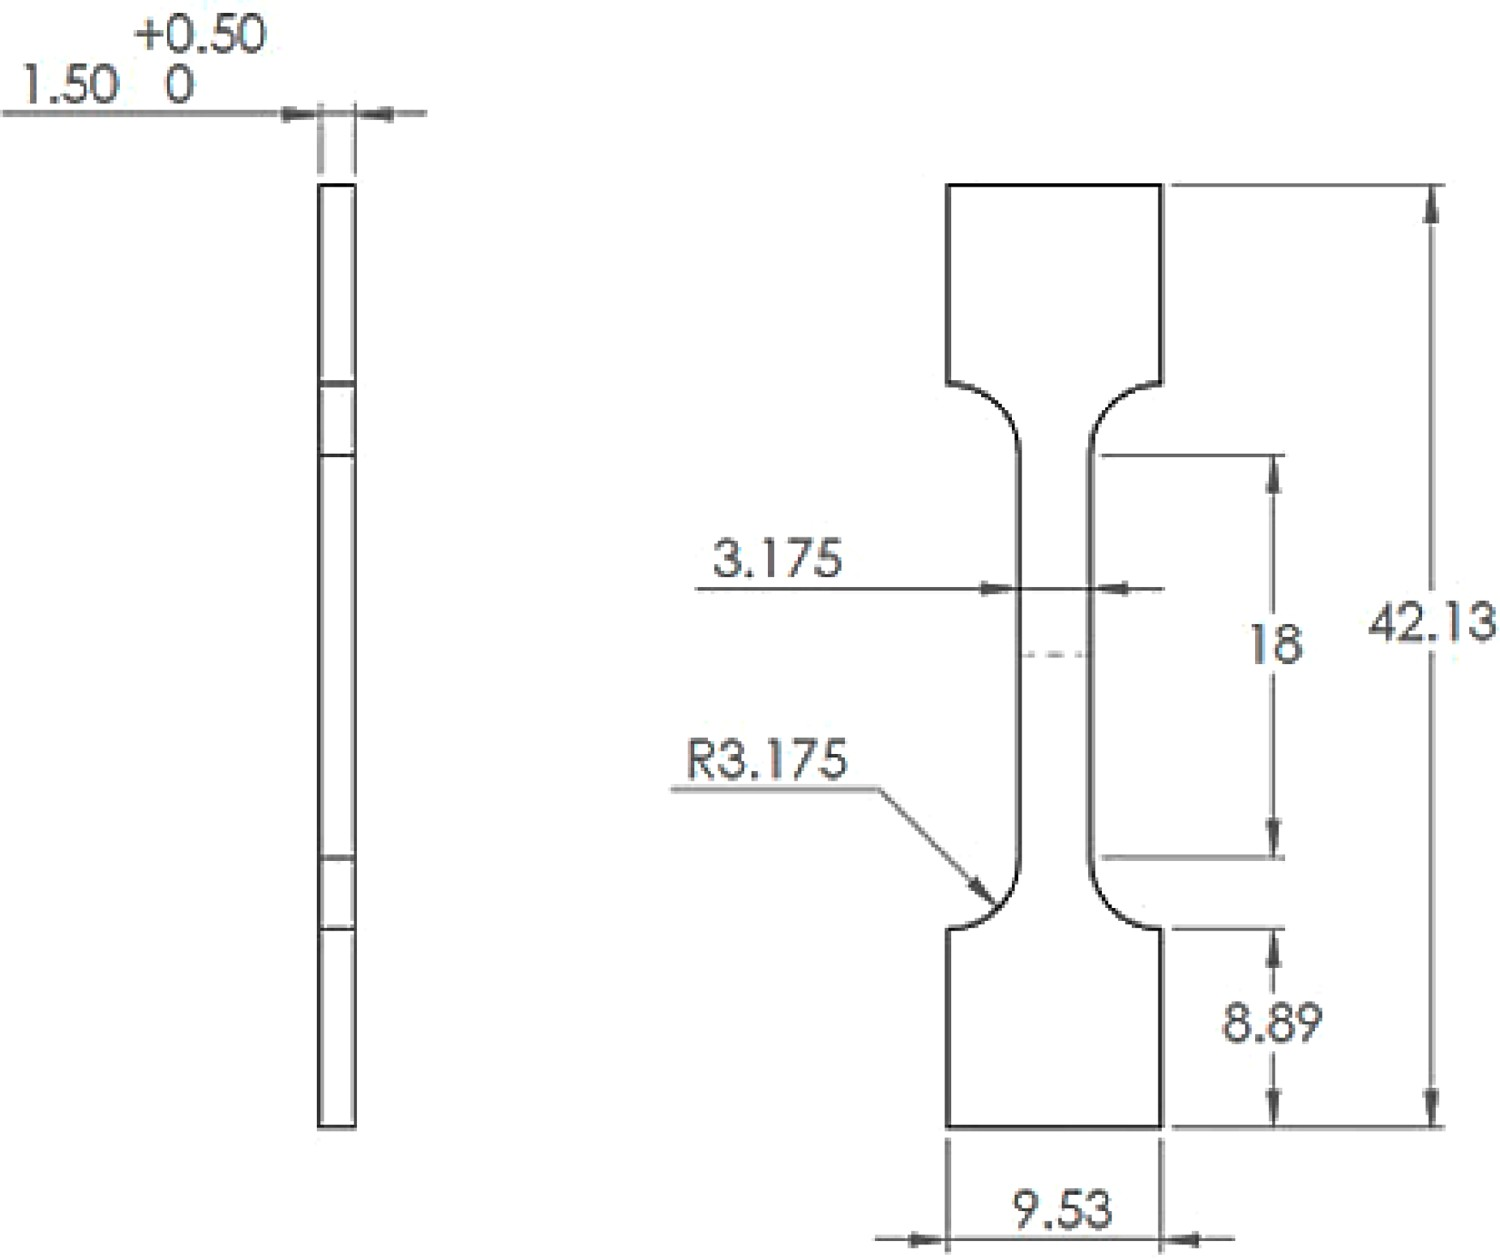
Results and discussion
Simulations, calculations, and DSC analysis of the test steel
The phase diagram of the test steel was calculated using JMatPro based on its chemical composition and is shown in Figure 3(a). For the given chemical composition, the test steel transformed from liquid phase to austenite at 1410∼1488°C. As the temperature decreased to 690∼810°C, austenite transformed to ferrite, and cementite formed at a temperature of 689∼698°C. It can be seen from the enlarged figure that the precipitated V(C, N) phase content reached 0.19 wt-% in the test steel, and the content of the precipitated phase gradually decreased with an increase in temperature above 690°C. In addition, the calculated solubility of V in each phase in Figure 3(b) suggested that V completely dissolved into austenite at 1174∼1190°C. The calculated mass fraction of dissolved V was 0.15 wt-% and was very similar to the overall V content in the test steel. It can be seen from Figure 3(c) that as the temperature increased, the C and N contents in the precipitated V(C, N) phase were almost unchanged while the V content began to increase at 450°C and increased even more significantly with a temperature above 730°C. With the increase in temperature, the Cr content decreased with the corresponding increase in V content. Figure 3(d) shows a schematic diagram of the elemental content in VN as a function of temperature. From the figure, it was found that the V content in VN changed slightly around 720°C and was reduced by about 3.5% compared with other temperatures. Computation of equilibrium phases and composition in test steel using ‘JMatPro’: (a) Distribution of various phases as a function of temperature; (b) Dissolution curve of V in austenite; (c) Element content in V(C, N) and (d) Element content in VN.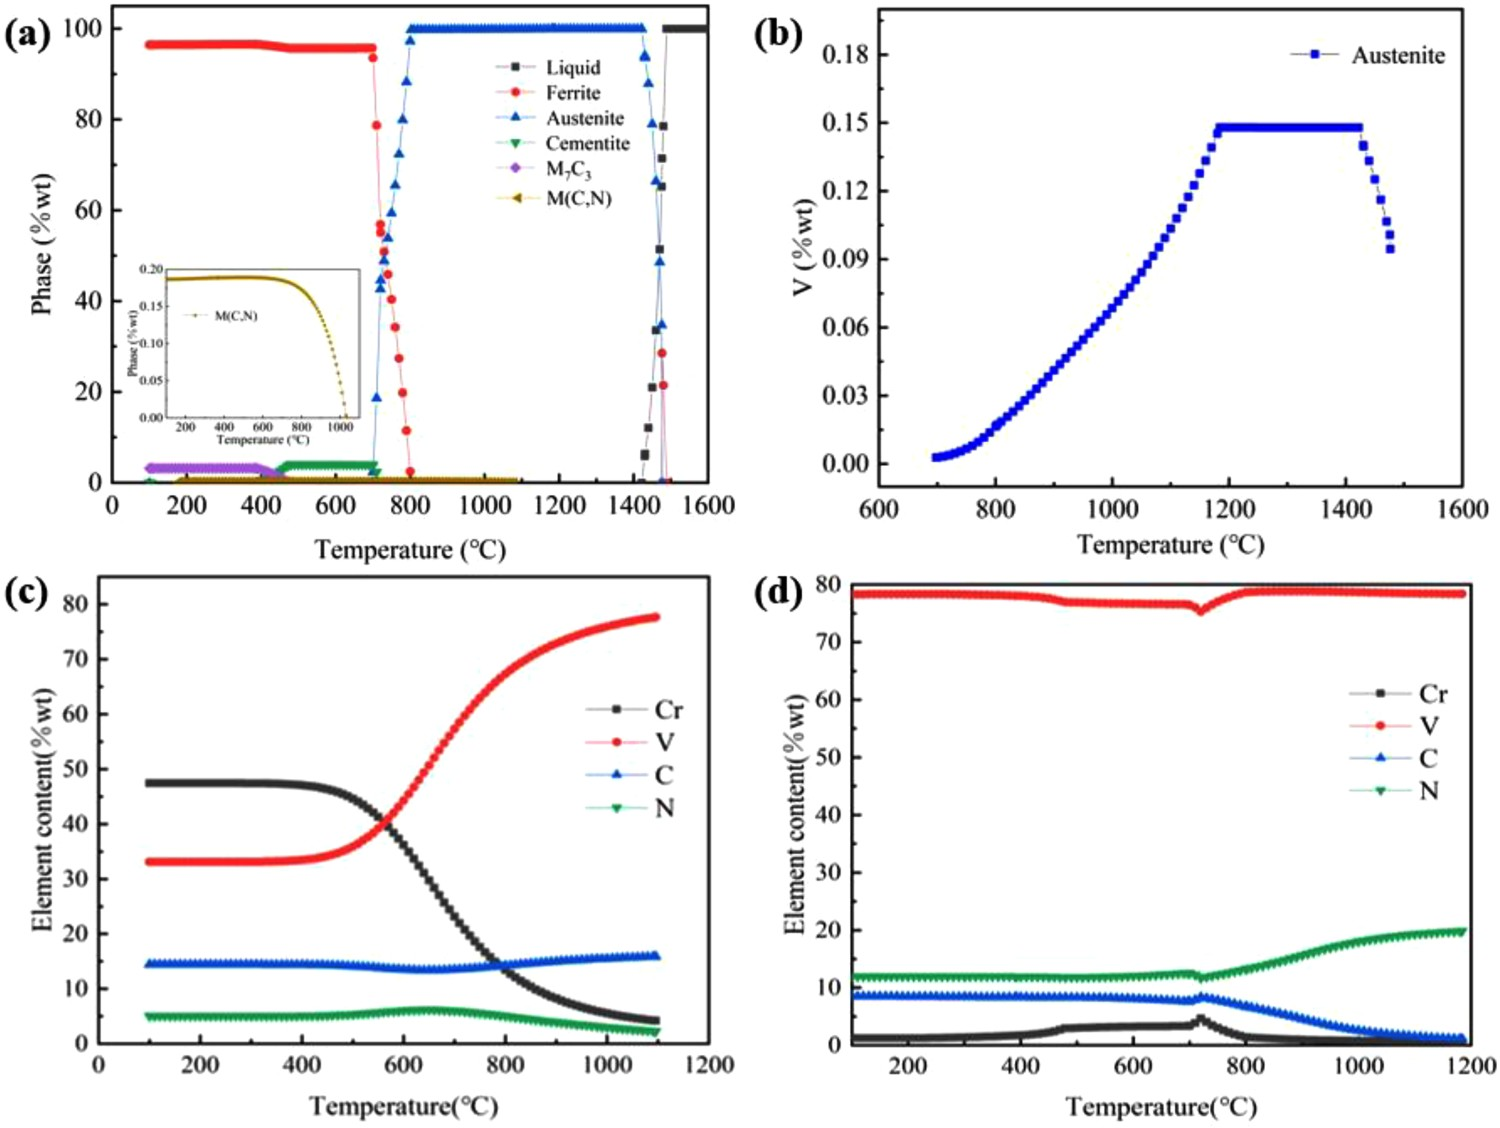
DSC measurements were performed to verify the optimum dissolution temperature at which all V dissolved into the test steel as well as determine the optimum precipitation temperature at which fine, even dispersed precipitates formed. From the DSC curves in Figure 4, it can be seen that there was a concave peak near 749°C upon heating, indicating that heat was absorbed between 728°C and 767°C. Through further analysis, it is known that the transformation from pearlite to austenite primarily occurs in this temperature range [37–39]. With a further increase in temperature, there was a very small endothermic peak near 1115°C corresponding to the dissolution of V. The relatively small peak in heat flow at this endothermic peak was because the V content in the test steel was relatively low, so less heat was absorbed when V fully dissolved [40]. During the cooling process, there was a convex, exothermic peak near 733°C. The heat flow at this peak was relatively low. Based on reported dissolution temperatures for V and the precipitation temperature of V(C, N) [41], it can be confirmed that this exotherm peak was due to precipitation of the V(C, N) phase. The temperature range measured here was the same as the precipitation temperature of the V(C, N) in studies by Pan et al [42]. However, the optimum precipitation temperature for the V(C, N) phase may play a role in the dispersion of the precipitates and strengthening of the steel and needs to be determined experimentally. As the temperature continued to decrease, there was a stronger exothermic peak near 619 °C that corresponded to the phase transformation also seen during the heating process. The phase diagram confirmed that the transformation from austenite to pearlite occurred in this temperature range. The phase inversion variable at this temperature was the largest [43]. The normalizing temperature and annealing precipitation temperature were further determined based on the simulated phase diagram and measured DSC curves, and the optimum heat treatment process was formulated. DSC chart of the test steel.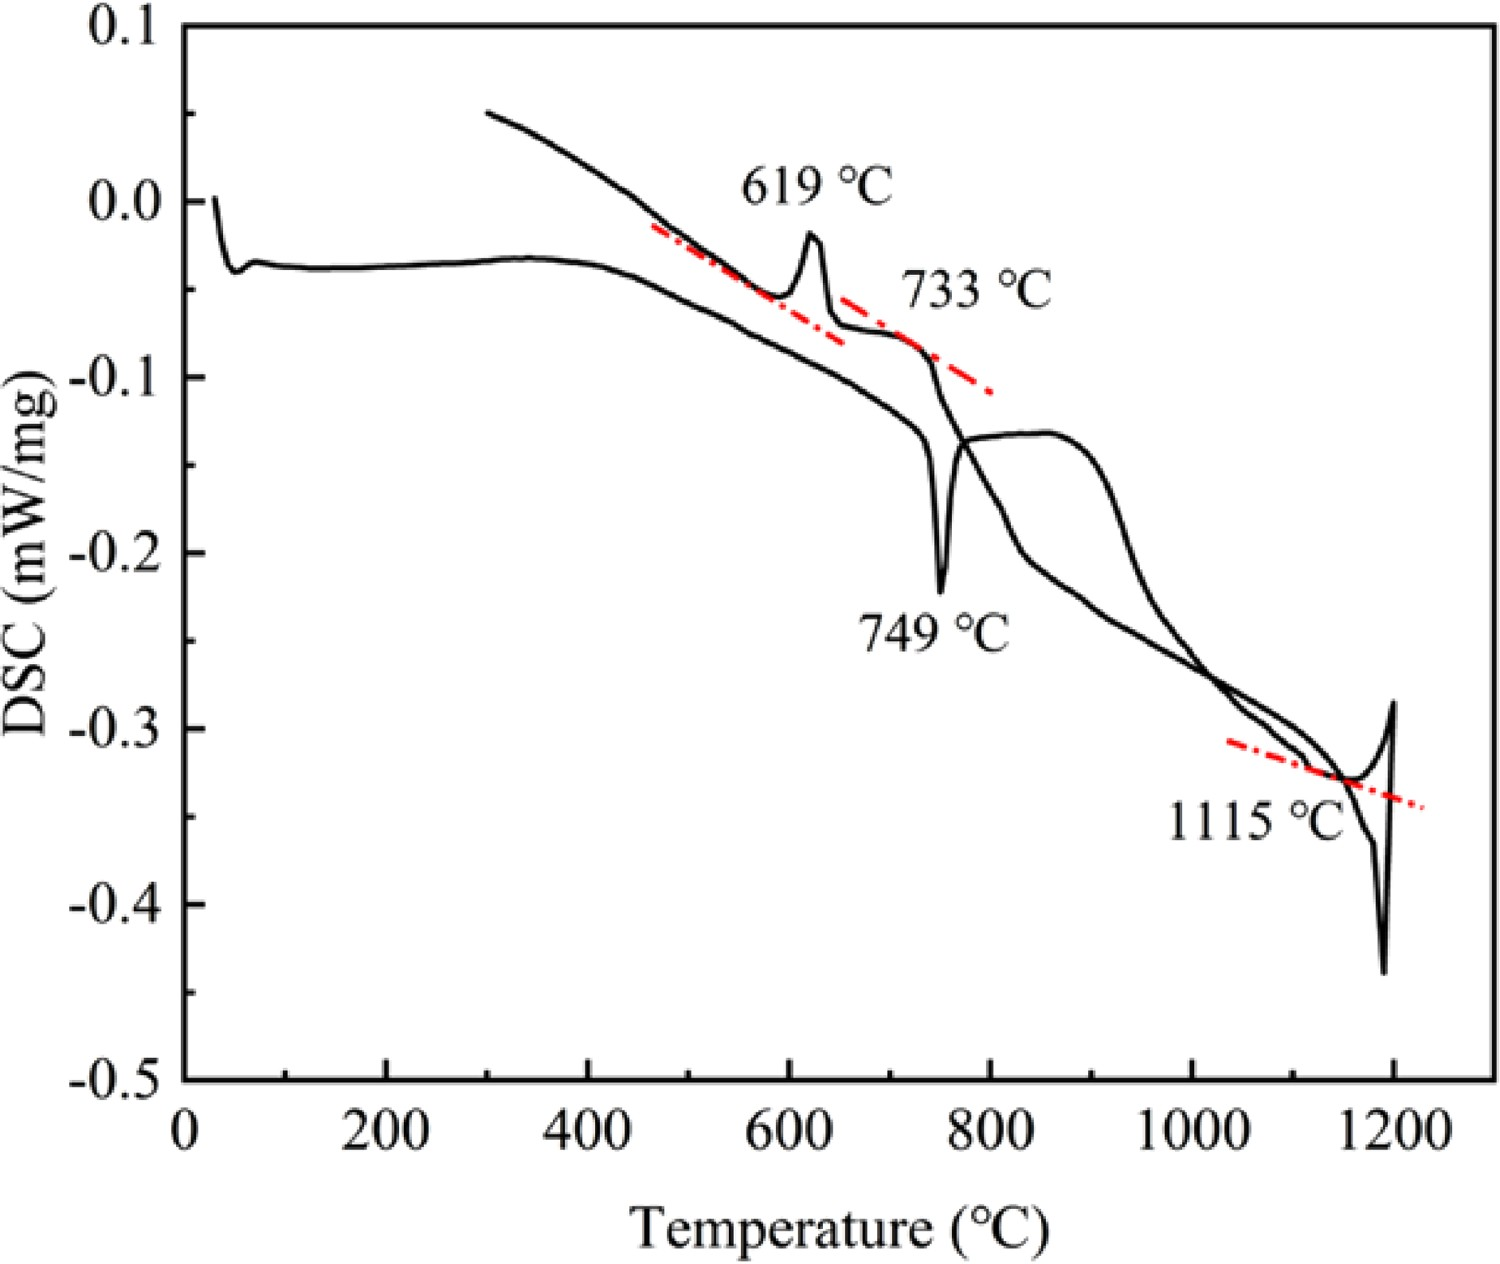
Microstructure analysis of test steel
The main purpose of normalizing was to allow the V and its carbides in the steel to be completely dissolved into the steel, and the subsequent annealing treatment to precipitate the precipitation in the form of V(C, N). It can be seen from Figure 5 that the grains in the normalized test steels were relatively small and uniform in structure, but the microscopic morphologies were slightly different in steels prepared with different normalizing temperatures. The test steel was mainly composed of ferrite, pearlite and a small amount of bainite microstructures. As shown in Figure 5(a,b), as the normalizing temperature was increased, V was largely dissolved into the austenite, the structure of the processed test steel was more uniform, and the grains were finer. The ratio of the ferrite and pearlite microstructures reached the optimum value. At a normalizing temperature of 1030°C, the grain sizes increased, as shown in Figure 5(c), and the microstructure was more inhomogeneous than seen at lower temperatures such as in Figure 5(b). Higher magnification images of the different microstructures are also shown in Figure 5(d–f). The microstructure in the sample treated at 1000°C for 30 min was the most uniform, and the grains were relatively fine, indicating that this sample had the best microstructure. SEM images of the test steel after normalizing for 30 min at different temperatures: (a, d) 960°C; (b, e) 1000°C and (c, f) 1030°C.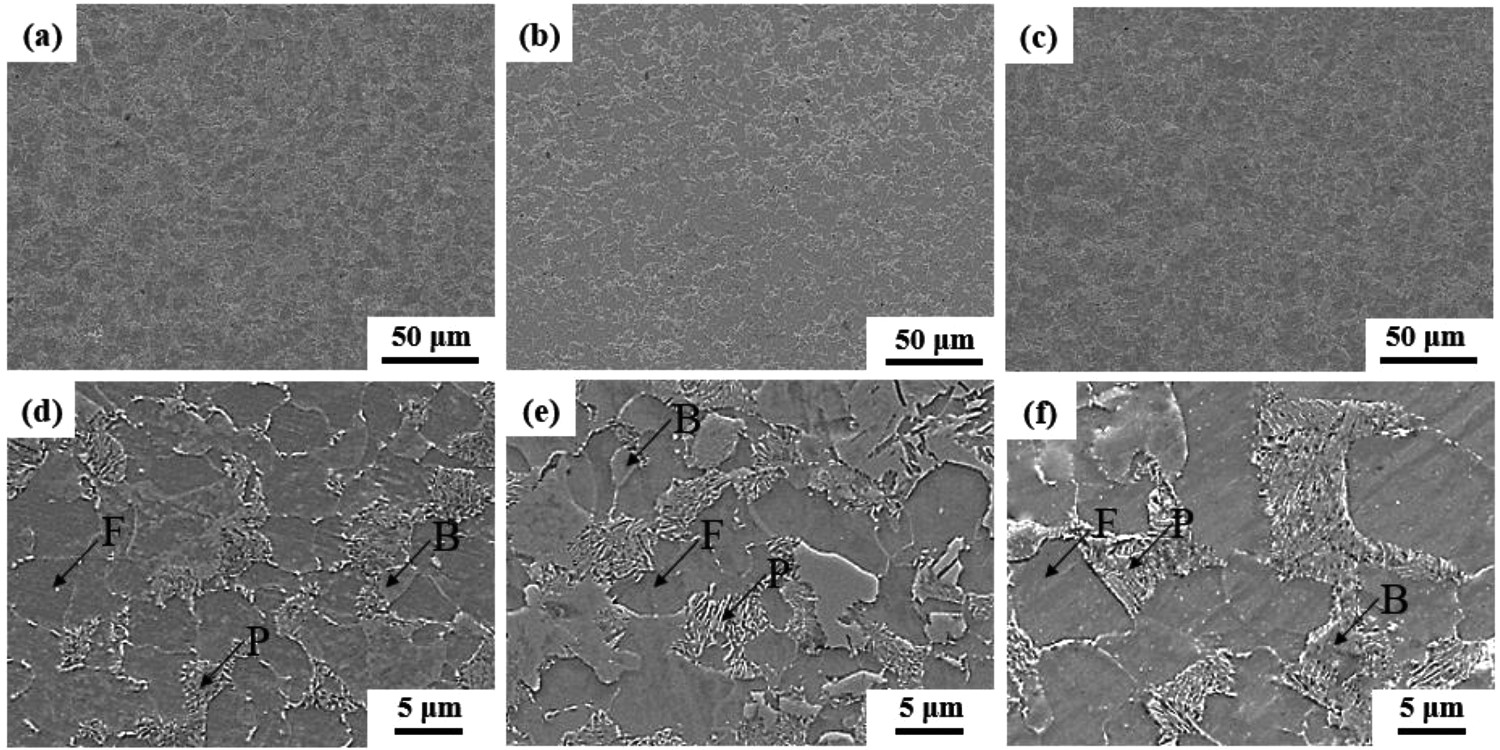
To further determine the optimal precipitation temperature, the sample normalized at 1000°C with the best microstructure was selected for additional annealing treatments. As can be seen from Figure 6, compared with the structure of Figure 5(b), the grains were more refined and the microstructures were more uniform after annealing. On one hand, annealing makes the chemical composition and structure of the steel more uniform, balances the structure, refines the grains, and eliminates internal stresses [44]. On the other hand, V tends to segregate and precipitate during annealing and thereby induces nucleation of ferrite. In addition, precipitation of V(C, N), as second phase of particles, is vital for refining the grain sizes and optimizing the microstructure [45]. From Figure 6(a–c), it can be seen that as the holding time increased from 30 to 60 min, the grains were more refined, and the structure was more uniform, and the pearlite content increased slightly. When the holding time was increased to 120 min, it can be seen that compared with Figure 6(b), the grain size of the sample becomes larger and the uniformity of the structure was worse. So, comparing the three holding times at the same temperature suggested that the matrix was more uniform after annealing for 60 min. In addition, the effects of the precipitation temperature were explored. At 500°C in Figure 6(b), there were larger grains, and the structure was not uniform. At 530°C in Figure 6(e), the microstructure significantly improved, the grains were finer, the structure was more uniform, and the F/P ratio was better. The grains continued to grow with a further increase in temperature to 560°C in Figure 6(h), the content of ferrite in the microstructure significantly increased, and large grains were present in the sample. By comparing the microstructure and grain of the samples after different annealing treatments, the uniformity of microstructure and grain is the best when the temperature is kept at 530°C for 60 min, so this was taken as the optimal precipitation temperature. SEM image of the test steel after annealing: (a, b, c) 500°C for 30, 60, 120 min; (d, e, f) 530°C for 30, 60, 120 min and (g, h, i) 560°C for 30, 60, 120 min.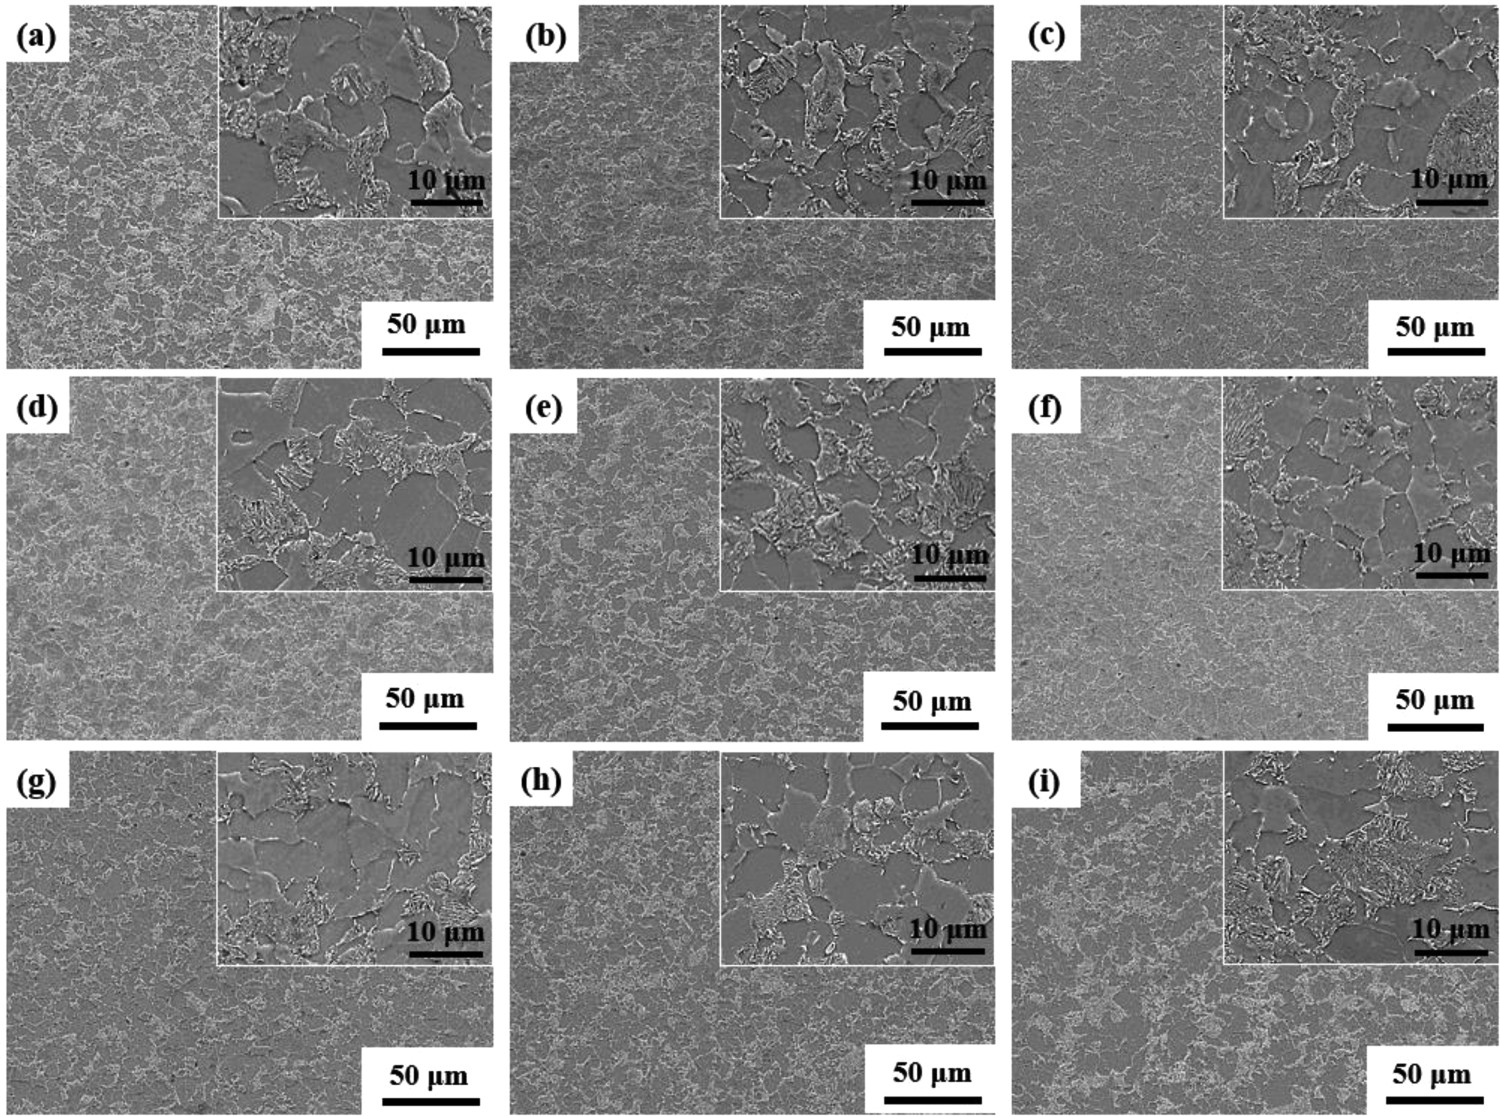
Analysis of the precipitated phase and grain orientation in the test steel
The optimal precipitation temperature and holding time were explored above, and the distribution, type and position of the precipitated phases in the steel samples prepared under these conditions were studied with TEM. It is indicated that the V(C,N) precipitates are smaller in size and circular or sub-circular in shape after precipitation. Figure 7(a) shows that the precipitates are relatively uniform and finely dispersed in the matrix. The size of the precipitates is about 10∼50 nm, which plays the role of dispersion precipitation strengthening [46–48]. It can be seen from Figure 7(b) that the precipitates were also distributed between the lamellae in the pearlite phase. Figure 7(c) also shows that the precipitates also formed at the grain boundaries, and from Figure 7(d), it was found that the size of the precipitates in the interlamellar spaces of pearlite was about 10 nanometres. In Figure 5(b), V dissolves in the austenite after normalizing, and then cools to the annealing temperature, and V(C,N) precipitates are formed in the steel. These precipitates cannot be observed in the scan in Figure 6, but it can be found by TEM that the precipitation phase is distributed at the lamellar spacing and phase interface of pearlite. The EDS energy spectrum in Figure 7(e) shows that precipitated phase was V(C, N). The V(C, N) precipitates were fcc in structure where the lattice sites and octahedral interstitial sites (O-sites) were occupied with V atoms, and C and N atoms, respectively. In addition, from Figure 7(f) based on calibration using SAED, the lattice parameter a = 4.011 ± 0.02 nm, it was further confirmed that the precipitated phase was V(C,N) [49–51]. TEM micromorphology analysis of test steel after annealing: (a, b, c, d) Morphology and location of V(C, N) precipitates; (e) EDS spectrum and (f) Electron diffraction pattern.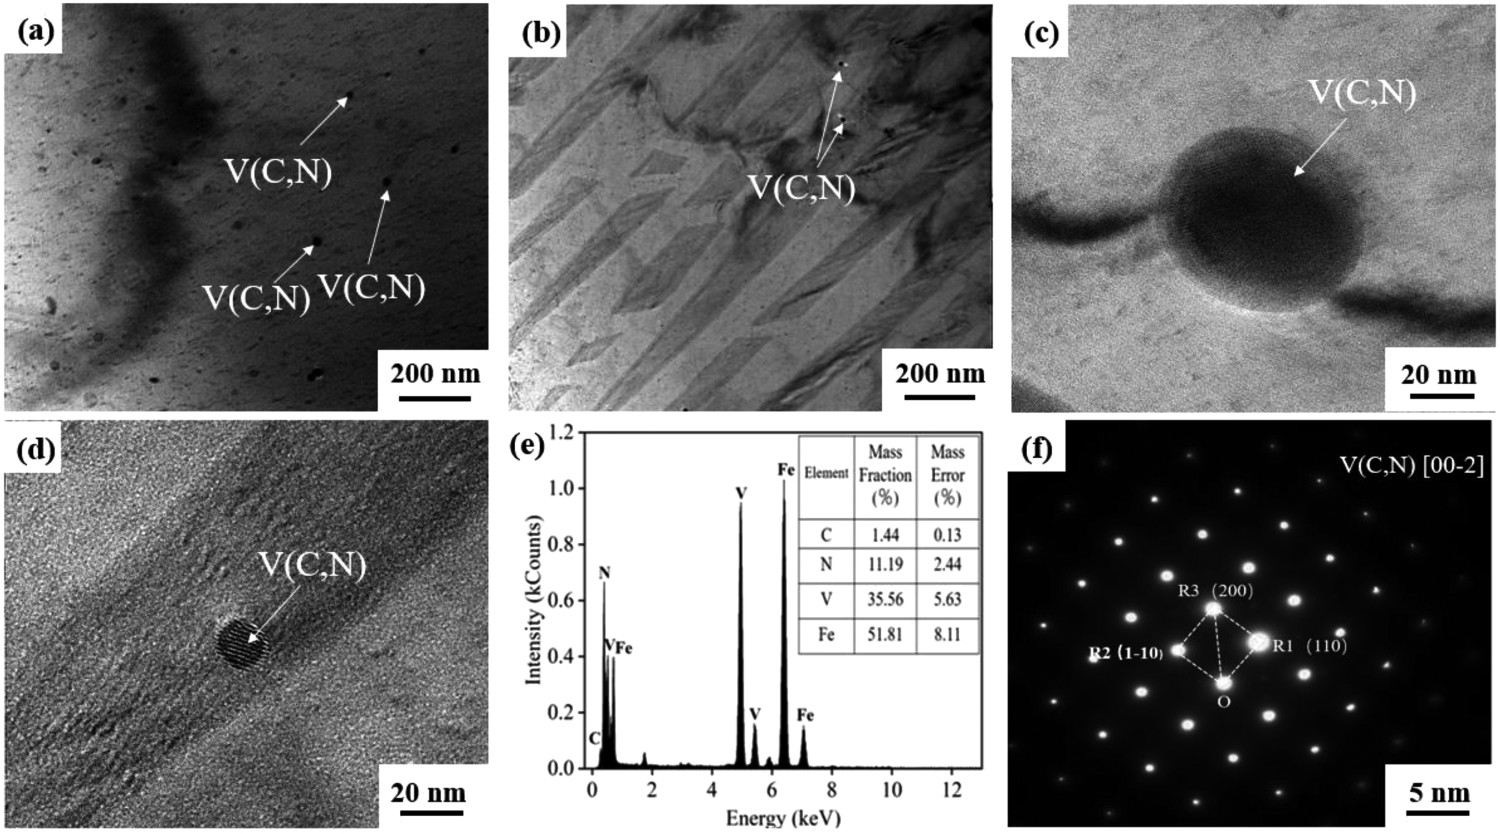
Figure 8(a) and (d) shows the orientation and size of the grains in the test steel. It can be seen from the figure that the grains in the heat-treated samples were finer, and the number of small grains was larger than that before treatment. The grain size distribution was shown in Figure 8(c,f), the abscissa was the grain size, and the ordinate Fx(x) represents the proportion of grains with grain size x. As can be seen from Figure 8(c), the average grain size in the sample before heat treatment was about 2.28 μm. After the normalizing treatment at 1000°C for 30 min and then the annealing treatment at 530°C for 60 min, the grain size in the sample was 1.96 μm, the grains were refined, and the grains structures were relatively uniform. In addition, it can be seen from Figure 8(b,e) that the number of high-angle grain boundaries was much higher than the number of small-angle grain boundaries. The goal of grain boundary engineering (GBE) was to increase the ‘special boundaries’ that own a large number of coincident lattice sites along the grain boundary. Based on these coincident site lattices (CSL) and the reciprocal density of coinciding sites (designated as Σ value), grain boundaries can be classified as Σ CSL boundaries [52]. After heat treatment, the grains were finer, the number of high-angle grain boundaries increased, the amount of boundaries such as Σ CSL increased from 6.15% to 7.225%, and the number of small-angle grain boundaries also increased slightly. EBSD analysis results of test steel: (a, b, c) IPF diagram, GB diagram and grain size distribution diagram without heat treatment and (b, d, f) IPF diagram, GB diagram and grain size distribution diagram after normalizing at 1000°C for 30 min and annealing at 530°C for 60 min.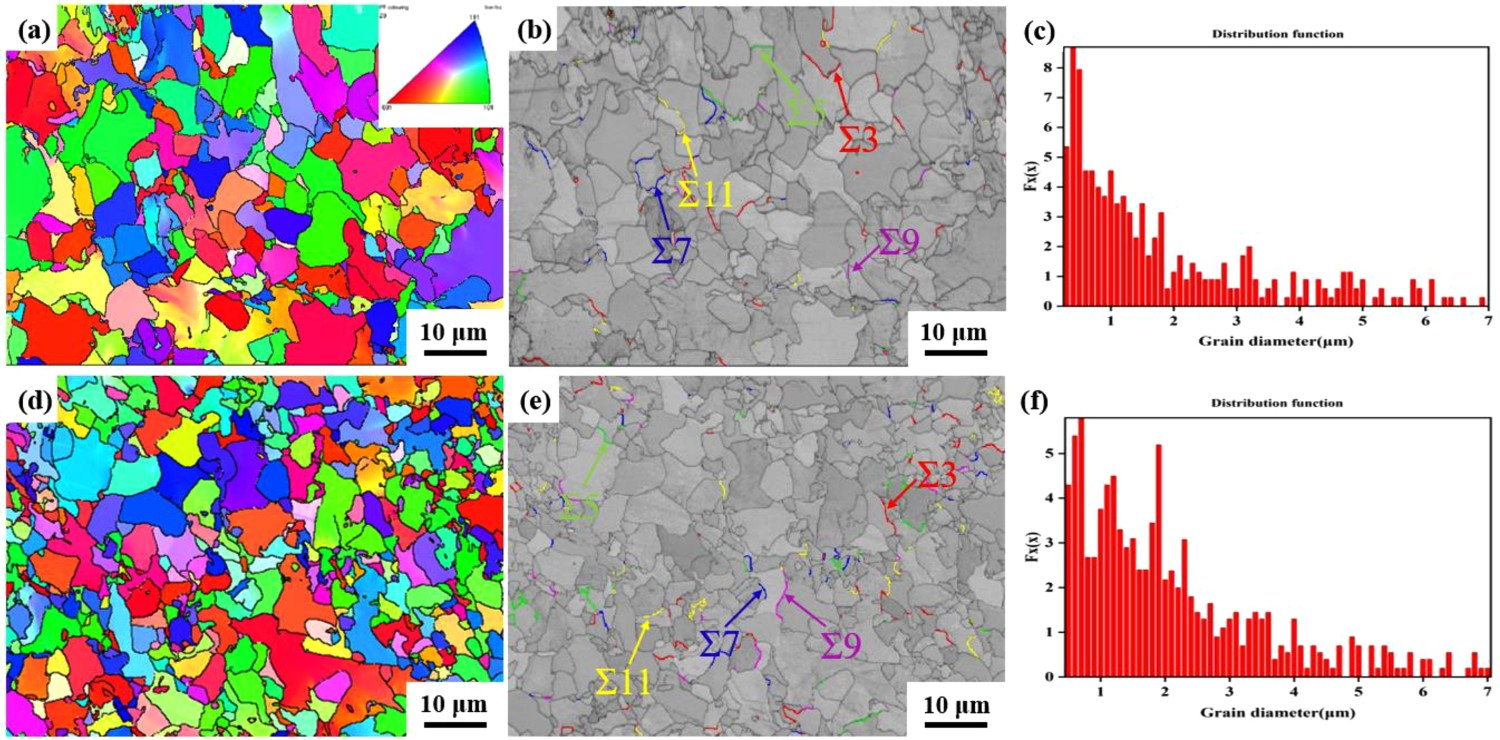
Analysis of the mechanical properties of the test steel
To further explore the dispersion and precipitation strengthening effect of V(C, N) precipitates on the test steel, the mechanical properties were measured. Figure 9 shows the microhardness values measured of the annealed test steels. It can be seen from Figure 9 that as the temperature increased, the microhardness value of the sample increased. The microhardness value of the sample annealed at 530°C was higher than that of the other samples treated in the same state, further highlighting that the precipitation strengthens the effect of the precipitation phase were the best at this treatment temperature. In addition, comparing the samples treated at the same temperature for different holding times showed that increasing the holding time significantly improved the microhardness, indicating that a longer precipitation time can improve the properties of the treated steel. At the same time, as the holding time further increased, the microhardness of the treated samples decreased slightly at 120 min because the grains continued to grow in size with the extension of the holding time. It can be seen that after the test steel was annealed, the microhardness value of the sample increased at the macroscopic level due to the precipitation strengthening effect of the precipitated V(C, N) phase. Therefore, among the three holding times, the effect of holding time for 60 min had the best impact on the steel properties. Microhardness diagram of test steel after annealing.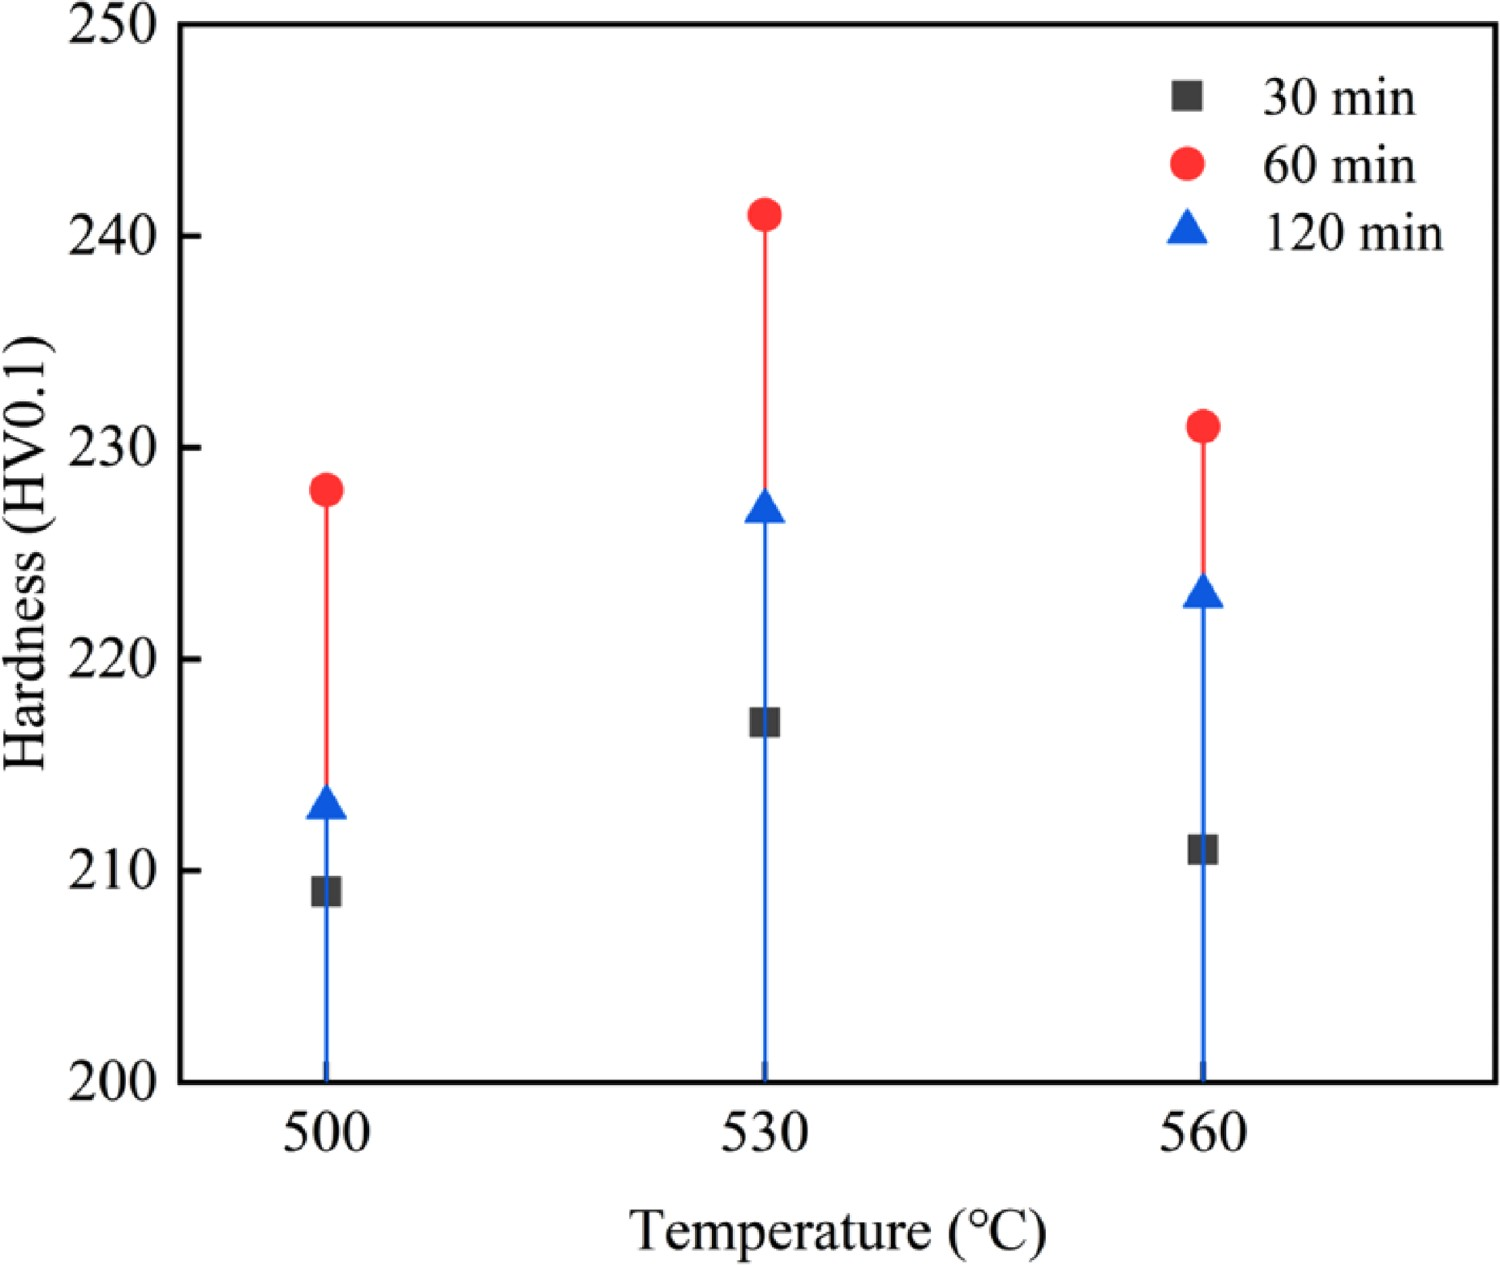
Figure 10 shows the stress–strain curves of the test steel annealed at 530°C. It can be seen that with an extension of the holding time, the yield strength increased from 690 MPa at 30 min to 785 MPa at 60 min. When the holding time was 120 min, the yield strength was 730 MPa. In addition to the increase in the yield strength, the tensile strength also improved, especially for an annealing time of 60 min. The tensile strength of the sample annealed for 60 min reached 920 MPa, while the tensile strength was only 815 MPa at 30 min of annealing, and the elongation at break also showed the same trends with annealing time. On the one hand, the mechanical properties of the samples improved due to the better dispersion and precipitation strengthening effect of the precipitated V(C, N) phase, and on the other hand, the heat treatment controlled the microstructure and precipitation of the precipitated phase resulting in refined grains and a more uniform microstructure. Therefore, the precipitation strengthening effect of the precipitated V(C, N) phase was the best in the sample annealed at 530°C for 60 min. Stress-strain curve of test steel at 530°C.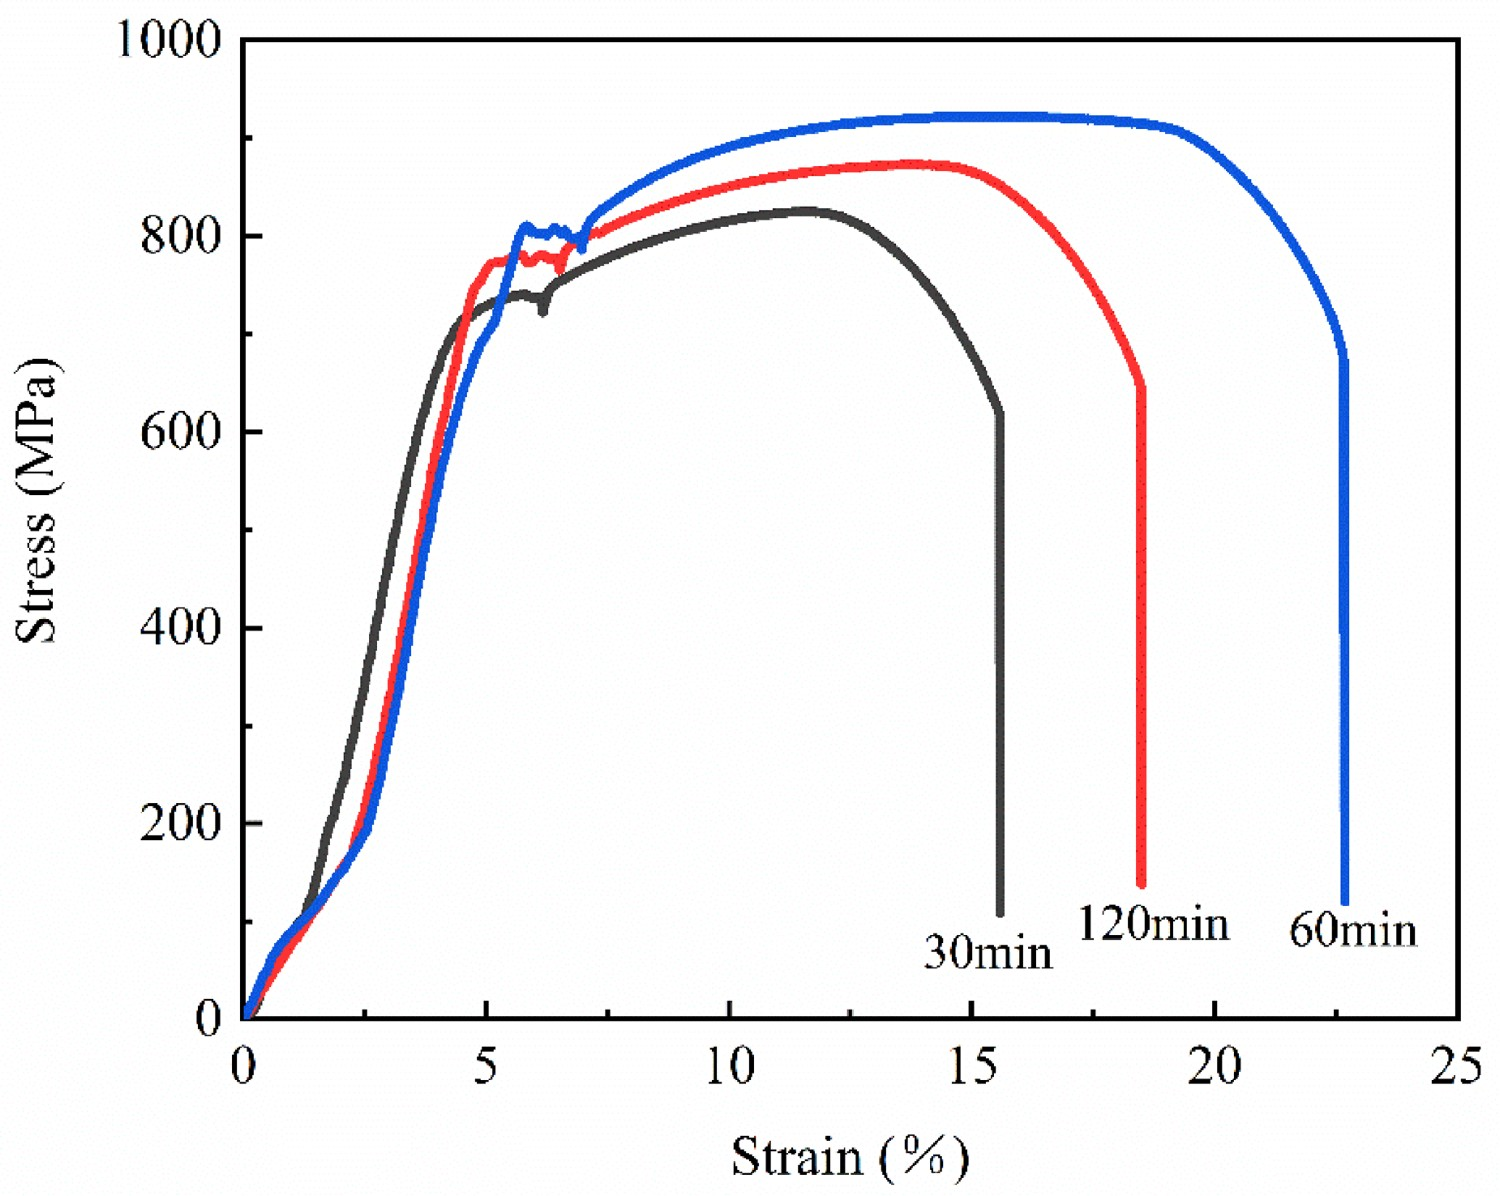
Conclusions
V microalloyed steel was mainly composed of ferrite, pearlite and a small amount of bainite. At this composition, the best dissolution temperature for V was 1000°C, and the best precipitation temperature for the V(C, N) phase was 530°C. After heat treatment, V fully dissolved into the steel and then formed V(C, N) precipitates at 530°C. The size of the precipitates ranged about 1∼100 nm, and there was a large number of small precipitates dispersed in the matrix, and in particular, in the interlamellar spaces in the pearlite phase and at the grain boundaries of the austenite phase. The precipitates of small size played a role in the dispersion and precipitation strengthening effect, refined grain structures, and improved F/P ratio in the annealed steel samples. After heat treatment, the mechanical properties of the steel significantly improved, and the mechanical properties of the sample annealed 530°C for 60 min were the best. The yield strength was 785 MPa, the tensile strength was 920 MPa, and the elongation at break was 23%. On the one hand, the improvement in the mechanical properties was because the V(C, N) precipitates nucleated the ferrite phase and exerts a dispersion strengthening effect; on the other hand, the normalizing treatment reached the austenitizing temperature, and the grains were refined.
Footnotes
Acknowledgements
This work was financially supported by the National Natural Science Foundation of China (U1860204 and 51871159).
Disclosure statement
No potential conflict of interest was reported by the author(s).