
Abstract
In recent years, sheet metal forming has gained great importance in the production process. To improve the quality of the manufactured products and reduce the production cost, incremental forming, particularly that adapted to small pieces, can be a good alternative. It is within this scope that the present study was carried out. This research work deals with the finite element simulation of the incremental forming process applied to achieve a trunk cone. It also examines the effects of the geometrical parameters of the tool and of the sheet on the forming force, stress distribution and thinning of the sheet. The obtained results show that the thinning of the sheet is more important in the case of the continuous tool path (about 0.2 mm), compared to that in the discontinuous one.
Introduction
The forming processes for sheet metal are one of the most important processes in the industrial sector. Among these processes, we may cite the single incremental forming which is a strategic process allowing to reduce the cost of producing small pieces or manufacturing prototype [1–3]. Indeed, this process consists in deforming the sheet metal with a hemispherical tool according to a predefined tool path [4]. It makes the forming sector more flexible, making it possible to produce pieces that cannot be realized by conventional processes, as it is the case of manufacturing single-use pieces used in the medical field [5]. In fact, the incremental forming process is characterized by its high flexibility, low tooling cost and its ability to realize complex shapes [6–10]. Although manufacturers use materials having higher formability to produce pieces by incremental forming (e.g. aluminium alloys) [1,11,12], many studies focused on the forming of other types of materials. For example, it is possible to deform Titanium sheets through lubrication to increase their formability [5]. Franzen et al. [4] evaluated the formability limit of PVC sheets as a function of different process parameters. The results they obtained show that the forming of PVC sheets is interesting for a high vertical increment. Conte et al. [13] studied the effect of cutting depth, inclination angle and process temperature on the forming of composite materials. Other studies focused on the hot forming of magnesium alloys [14]. They concluded that the forming forces decrease with the rise of the process temperature. Besides, the stainless steel AISI 304 can be used to manufacture prostheses because of its higher resistance to corrosion, lower oxidation and more reduced cost, compared to Titanium. Moreover, this type of steel has high formability due to its excellent mechanical properties. Chezhian et al. [4] applied the incremental forming process on a stainless steel sheet with a thickness of 0.6 mm to investigate its formability and measure its stress and thickness after forming. They showed that feed rate influences remarkably the forming force, the formability and the thinning of the used sheet. Several studies were conducted to evaluate the effect of certain parameters on the forces generated by the process [15,16]. Ambrogio et al. [17] revealed that the forming forces are proportional to the tool dimension, the vertical step, the sheet thickness and the forming wall angle. Other researches demonstrated that the adjustment of the rotation speed and the use of lubrications are efficient in the incremental forming process and allow reducing the forming force [12–22]. Some studies [14,15] examined the effect of the vertical increment, the tool diameter and the rotational speed on the forming force for AISI 304 stainless steel sheets. The results obtained in these works proved that the forming forces can be enhanced by increasing the tool diameter and the vertical increment and that they decrease with high rotational speeds. Concerning the thinning of the sheet, Jeswiet et al. [6] developed a new tool path and showed that the thickness of the formed sheet decreases at a small-cone angle. Hagan et al. [23] investigated the effect of vertical increment on the quality of formed surfaces. They concluded that the larger the vertical increment is, the more poor the surface quality will be. Ambrogio et al. [24] analysed the influence of the tool diameter and the depth of cut on the dimensional accuracy of the pieces obtained by incremental forming. Their results revealed that the error was minimal for the lowest possible diameter and vertical increment.
In order to reduce the number of experiments performed to develop and size the tools of this complex process, manufacturers still use more powerful numerical devices to simulate the forming operation and optimize the process parameters such as tool diameter and vertical step.
Nowadays, the most discussed topic in the incremental forming process is sheet thinning (how to achieve a uniform thickness of the piece to be manufactured after incremental forming).
This manuscript studies the effect of the incremental forming process parameters on the evolution of the forming force, stress distribution and blank thinning.
Modelling of the single-point incremental forming process (SPIF)
Incremental forming is a process of forming, by plastic deformation, sheet metal with small-sized tool. The newly-introduced forming processes are based on local plastic deformation of sheets and allow the production of complex-shaped pieces. The tool path was designed using the CAD/CAM software (discontinuous trajectory) and programmed (continuous) using Matlab.
Presentation of the final manufactured piece
In this study, the final shape of the piece obtained after simulation must be of trunk cone shape with precise dimensions, as shown in Figure 1. Dimensions of the piece to be manufactured.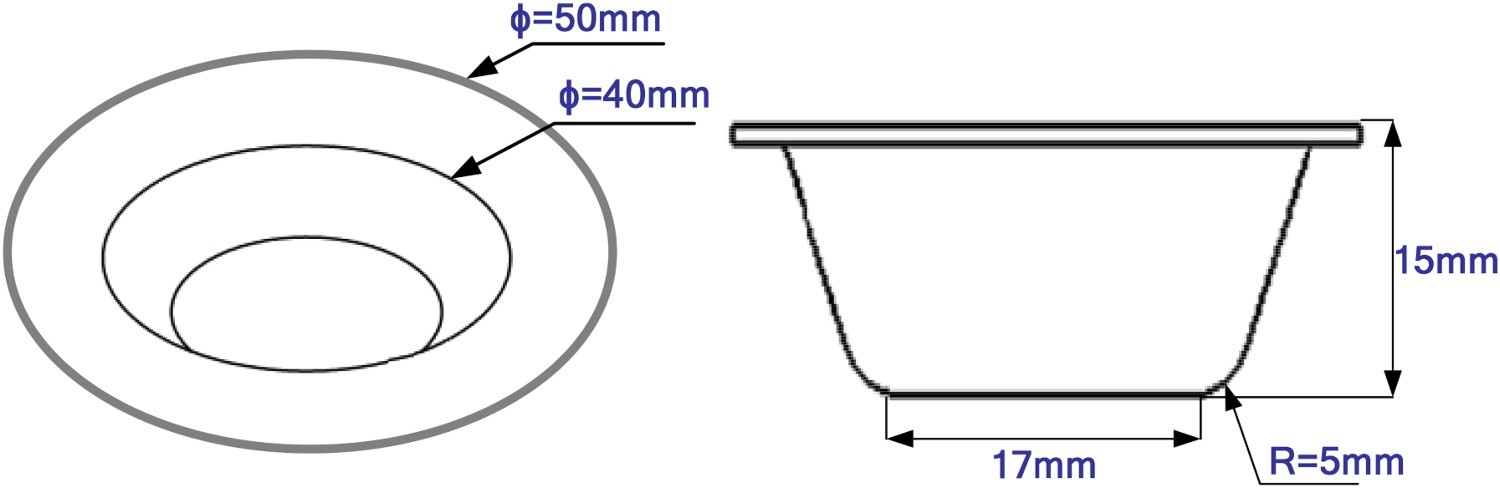
Determination of the tool path
Generally, the geometry of the mechanical part produced by the incremental forming process depends on the used tool path. In this context, the main objective of the present work is to design the trajectory describing the geometry of the final product by applying mathematical equations and using CAD/CAM software.
Case of a continuous path
Theoretical study
The movement of tool forms a spiral path. The spiral is a curve drawn on a cone whose base is a circle, as shown in Figure 2. Cylindrical coordinate system 
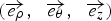
The path tool is the whole position occupied by point M. To represent that of the propeller in Cartesian coordinates, the parameters on which the path tool depends should be studied. These parameters are presented below:
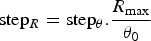
Rotation angle of a point M on the trajectory


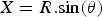
The components X, Y and Z expressed on the Cartesian basis as follows:
Tool path correction on the tool radius
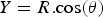
The use of a continuous path (spiral) depends on the corrections made by Equations (7) and (8) applied to obtain the final shape of the piece to be manufactured. New parameters were used and programmed into the equation of the tool motion to obtain the new path. These parameters are defined in Figure 3. Geometry of required final shape.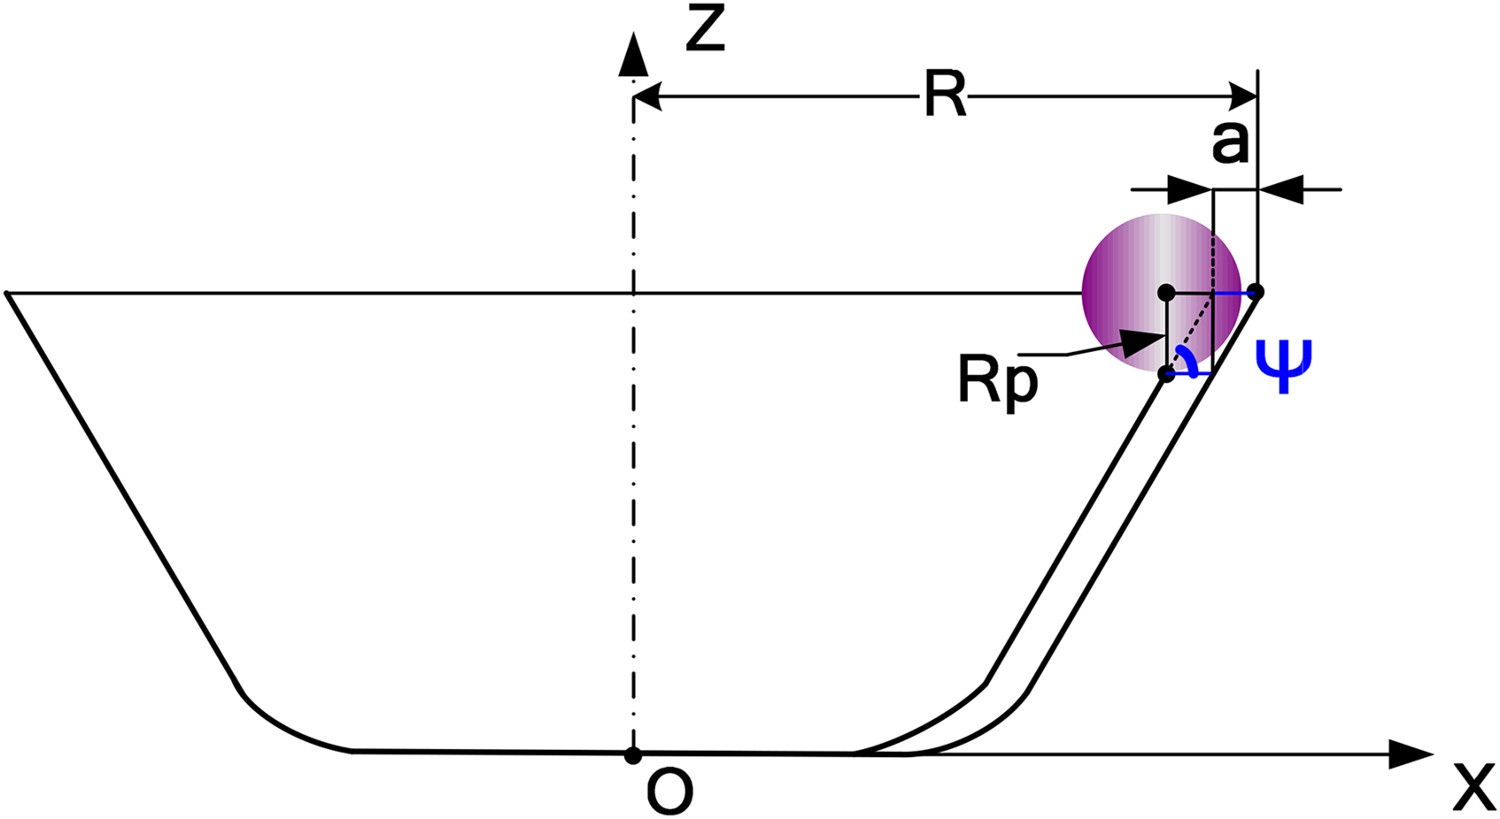
Then, the new equations of X′ and Y′ after were applied: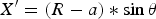
With: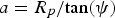


Figure 4(a) shows the tool path without correction and that obtained after correction using the new expressions of X and Y. Tool path: (a) continuous, (b): discontinuous.
Case of a discontinuous path (circular)
The tool path of the trunk cone part can be determined using the CAD/CAM software, as shown in Figure 4(b).
Mechanical characteristics of the sheet metal
Mechanical properties of stainless steel AISI 304 L.

The applied law of strain hardening is Swift's law: 

Geometrical model description
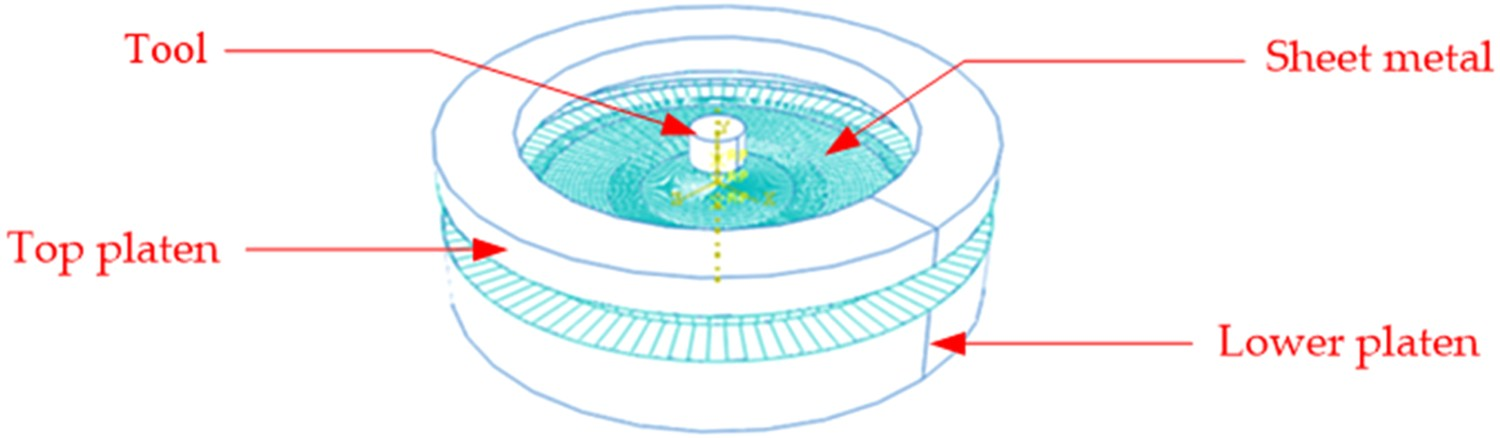
The geometrical model used to simulate the incremental forming process is presented in Figure 5. It includes the following elements: Sheet metal: circular sheet metal having an external diameter of 50 mm and a thickness e = 1 mm. Lower platen: rigid and circular shape with an external diameter D
m = 60 mm, an internal diameter d
m = 43 mm, a thickness of 10 mm and a roundness equal to 0.75 mm. Top platen: rigid and circular shape with diameter d
s = 43 mm and thickness equal to 5 mm. Tool: (rigid) Two hemispherical punches of diameter D = 10 mm and D = 6 mm. were used. Incremental forming device.
Loading conditions
The loading conditions of the developed model are defined by Figure 6. A clamping pressure applied (P
s) by the top platen on the sheet is about 70 MPa. Device loading conditions.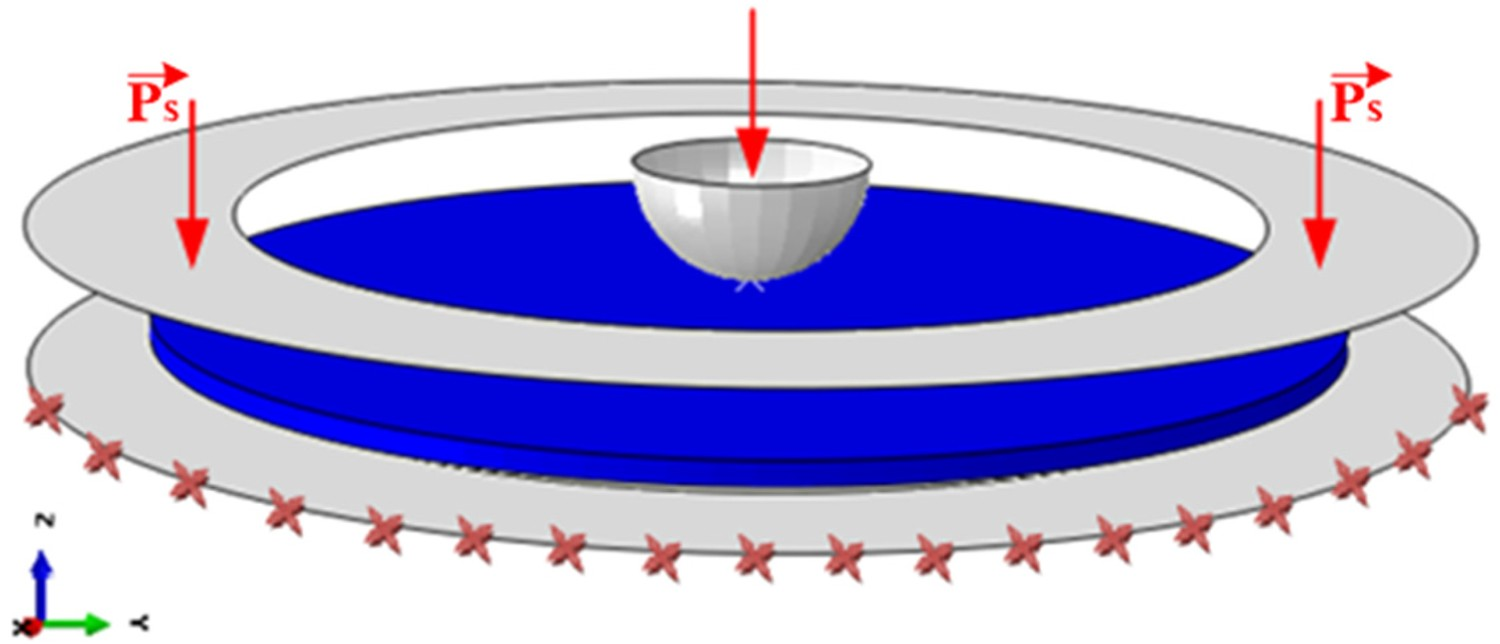
The imposed boundary conditions eliminated all degrees of freedom from the lower platen. It was assumed that the contact surface between the lower platen and the blank has a friction coefficient of 0.1. The sheet was blocked on the lower platen by moving the top platen in the direction 
Mesh generation
Mesh generation is a very important phase in the field of finite element calculation. Indeed, a high-quality mesh is essential to obtain an accurate and correct calculation result as it improves the convergence, the accuracy of the solution and, especially, the computation time. Good mesh quality can be obtained by the minimization of distorted features and the good resolution in regions presenting a strong gradient. A good mesh should also be sufficiently smooth. The mesh of the used sheet is linear hexahedral of type C3D8R (reduced integration). The latter contains 4500 elements and 9002 nodes and is refined until an element size of 160 µm at the contact region. The elements used in this mesh form a standard integration schema (Figure 7). Mesh of sheet metal.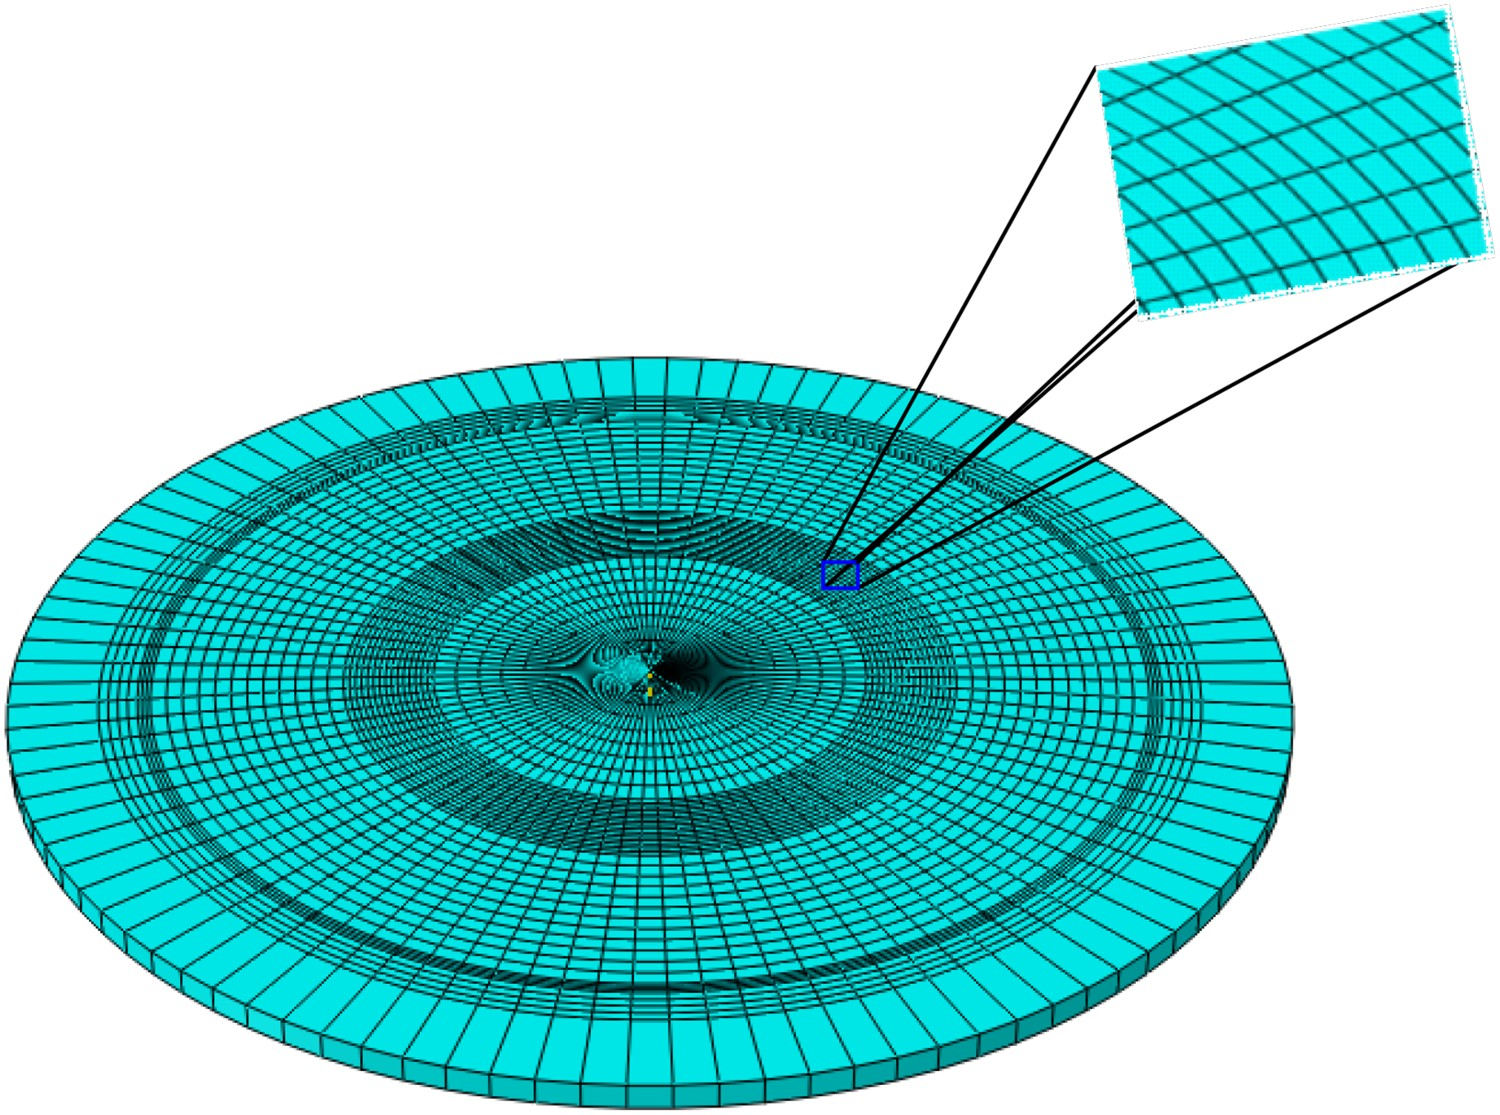
Process parameters and their levels.
Results and discussions
The aim of the simulation is to identify and analyse the effect of the main parameters of the used tool geometry, vertical step and tool path strategy on the evolution of forming force and stress distribution and sheet thinning.
Evolution of forming forces
Effect of tool diameter
The curves presented in Figures 8 and 9 depict the evolution of the lateral forming force ( Evolution of the lateral forces Evolution of the lateral forces 


From the two figures, it can be observed that the value of maximum force obtained for a tool diameter of 10 mm attains a value of about 1565 N. However, for a tool diameter of 6 mm, the maximum force does not exceed 1184 N.
It is also clear that, in the case of trunk cone shape (axisymmetric part), the evolution of force 

Figure 10 shows the evolution of the incremental forming axial forces provided by a specific tool during forming at different tool diameters, with a fixed cutting depth Evolution of the axial tool forces Fz at different tool diameters with a step = 0.5 mm.
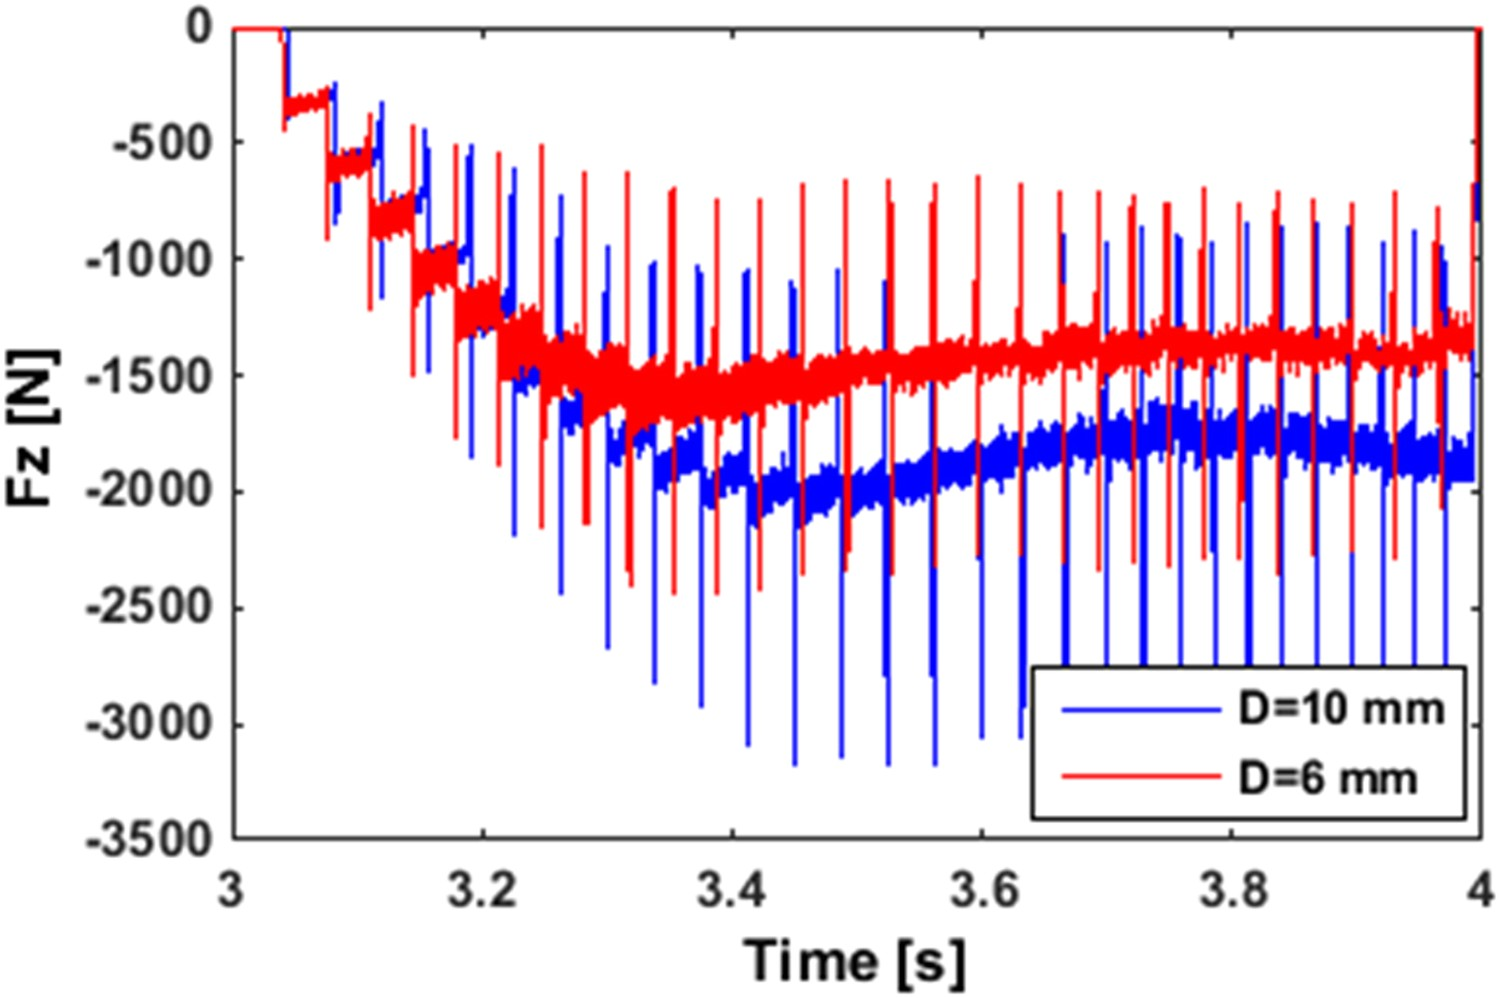
This force reaches a maximum value of 3185 N at a tool diameter equal to 10 mm. However, at a diameter of 6 mm, its maximum value is almost equal to 2446 N.
Effect of vertical increment
One of the important forming process parameters is the vertical increment size. Several simulations were carried out to study the influence of vertical step on the forces provided by the tool.
Figures 11 and 12 describe the evolution of force components Evolution of lateral forces Evolution of axial forces 


The maximum lateral force 
As demonstrated in Figure 12, the forming force increases with the rise of the vertical step size. In the case of a vertical step equal to 0.5 mm, the maximum axial force is quite large (2446 N), which shows that the force increase is proportional to the cutting depth. When the vertical step is very small, the tool penetrates less into the sheet, which explains the lower vertical force compared to that in a larger vertical step. Experimental results concerning the variations of the curves of the same gaits and obtained by Saidi et al. [25], Filice et al. [26] and Duflou et al. [17] confirm those provided in this study.
Effect of tool path
Figures 13 and 14 represent the evolution of forces Evolution of lateral forces Evolution of axial forces 


The axial force 


Distribution of the maximum forces at different tool diameters and vertical steps.


Evolution of stress
This section focuses on the influences of the tool diameter, vertical step and tool path on the stress distribution after incremental forming. Figure 15 shows the profile chosen to determine the Von Mises stress distribution after sheet metal forming. The profile was applied along the longitudinal direction Profile used to determine the stress distribution.
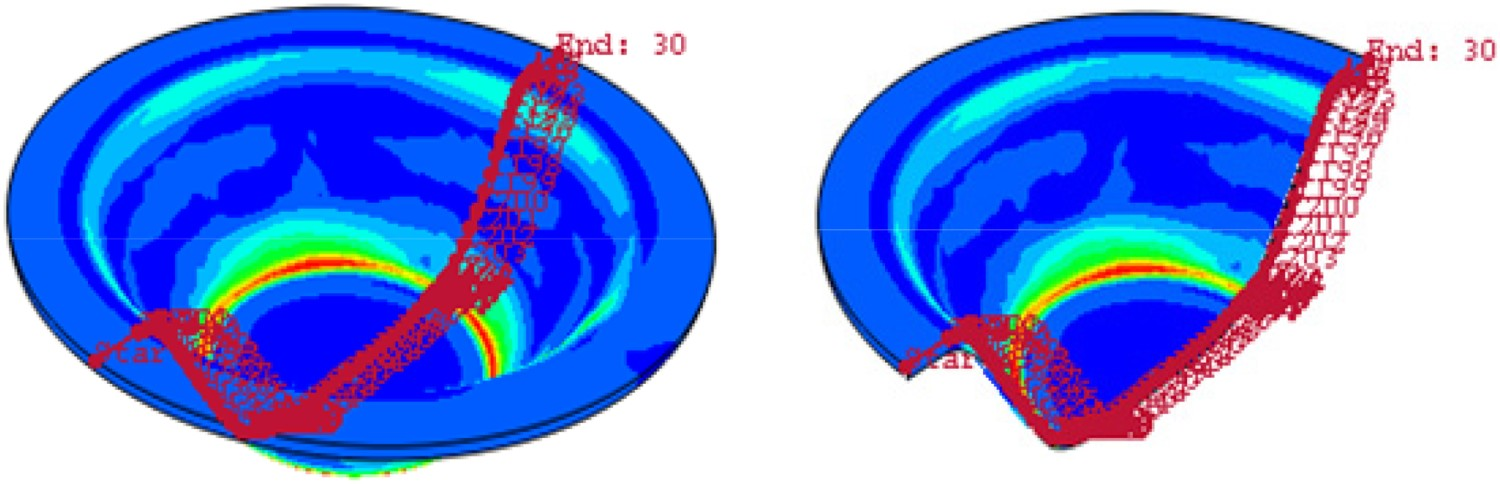
It is obvious that the variation of the tool diameter affects remarkably the stress distribution. Indeed, the stress increases with the decrease in tool diameter. It can be also seen, from Figure 15, that the increase in stress is proportional to the cutting depth increase. The maximum achieved stress value is more important at vertical step equal to 0.5 mm at a vertical step equal to 0.1 mm. Figure 16 shows the stress curves obtained at different tool diameters, vertical steps and tool paths. Von Mises stress distribution, (a): tool diameter, (b): vertical step, (c): tool path.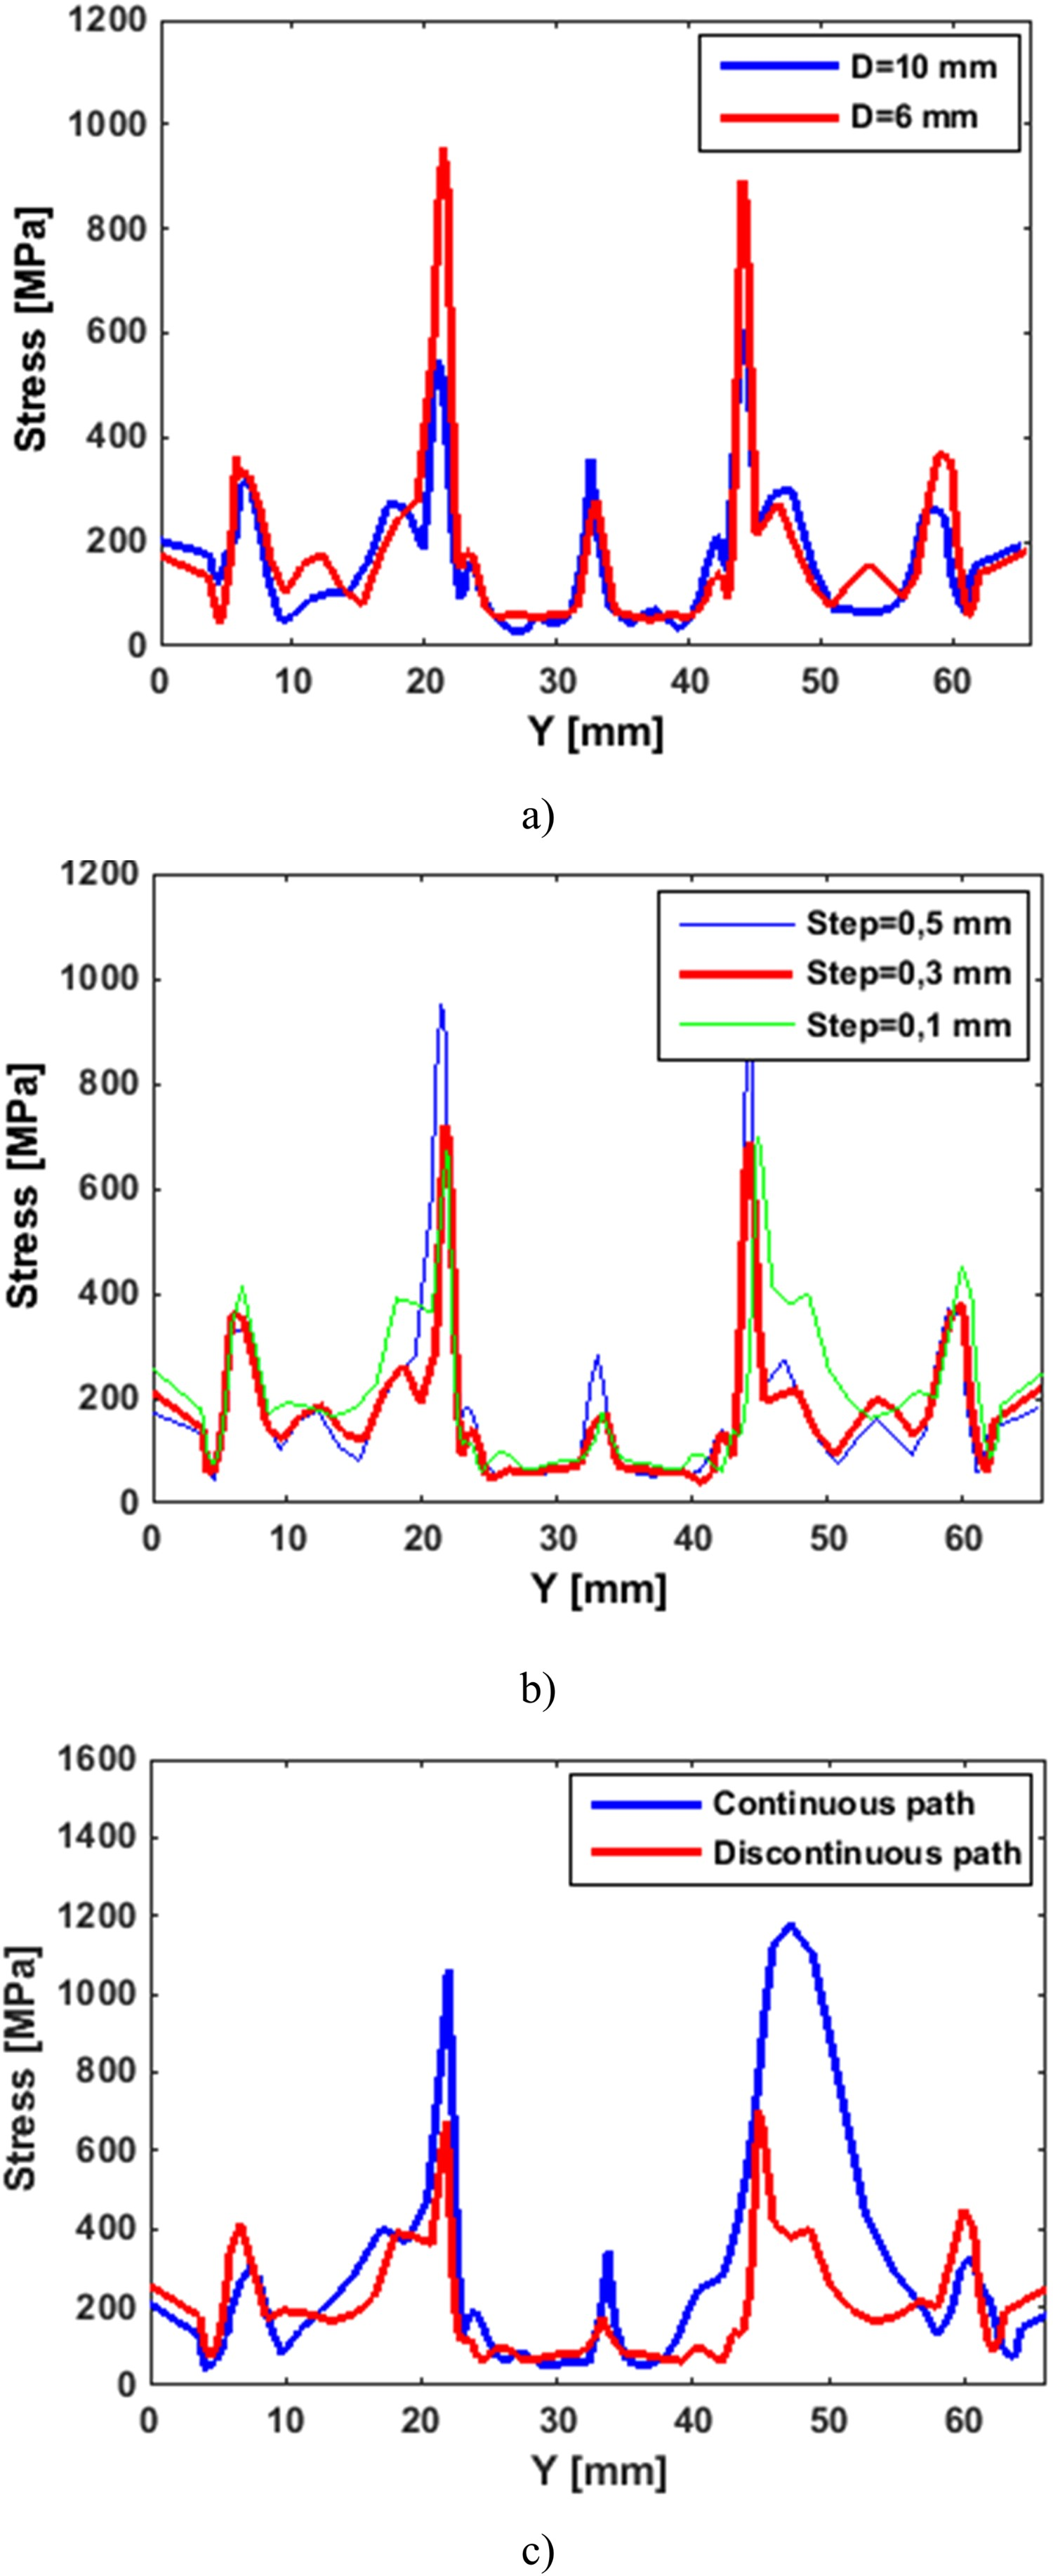
Figure 17 shows that the stress distribution can be divided into four main areas:
Area 1: It is the area of the clamping of the sheet. In area 1, the stress does not exceed the value of 200 MPa because the force applied by the sheet clamping device remains the same during all simulation tests. It is also noticed that the stress depends on the force of the sheet clamping. We may conclude that the reduction of the clamping force allows reducing the stress (risk of sliding).
Area 2: It represents the contact area between the die, the sheet and the tool: the tool exerts moderate forces on the sheet metal, which causes an increase in the contact stress (about 400 MPa). In fact, the smaller the diameter of the tool is, the more important the contact stress will be.
Area 3: It is the contact area between the tool and the sheet. In area 3, the stress reaches a maximum value of about 950 MPa. The main parameter that influences the stress distribution in this area is the stamping depth. In conclusion, although the increase in Von Mises stress rises level of plastic deformation, it causes the sheet thinning. In other words, the thicker the sheet is, the greater the Von Mises stress will be.
Area 4: In this area, the Von Mises stress remains constant during the incremental forming test at about 76 MPa because the tool penetrates the ends (at the edges) of the piece, but it does not move in this area. Distribution of mean stress at different areas of the piece.
Distributions of Von Mises stress and the sheet thickness at different areas of mean stress distribution.

Based on the results presented in Table 3, the thinning phenomenon of the sheet (studied in the following sub-section) can be explained. Indeed, the maximum stress provides the minimum thickness.
Thinning of the sheet metal
The geometry of the final product is one of the most important parameters in the numerical simulation of incremental forming process. To guarantee the piece final geometry that is satisfactory and reliable from a practical point of view in domains where certain conditions (force, pressure, etc.) may cause the breaking of the piece, it is necessary to highlight the phenomenon of the sheet thinning. This phenomenon remains a topic widely studied by the research community.
In the conducted simulation, the piece thickness was determined from the normal distance between the inside and outside surface of the sheet metal over the entire section (Figure 18). Figure 19 shows its distribution and how the latter is affected by the tool diameter variation, the vertical step and the tool path. Characterization of the thinning areas. Evolution of the sheet thickness at different conditions.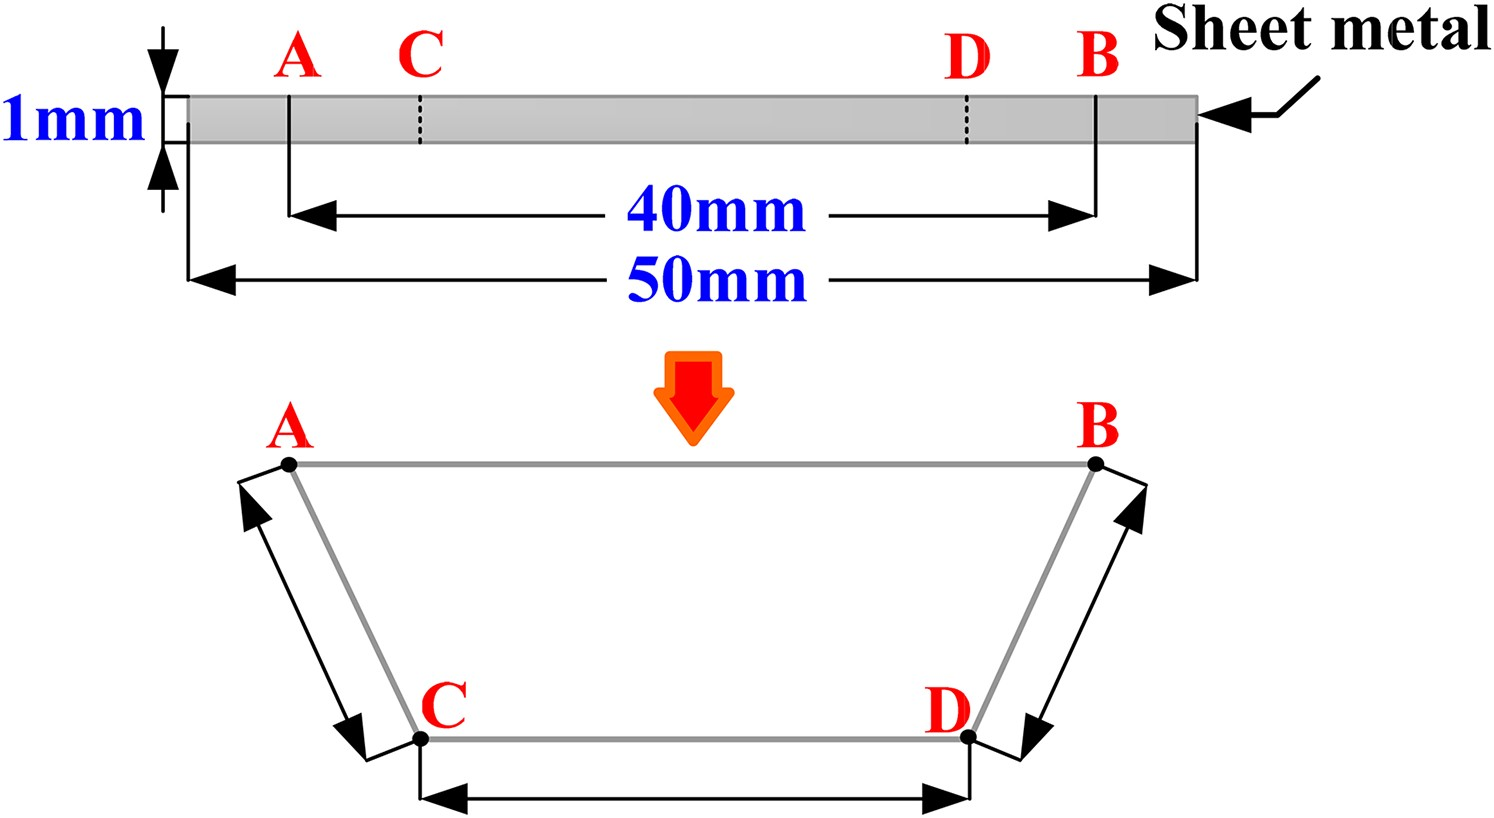
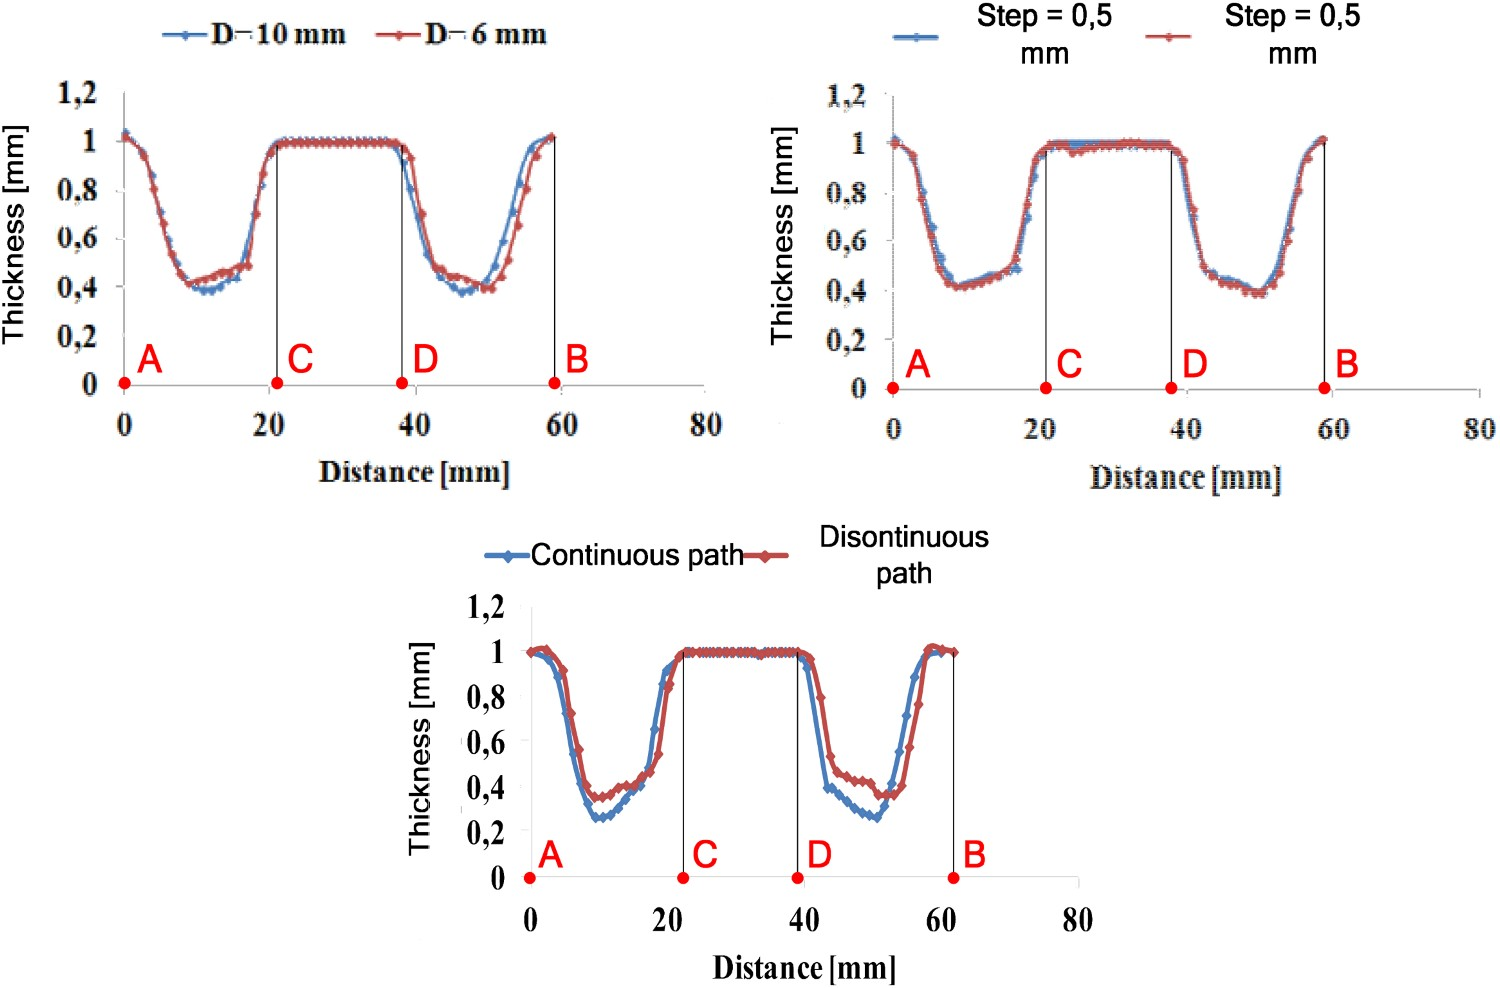
Figure 19 exposes the relative evolution of the sheet thickness. Three parts can be distinguished: (AC), (CD) and (DB). The final product has an axisymmetric shape. It presents two identical parts (AC) and (DB) whose thickness is reduced equally. For this reason, the present study focuses only on two areas.
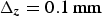
Area 1 (AC and DB): It is an active area corresponding to the contact surface with the tool. It presents a major reduction in thickness (major thinning). The important thinning is caused by the penetration of the tool, which makes the material move along the path. The thinning can be further explained by the increased strain and stress required to plasticate the material. The thickness decreases from its initial value e = 1 mm until reaching the minimum value equal to 0.4 mm for a discontinuous path (the thickness reduction is about 60%). For a continuous path, the thickness decreases by 0.27 mm, representing a reduction of about 70%. The large minimization in the thickness of the plate causes problems in the domains of use as it cannot be adapted to the forces and pressures. This problem of thinning involves the rupture of the piece when used.
Area 2 (CD): This area has no contact with the tool. Indeed, sheet thickness remains constant and equal to 1 mm (no thinning). No force is applied on this area because the tool moves to the sheet edges, but it does not touch the centre of the piece. Obviously, the thickness remains approximately constant due to the absence of stress (or insignificant stress). These results are comparable to those obtained by Filice et al. [27].
In conclusion, a discontinuous path gives lower sheet thinning, compared to a continuous path (the thickness of the discontinuous path is twice larger than that of the continuous path). It is, therefore, necessary to take this phenomenon into account in order to reduce the sheet thinning or make it almost uniform. It is assumed that the single-point incremental forming process (SPIF) enhances considerably the piece final quality (sheet thinning).
Because of this problem and in order to attain almost uniform thickness, in the performed simulations, the TPIF two-point incremental forming process was applied. The tools used in the two-point incremental forming process are shown in Figure 20. Device used in two-point incremental forming process TPIF.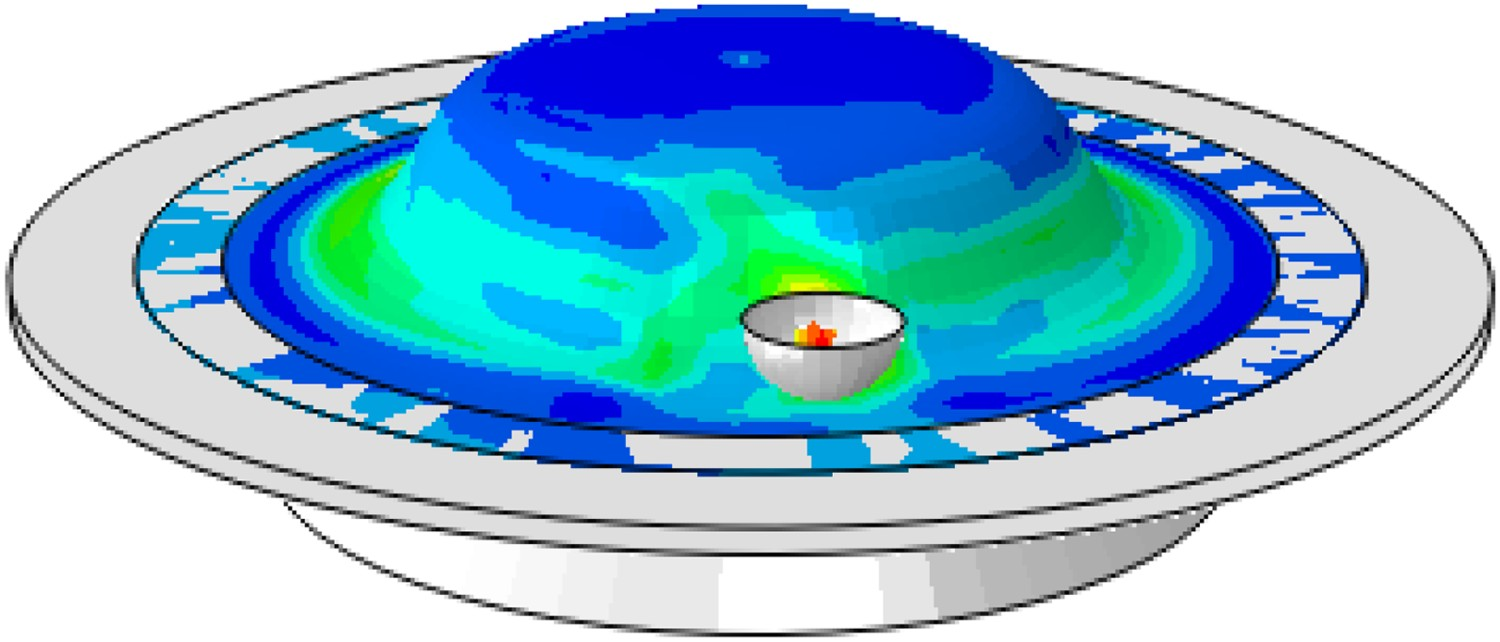
From Figure 21, it can be noticed that the thickness remains constant in the centre of the sheet and decreases locally at the edges of the piece, resulting in the thinning problem. Sheet thinning: case of two-point incremental forming process TPIF.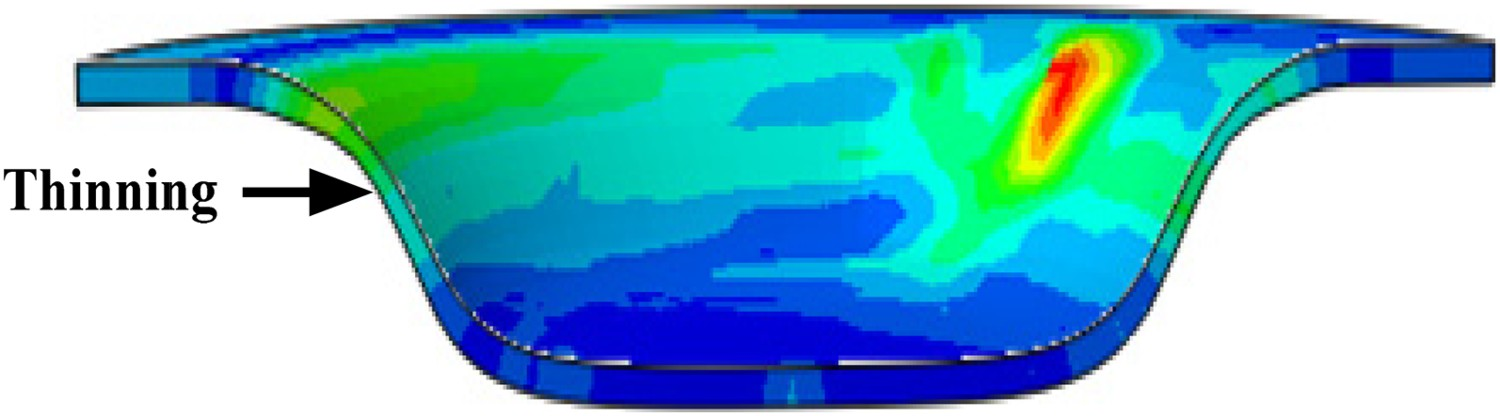
It may be deduced that the thinning problem does not depend on the choice of the incremental forming process, but rather on a path that allows the tool to deform the centre of the piece.
Comparison of the theoretical profile (required) and the simulated profile
After simulations, the numerical profile was determined for the two continuous and discontinuous paths on the inside surface of the piece and compared to the theoretical (required) profile.
The results obtained by simulating numerically the incremental forming and varying the main applied parameters (tool diameter, vertical step, tool path), the simulated profiles at the different paths for a step equal to 0.1 mm and a tool diameter equal to 6 mm were obtained.
It is also clear that the discontinuous path provided the best final geometry of the trunk cone shape, as shown in Figure 22. The error between the required and simulated profile is in the centre of the final shape. Therefore, the continuous path allowed obtaining an unsatisfactory geometry because of the force applied by the tool. Comparison of theoretical (required) and simulated profile.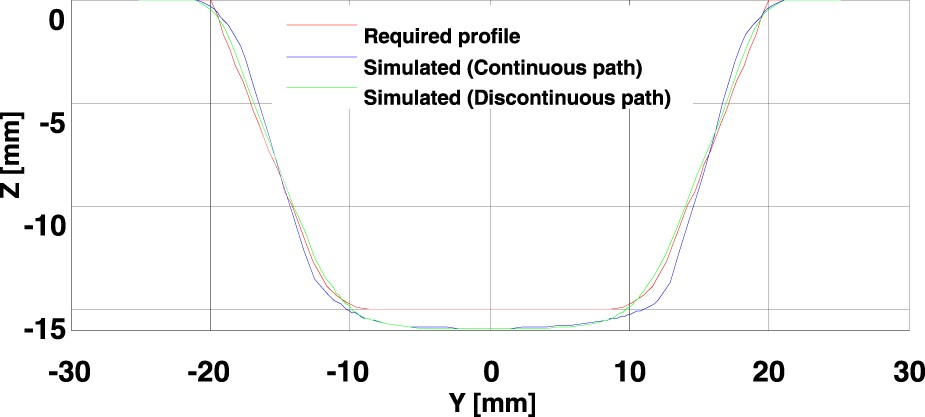
Figure 23 shows the final Trunk Cone shape at different views, obtained for a discontinuous path, for a cutting depth equal to 0.1 mm and a tool diameter equal to 6 mm. Final shape of the piece cone trunk.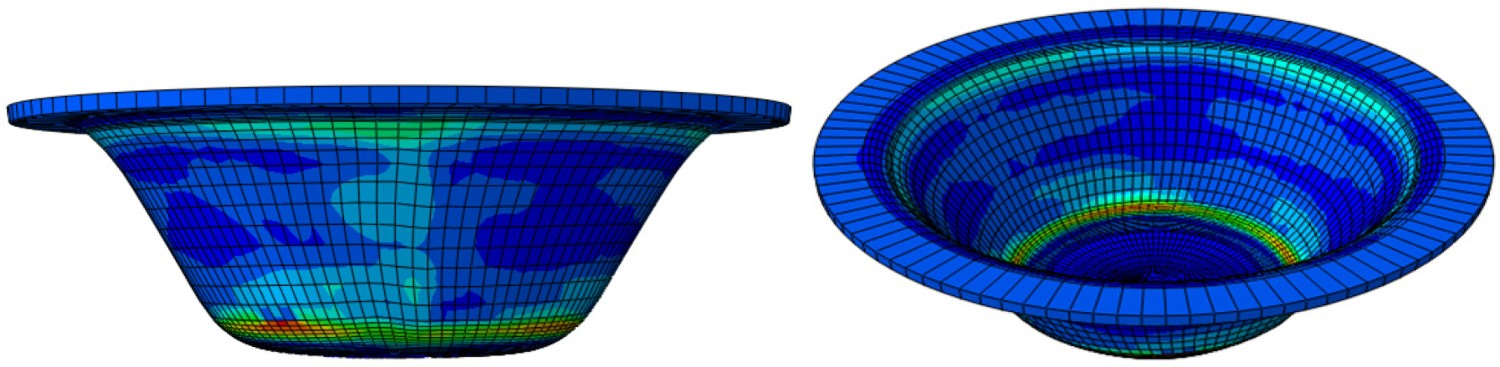
Conclusions
In this work, numerical simulations based on the variation of some main parameters (tool diameter, depth of cut and tool path) were performed. The influence of these parameters on the force evolution, stress distribution and sheet thinning was also examined. The obtained results reveal that: The tool diameter, the vertical step and the tool path affected significantly the evolution of forces and stress distribution. The axial force was generated and, at some values, it stabilized along the path. The vertical force was more stable in the case of a continuous trajectory. In the case of a continuous path, the thickness decreased by 70%, compared to its initial value. The decrease in tool diameter resulted in a stress increase. The increase in stress was proportional to the axial increment. Stress distribution presented the problem of sheet thinning. Indeed, an increase in stress led to a significant reduction in thickness. The numerical simulation accounts for the tool path, vertical step and tool diameter on the final shape of the part. The discontinuous path provided a better final geometry of the piece.
Footnotes
Disclosure statement
No potential conflict of interest was reported by the author(s).