
Abstract
Aiming at the shortcomings of traditional slag use of height to represent melting temperature, the melting performance of desulfurization slag under different binary alkalinity is tested, and any time image in the melting process is binarized to obtain the realtime area of slag heating and melting process.The area change rate is obtained from the real-time area and the initial area, and the melting performance of the slag is evaluated by the area change rate. The results show that using the change of the whole area of the slag instead of the change of the height to evaluate the melting performance of the slag can comprehensively evaluate the melting process of the slag, which not only improves the accuracy and universality of the evaluation of the melting performance of the slag but also shows the change rule of the low-temperature slag expansion process.
Introduction
Various slags are involved in the metallurgical production process, such as blast furnace slag, hot metal pretreatment slag, steel slag in the steelmaking process, and protective slag used in the continuous casting process [1–5]. Different slags have different properties and play different roles. The melting performance of slag [6–8] is an important indicator to evaluate its high-temperature performance, which is related to whether the process can be carried out smoothly and whether the product quality is qualified. Therefore, the melting property of slag is significant for iron making, hot metal pretreatment, steelmaking, continuous casting, and other processes.
Currently, the evaluation method of slag melting performance consists of three indicators, namely the beginning melting temperature, the hemispheric point temperature, and the flowing temperature [9,10]. The disadvantage of this evaluation method is that the details of the melting process are not reflected. Therefore, this paper provides a new evaluation method for slag melting performance. By continuously taking pictures of the slag in the heating and melting process, the binary processing of the slag melting process image can solve the problem that the evaluation indicators are too simple, and only three indicators, namely the begin melting temperature, the hemispheric point temperature, and the flowing temperature, can be obtained.
Comparison of slag melting performance evaluation methods
Deficiencies of traditional slag melting performance evaluation methods
In the study of slag melting performance, the melting point melting rate meter [11] is generally used. In the melting process of slag, with the increase in temperature, the upper surface may not be completely regular and become serrated. At this time, it is questionable which point represents its height. That is, the traditional slag evaluation method is a typical ‘point to the surface’. The height of a point on the upper surface means the melting performance of the whole slag, which is one-sided. The original image collected in the experiment is shown in Figure 1. (a,b) Original image of desulphurization slag collected in the experiment.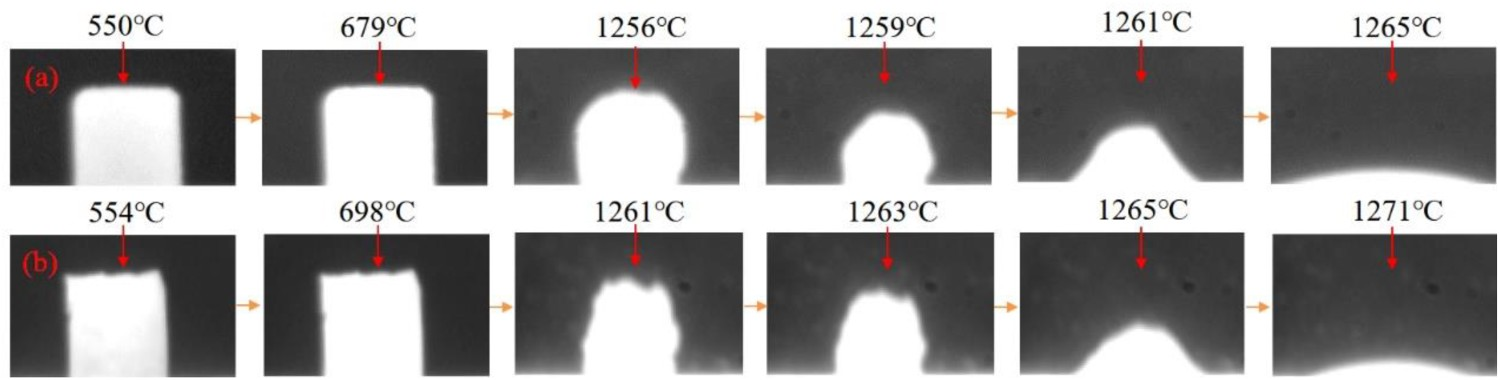
Figure 1(a) shows the upper surface of the desulphurization slag changes smoothly during the melting process, which can reflect the melting performance of the slag. However, the graphic boundary of slag in Figure 1(b) is irregular, which cannot be described by a specific mathematical function, and the calculation of its area is complex. In addition, the standard melting point melting rate can only measure the beginning melting temperature, the hemispheric point temperature, and the flowing temperature when measuring the melting temperature of the desulphurization slag, which are all indicators after shrinkage and lack of changes in the melting process of the desulphurization slag. Because of the shortcomings of slag melting performance evaluation methods, there are a few new slag melting process evaluation methods recorded in the literature. The traditional approach is still used to evaluate the slag melting performance. One part is to measure the melting temperature of the slag using the melting point melting rate meter. The other part is to carry out a viscosity experiment on the slag and define the melting temperature according to the inflection point of its viscosity-temperature curve. The shortcomings of using the melting point melting rate instrument to evaluate have been described. Finding the inflection points through the slag viscosity experiment to find the melting temperature is effective for the high alkalinity slag. However, it is still challenging to find the inflection points for the low alkalinity slag. This is because the polymerized ions of acid slag are large and move slowly. When they are cooled to the liquid surface temperature, these particles have no time to arrange on the lattice nodes, so the slag remains in the supercooled liquid state. At the same time, with the decrease in temperature, the activity of particles in the slag becomes worse, so the viscosity of desulphurization slag rises slowly. That is, the change in the viscosity-temperature curve of the low alkalinity slag is continuous and gradual, without an obvious inflection point, showing the characteristics of the long slag.
Binary treatment method for the slag melting process
Because of the shortcomings of the current highly evaluated slag melting performance, the method is too simple, and the accuracy is insufficient. A new treatment method is used to evaluate the slag melting process. First of all, the image at the beginning temperature of the slag is acquired, and the image at the initial temperature is binarized to obtain the initial area of the slag at the initial temperature. Then the image is accepted at any time during the slag heating and thawing process, and binary process the image at any time during the slag heating and melting process to obtain the real-time area during the slag heating and melting process. Finally, the area change rate is obtained according to the real-time area and the initial area. Then the slag melting performance is evaluated, which improves the accuracy of the slag melting performance evaluation. Figure 2 is the image of Figure 1 after binary processing. Binarization treatment of desulphurization slag.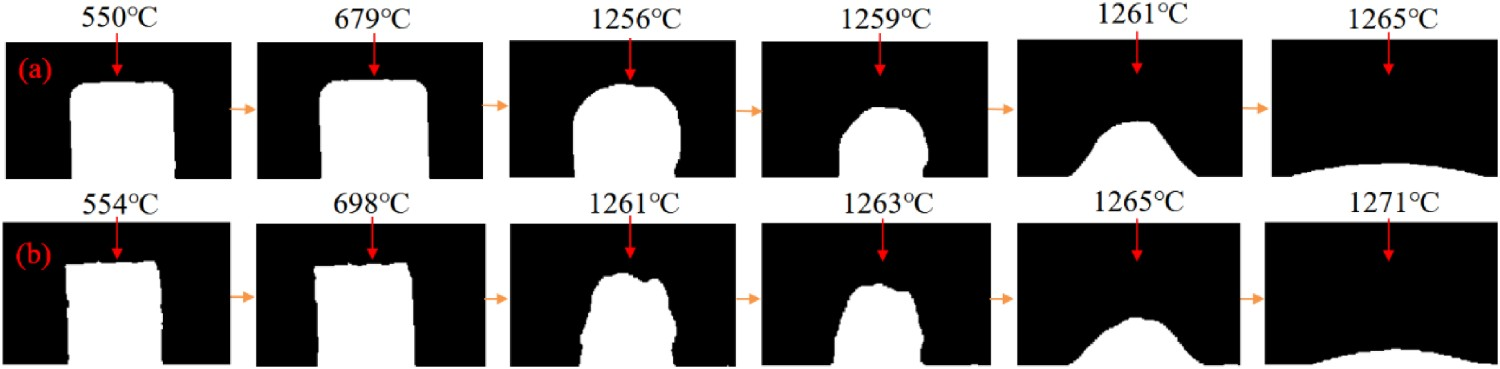
The area approximation is obtained by the integral method. The slag binary image is divided into countless square grids. When the grid area approaches infinity, the number of white grids in the statistical image is the slag area. The pixel value of the image pixel points of the initial temperature in the square grid cell is obtained. When the pixel value is less than the first threshold value, the pixel value is set at 0. When the pixel value is greater than or equal to the first threshold value, the pixel value is 255. Then the number of pixel points with a pixel value equal to 255 is obtained. The number of image pixel points with the initial temperature of 255 as the initial area to distinguish the slag figure from the environment are taken. Furthermore, the counting method can be used to calculate the area of the slag, that is, to count the number of slag points in the binary image. The grid division of the slag melting image is shown in Figure 3. (a) Initial area (b) real-time area. Grid division of the slag melting image.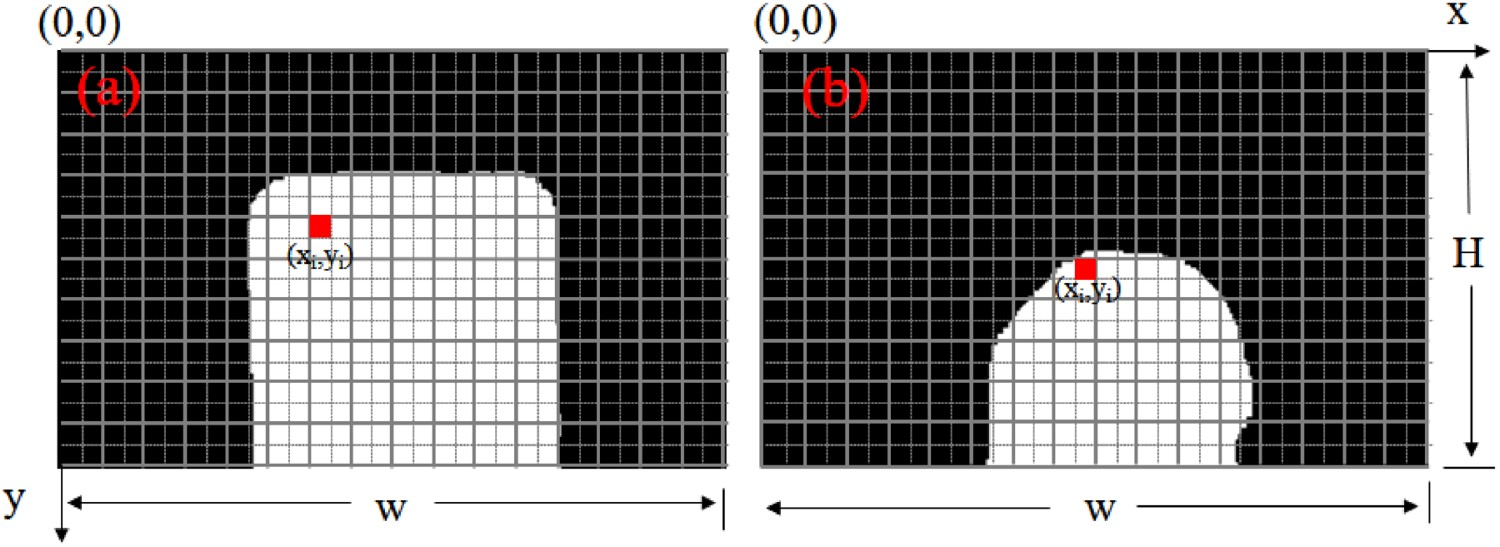
The initial area is obtained according to the following formula:
where S0 is the initial area; F0(xi,yj) is a pixel with a pixel value equal to 255 in the image of initial temperature.
The real-time area is obtained according to the following formula:
where S1 is the real-time area; W is the number of pixels in the width direction of the square grid cell; H is the number of pixels in the height direction of the square grid cell; F1(xi,yj) is the pixel point with a pixel value equal to 255 in the real-time temperature image, xi is the width direction coordinate in the square grid unit, and yj is the height direction coordinate in the square grid unit.
Experimental results and analysis
Data accuracy analysis
Alkalinity [12,13] is one of the critical factors affecting the performance of desulphurization slag. To explore the rationality of the binary slag melting process, and fix the content of other components within a reasonable range, the content of Al2O3 is fixed at 12.6%, the content of MgO is fixed at 9.5%, and the content of S is fixed at 1.2%. Set the alkalinity step size as 0.1, and the binary alkalinity of desulphurization slag [14] as 0.9, 1.0, and 1.1. Table 1 shows the composition ratio of three types of desulphurization slag with different alkalinity. The melting performance of three kinds of desulphurization slag with additional alkalinity was tested, and the binary treatment was conducted through the pictures of desulphurization slag recorded in the experiment. Figure 4 shows the relationship curve between Si/S0 and temperature during the melting process of desulphurization slag with three different alkalinities. S0 is set as the initial section projection area of each group of samples, Si as the section projection area at any time, and Si/S0 is used as the area percentage of desulphurization slag during the melting process. A curve with the area change rate (Si/S0) is drawn as the ordinate and the temperature (T) as the abscissa. In the Si/S0-T curve, it is defined that the temperature corresponding to Si/S0 = 0.75 is the beginning melting temperature of the slag. The temperature corresponding to Si/S0 = 0.50 is the hemispheric point temperature; the temperature corresponding to Si/S0 = 0.25 is the slag flow temperature, and the slag corresponding to Si/S0 > 1 is the expanded slag. Then the melting performance of the slag is evaluated, and the dynamic change curve of the sample melting with temperature rise during the melting process of desulphurization slag is obtained. Relation curve between Si/S0 and temperature during the melting of desulphurization slag. The main components (%) and the range of desulphurization slag.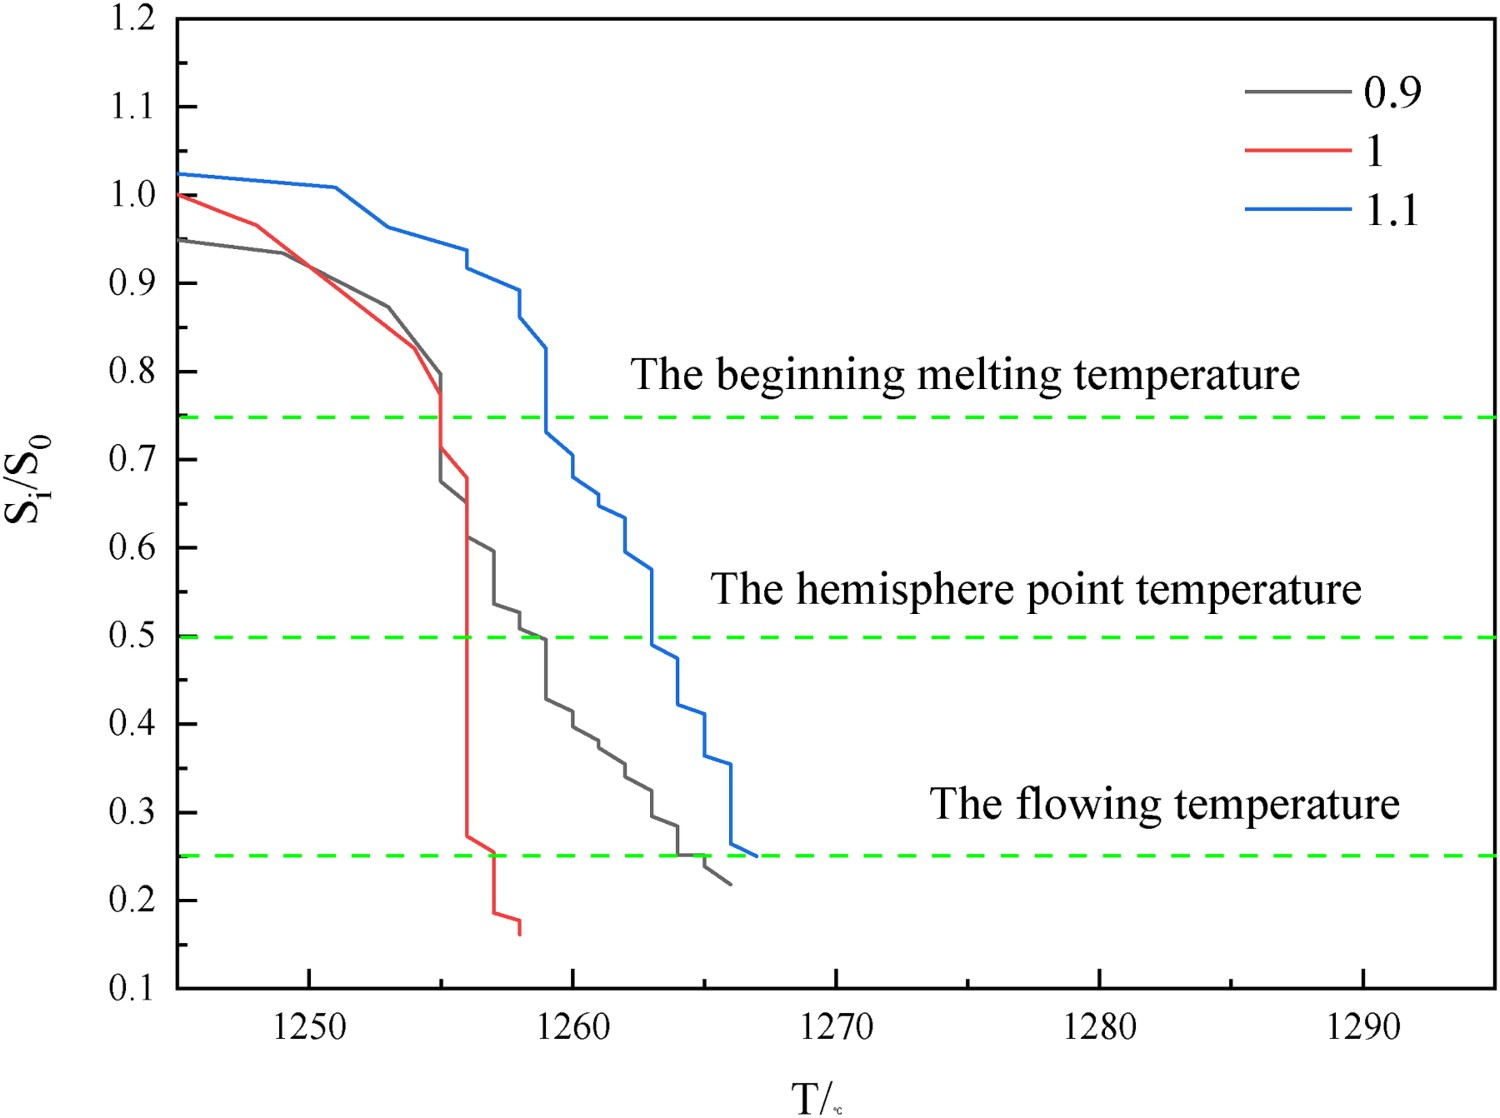
Comparison of melting temperatures of desulphurization slag.
Note: Tb in the table is the beginning melting temperature; Th is the hemispheric point temperature; Tf is the flowing temperature, |△Tb| is the absolute value of the deviation between the beginning melting temperature measured by the melting point melting rate meter and the beginning melting temperature of the binary treatment. |△Th| is the absolute value of the temperature deviation between the hemispheric point temperature measured by the melting point melting rate meter and the hemispheric point temperature of the binary processing. |△Tf| is the absolute value of the temperature deviation between the flowing temperature measured by the melting point melting rate meter and the flowing temperature of the binary processing.
It can be seen from the data in Table 2 that the comparison between the data after image binarization and the data measured by the melting point melting rate meter shows that the beginning melting temperature of acid slag (R = 0.9) after binarization is 2°C lower than that measured by the experiment, the hemispheric point temperature is 1°C lower, and the flowing temperature is consistent. The beginning melting temperature, the hemispheric point temperature, and the flowing temperature of the neutral slag (R = 1.0) treated by two different methods are consistent. The beginning melting temperature of the alkaline slag (R = 1.10) after binarization is 3°C lower than that measured in the experiment. The changes in the hemispheric point temperature and flowing temperature are the same as those of the acid slag. The cause of temperature deviation is found through binary processing of desulphurization slag images. Figure 5 shows the binary processing of low alkalinity alkaline slag. (a) Beginning melting temperature; (b) Hemisphere point temperature; (c) Flowing temperature. Binary treatment of low alkalinity alkaline slag.
Figure 5 shows the desulphurization slag will change irregularly in the melting process, and the surface change on the upper side of the slag is not very regular, which will also cause the lack of accuracy of the melting temperature measured in the experiment. At the same time, the melting process of desulphurization slag is more intuitively shown by the melting temperature curve of desulphurization slag in Figure 4, which overcomes the defect that there are only three melting temperatures in the evaluation process of the slag melting process.
Data universality analysis
To study the universality of data, the alkalinity of desulphurization slag is refined, the alkalinity step is set as 0.05, and 0.85, 0.95, 1.05, and 1.15 alkalinity of the desulphurization slag is added. Table 3 shows the composition ratio of four types of desulphurization slag with different alkalinity. The melting performance of four kinds of desulphurization slag with additional alkalinity was tested. The binary treatment was carried out through the pictures of desulphurization slag recorded in the experiment. Figure 6 shows the relationship curve between Si/S0 and temperature during the melting process of four different alkalinity desulphurization slags. Relation curve between Si/S0 and temperature during the melting of desulphurization slag. Main components (%) and the range of desulphurization slag.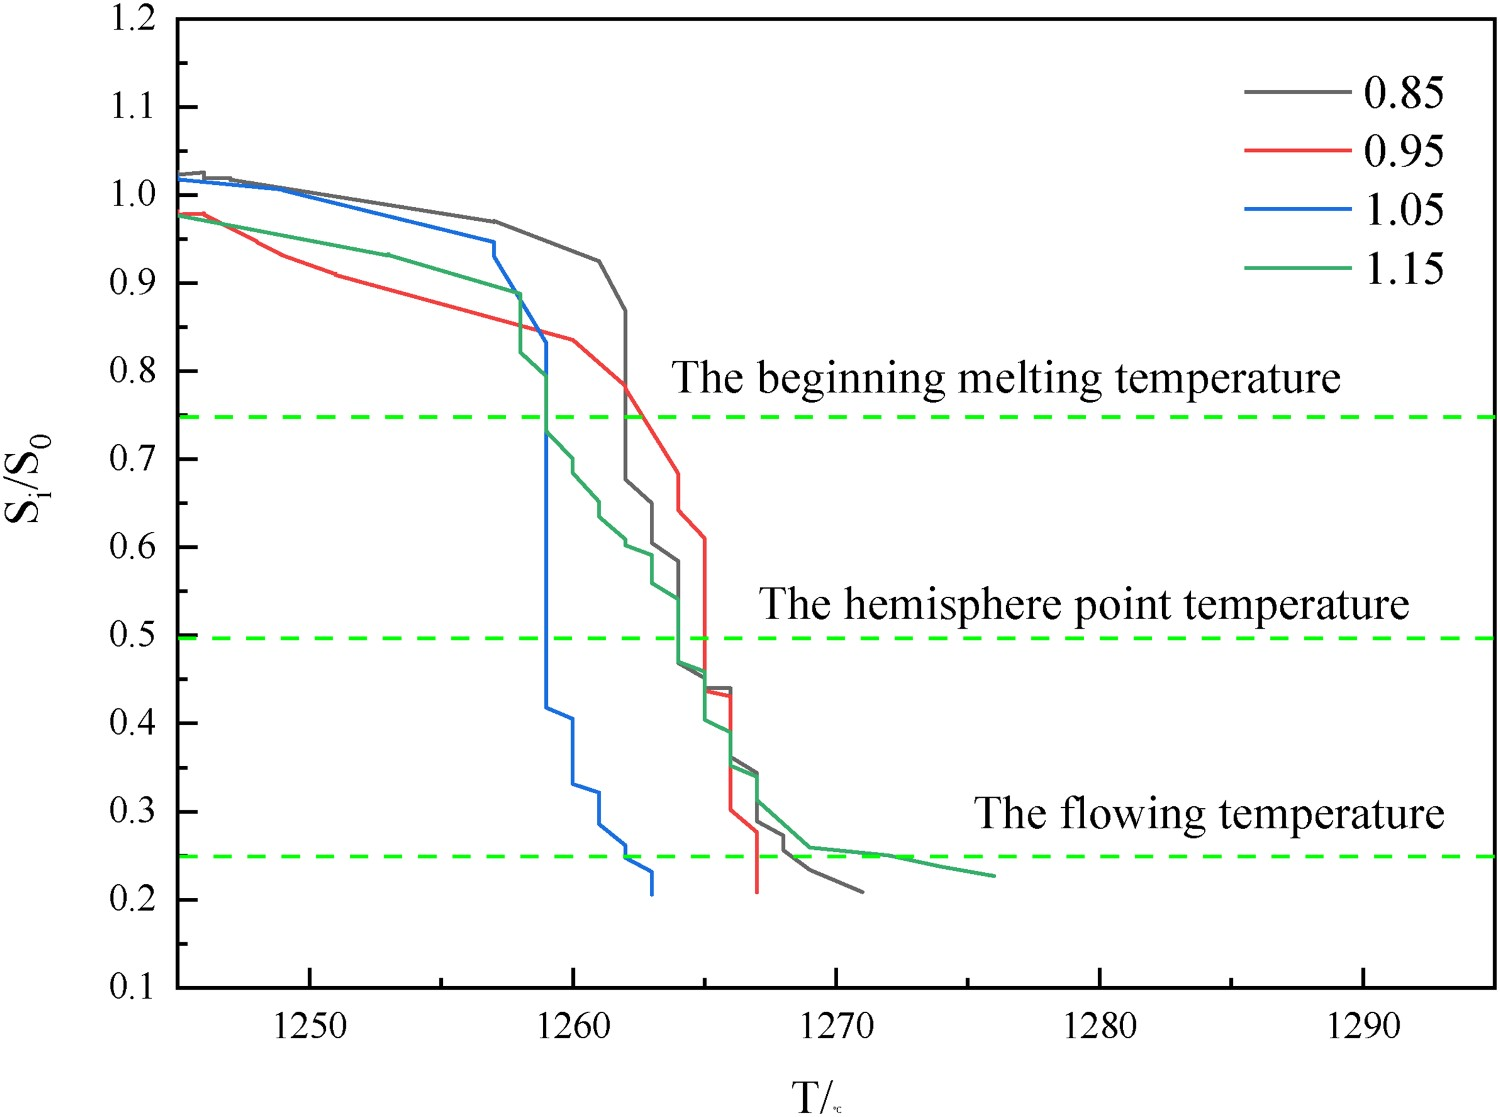
Comparison of melting temperature of desulphurization slag.
The comparison of melting temperature after basicity refinement of desulphurization slag is shown in Table 4. According to Table 4, the hemispheric point temperature of the binarization treatment results of desulphurization slag is 1°C lower than that of the experimental results, and the flowing temperature of them continues to be consistent. The measured beginning melting temperature of acid slag (R = 0.85) is 2°C higher than that of the image processing result, and the beginning melting temperature of acid slag (R = 0.95) is 2°C higher than the image processing result. When the alkalinity of the desulphurization slag increases to 1.05, the beginning melting temperature of both slag is the same, and the beginning melting temperature of the alkaline slag (R = 1.15) is 3°C higher than the image processing result. The reason for the deviation is analysed through the binary treatment process of desulphurization slag with additional alkalinity. Figure 7 shows the binary treatment process of desulphurization slag with different alkalinity. (a,d,g,j) Beginning melting temperature; (b,e,h,k) Hemisphere point temperature; (c,f,i,l) Flowing temperature. Binary treatment of alkalinity of different desulphurization slags.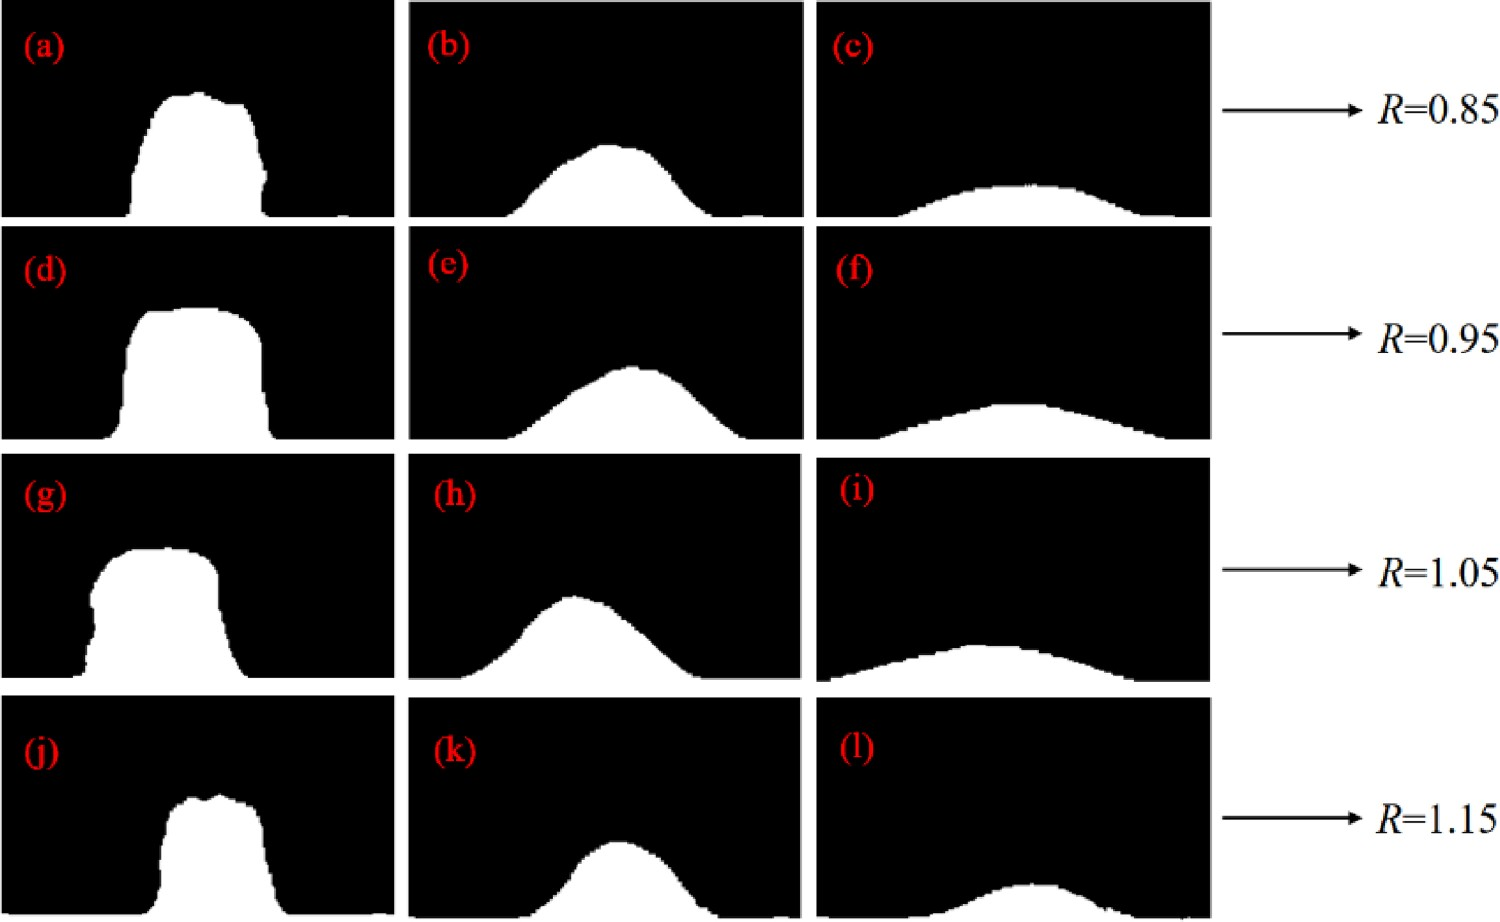
Figure 7 shows the degree of irregularity above the image when the desulphurization slag with different alkalinity begins to melt is more complicated than that when it reaches the hemispheric point temperature, while in the picture above the slag when it melts 75% is smooth and intact. The binary image display results are consistent with the deviation of the two slag evaluation methods. It shows that the results of the binary treatment of slag melting properties are universal.
It can reflect the melting process of the slag
In the process of melting, slag will be expanded [15,16]. Wang Dubin [17] pointed out in the research on the treatment and application of high titanium type blast furnace slag that the treatment of high titanium type blast furnace slag has always used two methods of water flushing and dry slag, of which the water flushing slag cannot be used as building aggregate due to its small particle size. Dry slag can be used as building material, but its cost is too high, and the process treatment is complex, so it is not used in large quantities. Therefore, a kind of lightweight, high-strength, high-quality energy saving and environmental protection building material was obtained by expanding the high titanium furnace slag. It can be seen that the expansion has a positive impact on the utilization of solid waste slag. The expansion of desulphurized slag generated in the desulphurization process of hot metal pretreatment is conducive to the aggregation and condensation of slag aggregation and improves the productivity of slag raking [18–20]. However, the traditional slag evaluation method cannot reflect the expansion performance of slag at low temperatures, that is, the lack of real-time process changes in slag expansion. Figure 8 shows the evolution in the desulphurization slag sample taken during the experiment with the temperature rise. If you do not carefully observe, it is difficult to keep the expansion of the desulphurization slag during the temperature rise. The slag in Figure 8 shall be binarily treated, and the relationship curve between Si/S0 and temperature during the melting process of desulphurization slag shall be drawn, as shown in Figure 9. Variation of desulphurization slag with temperature. Relation curve between Si/S0 and temperature during desulphurization slag melting.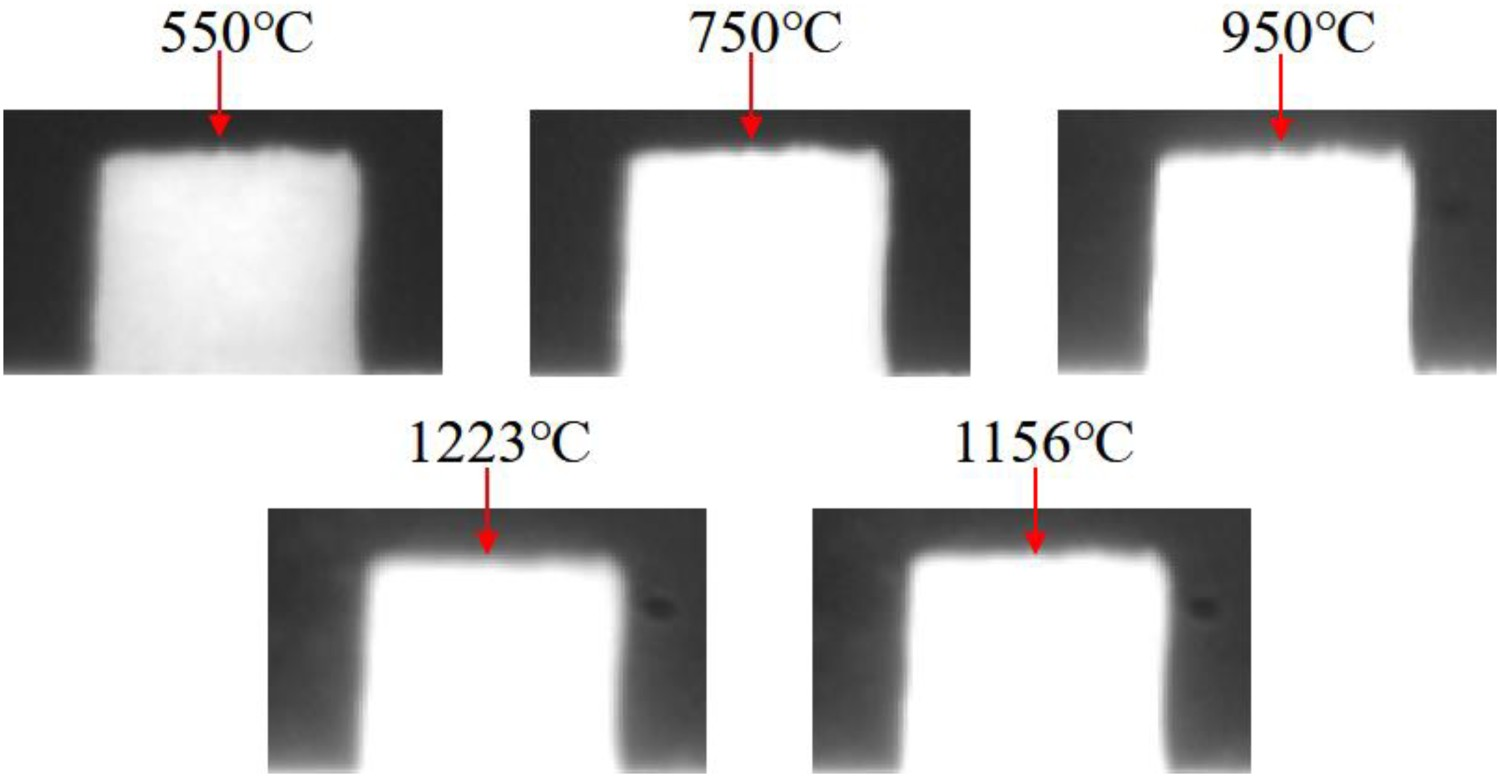
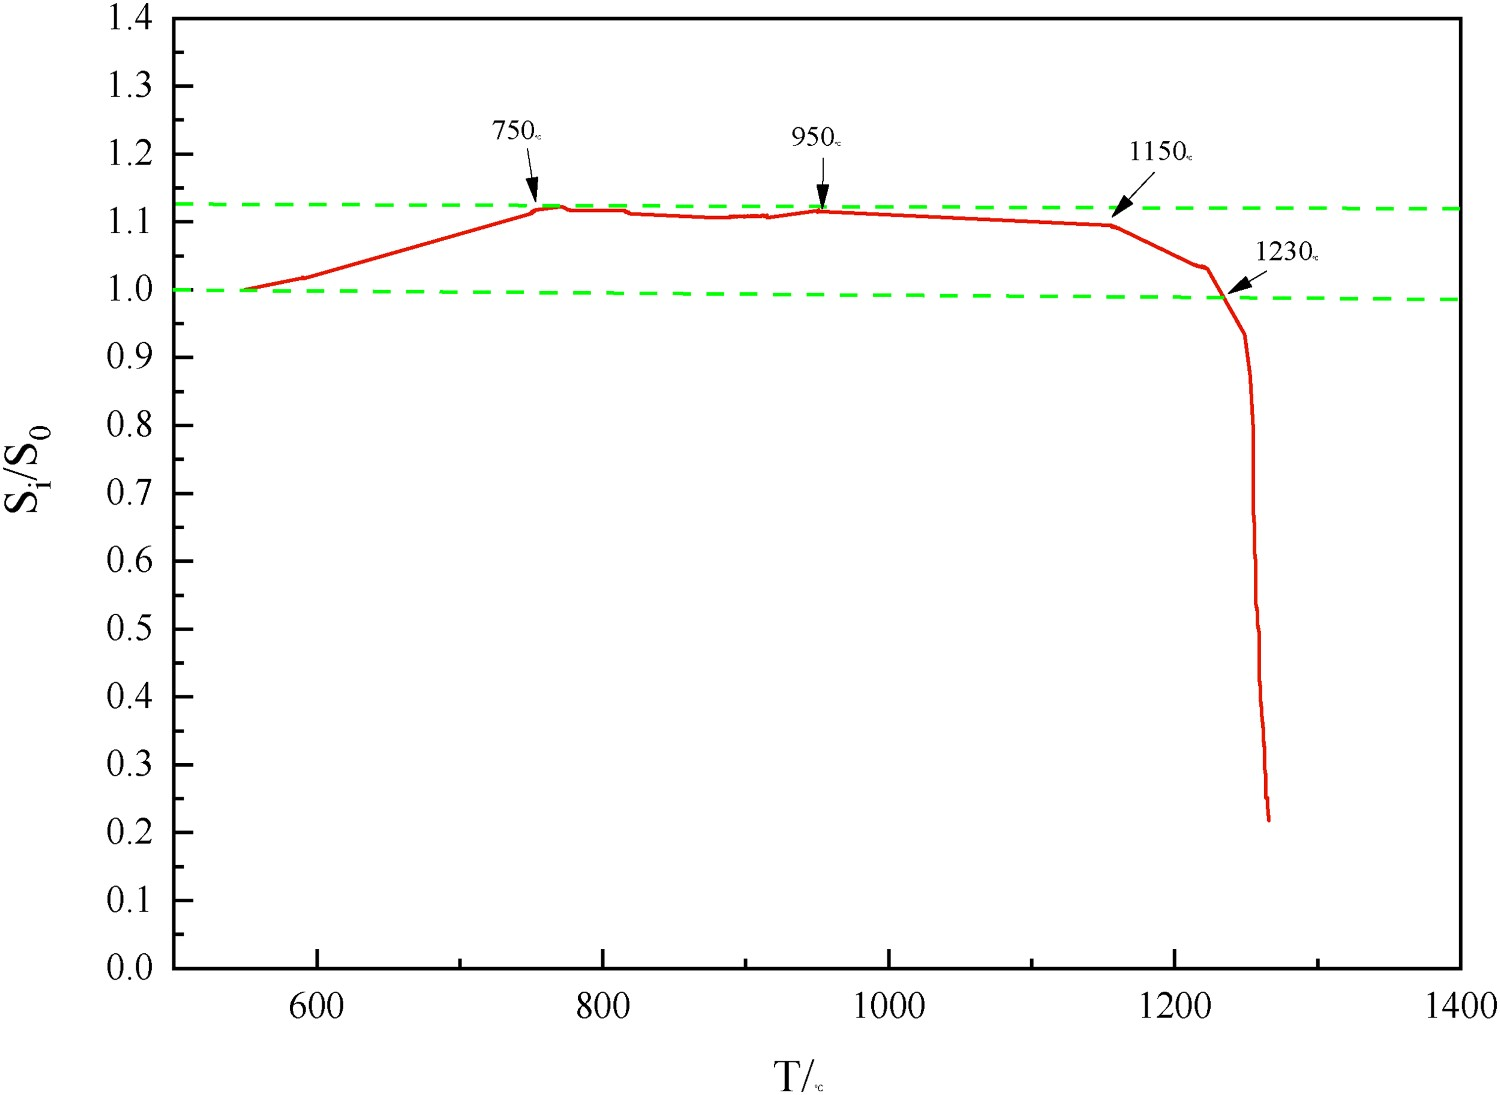
With the increase in temperature, Figure 9 shows the expansion of desulphurization slag becomes more and more intense. The expansion reaches the maximum at 750°C, and the Si/S0 is about 1.12. From 750°C to 950°C, the desulphurization slag almost no longer expands. When the temperature reaches 950°C, the desulphurization slag starts to shrink, and the expansion rate of desulphurization slag decreases. This is because some low melting point compounds in the desulphurization slag, such as melilite and clinopyroxene, begin to melt. When the temperature reaches 1150°C, the shrinkage and melting speed of the desulphurized slag are accelerated, and they return to the initial height at about 1230°C. The whole expansion process of the desulphurized slag is completed. Through binary processing of the captured image and drawing the relationship curve between Si/S0 and temperature, the change law of the melting process of desulphurization slag can be fully displayed, which is conducive to studying the details of the slag melting process, such as the expansion performance of low-temperature slag, and improves the shortcomings of traditional slag evaluation methods.
Conclusion
Because of the shortcomings of traditional slag evaluation methods in evaluating the slag melting performance with a high degree, a new way for evaluating the slag melting performance is proposed. The image at any time in the melting process is taken, and the image is binarized to obtain the real-time surface area in slag heating and melting. The area change rate is obtained from the real-time area and the initial area, and the melting performance of the slag is evaluated by the area change rate. Through the comparative study of the experimental data of the melting performance of desulphurization slag with different alkalinity and the results of binary treatment, it is found that the data after binary treatment of the slag melting process are more accurate and universal, which can comprehensively evaluate the slag melting process. The binary processing of the slag melting process image can show the change rule of the low-temperature slag expansion process, which improves the shortcomings of traditional slag evaluation methods.