
Abstract
The cross-sectional profile of hot-rolled silicon steel strips has a great impact on the transverse thickness difference of cold-rolled strips. The genetic algorithm - Levenberg Marquardt - backpropagation neural network model was developed for the analysis of heredity effect of the cross-sectional profile of hot-rolled strip. The feature importance was analysed based on random forest and extreme gradient boosting methods. Furthermore, the influence law was analysed by data visualization. The coupling term of the strip crown and thickness , the edge drop and the coupling term of the strip wedge and thickness are recommended as key indexes of the hot-rolled silicon steel strip. As the transverse thickness difference must be controlled below 7 μm, the corresponding , , should be controlled no more than 60, between -10∼10 μm and no more than 7.5 , respectively. Meanwhile, the requirement for the cross-sectional profile indexes is synchronous.
Introduction
Cold-rolled silicon steels are mainly used to manufacture generators, motors and transformers. The cold-rolled silicon steels are punched into pieces, then stacked and pressed, and finally made into the rotors and stators of generators, motors and transformer cores. To improve efficiency and reduce iron loss, the number of silicon steel laminations is increased. Therefore, the requirements for the uniform thickness of silicon steel strips are very high, which presents higher requirements for the cross-sectional profile of silicon steel strips [1].
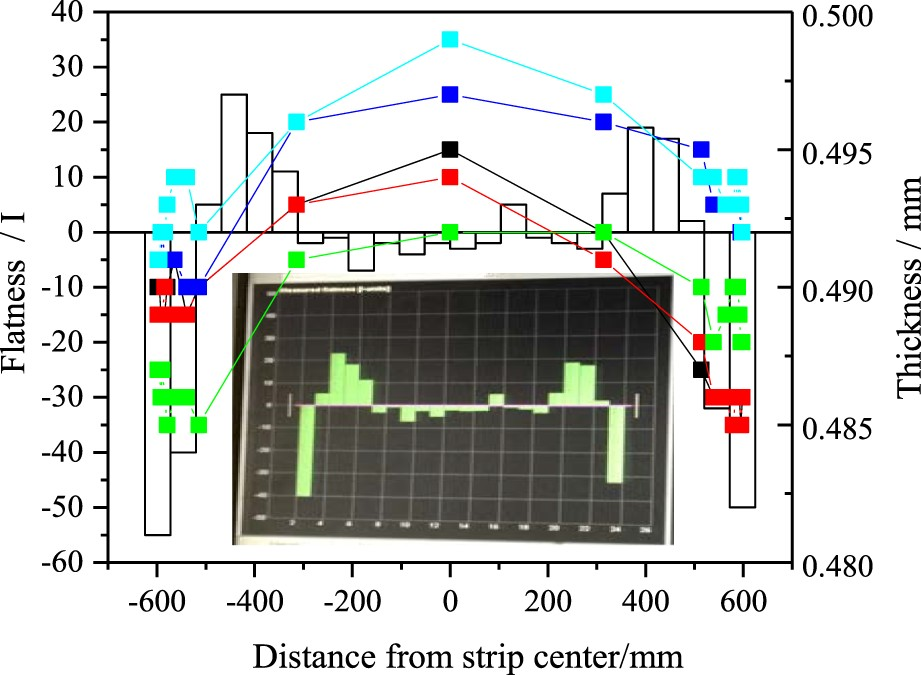
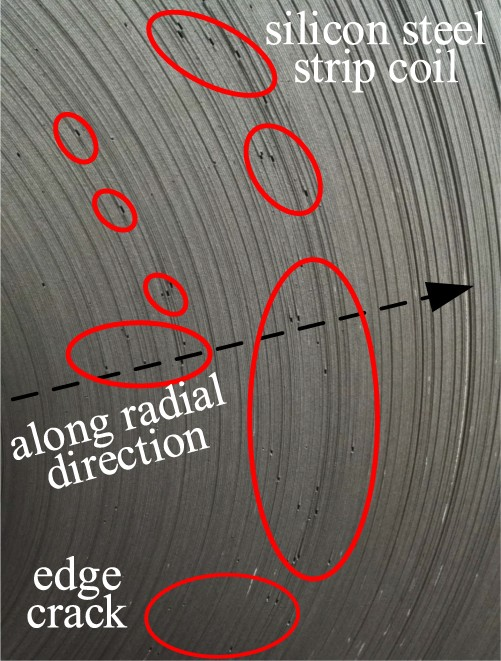
The transverse thickness difference (TTD) of cold-rolled silicon steel, Edge drop and quarter buckle of silicon steel. Edge crack of silicon steel strip.


As mentioned above, the control domain for the TTD of CRSSs is much smaller than that of hot rolling due to flatness defects and edge cracks. The cross-sectional profile of HRSS is key to reducing TTD [4,12]. The hot-rolled cross-sectional profile has an obvious impact on the TTD of CRSSs. The requirements for the cross-sectional profile of HRSSs are higher than those for conventional hot-rolled steel strips. The incoming slabs of a single-stand reversible cold rolling mill of silicon steel are produced by the 1580 mm hot rolling production line. Due to the small output demand for silicon steel, the 1580 mm hot rolling production line conducts silicon steel production in the interval of producing ordinary carbon steel, alloy steel and other steel grades. Generally, the cross-sectional profile requirements of other hot-rolled steel grades are relatively low, and the crown index 

How to reasonably set the shape control targets of HRSSs is very important to reduce the TTD of cold-rolled silicon steel strip. It is necessary to deeply explore the heredity effect of the key indexes of the HRSS cross-sectional profile on the TTD of the CRSS to fine-tune the cross-sectional profile index system of HRSSs. The prediction and configuration of plates or strip crowns in hot rolling processes have always been popular in the research of plate and strip profiles [12]. The transcription rate and the heredity coefficient are well used in the research of the heredity from crown to flatness in rolling hot strips [13]. An approximately equal proportional crown [14,15] is a famous heredity principle of the strip profile in hot rolling and is widely applied to set the strip crown at each outlet of the stand in tandem to maintain a good shape. However, with the unceasing rise in the requirements for shape quality, the heredity principle of an approximately equal proportional crown has increasingly highlighted its limitations, and some revised models have been developed. The proportional crown distribution model was improved considering the transverse flow coefficient of the HRSS and raised the shape control effect [16]. The effect function method was developed to calculate the crown effect rate of HRSSs and to analyse the coupling influence of the initial crown with other factors. The initial rate of the crown effect varied with strip width in the type of parabolic curve [17]. With the progress of computing technology, the high-precision prediction of plate crowns has gradually become a popular research topic, which has weakened the research on the heredity effect of cross-sectional profiles in rolling processes. An aspect of research is to establish mechanism models that meet the boundary constraints and predict the strip profile based on the process parameters [18,19]. To reflect the initial crown heredity effect of hot rolling slabs on the strip shape at the outlet of the finished stand, the outlet strip crowns of each hot tandem rolling were calculated based on the influence function method [20]. The result show that the heredity effect of the incoming slab crown of HRSSs that reaches the finished product can be ignored. Tieu et al. analysed the heredity of the hot-rolled coil ridge profile with respect to the ridge-buckle defects of thin cold-rolled strips based on a numerical model [21]. Because rolling plastic deformation belongs to the problem of high coupling, nonlinearity, and large deformation, the conventional mechanism model often has difficulty accurately describing the essence and relationship of cross-section profile heredity.
In recent years, machine learning algorithms have developed rapidly in the prediction of strip crowns and the heredity effect of cross-sectional profiles. Hüseyin Altinkaya et al. employed an artificial neural network to obtain the optimal parameters for a different type of rail-rolling process [22]. Deep neural network (DNN) models for the prediction of the strip crown in hot rolling showed the highest prediction accuracy compared to the artificial neural network (ANN) and optimized ANN using the non-dominated sorting genetic algorithm [23]. Ji et al. [24] proposed an optimized support vector machine (SVM) model for the prediction of strip crowns. Sun et al. [25] established a prediction model for HRSS crowns based on the random forest (RF) method, and it showed stable performance compared to the SVM and regression tree (RT) methods. Wang et al. [26] proposed hybrid forecasting models for strip crown and flatness by combining the genetic algorithm (GA), mind evolutionary algorithm (MEA), principal component analysis (PCA), and multilayer perceptron (MLP) neural networks. To analyse the influence weight of multidimensional input variables, a crown prediction model of HRSSs based on neural networks was proposed [27], and the importance of input features was analysed using sensitivity methods. The Tchaban algorithm for sensitivity analysis was integrated with a backpropagation neural network (BP) to establish the T-GA-BP neural network to predict strip thickness [28], providing a reference for the neural network application research.
Rather than substituting the cross-sectional profile indexes of HRSSs as variables to analyse the influence of incoming HRSS crowns on the subsequent CRSS shape, the above machine learning algorithms are based on hot rolling specifications, equipment parameters, forces and temperatures to predict the HRSS crowns and analyse the influence of hot rolling process parameters on the HRSS flatness. Silicon steel strips require high-quality control of the cross-sectional profile. The typical cross-sectional profile of a silicon steel strip is shown in Figure 3. There are certain correlations, synergies, and nonlinear relationships between the strip cross-sectional profile indexes. In particular, the shape control techniques of silicon steel strips have evolved from the control of crown and flatness to that of edge drop and other comprehensive indexes [13]. The nonlinearity of the heredity effect of the hot-rolled silicon steel cross-sectional profile is more prominent. It is of great significance to reveal the mechanism of influence of the hot-rolled silicon steel cross-sectional profile indexes on the TTD of CRSSs. Schematic diagram of cross-sectional profile of hot-rolled silicon steel strip.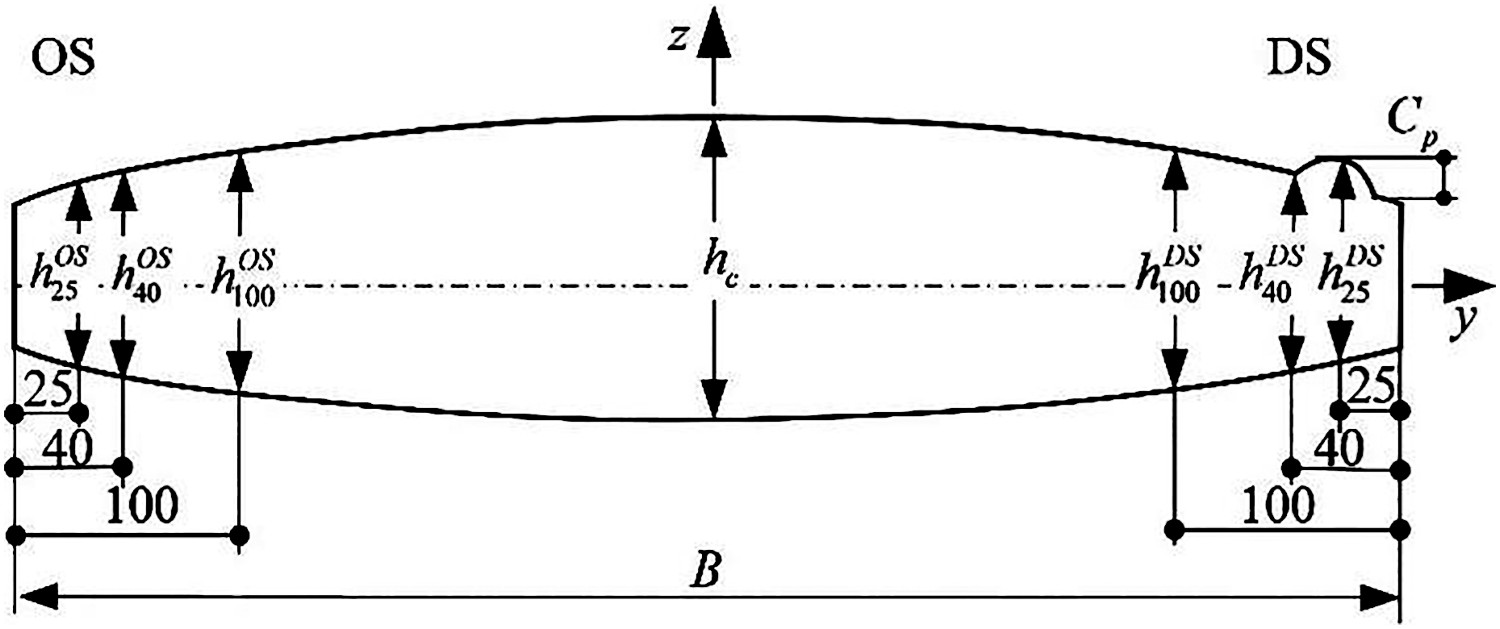
To fully study the effect of the heredity of HRSS cross-sectional profiles on the TTD of CRSS, Li et al. [29] analysed the information of hot and cold silicon steel coils based on statistical methods and pointed out that the large crown and wedge of HRSSs would lead to serious edge drop of CRSS. Zhang et al. [30] proposed the evaluation method of pass heredity coefficients, established the matrix relationship between the TTD and the shape control means, and developed a formula for the ratio of the TTD to the comprehensive crown of HRSSs. In the early stage of our investigation, we used the method of numerical simulation and statistical principles to study the profile heredity law of hot and cold-rolled silicon steel strips and presented the goals for finely controlling the parameters of the hot rolling process [31].
Compared with the conventional mechanism model, machine learning methods are powerful tools for describing the essence of nonlinear heredity. Currently, there are few reports on machine learning methods for the profile heredity law of hot and cold rolled steel strips, especially silicon steel strips. A single-layer BP neural network was established to predict the TTD of CRSSs according to the cross-sectional profile indexes of HRSSs, and the ridge regression method was used to analyse the influencing factors [32]. Previous research showed that the profile heredity effect of hot and cold rolled silicon steel strips was non-linear, and ridge regression, as a linear regression method, had a natural defect in dealing with the non-linear heredity effect of strip profiles.
To fully understand the highly nonlinear heredity effect of HRSS cross-sectional profiles on the TTD of CRSSs and to establish optimal and scientific control objectives of HRSSs, BP neural networks and genetic algorithms were used to establish a prediction model to fit the TTD according to the cross-sectional profile indexes of HRSSs, and the importance of the feature was discussed by means of sensitivity analysis and verified with grouping prediction of the neural network. Then, the influence law of the HRSS cross-sectional profile indexes on TTD was analysed through data visualization. Finally, reference was given to the control standard of the HRSS profile.
Description of silicon steel strip profile and analysis of data characteristics
Cross-sectional profile indexes of hot-rolled silicon steel profile
The cross-sectional profile indexes of HRSSs mainly include crown, wedge, and edge drop among others, as shown in Figure 3. The crown represents the difference in thickness between the middle and the two sides of the strip. Wedge and edge drop are the differences in thickness of the two sides of the strip and the two positions near one side of the strip edge, respectively. The symbols 


where 


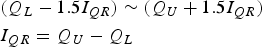
According to the definition of crown and edge drop, the following relationship can be obtained:
Analysis of data characteristics
The data used in the neural network modelling are the measured cross-sectional profile indexes with a total of 3176 groups of hot and cold rolled silicon steel strips from a plant. The objective-dependent variable is the TTD, 
In fact, it is almost impossible to point-to-point correspond the cold rolling process data, the cross-sectional profile indexes of HRSSs, and the TTD of the sampling point of CRSSs, e.g. the real-time wear of the rolls can hardly be recorded and correspond to the TTD of sampling position. Therefore, in the situation of small fluctuation range of process parameters and large number of statistical data, it is assumed that the influence of cold rolling on the TTD basically remains at a certain level.


Input features.
Sample size of TTD of collected data groups.
Modelling of neural networks
Data pre-processing
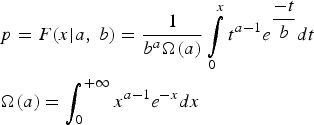
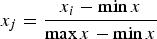
The following data pre-processing and neural network modelling programming were performed in Matlab and Python. The feature data are divided into four categories: normal distribution, gamma distribution, exponential distribution, and no obvious regular distribution. For feature data without an obvious statistical distribution, the box chart is used to clean abnormal data. It uses the quartile to describe the discrete distribution of the data in the box chart. The description range is limited by Equation (1), and data outside the range are abnormal values.


The statistical features that are relatively concentrated or without obvious distribution are the grade, 


The statistical features that approximate the normal distribution include the HRSS crown Features approximately obeying normal distribution.


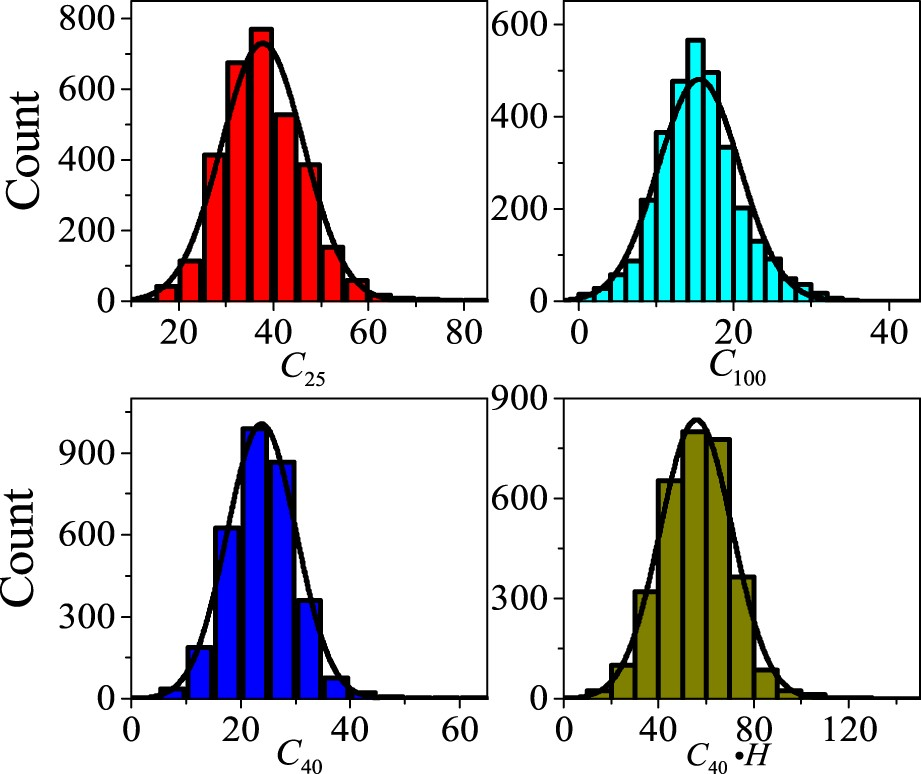
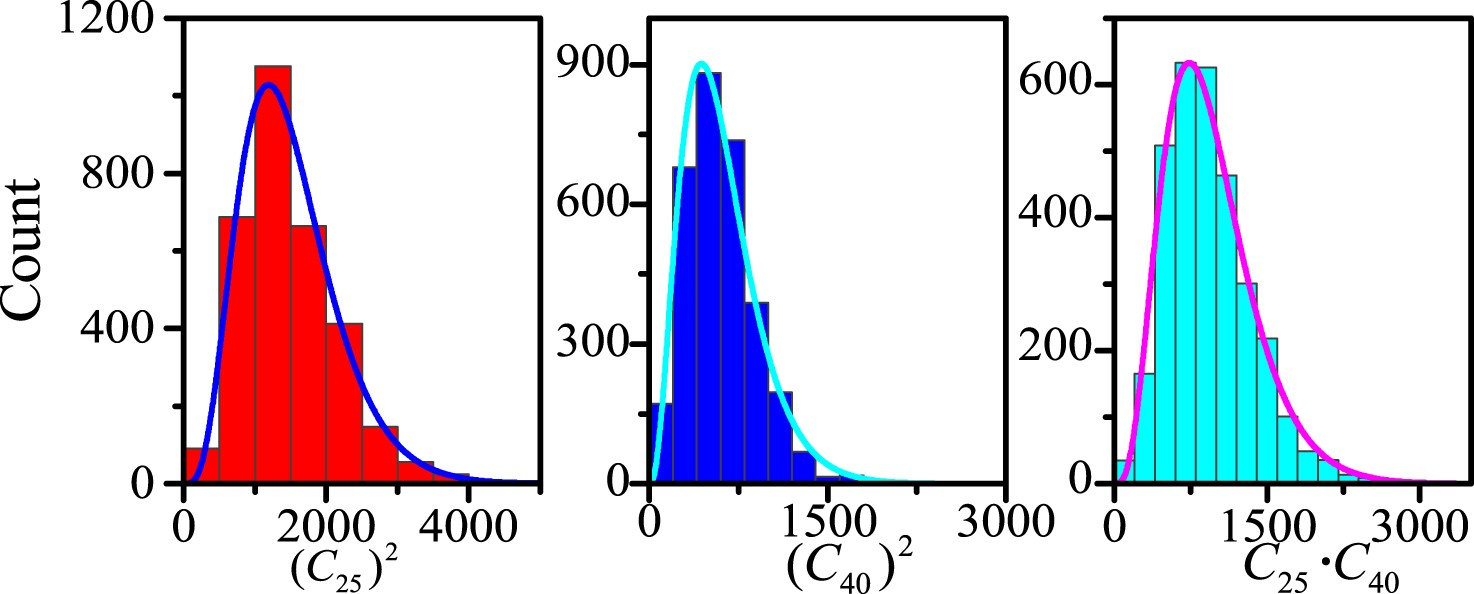
The abnormal data with a normal distribution are formulated according to the principle of Equation (2). That is, outliers are identified as low probability events. The feature data approximately obeying the gamma distribution include the second-order variables of the HRSS crown, Features approximately obeying gamma distribution. Features approximately obeying exponential distribution.


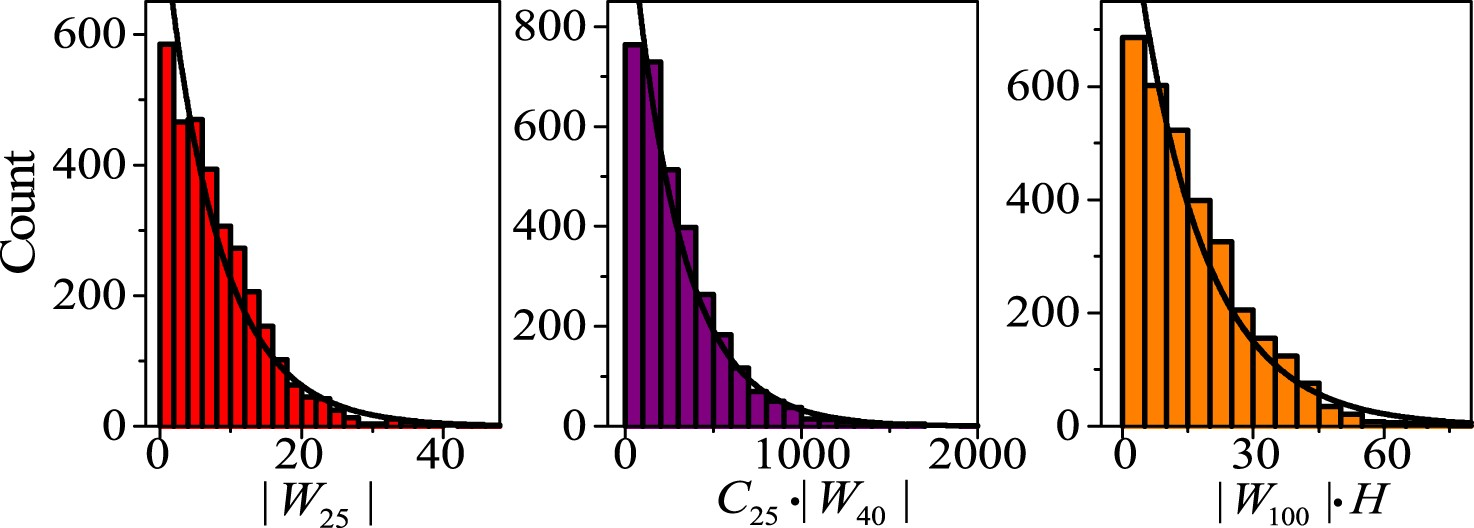
For data approximately obey these two distributions, the data within 99.7% of the cumulative density will be retained, and the other portion would be labelled as abnormal data. That is, the data is greater than 


where 


Finally, 2929 data groups were obtained after the abnormal data was deleted.
Normalization of data


Features of partial features.
Modelling of neural networks
The BP neural network is a feedforward neural network that uses the BP algorithm to train multilayer networks. In practical applications, BP neural networks are widely used in classification, regression prediction, function approximation, etc. Therefore, in this paper, a BP neural network and appropriate computing methods are used for optimization.
Activation function and loss function
Among them, the activation function is used to complete the non-linear transformation of the data. Commonly used activation functions include 


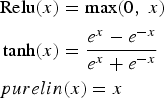
The loss function is used mainly to judge and update the threshold and weight. And the loss function of the regression problem generally selects the mean square error (MSE) function. Here, the mean square error function is selected as the loss function.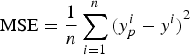


Number of neurons and number of neuron layers
The number of neurons has a great influence on the fit of the neural network. If the number is too small, the model is simple, and the fitting effect will be poor; if the number is too large, the model is complex and difficult to fit, resulting in an excessively long fitting time. However, to date, there is no definite formula for the number of neurons in the hidden layer. The number of neurons in the BP neural network can be determined by an empirical formula, as shown in Equation (7):


MSE performance of BP neural network under different numbers of neurons (test set).
The number of layers of neurons plays an important role in the non-linear fitting of the neural network. In existing research, there is no better method to determine the number of neuron layers, which can only be determined under actual debugging. The MSE of the three hidden layers is relatively small as shown in Table 5, showing good performance. The layer structure of the BP neural network obtained after final debugging is shown in Figure 7. The network structure is 26-13-18-25-1; that is, the network structure includes 26 neurons in the input layer, 13 neurons, 18 neurons, and 25 neurons in each hidden layer, and 1 neuron in the output layer. BP network structure. MSE corresponding to different numbers of hidden layers.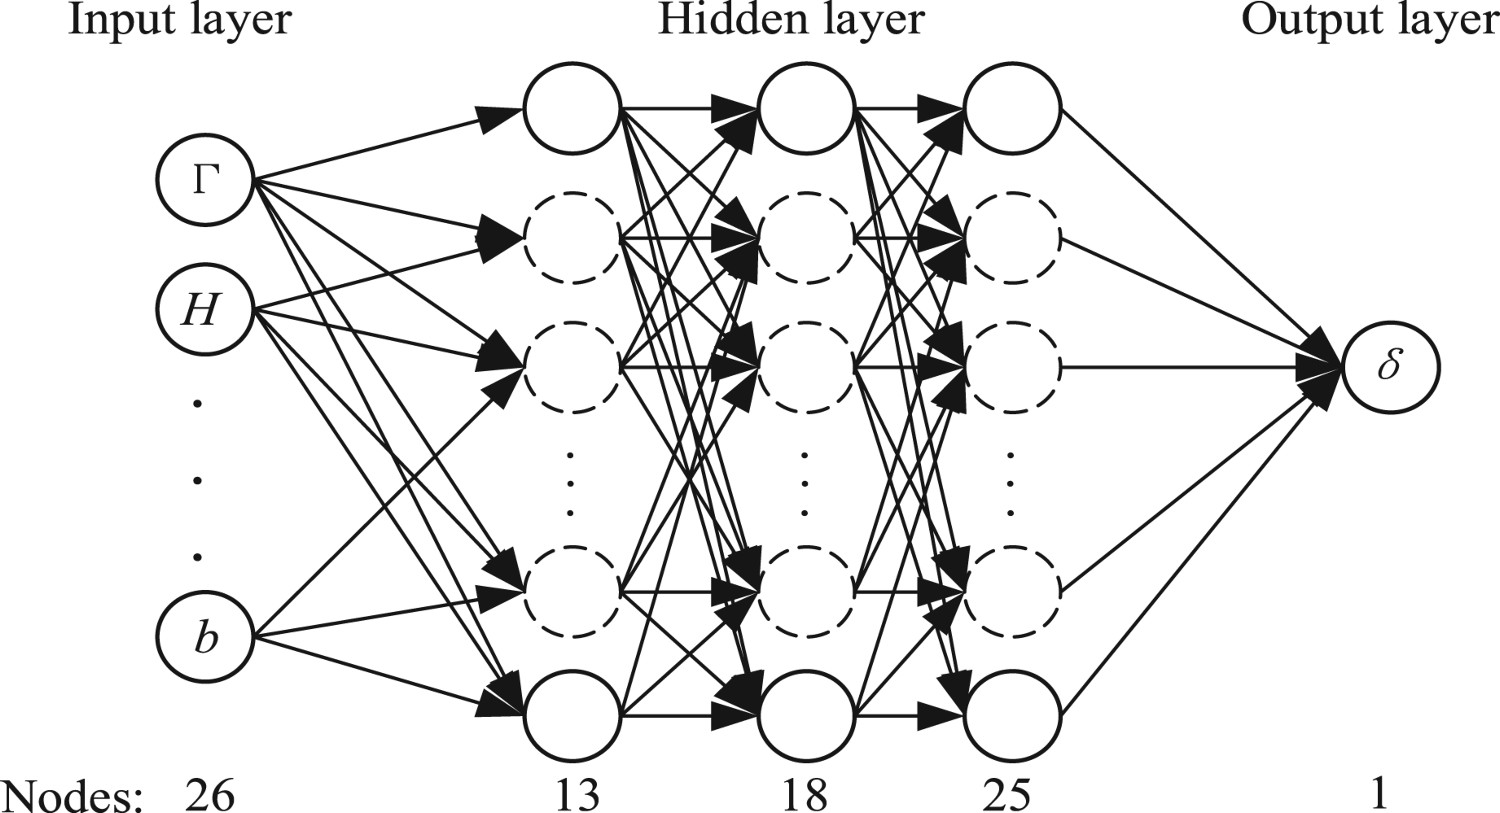
Training method
Results of optimization methods for BP neural network.
In this paper, the LM optimization algorithm is selected to optimize the neural network. The process is shown in Figure 8. LM algorithm flow chart for TTD prediction.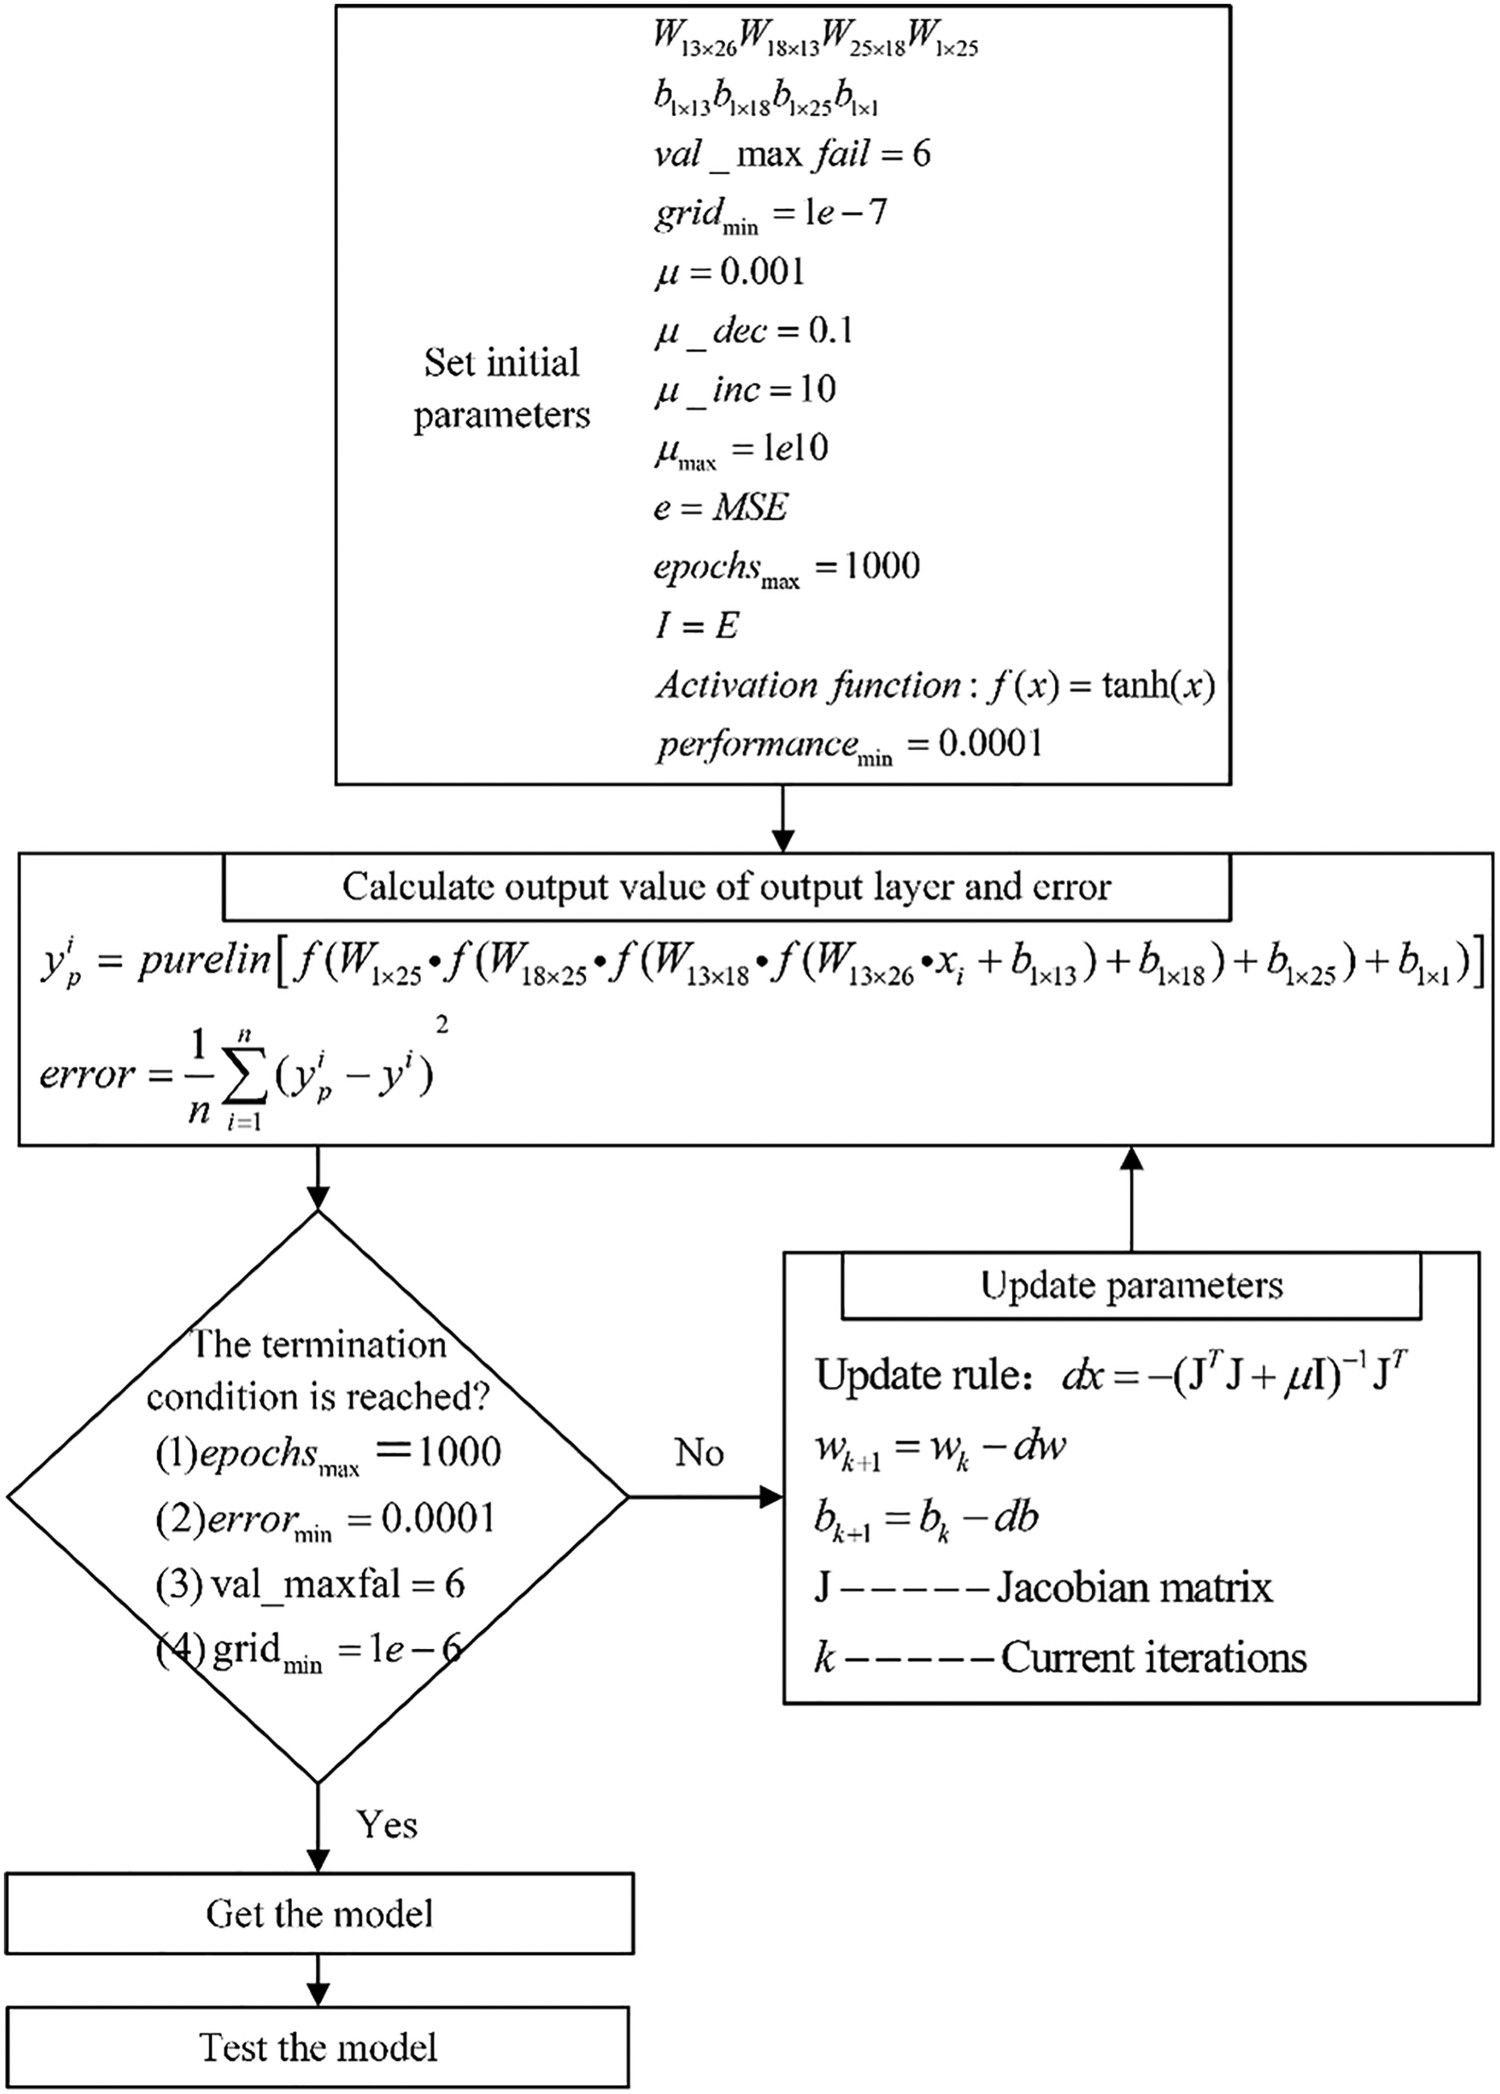
Optimization method
The initial weight and threshold of the BP neural network are generally set by directly assigning random numbers. Initial weight and threshold play a very important role in the training and final fitting of the neural network. The genetic algorithm (GA) is one of the algorithms used to solve optimization problems. In this paper, a GA is used in the neural network to optimize the initial weight and threshold. The process of BP neural network optimization by GA is shown in Figure 9. Flow chart of GA-BP algorithm for prediction of TTD.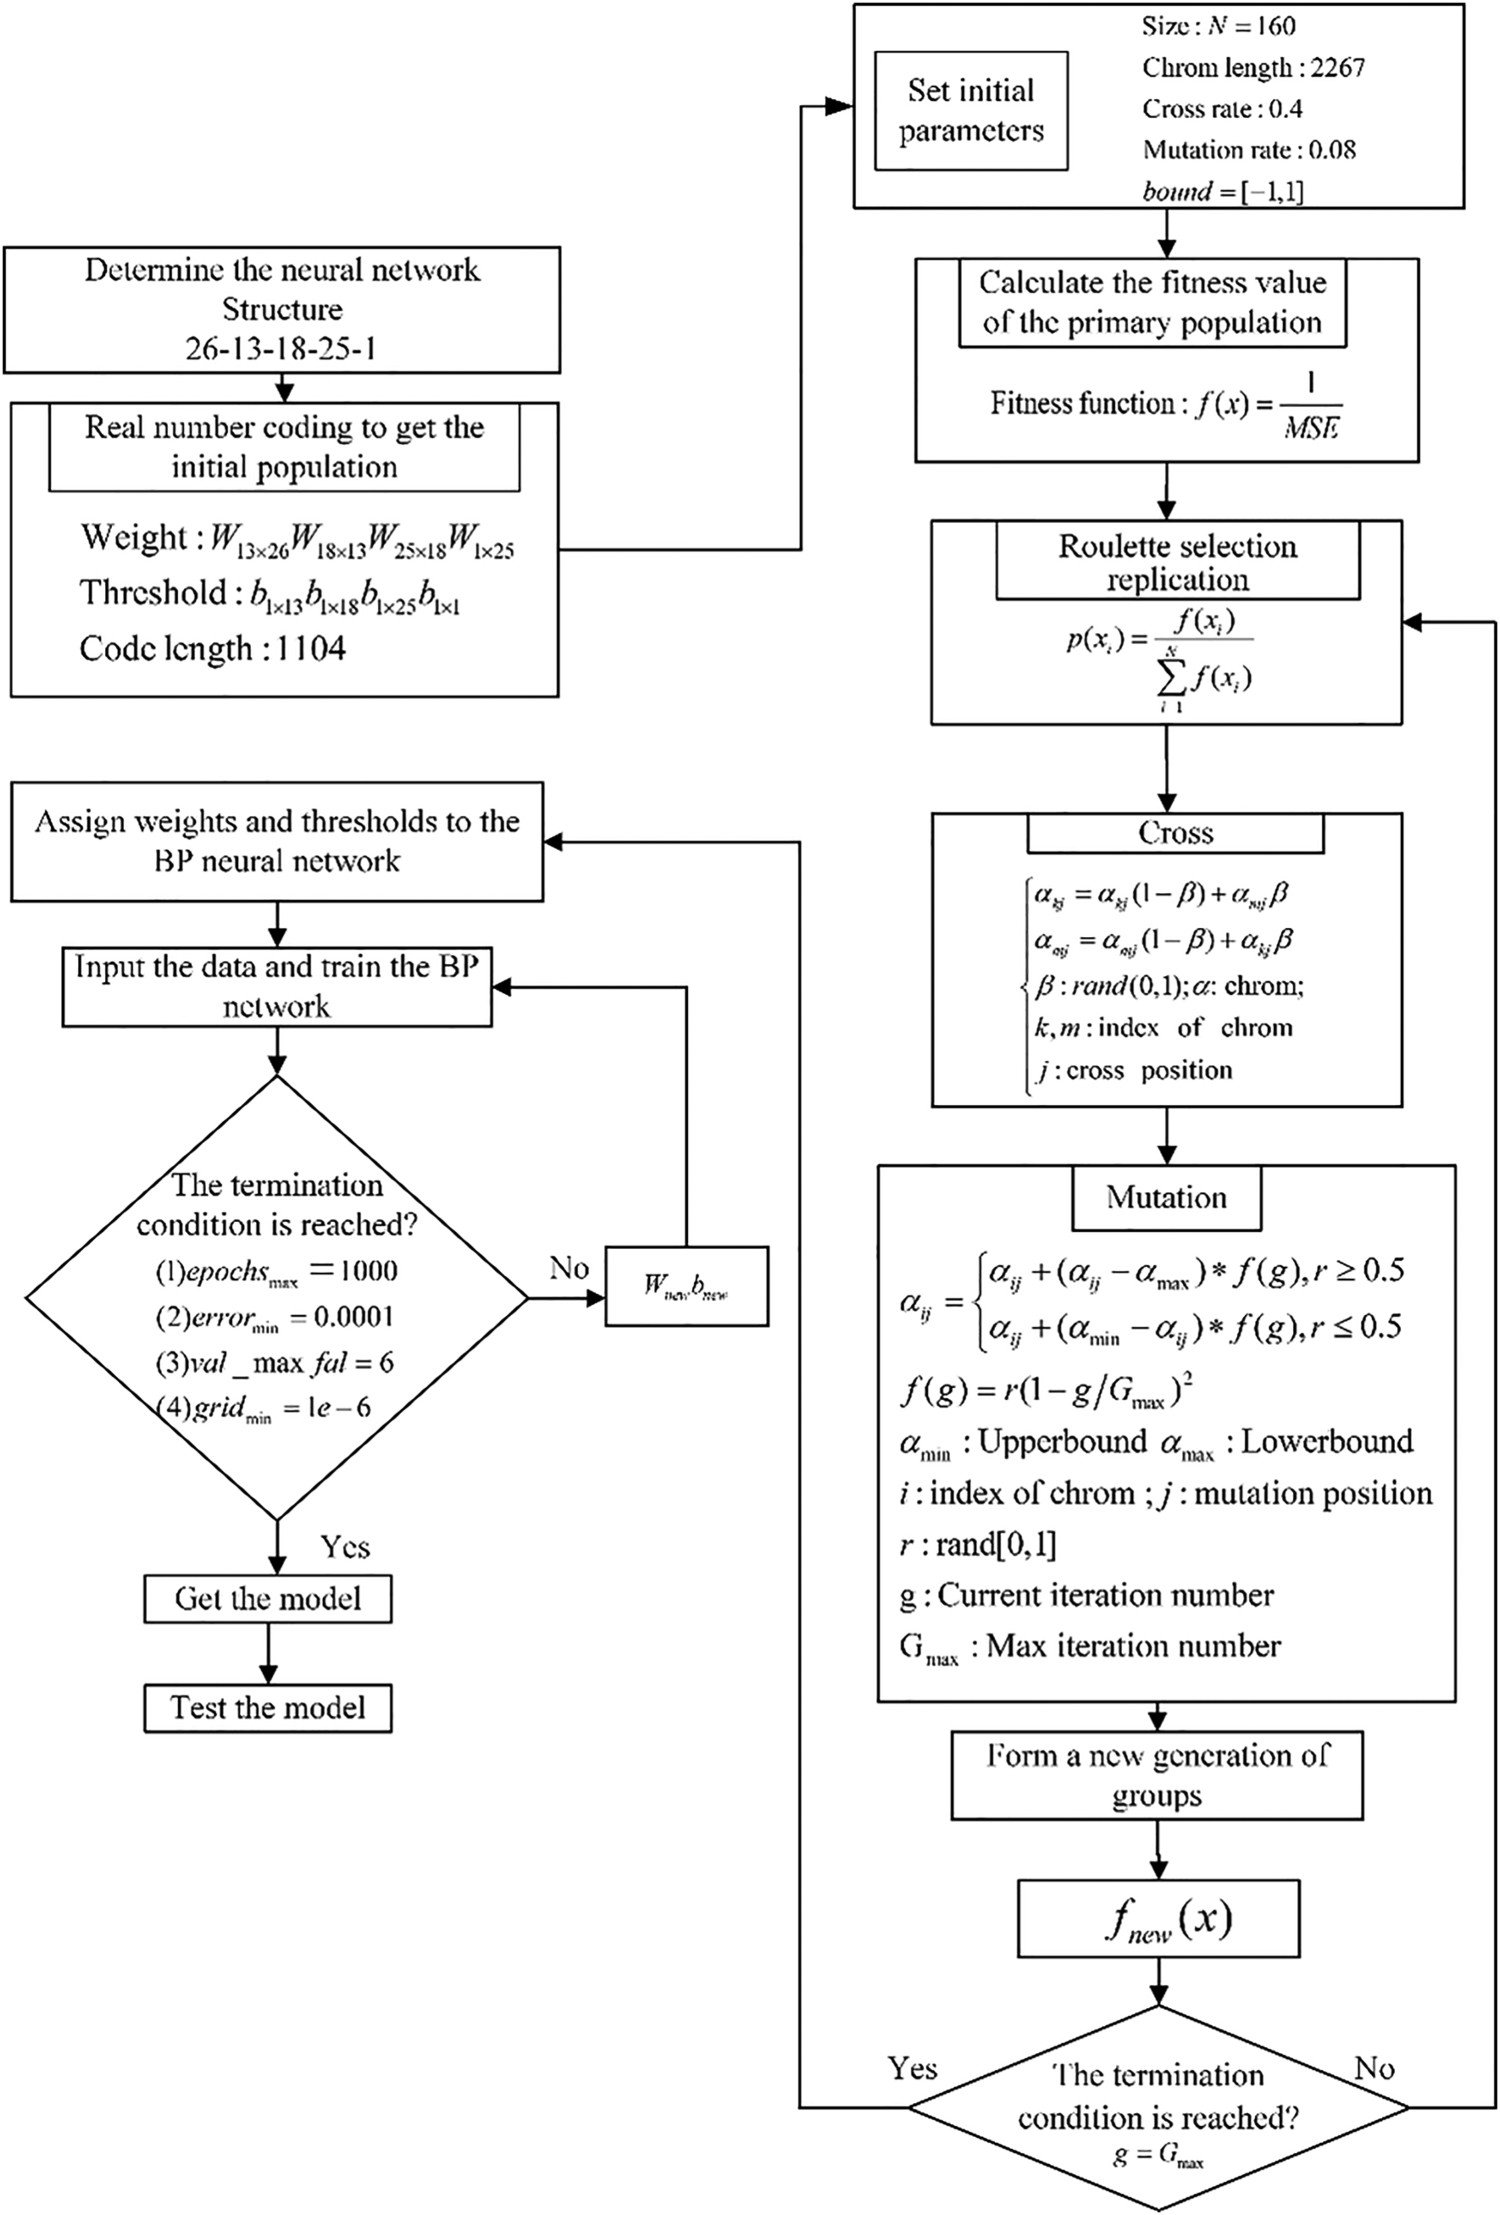
Results and discussions
Performance of GA-LM-BP neural network
After correcting the abnormal data, the cross-validation method is used for data grouping; that is, it is randomly divided into a training set, verification set and test set according to the ratio of 8:1:1. A total of 2343 groups of data are used for neural network training, 293 groups of data are used to verify the neural network to avoid overfitting, and another 293 groups of data are used to predict and verify the generalization ability of the models.
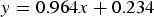
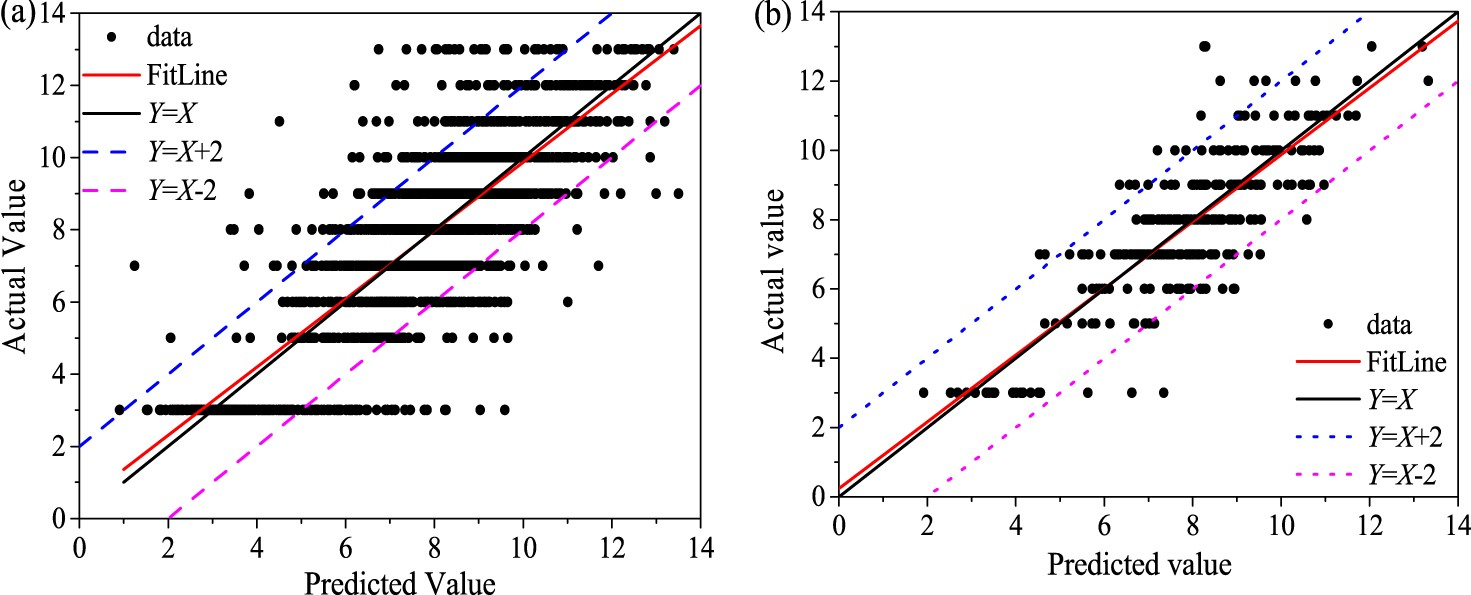
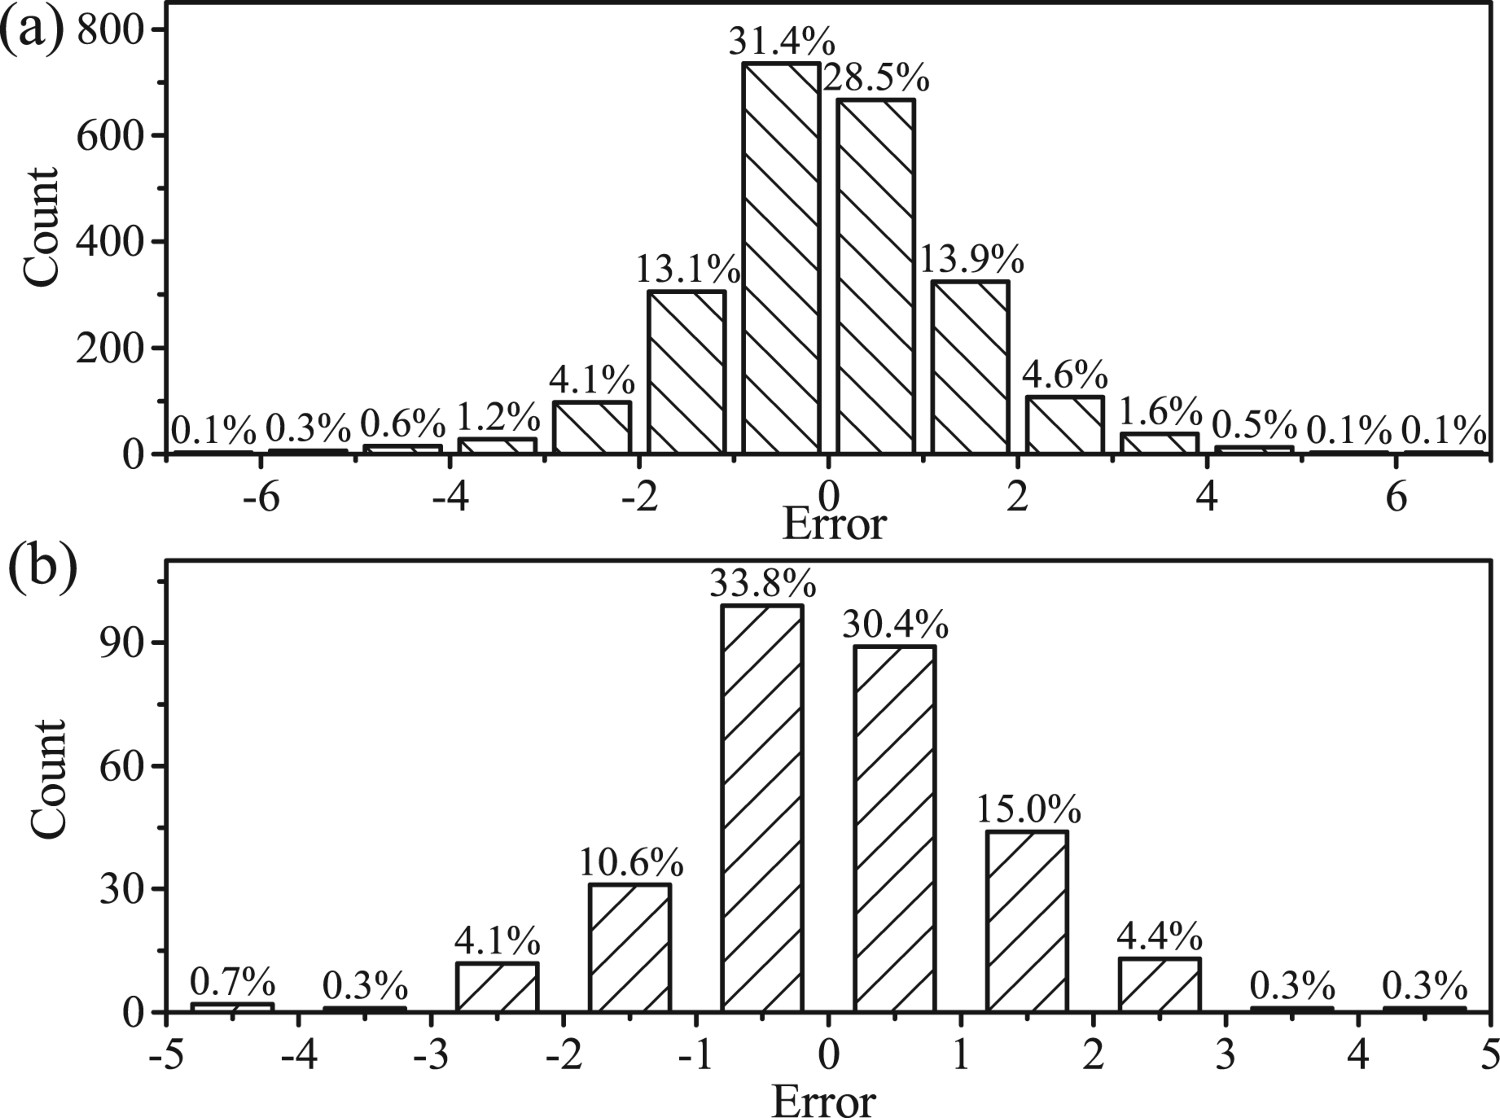
The regression results after training are shown in Figure 10. The abscissa is the actual value, the ordinate is the predicted value, the solid line is the fitting line between the target value and the predicted value, and the fitting line equation is listed on the lower right side of the figure. Figure 10(a,b) are the regression results of the training set, and the test set, respectively. The corresponding fitting line equations are Regression results after training (a) training set, (b) test set. Sample error bar graph: (a) train set and (b) test set.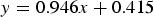
The mean absolute error (MAE), mean absolute percentage error (MAPE), root mean square error (RMSE), determination coefficient (

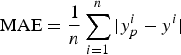
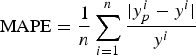
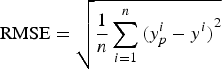
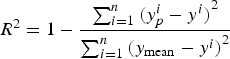
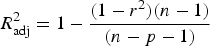
where 


MAE and MAPE of each TTD.


Moreover, we further established the training model based on the random forest (RF) and extreme gradient boosting (XGBoost) methods, performed regression prediction analysis, and compared the importance of input features. RF is an algorithm that integrates multiple decision trees and belongs to the category of integrated learning. It is a very flexible algorithm with high accuracy. It can run through large datasets without reducing its performance and process high-dimensional features datasets without reducing its dimensionality. Another function is evaluated to demonstrate the importance of the features. Its evaluation principle is to apply noise interference to each feature. The greater the range of change in the evaluation performance, the greater the importance of the feature to which noise is applied.
XGBoost is a kind of integrated learning method. Its core idea is to fit the error of the last prediction by continuously adding decision trees. After training an amount of trees, the corresponding scores of leaf nodes in each decision tree are added to be the predicted value of the sample. The advantage of the XGBoost algorithm is that the score that indicates the importance of each feature can be obtained directly after the tree is created. In general, the score weighs the importance of features in the construction of the decision tree model. The more a feature is used to build a decision tree in the model, the higher its importance.
The Performances of training set and test set based on three methods.


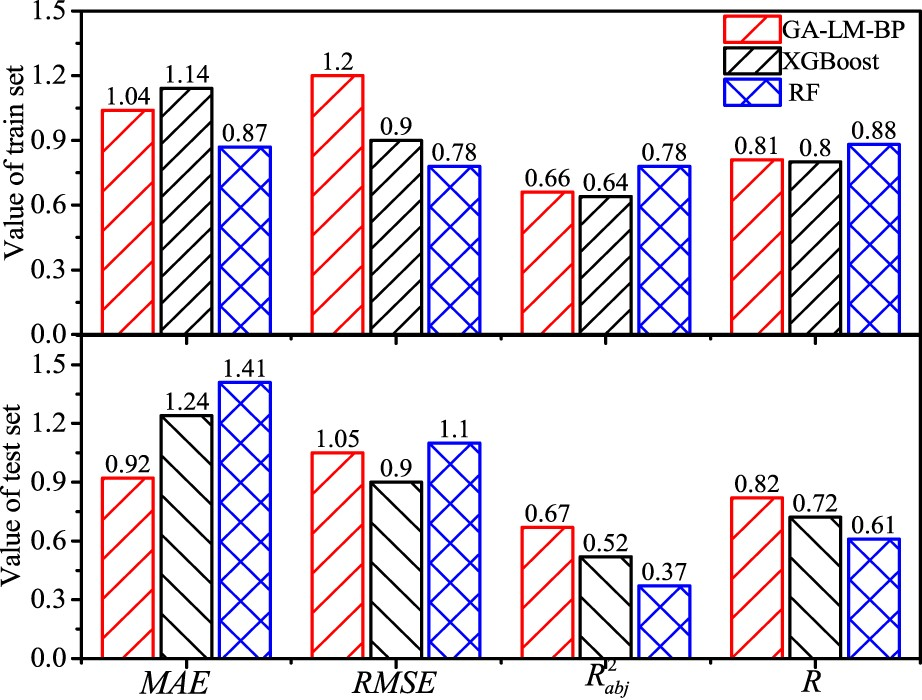
According to the analysis of the regression results, the correlation between the cross-sectional profile indexes of the hot-rolled silicon steel strip and the TTD of the CRSSs is very high, showing that the cross-sectional profile indexes of the HRSSs are an important factor affecting the TTD. Relatively speaking, as a large number of data are used for analysis and mining, the effect of the cold rolling process on the TTD is limited. In general, the neural network method is relatively superior in analysing the effect of the HRSS cross-sectional profile on TTD.
Importance of feature


Feature importance ranking.
Figure 13 shows the importance weight of the ranking features obtained by the RF and XGBoost methods. The importance weights of the first three features, the thickness Importance ranking order of features.


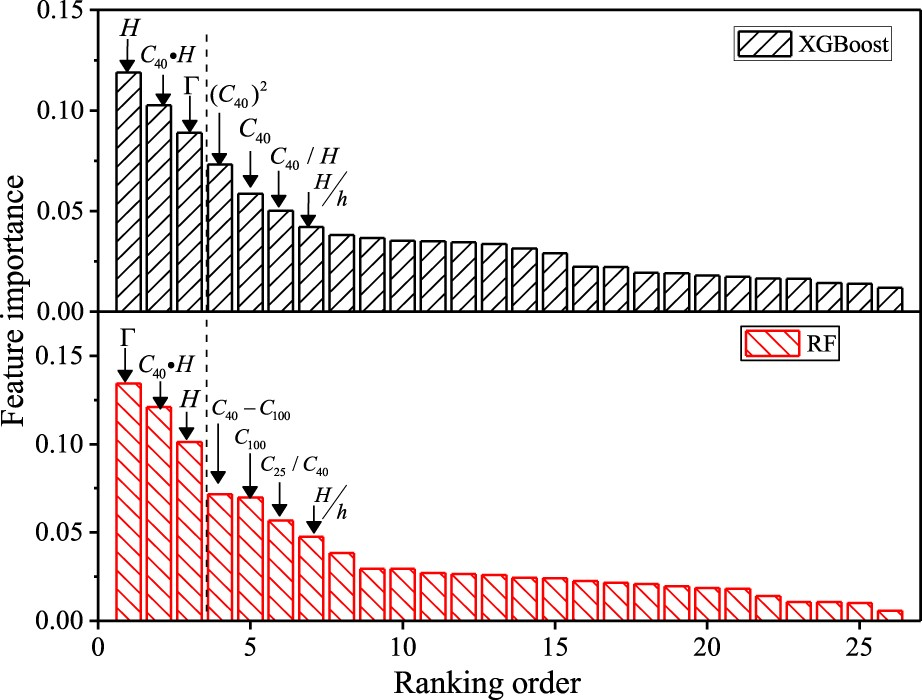
Among these features, the coupling terms of crown and thickness 


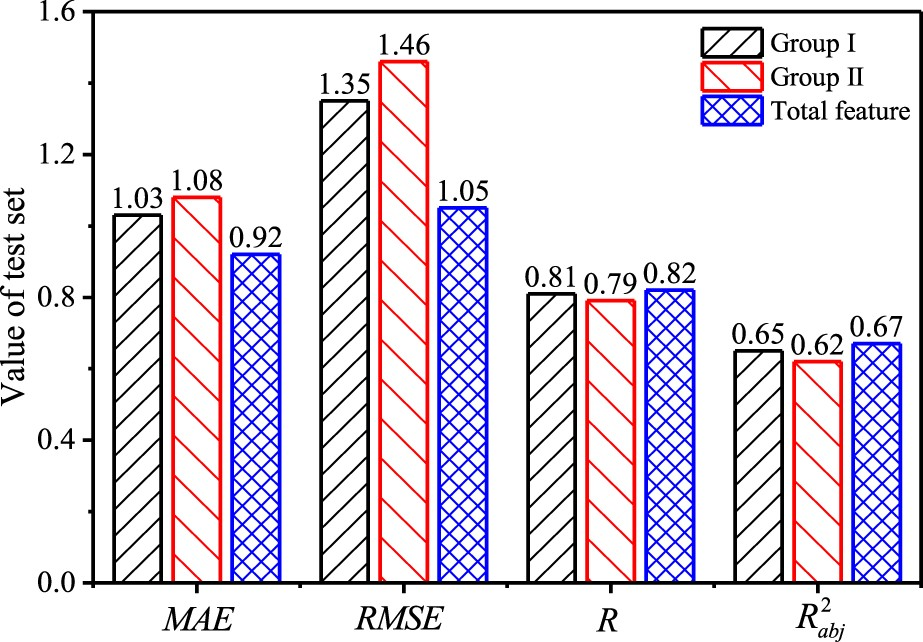
Features in two groups.


The target feature of the two groups is the TTD, and the performance evaluation indexes of the total samples and the test sets trained by Group I and Group II are compared in Figure 14. The Performance evaluation indexes of test sets trained by different groups.


Based on the above analysis, we focus on the key indexes of hot rolled strips. To further analyse the influence law of the key indexes, we carried out some experiments and visualized the collected data.
Effect of thickness ratio
The changes in both the thickness ratio 


We found that the TTD of the 0.5 mm thick CRSS was larger than that of the 0.35 mm thick strip. To verify the effect of the thickness ratio, we carried out experiments in a rolling unit. The thickness of HRSS in the unit was increased to 2.6 mm and then cold rolled to a 0.5 mm thick strip ( Effect of thickness ratio on TTD in experimental and conventional rolling (a) average TTD (b) percentage of TTD grade (c) comparison of cross-sectional profile indexes (d) thickness ratio and TTD distribution.


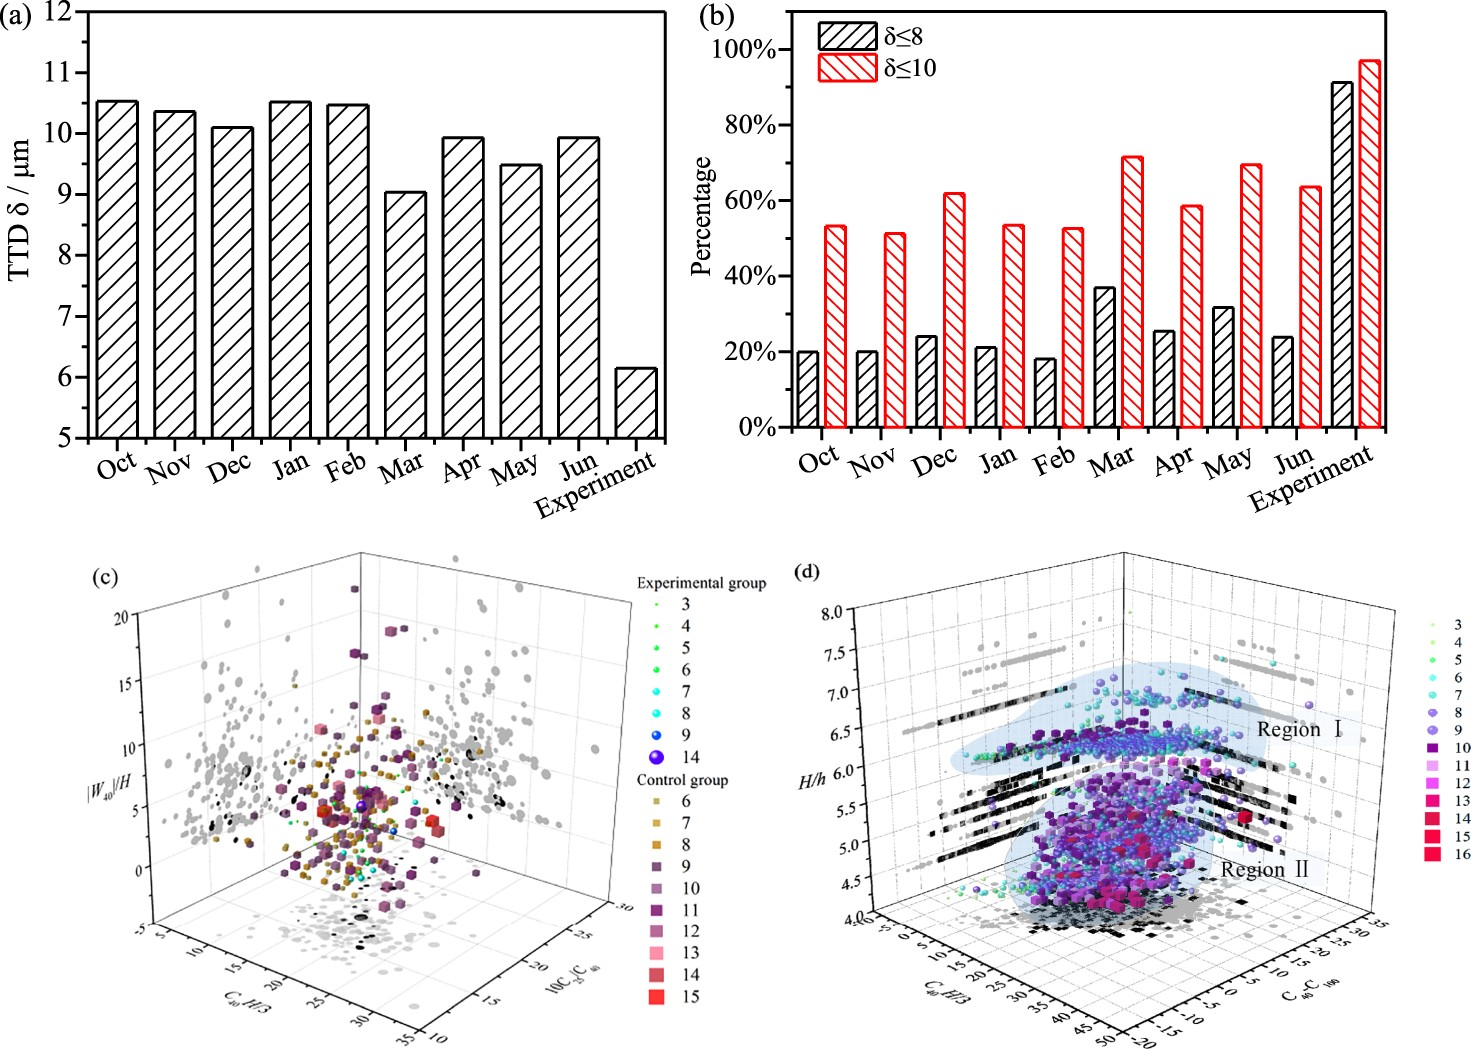
In order to further intuitively display the effect of thickness ratio 


In fact, there are always specified heavy gauge transition coils in the conventional hot rolling unit, as shown in Figure 16(a,b). Zone I contains the specified transition coil of silicon steel, and the silicon steel is located in Zone II. Hot-rolled commercial strips or carbon steel strips are arranged before Zone I and after Zone II. In Zone I, the thickness of the silicon steel strip changes from 2.8 to 2.2 mm to adapt to the gradual stability of the roll thermal crown. Although the crown target of the silicon steel strip in Zone I is the same as those in Zone II, statistics show that the TTD of the CRSSs corresponding to these HRSSs is not particularly small. In fact, the actual crown and edge drop of the strip in Zone I of Figure 16(a) are larger than those with a thickness of 2.2 mm in Zone II. In particular, the flatness and crown of the strip steel in Zone I fluctuate greatly, resulting in a high probability of wedge indexes fluctuating, as shown in Figure 16(b). Although the thickness ratio of the hot and cold rolled strips in Zone I is large, the TTD of cold-rolled silicon steel is not small due to the large indexes of wedges, crowns and edge drops. Strip crown and wedge vary in a rolling unit (a) crown indexes (b) wedge indexes.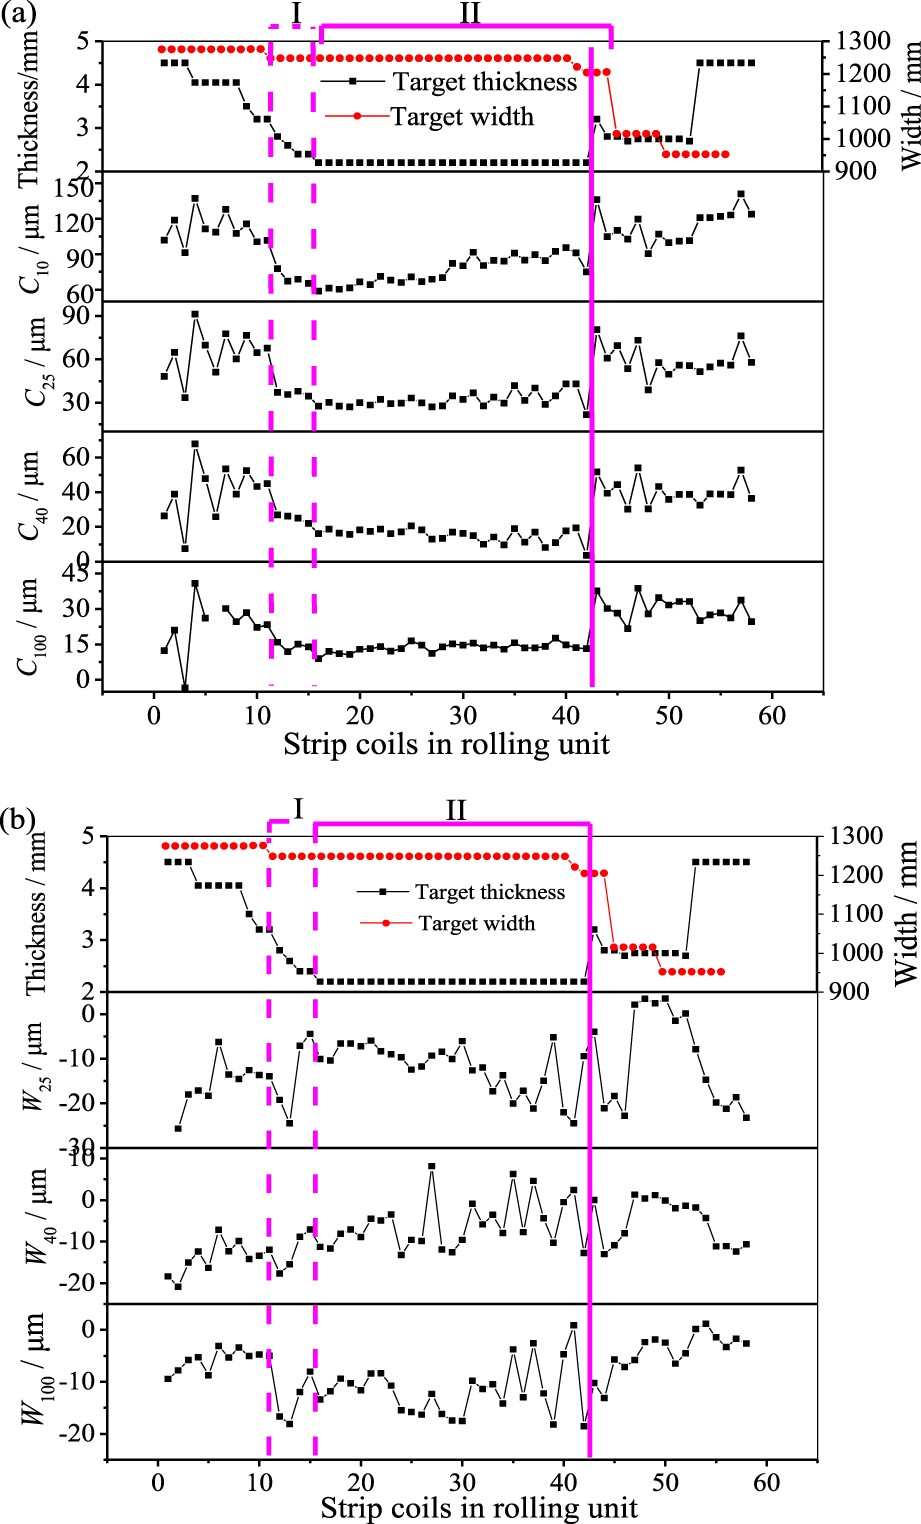
The fact that a proper large thickness ratio is conductive to reducing the TTD to a certain extent may be affected by the work hardening of strips. The larger the thickness of the incoming slab, the greater the accumulated deformation and the more obvious the hardening of the steel strip. Then the deformation resistance of the steel strip increases. Finally, the edge drop in the last pass decreases in the case of roughly equal rolling force. However, increasing the thickness ratio will increase the production cost, which needs to be optimized according to the user demands, profits, and costs.
To verify the results of the sensitivity analysis and the importance of the feature, we use the key feature as coordinates to visualize the distribution law of the TTD of the CRSSs varying with the key features of the HRSSs, and the results are shown in Figure 17. According to the results of sensitivity analysis, the key features mainly include steel grade Effect of 


Effect of crown or wedge and thickness coupling term and edge drop
The distributions of the scatter cloud were established by taking 


The scattered points are distributed along a spatial slope A in Figure 17(a). There are two typical regions I and II. In Region I, all TTDs are distributed in the range of 5∼10 μm, and the corresponding indexes 


Figure 17(b,c) are the distribution law of the TTD of the CRSSs with the mean value of 


Although the regularity of average-to-point data is slightly worse than that of point-to-point data, in general, the scatter-point distribution laws corresponding to the two methods show that the effects of the coupling term of strip crown and thickness 


Recommended standards of key index values


Recommended standards for profile index values of hot-rolled silicon steel strip.


Conclusions
To develop the control indexes of hot-rolled silicon steel strips and predict the TTD of CRSSs according to the HRSS information, the GA-LM-BP neural network was developed for the regression of data and compared with the performance of the RF and XGBoost methods. Next, the sensitivity analysis method was used to classify the importance of the input features. The key features were discussed and verified by group-dividing training through the neural network. Then, visual analysis of cold and hot rolling data was performed based on the key features obtained, and the influence law of the HRSS key profile indexes on the TTD was analysed. Finally, key index values of the cross-section profile of the hot rolled strip on the TTD were recommended. Our conclusions are summarized as follows: On the basis of the GA-BP neural network algorithm, the heredity effect model of the cross-sectional profile of the HRSS on the TTD of the CRSS was established. Compared to the RF and XGBoost methods, the GA-LM-BP neural network makes the regression result of the neural network more accurate. The importance of the input features was ranked based on the sensitivity analysis of the RF and XGBoost methods, and the key features were discussed and verified by group-dividing training through the neural network. The results show that, in addition to the inherent features of the steel grade Data visualization indicate that an appropriate large thickness ratio As the TTD of the CRSS is required to be controlled below 7 μm, the corresponding


Footnotes
Disclosure statement
No potential conflict of interest was reported by the author(s).
Author contribution
Xiaobao Ma: Data acquisition, Investigation, Problem analysis, Writing original draft, Resources, Model, Funding acquisition. Bao Ma: Review, Model, Investigation, Writing original Draft, Jiangjiang Li: Editing, Test, Validation. Peng Chen: Resources, Review & Editing. Yongheng Peng: Investigation, Editing. Zhongkai Ren: Investigation, Writing & Editing, Supervision.
Declarations
Data availability statement
The datasets used and/or analysed during the current study available from the corresponding author on reasonable request.