
Abstract
Confocal laser scanning microscopy was used to perform experiments with various cooling rates for the solidification of Al-Ti deoxidised steel. The effects of cooling rate on the morphology, size distribution of observed with typical inclusions, Al2O3, TiS, and Al2O3-TiS in the steel were investigated. The experimental results demonstrate that the inclusion morphology is significantly influenced by the cooling rate. With an increase in cooling rate, the number of inclusions smaller than 3 μm rises while the number of inclusions bigger than 3 μm continues to fall. The number density of the inclusions increases gradually with the increase of the cooling rate. The nucleation and growth of inclusion were calculated using a combination of kinetics and thermodynamics. It was found that the cooling rate has no influence on the precipitation temperature of inclusions but has slightly influence on the segregation of solute elements during solidification. TiS inclusions can precipitate at the end of solidification while Al2O3 inclusions can precipitate in the liquid phase based on the thermodynamic calculations. As the cooling rate rises, the size of the inclusions decreases gradually and the effect of cooling rate on inclusion decreases.
Introduction
In steel manufacturing, the cleanliness of steel product is seriously affecting the quality of products, especially large-size inclusions. The researchers studied the defects of continuous casting slabs and hot-rolled products and found that inclusions were the main cause of the defects [1]. Al-Ti is applied as the deoxidiser in the modern steelmaking process due to its strong deoxidation performance, and the processing and mechanical properties of the steel products could be affected by the remaining Al-Ti deoxidation compounds in steel [2–5]. On the other hand, some studies reported that the fine inclusions can be used in the promotion of acicular ferrite formation and then enhance the properties of steel products [6–8]. Therefore, it is important to understand how to control the sizes and quantities of inclusions to produce high-quality and clean steel.
It was widely reported that the inclusion refinement can be achieved by the controlling of cooling rate [9–15]. Goto et al. [9–11] have researched the effects of various cooling rates between 6 and 560 K/min on the inclusion precipitation of Ti and Al-Ca deoxidised low-carbon steels during the solidification process. They found that the number of inclusions increased while the size of inclusions decreased with the increasing cooling rates. Janke et al [12] examined the precipitation and growth mechanism of inclusions during the solidification process of steel. It was found that the cooling rate has a significant influence on the size of secondary inclusions, but not on the size of primary inclusions. Zhang et al. [13] designed and studied the distribution of the non-metallic inclusions in double-roll continuous casting SUS304 strip steel and also found that the size of inclusion decreased while the number of inclusion increased with the cooling rate during the solidification process. Rong Ma et al. [15] studied the effect of cooling rate on the as-cast microstructure of U-5.4Nb alloy by argon cooling after arc remelting and induction melting and also suggested that rapid cooling rate of temperature is beneficial to inclusion refinement. Thus, the cooling rate should be as high as possible to achieve the small size of inclusions during the solidification process. However, the cooling rate cannot be reduced indefinitely in the actual production process. In order to control the size and quantity of inclusions, it is necessary to control the formation process of inclusions. Thus, it is important to understand the formation mechanism of inclusion in steel under different cooling rates.
Many studies focus on the formation mechanism of inclusions during Al-Ti deoxidation [16–24]. Kunisada et al. [16]. investigated the formation mechanism of Al-Ti oxide on the surface of Al2O3 inclusion in steel melt. Matsuura et al. [17] studied the evolution of Ti-containing inclusion during Al and/or Ti additions to molten steel. In addition, Wang et al. [18–21] investigated the effect of Al/Ti ratio on the transient stages and evolution behaviour of Ti-containing inclusion in Fe–Al-Ti-O melt. Sun et al. [22] studied the precipitation mechanism of inclusions formed in Al/Ti-complex deoxidation steel melt. The present authors also investigated the formation mechanism of inclusions of Al/Ti-complex deoxidation by experimental method and first principles method [23, 24]. However, the mechanism of inclusion formation under different cooling rates is a lack.
In this study, four different cooling rates were used to conduct Al-Ti composites deoxidation experiments. The morphology of inclusions was observed, and statistical analysis was done on the size distribution at various cooling rates. Precipitation thermodynamics and growth kinetics of Al2O3, TiS, and Al2O3-TiS inclusions during the solidification have been studied.
Experimental
Experimental processes
Firstly, ferrous oxalate (99 mass pct, 1.125 g) and pure iron powder (500 g) were added to the crucible, and the mixture was melted in a tubular resistance furnace at 1873 K in an atmosphere of high-purity argon (99.9999 mass pct). Then, keep the temperature at 1873K for 3 hours to ensure the complete melting of the mixture. Next, the bulk specimen of Fe-O was obtained after cooling to room temperature. A nitrogen-oxygen analyser determined the oxygen level in the bulk Fe-O specimen to be 200 ppm.
The Fe-O block specimens were cut into a Fe-O matrix with a diameter of 7 mm and a height of 3 mm. As illustrated in Figure 1, a cylindrical hole with a diameter of 3 mm and a depth of 1.5 mm was bored in the centre of the Fe-O matrix’s surface. Then, the Ti-Fe alloy powder (0.02 g) and high-purity aluminium powder (0.01 g) were mixed and compacted together and added in the cylindrical hole of Fe-O matrix. Next, the prepared Fe-O matrix was placed in the alumina crucibles (inner diameter 8 mm and height 3.5 mm). Finally, the alumina crucibles were placed in a confocal laser scanning microscopy (CLSM) to carry out experiment. The compositions of raw materials used in this work are shown in Table 1. Schematic diagram of preparation Fe-O matrix for Al-Ti deoxidation. Chemical composition of raw materials (in mass percent).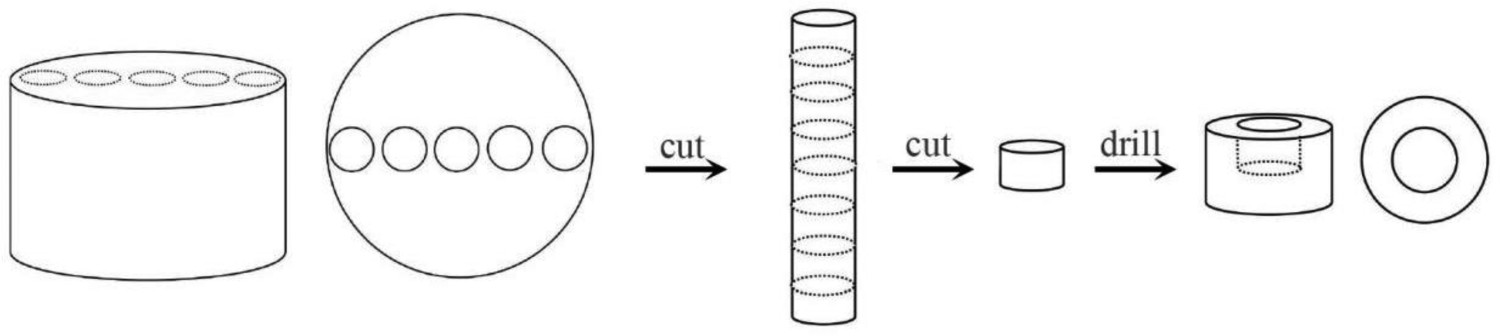
Four groups of experiments were utilised to perform with a CLSM. Under the condition of high-purity argon gas, the temperature was first raised to 1873 K with a heating rate of 300 K/min and kept for 6 min at 1873 K. Then, the molten steel was cooled down to room temperature at rates of 20, 50, 100, and 1000 K/min in the furnace chamber, respectively. Figure 2 shows the temperature control of the CLSM experiment. Temperature control of the CLSM experiment.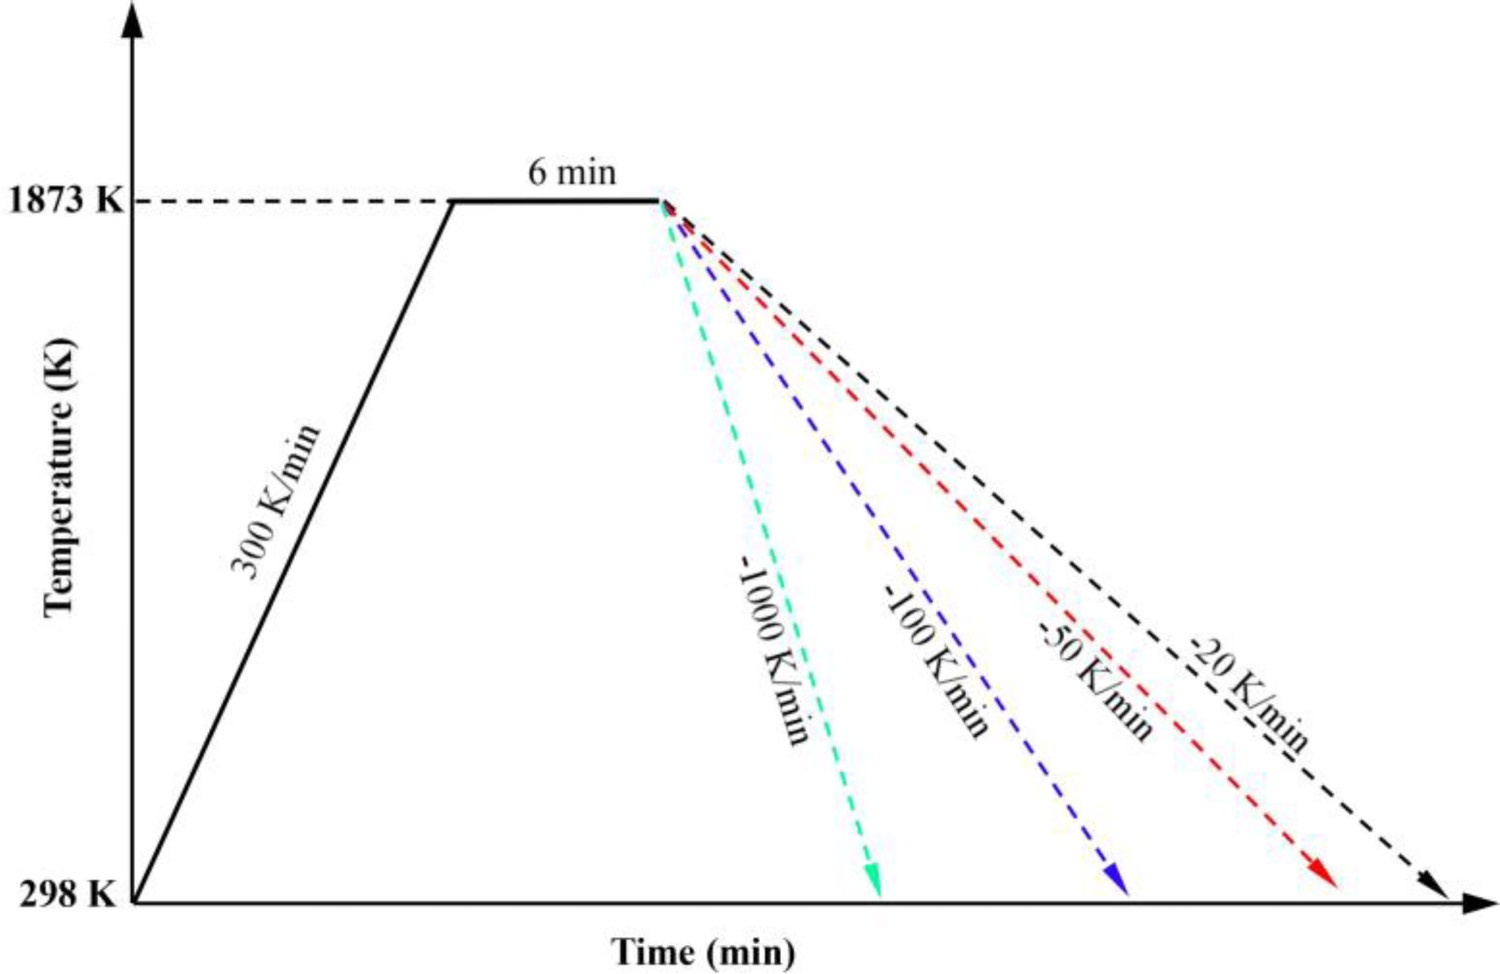
Samples analysis
Components of the steel sample (in mass percent).
Field emission scanning electron microscope (FESEM, Model: ZEISS-ΣIGMA HD) with an energy dispersive spectrometer (EDS, Model: Oxford-X-Max 50 mm2) were used to observe and analyse the inclusions in samples. The size and quantity of inclusions at different cooling rates were calculated by the automatic inclusion analysis software (AIAS) to reflect the effect of different cooling rates on inclusion size more intuitively.
Morphologies and size distribution of inclusions
Morphologies of typical inclusion particles
There are three typical inclusions, TiS, Al2O3, and Al2O3-TiS complex inclusion in the Al-Ti deoxidised steel. Figure 3 shows the typical morphologies of Al2O3 inclusions in Al-Ti composite deoxidised steels cooled at four cooling modes. The morphology of Al2O3 inclusions at a cooling rate of 20 K/min is shown in Figure 3(a, b), the composition of inclusions is a strip structure composed of many particles. The typical morphology of spherical chain Al2O3 inclusions at a cooling rate of 50 K/min is shown in Figure 3(c, d). Figure 3(e, f) shows that the typical morphology of inclusions at the cooling rate of 100 K/min are mostly strip structure composed of two single particles spherical Al2O3, and Figure 3(g, h) shows that the typical morphology of inclusions at the cooling rate of 1000 K/min were mostly single-particle spherical Al2O3 inclusions with small size. Thus, it can be concluded that the Al2O3 inclusions were changed from large strip to small ball when the cooling rate increases. Typical morphology of Al2O3 inclusions at different cooling rates: (a) and (b) 20 K/min, (c) and (d) 50 K/min, (e) and (f) 100 K/min, and (g) and (h) 1000 K/min.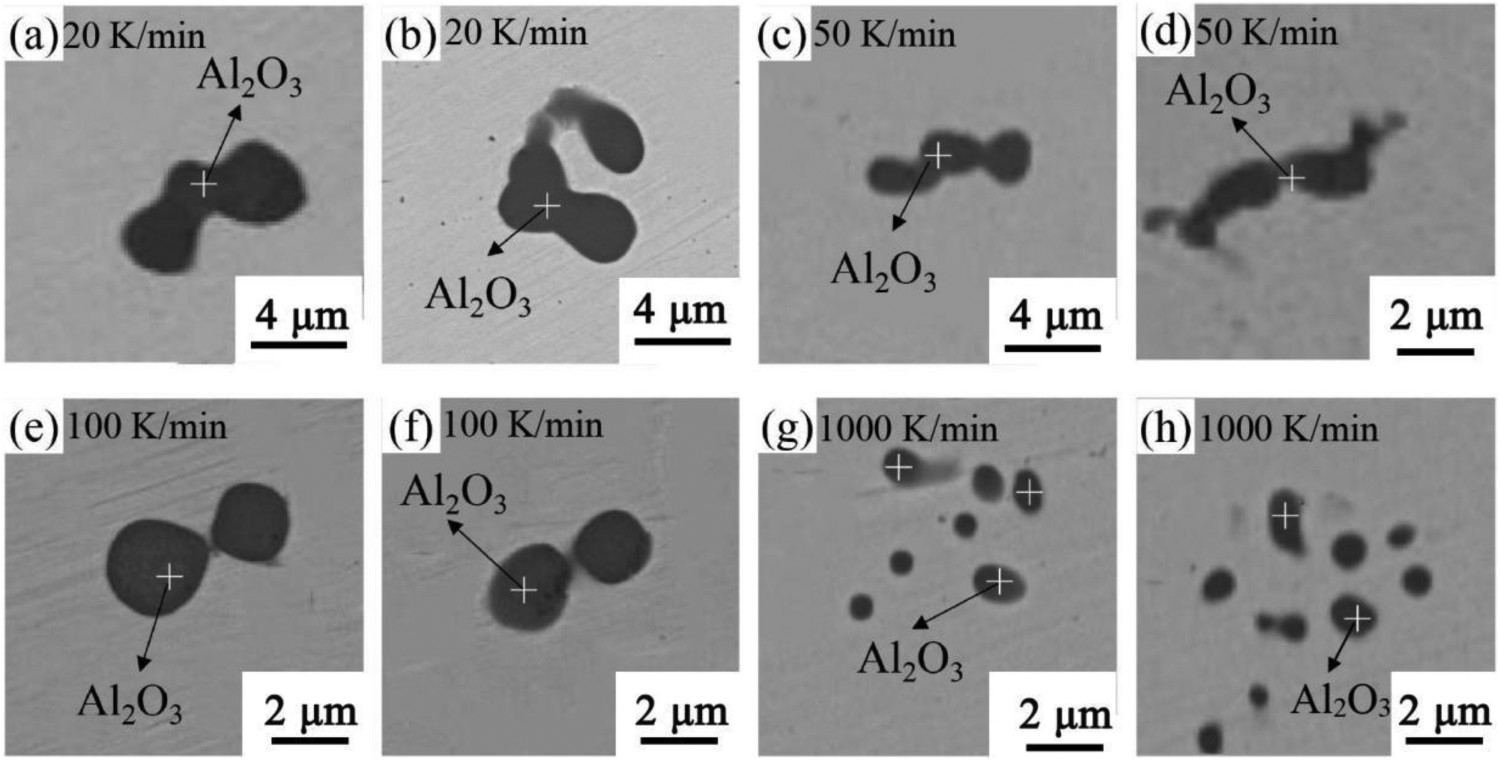
The morphology of TiS inclusions at different cooling rates is shown in Figure 4. It can be found that the typical morphology of TiS inclusions is slender strip and the ratio of length to width of these inclusions is about 15:1 at the cooling rate of 20 K/min, while TiS inclusions are strip with four arc angles and the ratio of length to width of inclusion is about 5:1 at the cooling rate 50 K/min. As the cooling rate increases, the ratio of length to width of TiS inclusions decreases, the ratio of length to width of inclusion is about 2.7:1 at the cooling rate of 100 K/min. At the cooling rate of 1000 K/min, the ratio of length to width of inclusion is about 1:1 and the shape of the inclusions changes to a spherical structure. Thus, it can be suggested that the TiS inclusions were also changed to small ball when cooling rate increases. Typical morphology of TiS inclusions at different cooling rates: (a) and (b) 20 K/min, (c) and (d) 50 K/min, (e) and (f) 100 K/min, and (g) and (h) 1000 K/min.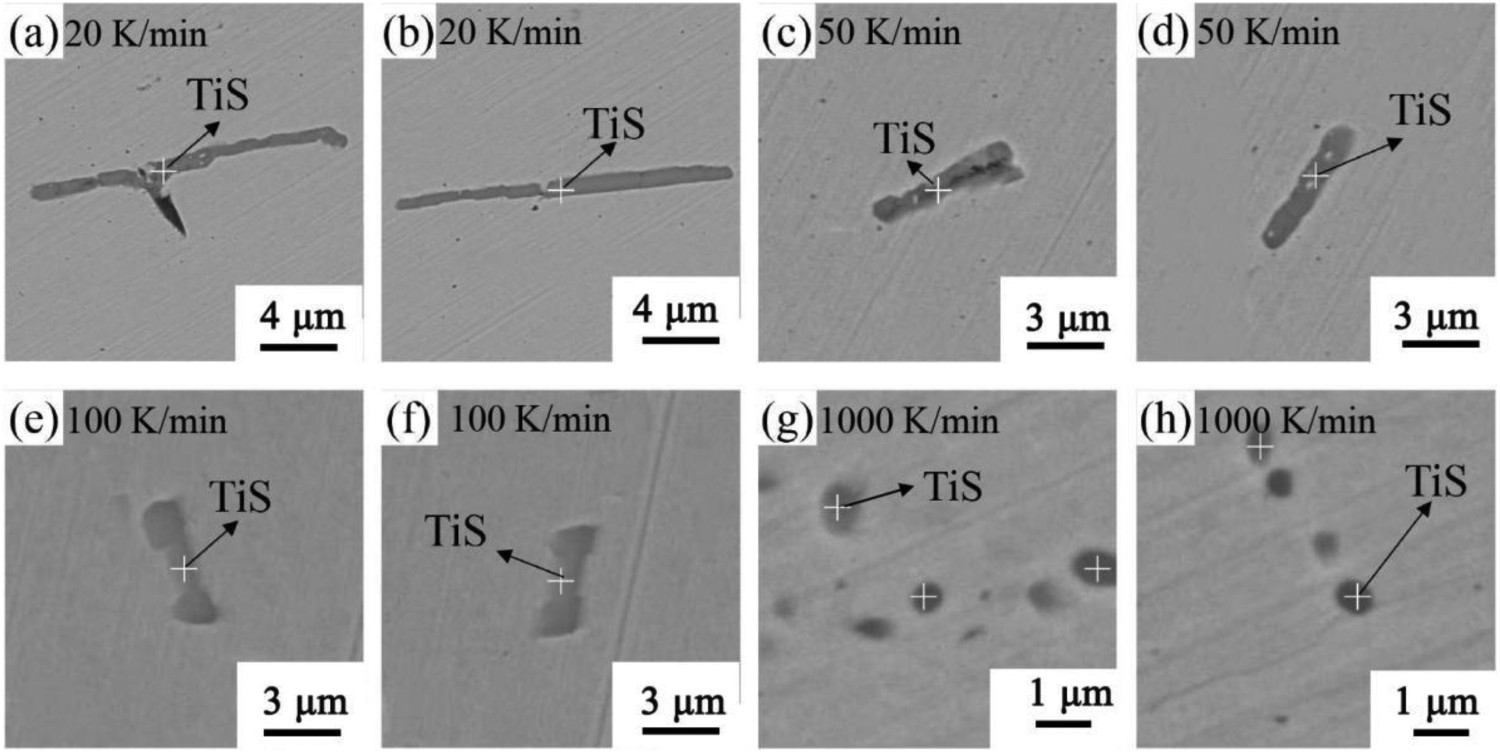
Figure 5 shows the typical morphology of Al2O3-TiS complex inclusions at different cooling rates. The inclusions contained two layers, the inner layer is Al2O3 and the outer layer is TiS. It can be found that the core of Al2O3-TiS inclusions is changing from large strip to small ball as the cooling rate increases. Thus, the total size of the Al2O3-TiS inclusions decreased with the increasing of cooling rate. Typical morphology of Al2O3-TiS inclusions at different cooling rates: (a) 20 K/min, (b) 50 K/min, (c) 100 K/min, and (d) 1000 K/min.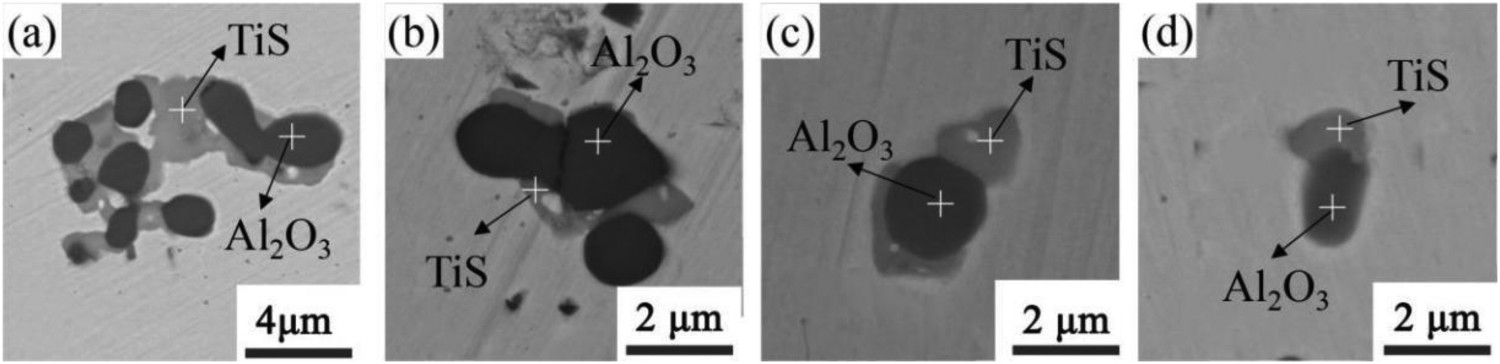
Inclusions size distribution
Figure 6 shows the IAAS measurement results of inclusions particle size distribution. The data in Figure 6(a) demonstrate that the number of inclusions less than 3 μm gradually increases as cooling rate increases, while the number of inclusions greater than 3 μm continues to decrease with the increase of the cooling rate. This is mostly due to the fact that the high cooling rate inhibits the precipitation of solute and reduces the solute diffusion time [26]. Relationship between the cooling rate and inclusions size distribution, (a) size distributions of inclusions at different cooling rate and (b) inclusion number density at different cooling rates.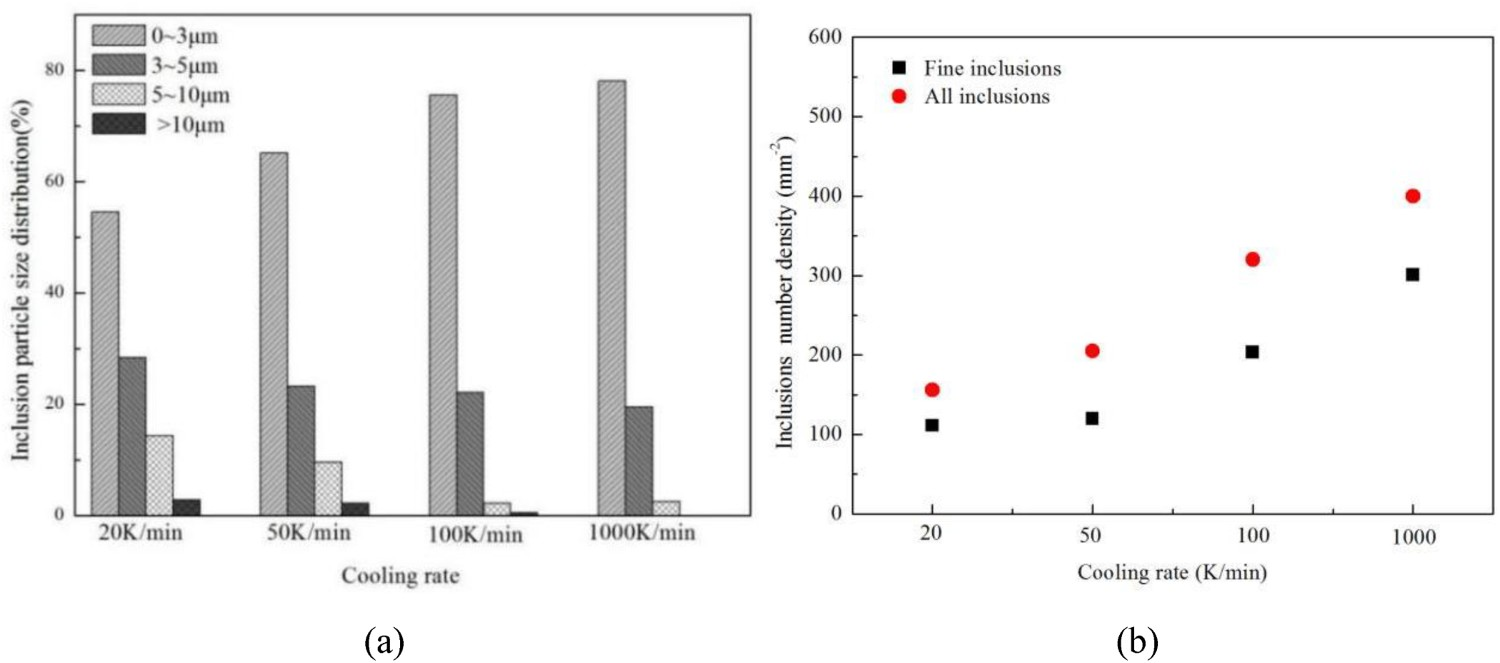
The number density of inclusions can be calculated by the ratio of the number N of inclusions of different sizes to the detection area S, as shown in Equation (1)
Figure 7 shows the relationship between the cooling rate and the statistical size of inclusions. Figure 7(a) shows that the size of Al2O3 inclusion produced by Al-Ti deoxidation reaction decreases with the increasing in the cooling rate. Similarly, the size of TiS and Al2O3-TiS composite inclusion also decreases when the cooling rate increases. It should note that the average size of Al2O3 and Al2O3-TiS composite inclusion at 20 K/min to 50 K/min decreases slowly as the cooling rate increases, while the size of TiS inclusion decreases quickly as the cooling rate increases. However, the average size of Al2O3-TiS inclusion decreases faster at 50 K/min to 100 K/min cooling rate than that of the average size of Al2O3 or TiS inclusion, and the average size of TiS inclusion decrease faster at 100 K/min to 1000 K/min cooling rate than that of the average size of Al2O3 or Al2O3-TiS inclusion. Relationship between the cooling rate and the statistical size of inclusions, (a) Al2O3, (b) TiS, and (c) Al2O3-TiS.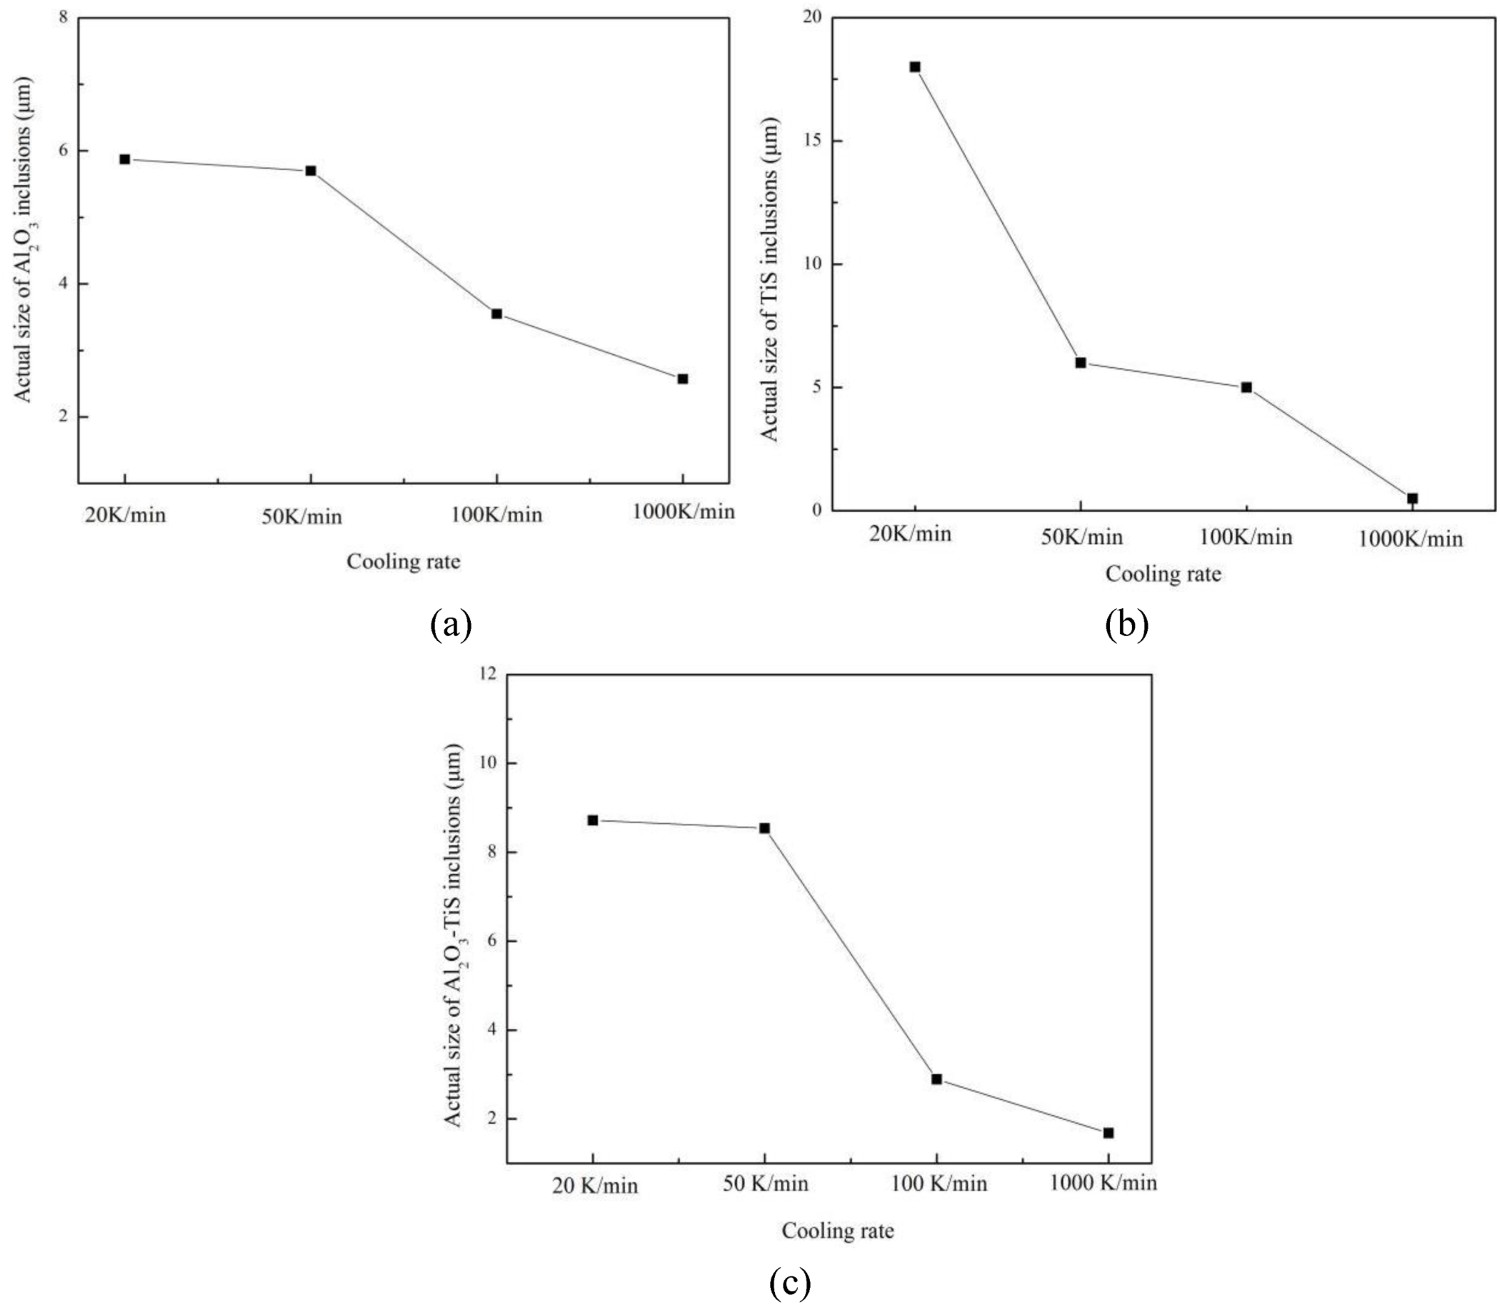
Thermodynamic and dynamic considerations for inclusion nucleation and growth
Thermodynamic analysis for the effect of cooling rate on solute element segregation and inclusion nucleation rate
The precipitating reaction of TiS by [Ti] reacting with [S] is as follows:


The precipitating reaction of Al2O3 and the concentration product of [Al] and [O] can be calculated as [27]: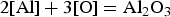


The segregation of solute elements in Al-Ti deoxidised mild steel affected by the cooling rate is calculated as shown in Figure 8. It can be seen that the local segregation phenomena of [Ti], [Al], [S], and [O] tend to be obviously with the increasing solid fraction. At the later stage of solidification, the solute elements are heavily enriched in the solidification front. Therefore, the cooling rate has little effect on solute elements during solidification. This is because the difference between liquidus temperature and solidus temperature is too small. Effect of cooling rate on the segregation of elements during solidification, (a) Ti, (b) O, (c) Al, and (d) S.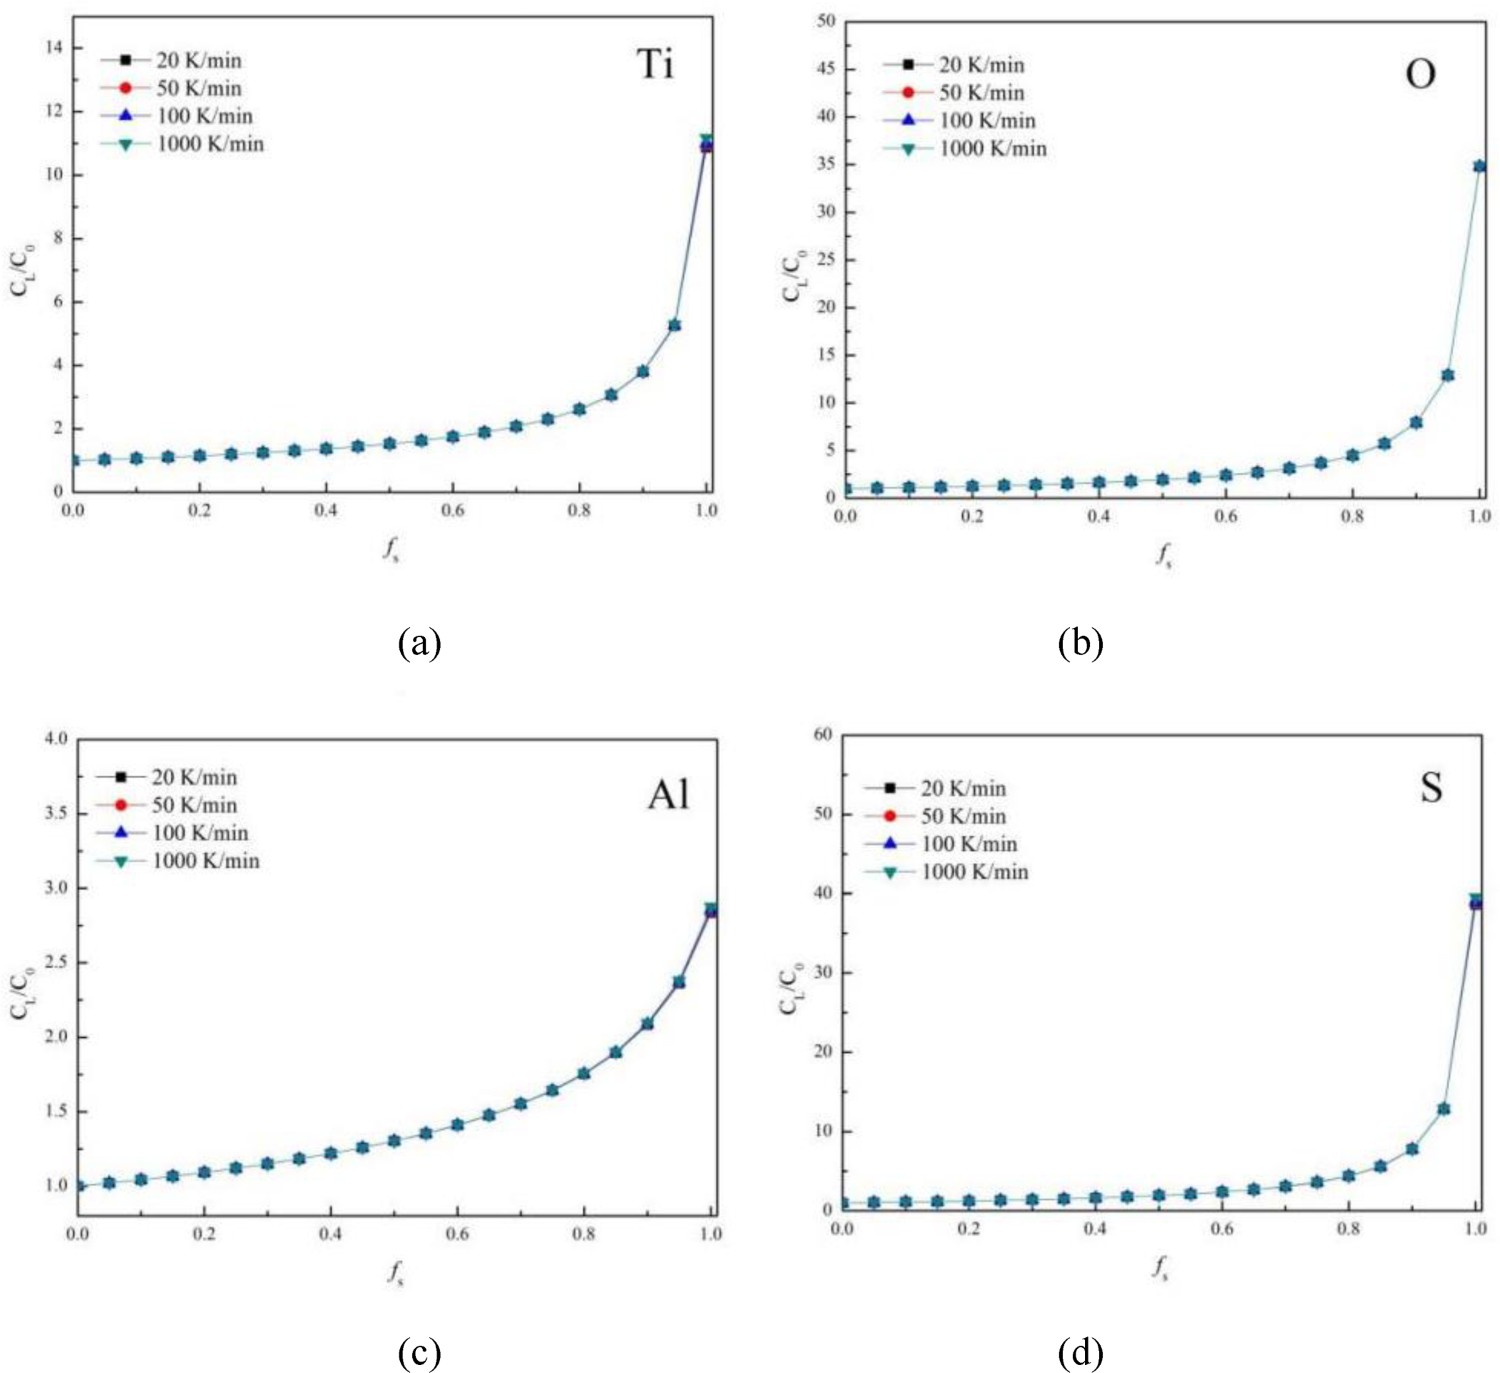
Based on the above results and Equations (4) and (7), the values of logK and logQ can be calculated. The relationship between logK
TiS and logQ
TiS with solidification fraction and temperature is shown in Figure 9(a), and the values of logK
Al2O3 and logQ
Al2O3 as solidification fraction are shown in Figure 9(b). It is found that the actual concentration product logQ
Al2O3 of Al2O3 inclusion is always greater than the theoretical concentration product logK
Al2O3 in the process of solidification of liquid steel, while the actual concentration product logQ
TiS of TiS inclusion is smaller than the theoretical concentration product logK
TiS when the solidification fraction is larger than 0.836. This result means that Al2O3 inclusions are generated in the liquid phase, and the Al2O3 precipitated before TiS inclusions in the most case of solidification process. Thus, the inner layer of the two-layers inclusions is Al2O3, while the outer layer is TiS. In addition, the change in cooling rate has no effect on the precipitation temperature of Al2O3 and TiS inclusion. Relationship between temperature and logK and logQ during solidification, (a) TiS inclusion and (b) Al2O3 inclusions.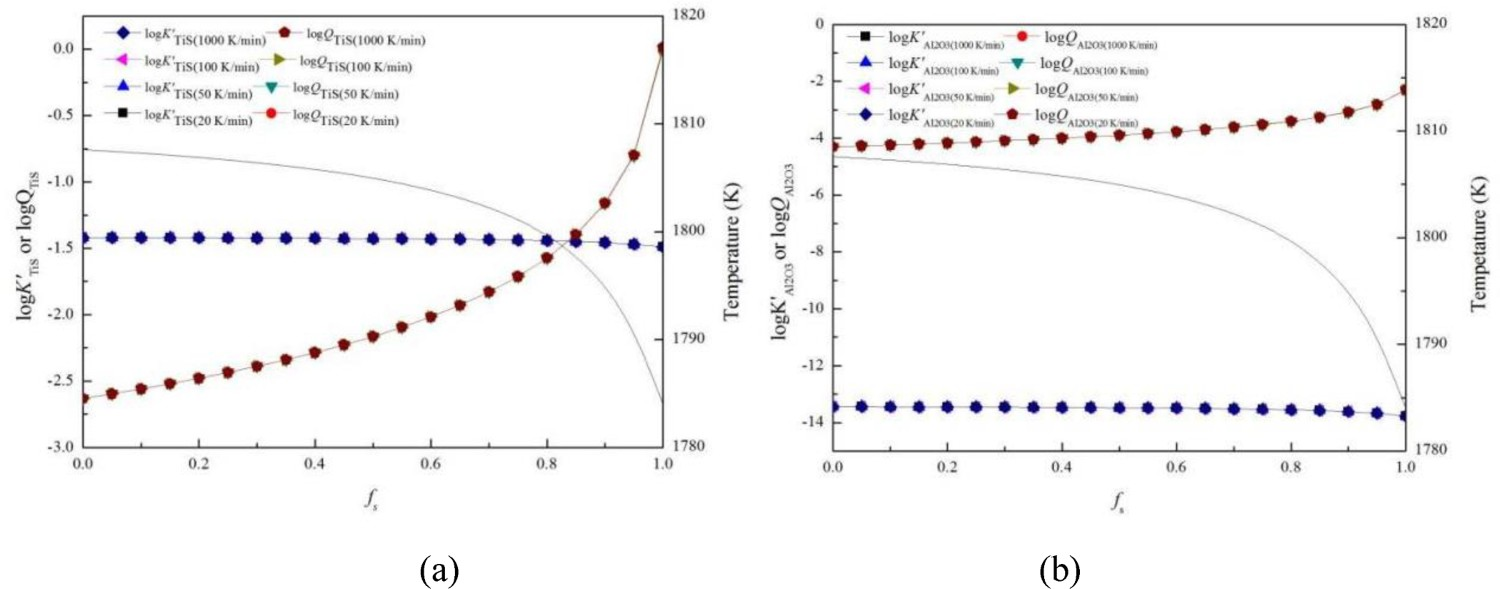
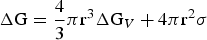
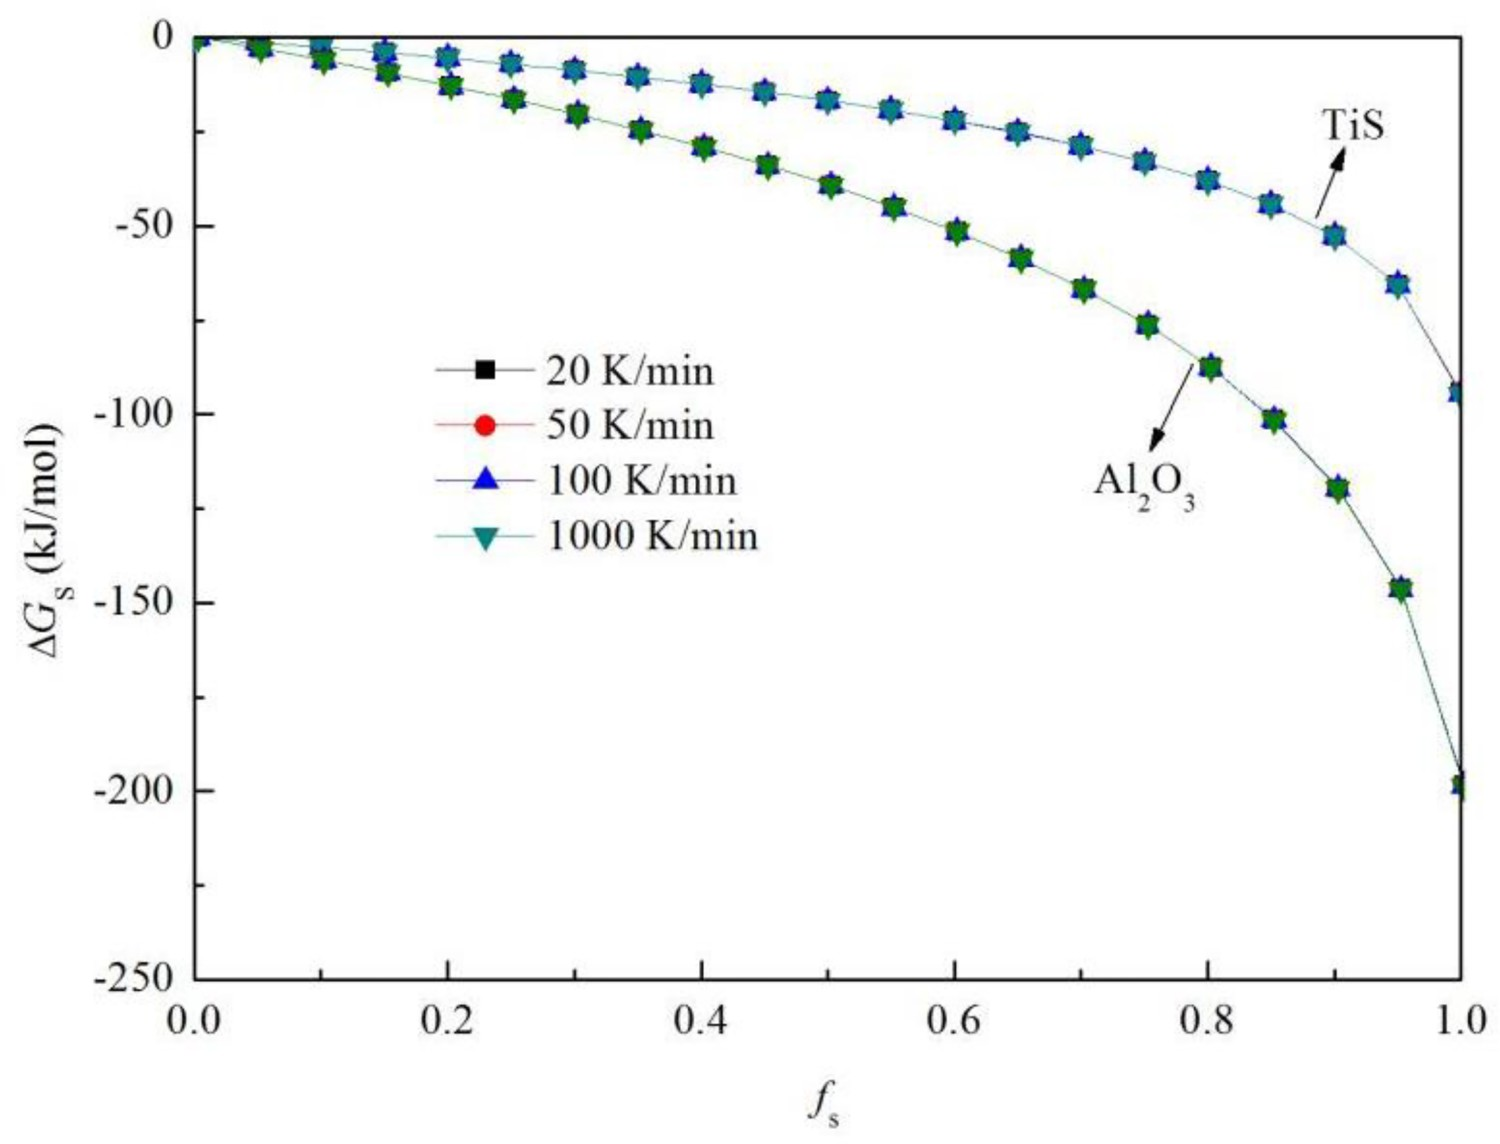
The formation rate of inclusions nuclei, I, is given by using the following equation: ΔGS for the formation of Al2O3 and TiS inclusions at different cooling rate during solidification.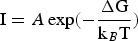

Effect of cooling rate on the growth of inclusion
Growth of TiS inclusion
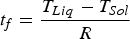
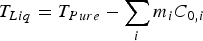
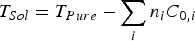
The following equations [34, 35] can be used to determine the theoretical precipitation size r of inclusion in the solidification front of steel: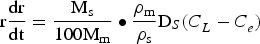
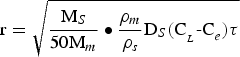


Figure 11 shows the relationship between the solid fraction and the size of TiS inclusions. By comparing the experimental results and the calculated results, it can be seen that the size of inclusion decrease as the cooling rate gradually increases. This is because of the local solidification time of molten steel will decrease with the increase of cooling rate. Additionally, the size of inclusions increased sharply with the increase of solidification fraction at the low cooling rate, while increasing slowly with the increase of solidification fraction at the high cooling rate. At the cooling rate of 20 K/min, the local solidification time is so longer than the solid–liquid two-phase region is always flowing [28]. As a result, TiS inclusions have enough time to grow, and the size of TiS at this cooling rate is about 5.8 μm. When the cooling rate increases from 20 K/min to 1000 K/min, the local solidification time decreased from 70 to 1.4 s. This result means that both the diffusion time of solute elements and the growth time of inclusion decrease with the increasing cooling rate. Thus, the TiS inclusion precipitation size of inclusion eventually decreased but the numbers of TiS increased. Relationship between solidification fraction f
s and size of TiS inclusions.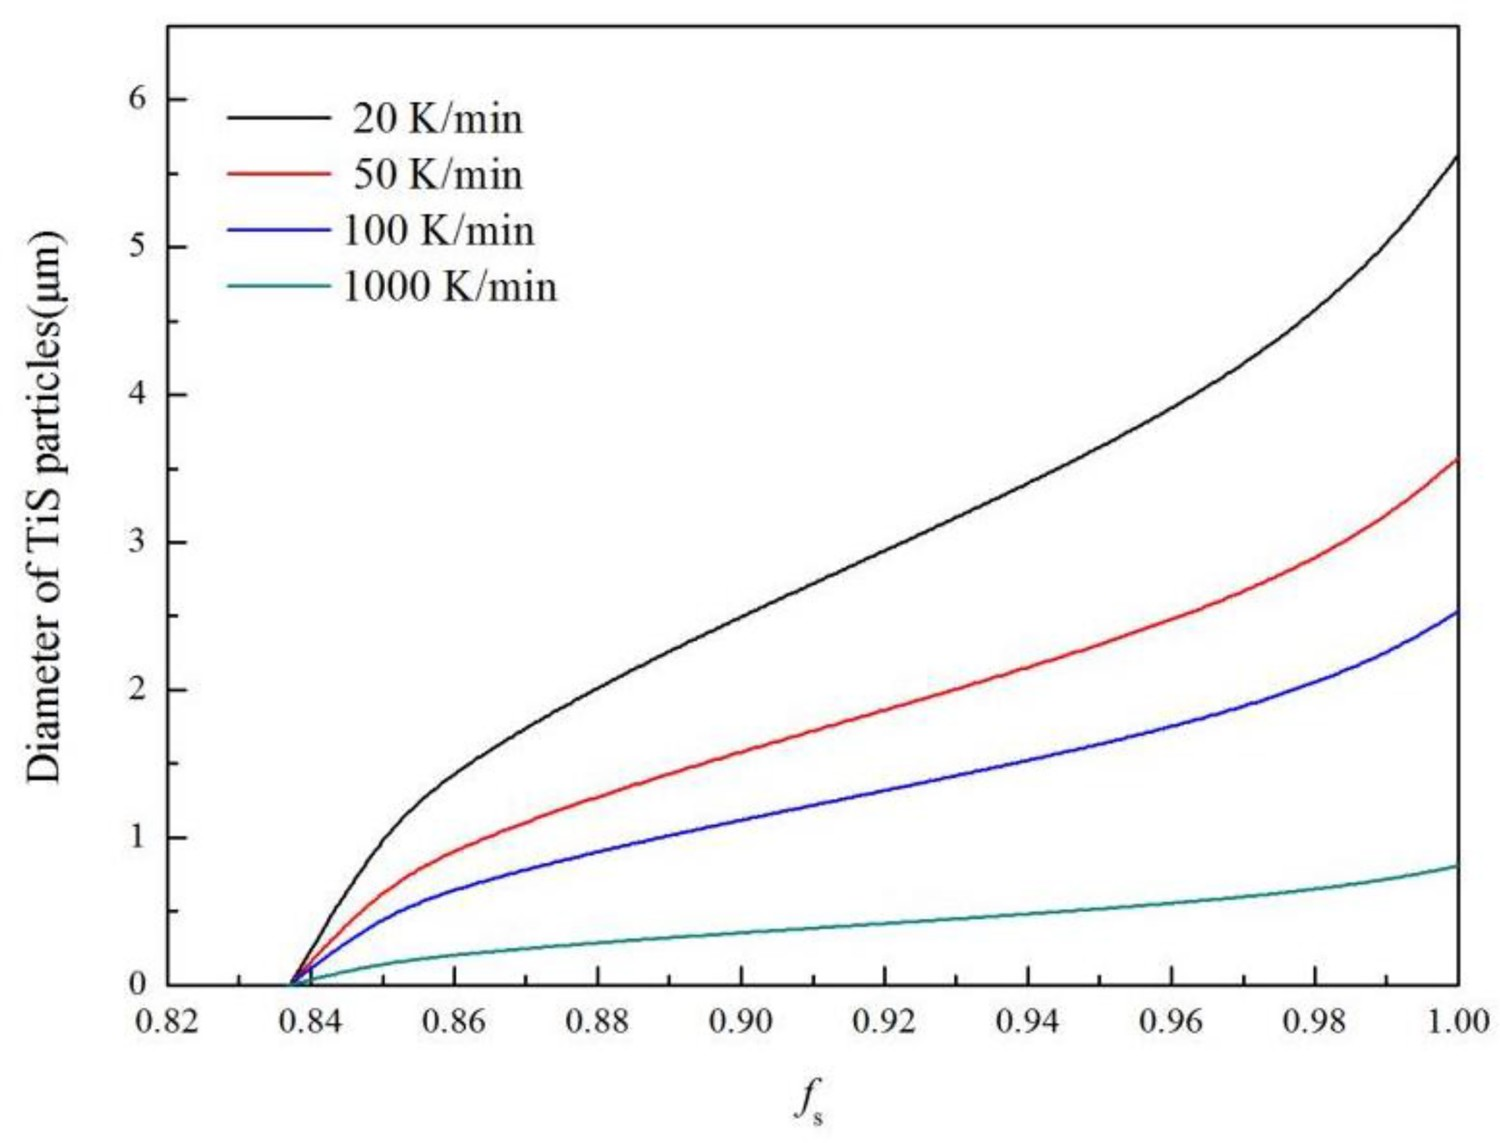
Growth of TiS on the surface of Al2O3 inclusion
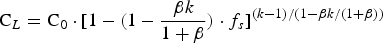
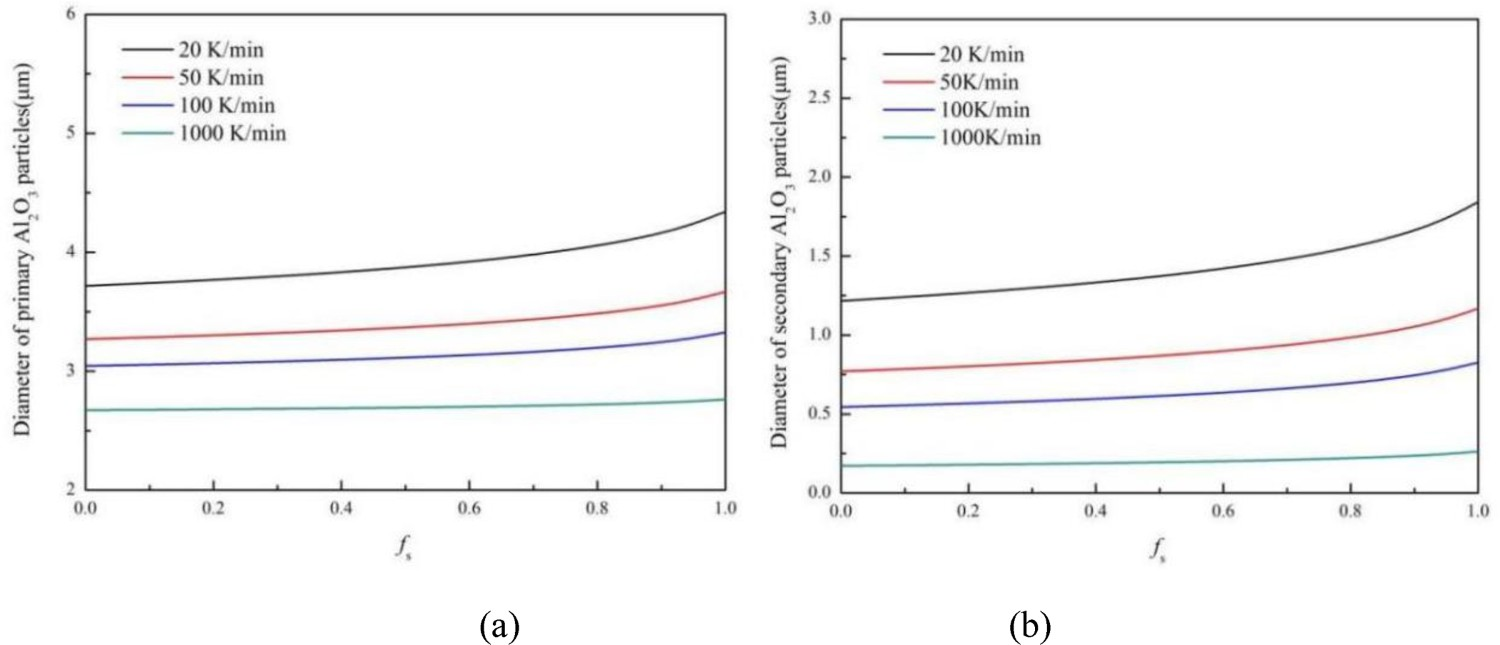
During the solidification process of molten steel, the tiny inclusions in the steel granules can be used as the nucleation core for the precipitation of new inclusions because of energy required for heterogeneous nucleation is lower than that of homogeneous nucleation. According to the above thermodynamic calculation, TiS inclusions precipitate at the end of solidification, and Al2O3 is the main inclusions as the nucleation site in the heterogeneous nucleation of TiS. For the precipitation of Al2O3 inclusions, the element of aluminium is the limiting in the growth of Al2O3 inclusions, because the Theoretical calculation of Al2O3 inclusions during solidification of molten steel, (a) primary Al2O3 and (b) secondary Al2O3.

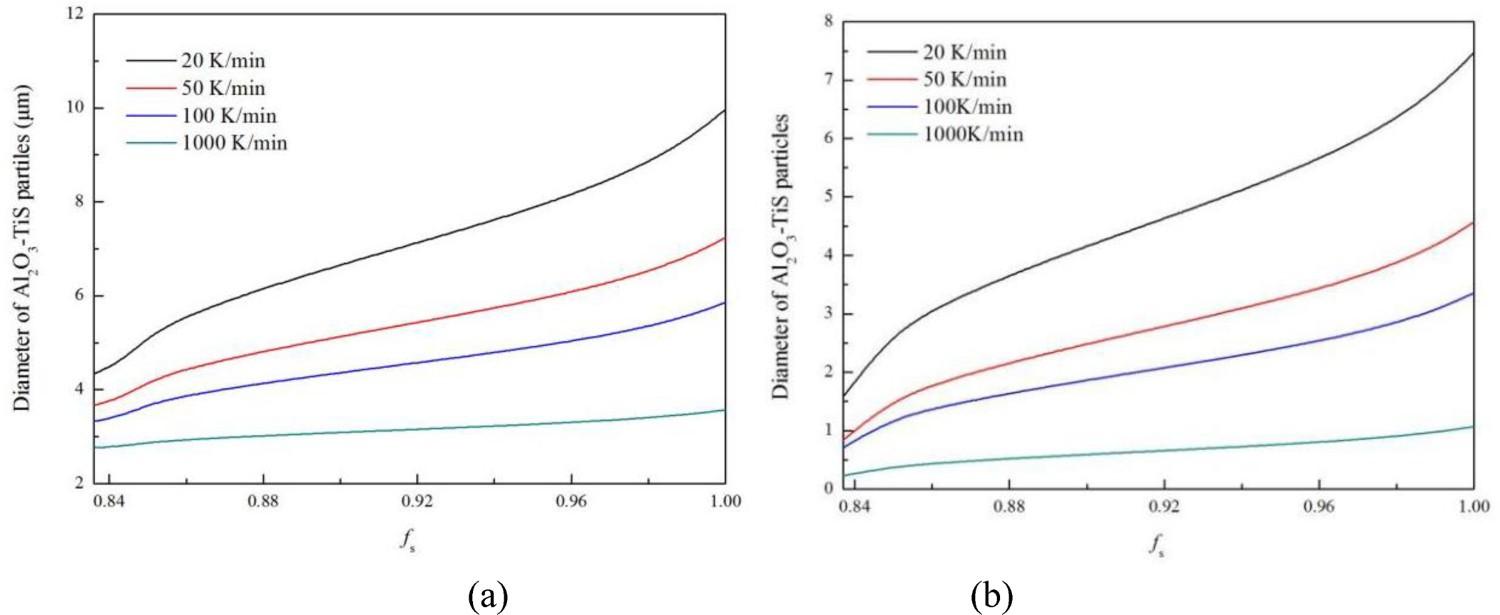
The formation process for the Al2O3-TiS composite inclusion may be separated into two paths, and the conceptual diagram of inclusion generation is shown in Figure 13. Pathway 1: the Al2O3 inclusions were generated and growth in the steel at the liquid phase and before the solidification fraction 0.836, and TiS inclusions were generated on the surface of the Al2O3. Pathway 2: the composite inclusion of Al2O3-TiS formed by secondary Al2O3 and TiS inclusions in the process of solidification of liquid steel. In these two cases, the size of the composite inclusion Al2O3-TiS was deeply affected by the size of the nucleation site Al2O3. Figure 14(a) shows the theoretical size of the inclusion generated by path 1 at different cooling rates. The size of the composite inclusions are 9.97, 7.24, 5.86, and 3.57 μm when the cooling rate are 20, 50, 100, and 1000 K/min, respectively. At the same time, combined with the calculation method of path 1, the theoretical size of the composite inclusion Al2O3-TiS generated by path 2 is calculated as shown in Figure 14(b). The sizes of the composite inclusions generated by path 2 are 7.47, 4.57, 3.57, and 1.07 μm when the cooling rates are 20, 50, 100, and 1000 K/min, respectively. In other words, the size of Al2O3-TiS calculated by theory decreases with the increase of cooling rate, which is consistent with the actual measurement results. Schematic diagram of Al2O3-TiS inclusion generation. Relationship between solidification fraction f
s and size of Al2O3-TiS inclusions, (a) pathway 1 and (b) pathway 2.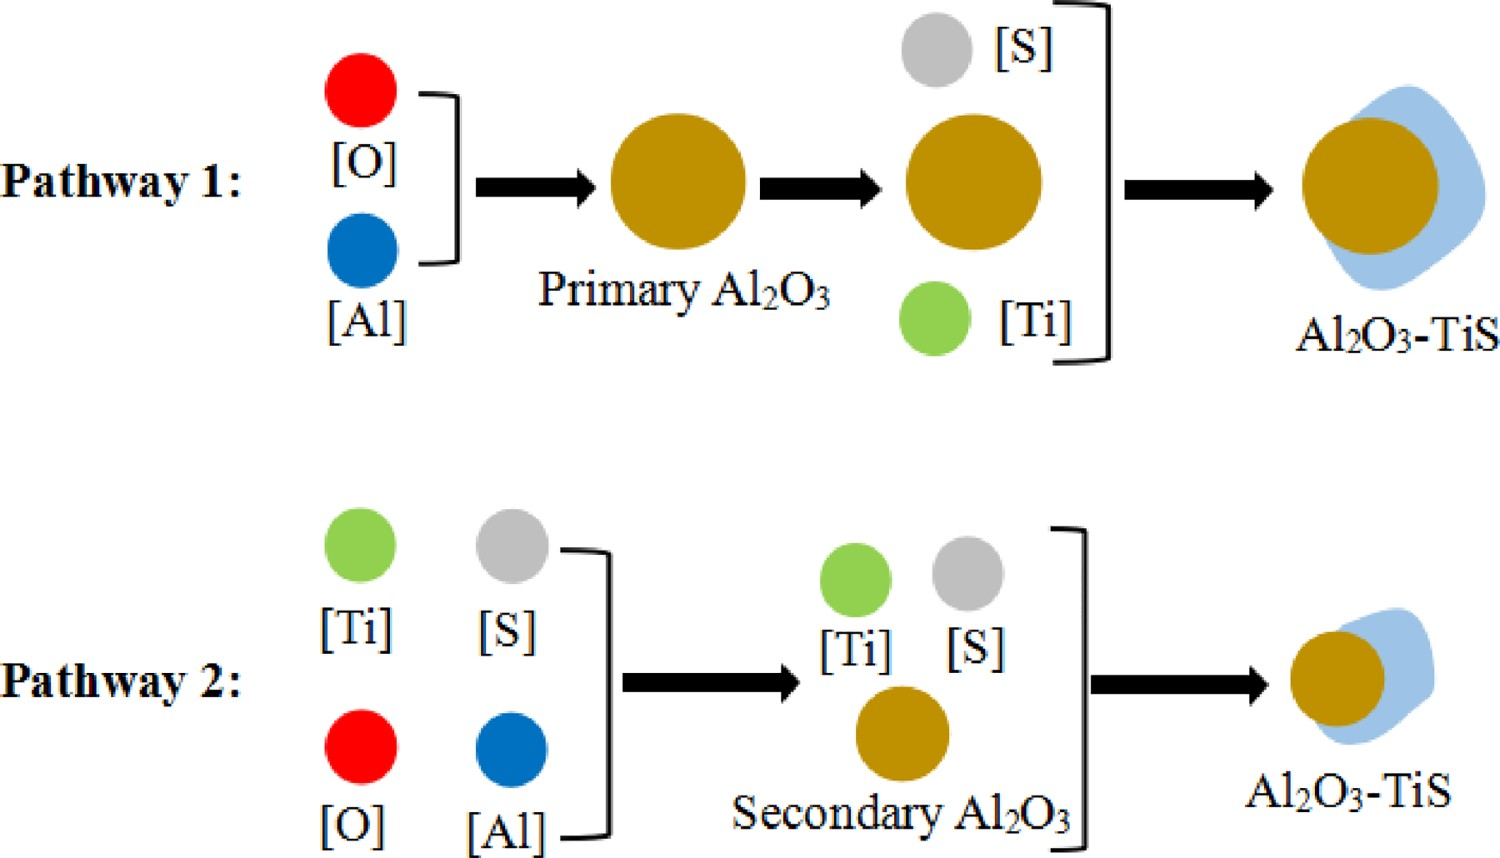
Conclusion
In this research, experimental and theoretical analyses are used to examine the effect of cooling rate on the characteristics of typical inclusions in Al-Ti composite deoxidised low-carbon steel. The results are as follows: The inclusion morphology is significantly influenced by the cooling rate, the morphology of Al2O3 inclusions changes from strip to sphere with the increase of cooling rate, while the typical morphology of TiS inclusions changes from thin strip to spherical. The core of Al2O3-TiS composite inclusions changes from multi-particle Al2O3 to single-particle Al2O3. The number of inclusions less than 3 μm gradually increases with the increase of the cooling rate, while the number of inclusions greater than 3 μm continues to decrease with the increase of the cooling rate. The number density of the inclusions increases gradually with the increase of the cooling rate. The cooling rate has little effect on the segregation of solute elements in the process of solidification of molten steel and the cooling rate has no effect on the precipitation temperature of inclusions. Thermodynamic calculations show that TiS inclusions precipitate at the end of solidification, while Al2O3 inclusions can precipitate in the liquid phase. The size of inclusions decreases gradually with the increase of the cooling rate, and the effect of the cooling rate on inclusion decreases with the increase of the cooling rate.
Footnotes
Disclosure statement
No potential conflict of interest was reported by the authors.