
Abstract
The effect of Zr addition on the impact energy at −20°C, the microstructure, and inclusions of high-titanium low-alloy steels in the simulated heat-affected zone was investigated. The impact energy of the steel without Zr addition was 25.7 J and increased to 242.9 J for the steel with the addition of 80 ppm Zr. When the heat input was 300 kJ cm−1, the impact energy of the steel without Zr addition was 17.5 J and increased to 140.9 J for the steel with 80 ppm Zr, the nucleation potential of AFs increased from 24.4 /mm2 to 76.7 /mm−2, and the average nucleation potential of inclusions decreased from 2.02 to 1.67. The grain refinement by the formation of acicular ferrites stemmed from the increase of 1–3 μm Al-Ti-Zr-O inclusions was responsible for the toughness improvement in CGHAZ of the Zr-bearing steel.
Introduction
The high impact toughness in the weld heat-affected zone (HAZ) is required for high-strength low alloy (HSLA) steels widely used in offshore constructions, ships, and oil pipelines [1,2]. Recently, high heat input welding techniques have been successfully used in the HSLA to reduce cost and to improve productivity. The coarse-graining of austenites in the HAZ induced by high heat input welding is one of the reasons for the consequent degeneration in toughness. Non-metallic inclusions are natural components in deoxidized steels and are hardly fully removed from the molten steel, and with proper size and proper composition can improve the performance of steels [3–5]. It was reported that the acicular ferrite (AF) was promoted to nucleate by non-metallic inclusions [6] and the growth of the austenite was inhibited by non-metallic inclusions pining at the boundary of the austenite [7]. Therefore, controlling the formation of non-metallic inclusions in steel is of significance to improve the toughness of HSLA steel.
It was reported that TiN particles precipitated during steel solidification hindered the growth of the austenite grain by pinning at the grain boundary of austenites [7] and inducing the nucleation of Afs [8–11]. Titanium oxides [12–15], magnesium oxides [16–18], and zirconium oxides [19–22] in steels owing to the low misfit with ferrites were widely investigated. For example, the formation of the Mn-depletion zone on the surface of Ti2O3 favoured the nucleation of Afs [13], and MgO particles had a low misfit with ferrites which reduced the nucleated energy barrier of Afs [23]. Lei et al. [24] studied the effect of zirconium on the toughness of low alloy steels without titanium element, the max of the impact absorbed energy at −20°C was 200 J with 130 ppm zirconium in the steel. Pu et al. [20] investigated the effect of zirconium on the microstructure of weld metals with 20 ppm Ti, the max of the impact absorbed energy at −20°C was 145 J with 56 ppm zirconium in the steel. The effect of Ti-Zr complex treated in low titanium steel on evolution behaviour of inclusions [25,26], toughness and microstructure [27,28] was detailed investigated. However, the effect of zirconium on particle modification and microstructural transformation in the HSLA steel containing high titanium has not been thoroughly understood, and further theoretical analysis is necessary.
In the present study, the potential nucleation energy of AFs under high heat input welding thermal cycles was calculated and the mechanism of the influence of zirconium on the microstructure and the toughness of the simulated HAZ of steel containing high titanium were investigated. The present work aims at elaborate on the variation in the nucleation of acicular ferrite induced by inclusions during the addition of zirconium in high titanium low alloy steel, which was of great significance for the accurate enhancement of the toughness of steel.
Experimental procedure
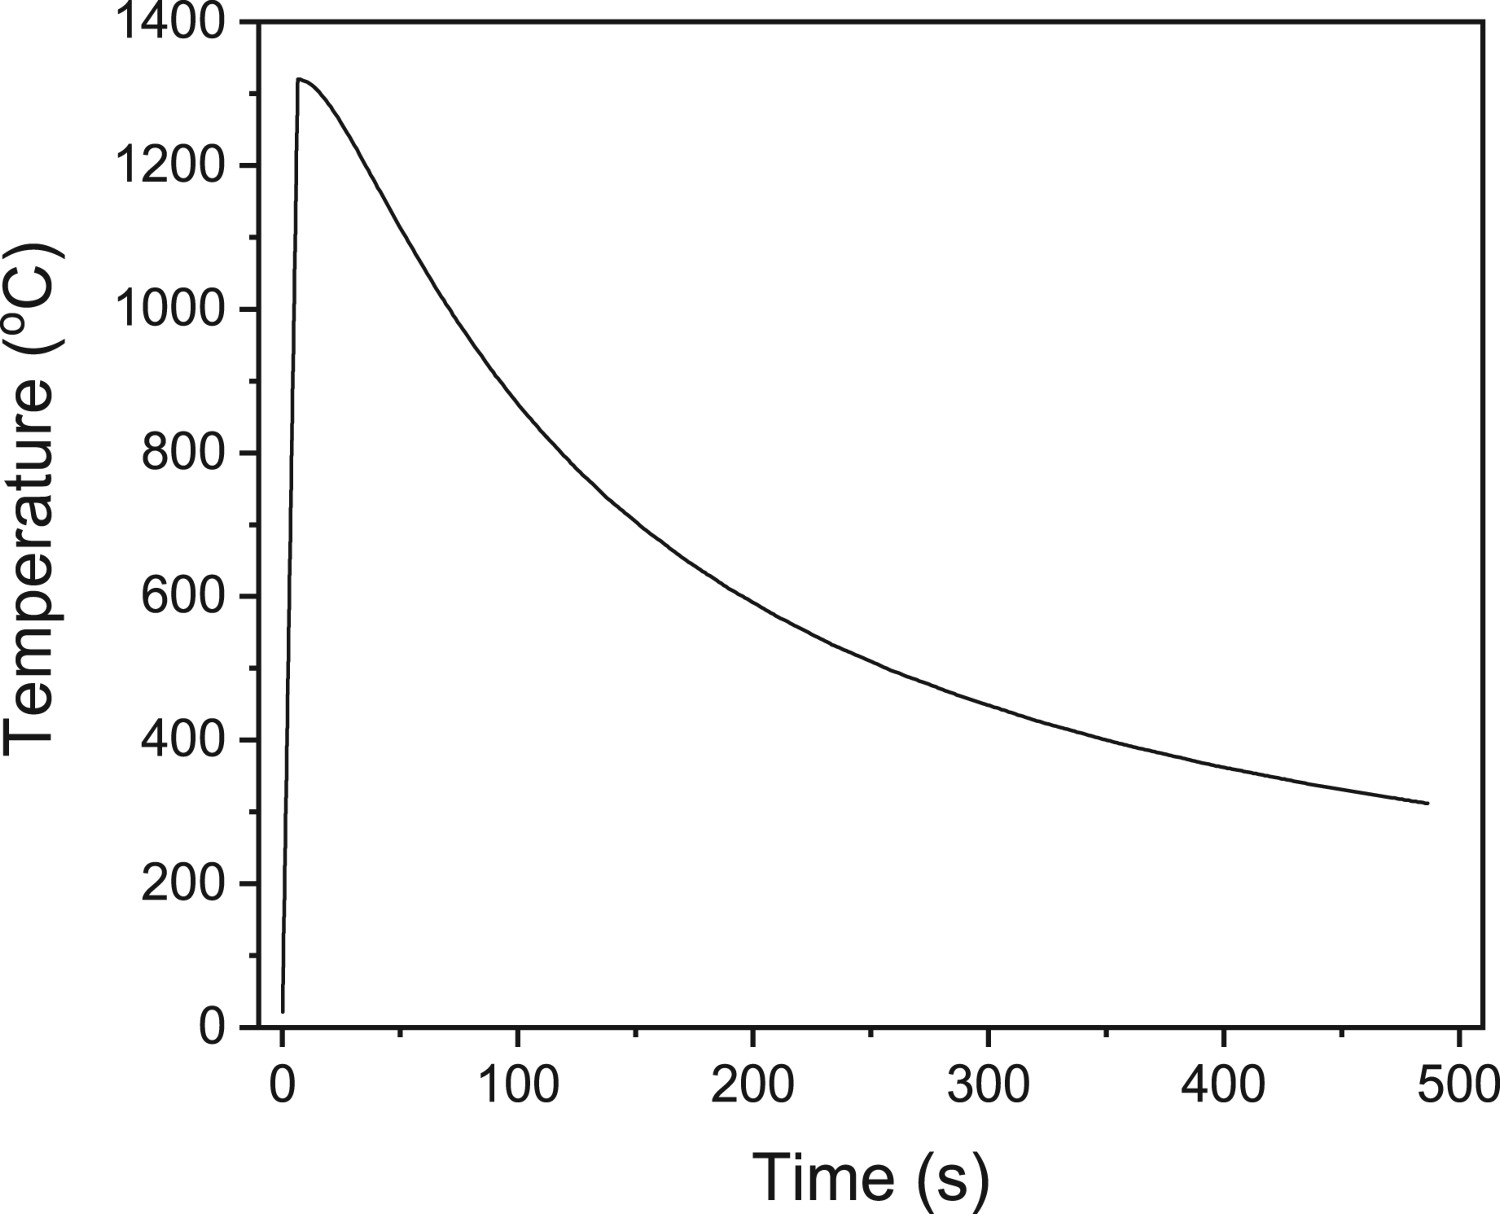
The experimental steels were melted in a 25 kg vacuum induction furnace protected by argon gas and solidified into ingots with the composition listed in Table 1. The total oxygen (T.O), total sulphur (T.S), carbon(C), and nitrogen(N) of the steel were detected using a Leco oxygen and sulphur analyzer while the total titanium (T.Ti) and the total zirconium (T.Zr) were measured using an Inductive Coupled Plasma Emission Spectrometer (ICP). The steel with 80 ppm Zr was named Z1 steel, and the other steel without Zr was called T1 steel. A 40 mm Schematic of the simulated thermal cycle. Chemical composition of the steel in the current study (wt-%).


After the simulated thermal welding of the sample, impact experiments were performed at −20°C and repeated three times for each condition. The fractured sample is illustrated in Figure 2(a). The cross-section one shown in Figure 2(b) was used to analyse the proportion of microstructures using an optical microscope (OM), and the cross-section two shown in Figure 2(b) was used to observe inclusions in the steel using a scanning electron microscope (SEM) equipped with an energy dispersive spectrum (EDS). The distance of the surface-section two from the fracture was defined by the microstructure observed in cross-section one to ensure that the observed inclusions in cross-section two were located in the heat-affected zone. Fifteen images were evaluated using OM to count the volume fraction of various ferrites. Schematic diagram of the sample observation.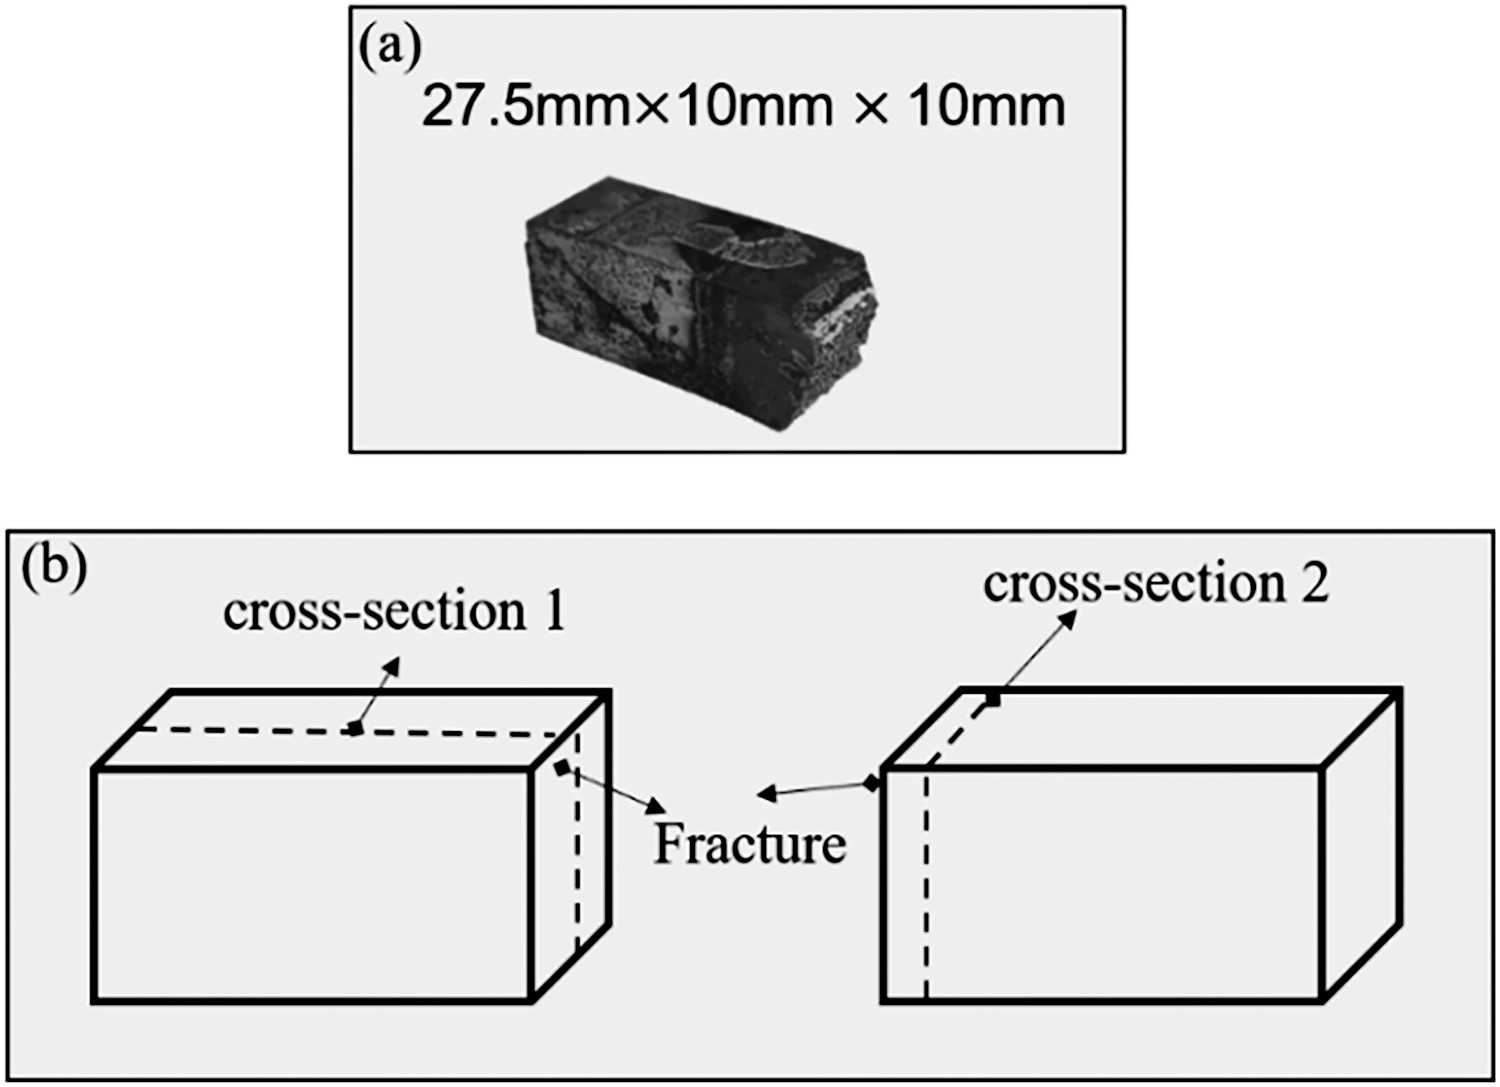
Characteristics of inclusions
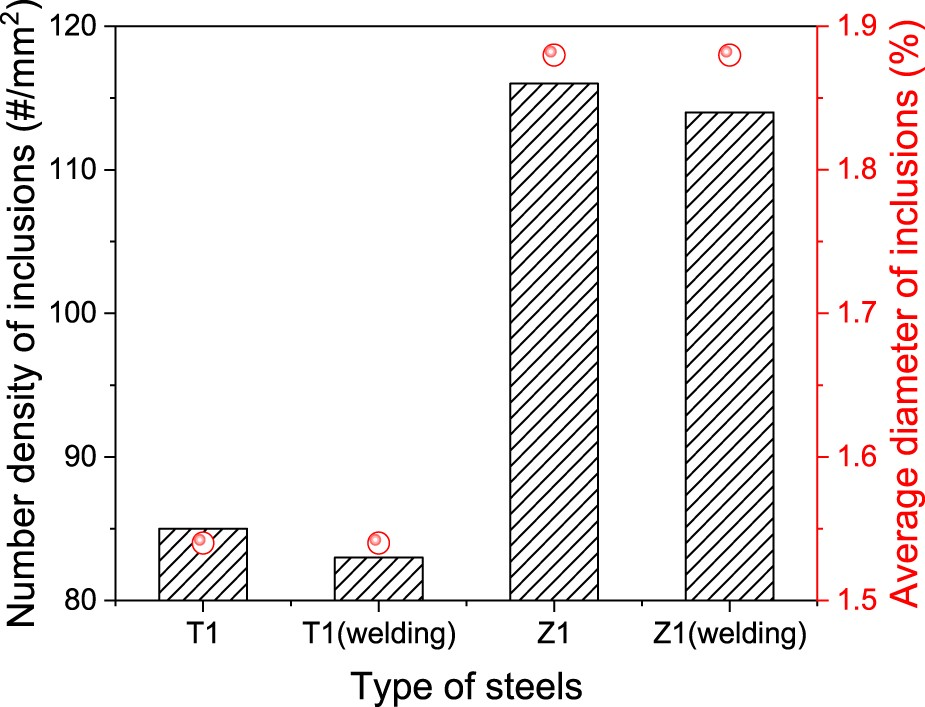
The variation of the number proportion of inclusions with the diameter of inclusions is shown in Figures 3 and 4 exhibits the number density and the average diameter of inclusions in the steel. After the thermal simulation welding with a heat of 300 kJ cm−1, the number of inclusions with a size of 0.5–1 μm had an increase, but the average diameter of inclusions remained unchanged (T1:1.5 μm, Z1:1.9 μm) and the number density was near the same. With the addition of 80 ppm Zr in the steel, the average diameter, and number density were all increased, the number density was 85 (#/mm2) in the T1steel and 116 (#/mm2) in the Z1 steel. The potential of AF nucleated on the surface of inclusions increased with the increase of the diameter of inclusions [30]. The increase in the diameter and number density of inclusions is one reason for the enhanced volume fraction of AFs. Variation of the number proportion of inclusions with a diameter of inclusions. The number density and the average diameter of inclusions in different steels.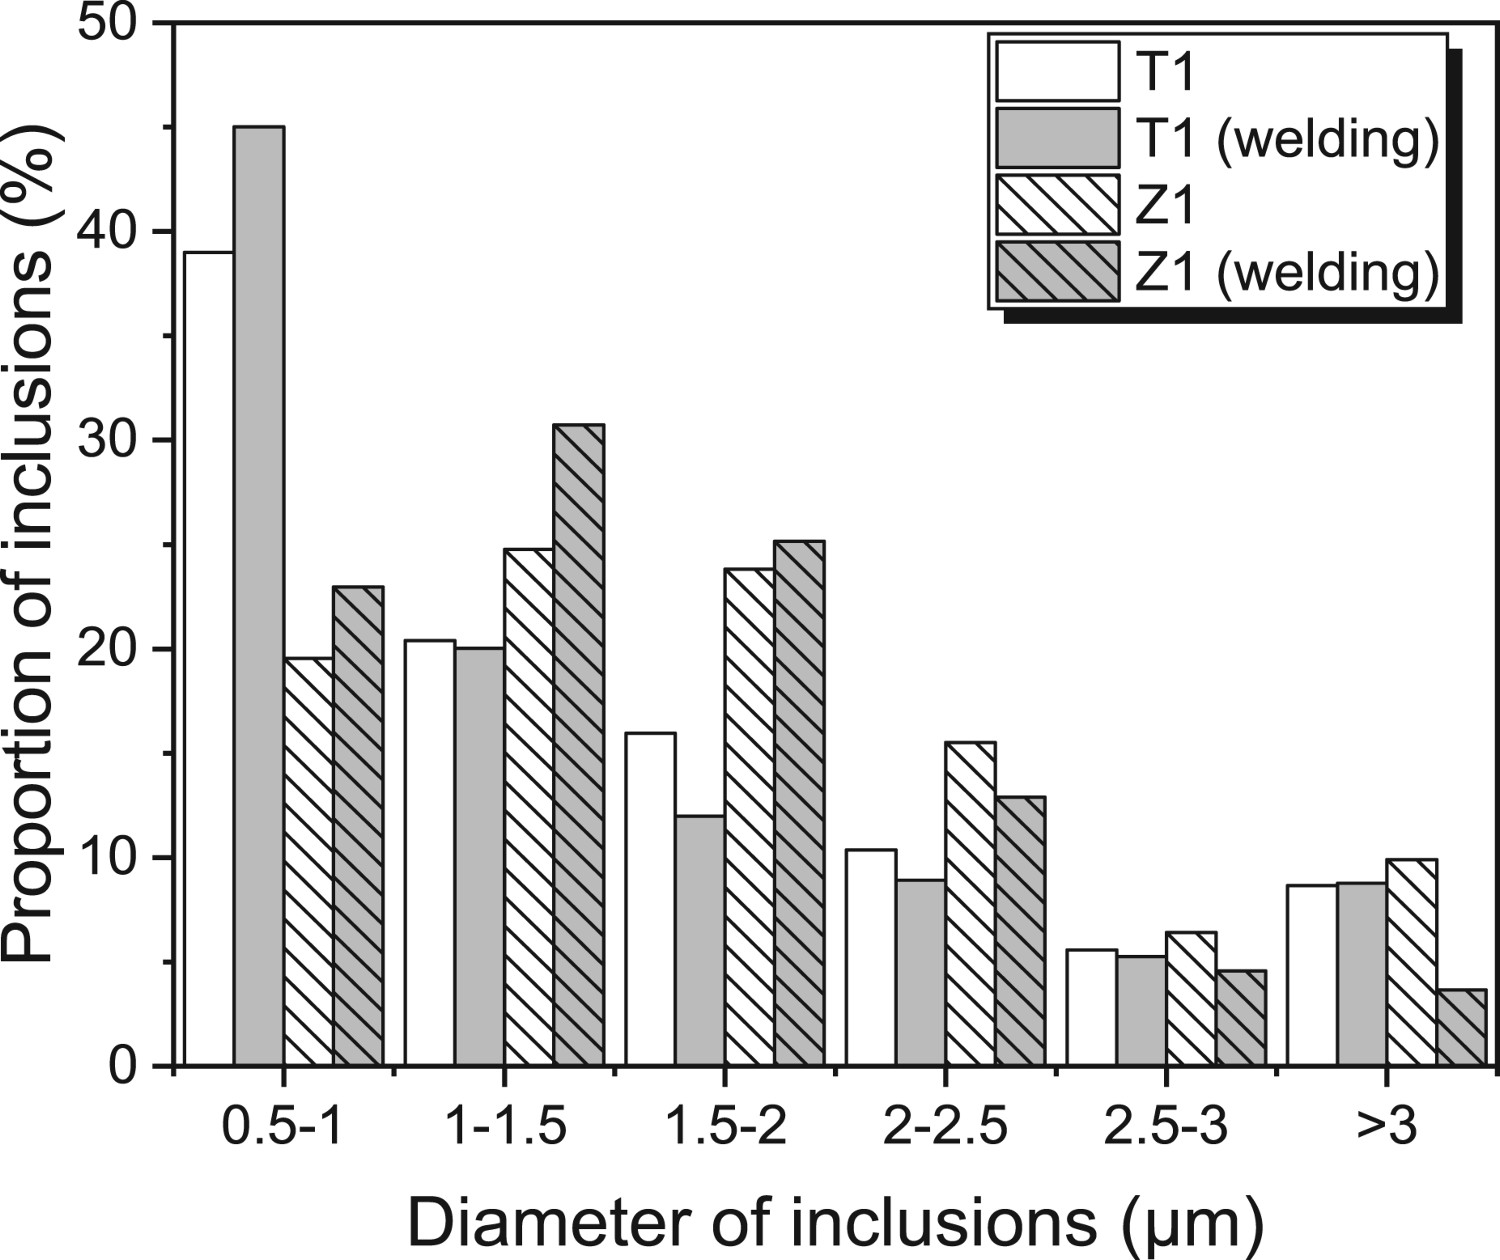
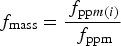
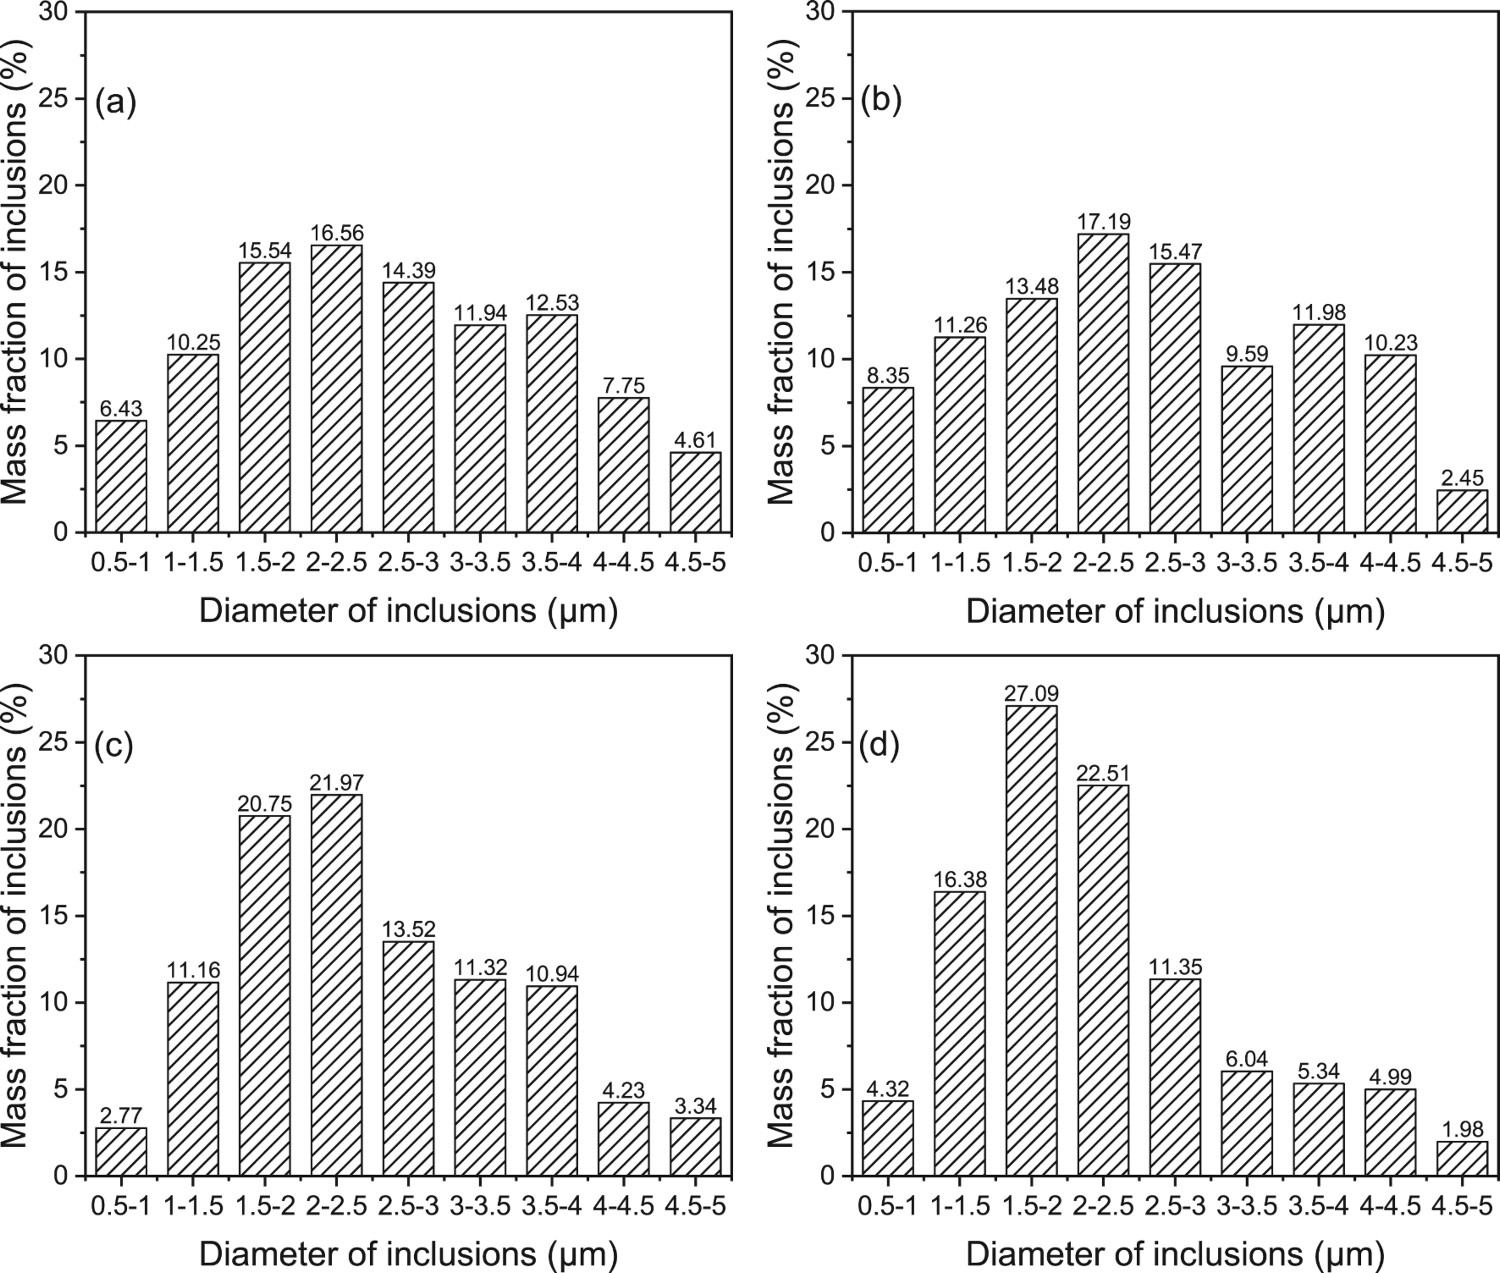
The mass fraction of inclusions for different diameters of inclusions is shown in Figure 5. It was pointed out that the value of the mass fraction was calculated from a combination of SEM scans and the results of an automated scanning system for inclusions. The equations for the mass fraction are expressed as Equation (1) and Equation (2) which could be obtained in literature [31]. Mass fraction of inclusions with the diameter of inclusions (a: 0 kJ cm−1 in the T1 steel, b: 300 kJ cm−1 in the T1 steel, c: 0 kJ cm−1 in the Z1 steel, d: 300 kJ cm−1 in the Z1 steel). Content of Ti and Zr in inclusions with different steels.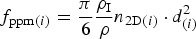


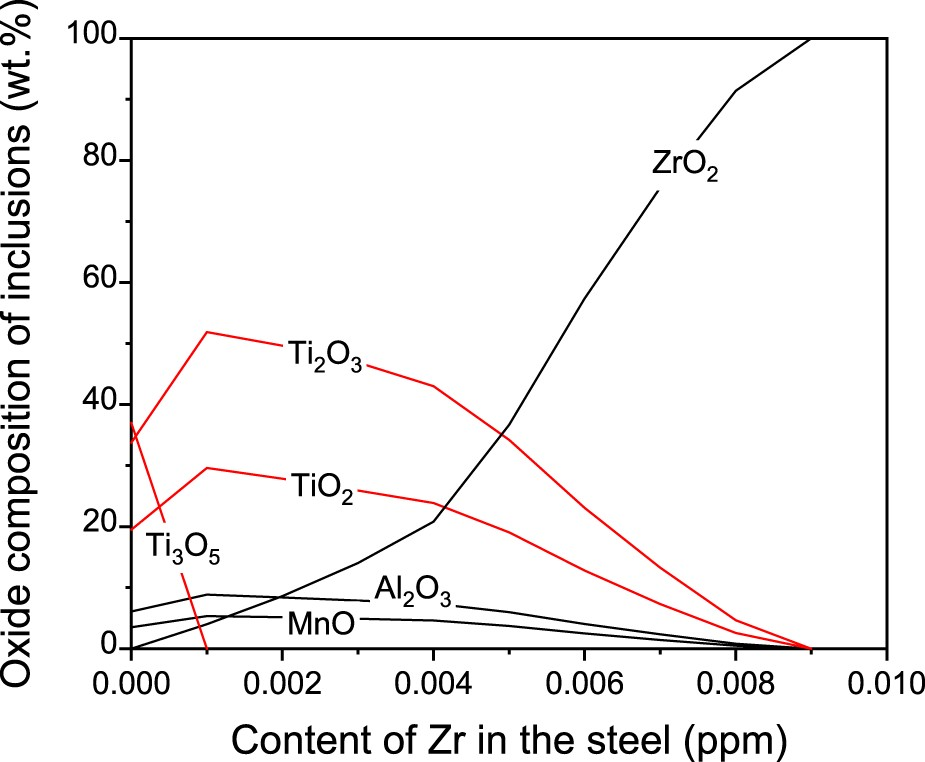
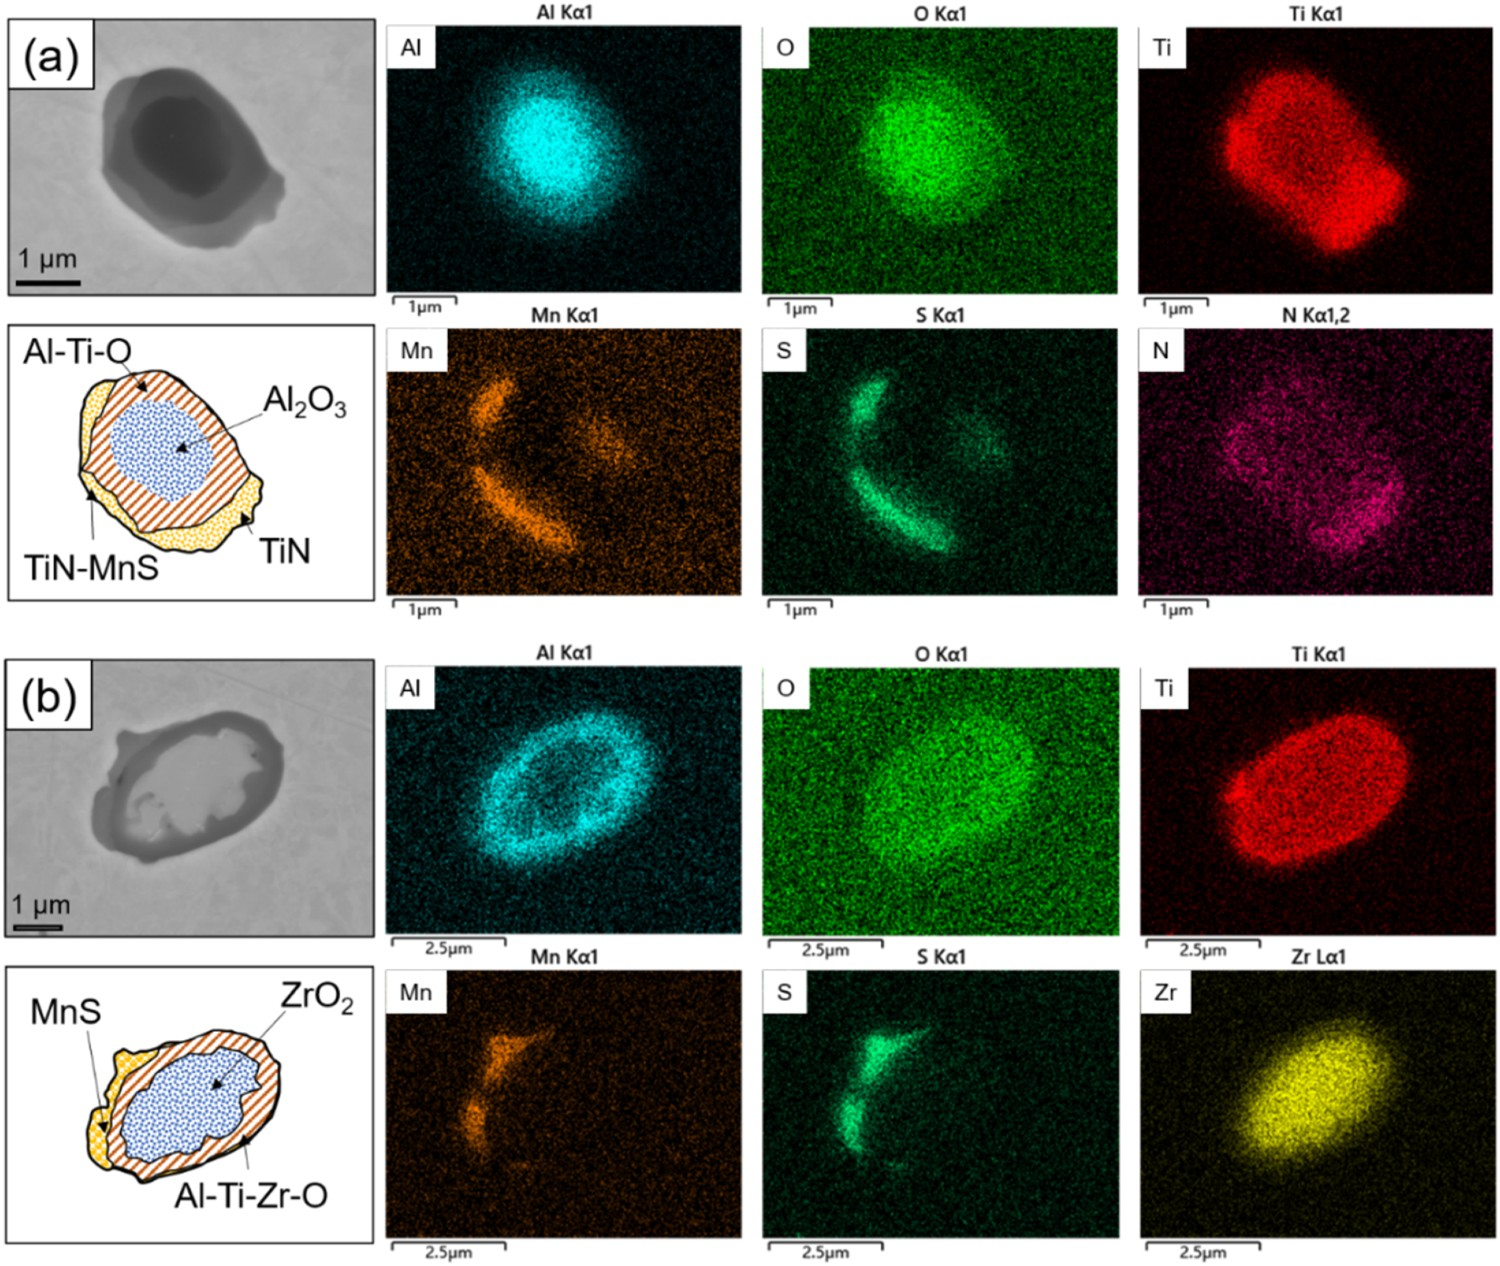
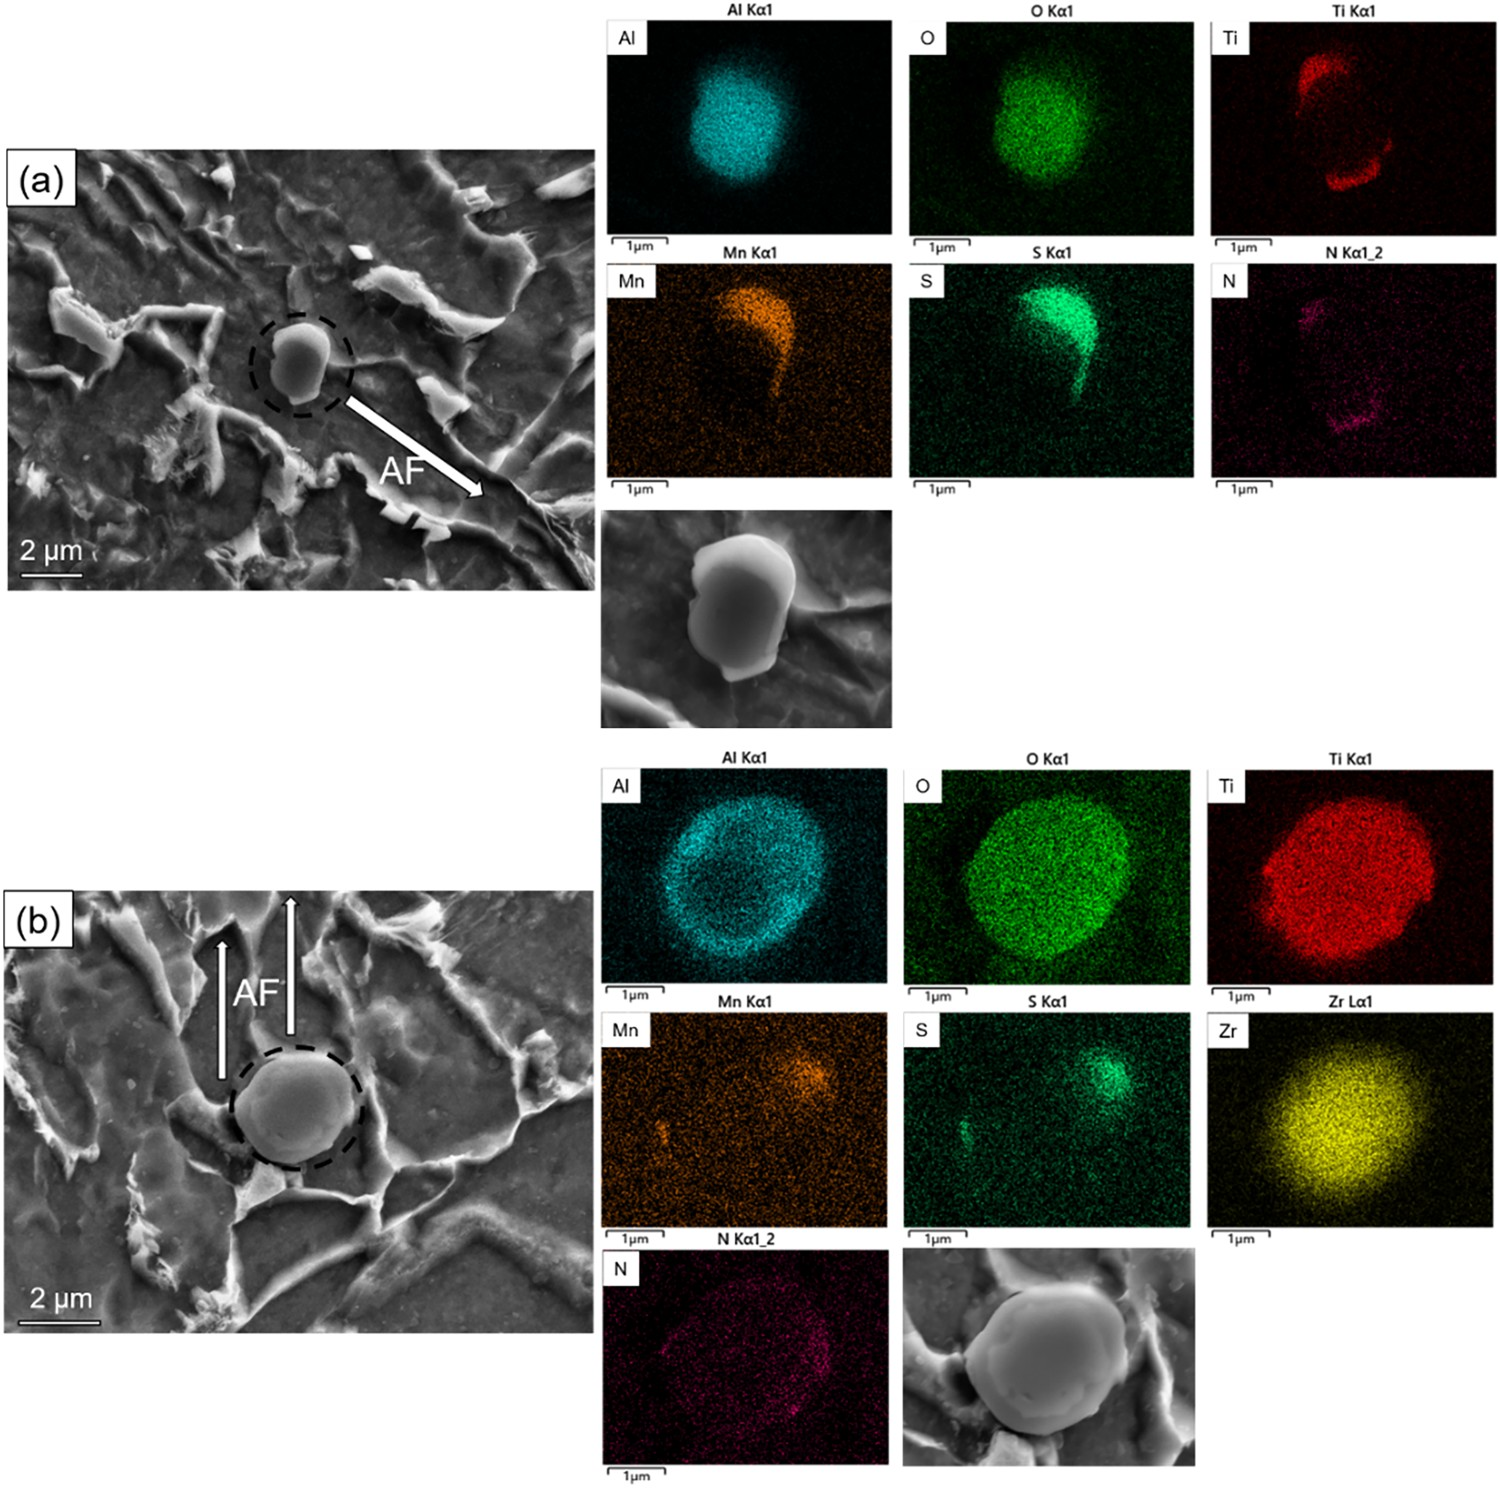
The average composition of inclusions in the different steels is shown in Figure 7. The types of inclusions illustrated in Figure 7 are classified as MnS, TiN, Al2O3, complex oxide inclusions such as Al-Ti-O or Al-Ti-Zr-O, and the precipitation on the surface of complex oxide inclusions. In Figure 7(a,b), the number fraction of pure MnS(it was the pure MnS if the content of MnS in inclusions was larger than 90%) decreased with the increase of the diameter of inclusions, and the Al-Ti-O-precipitation had a max number fraction in size of 2–2.5 μm. It is possible to argue that most of the fine inclusions were the pure MnS, while others were complex inclusions in the T1 steel. Figure 7(c,d) showed a considerable proportion of the Al-Ti-Zr-O-precipitation with the size of 1.5–2.5 μm both in the Z1 steel and the Z1 steel with input energy of 300 kJ cm−1. The equilibrium phase diagram with different Zr content in the steel was calculated using Fact-sage 7.1 and shown in Figure 8. The calculated composition of the steel was Fe-0.1C-0.38Si-1.77Mn-0.03S-0.03Al-0.038Ti-0.003O-0.002N and the temperature was 1200°C. The results showed that the dominant oxides of inclusions were the TiOx-Al2O3 at 0 ppm of Zr which was changed to the TiOx-Al2O3- TiOx -ZrO2 when the Zr content was increased to 80 ppm, and the content of ZrO2 was 91.4%. Typical inclusions in T1 and Z1 steel are shown in Figure 9, respectively. Figure 9(a) shows an image of the Al-Ti-O-precipitation in the T1 steel and the Al-Ti-Zr-O-precipitation is shown in Figure 9(b). The core of the inclusion in Figure 9(a) was Al2O3 and that in Figure 9(b) was ZrO2. In short, the number of Al-Ti-Zr-O-precipitation with a diameter of 1–3 μm was increased when the steel had added the content of 80 ppm Zr, which was a condition conducive to improving the nucleated possibility of AFs. Average composition of inclusions in different steels (a: 0 kJ cm−1 in the T1 steel, b: 300 kJ cm−1 in the T1 steel, c: 0 kJ cm−1 in the Z1 steel, d: 300 kJ cm−1 in the Z1 steel). Oxides composition of inclusions with an increment of Zr in the steel. Typical inclusions in different steels (a: T1 steel, b: Z1 steel).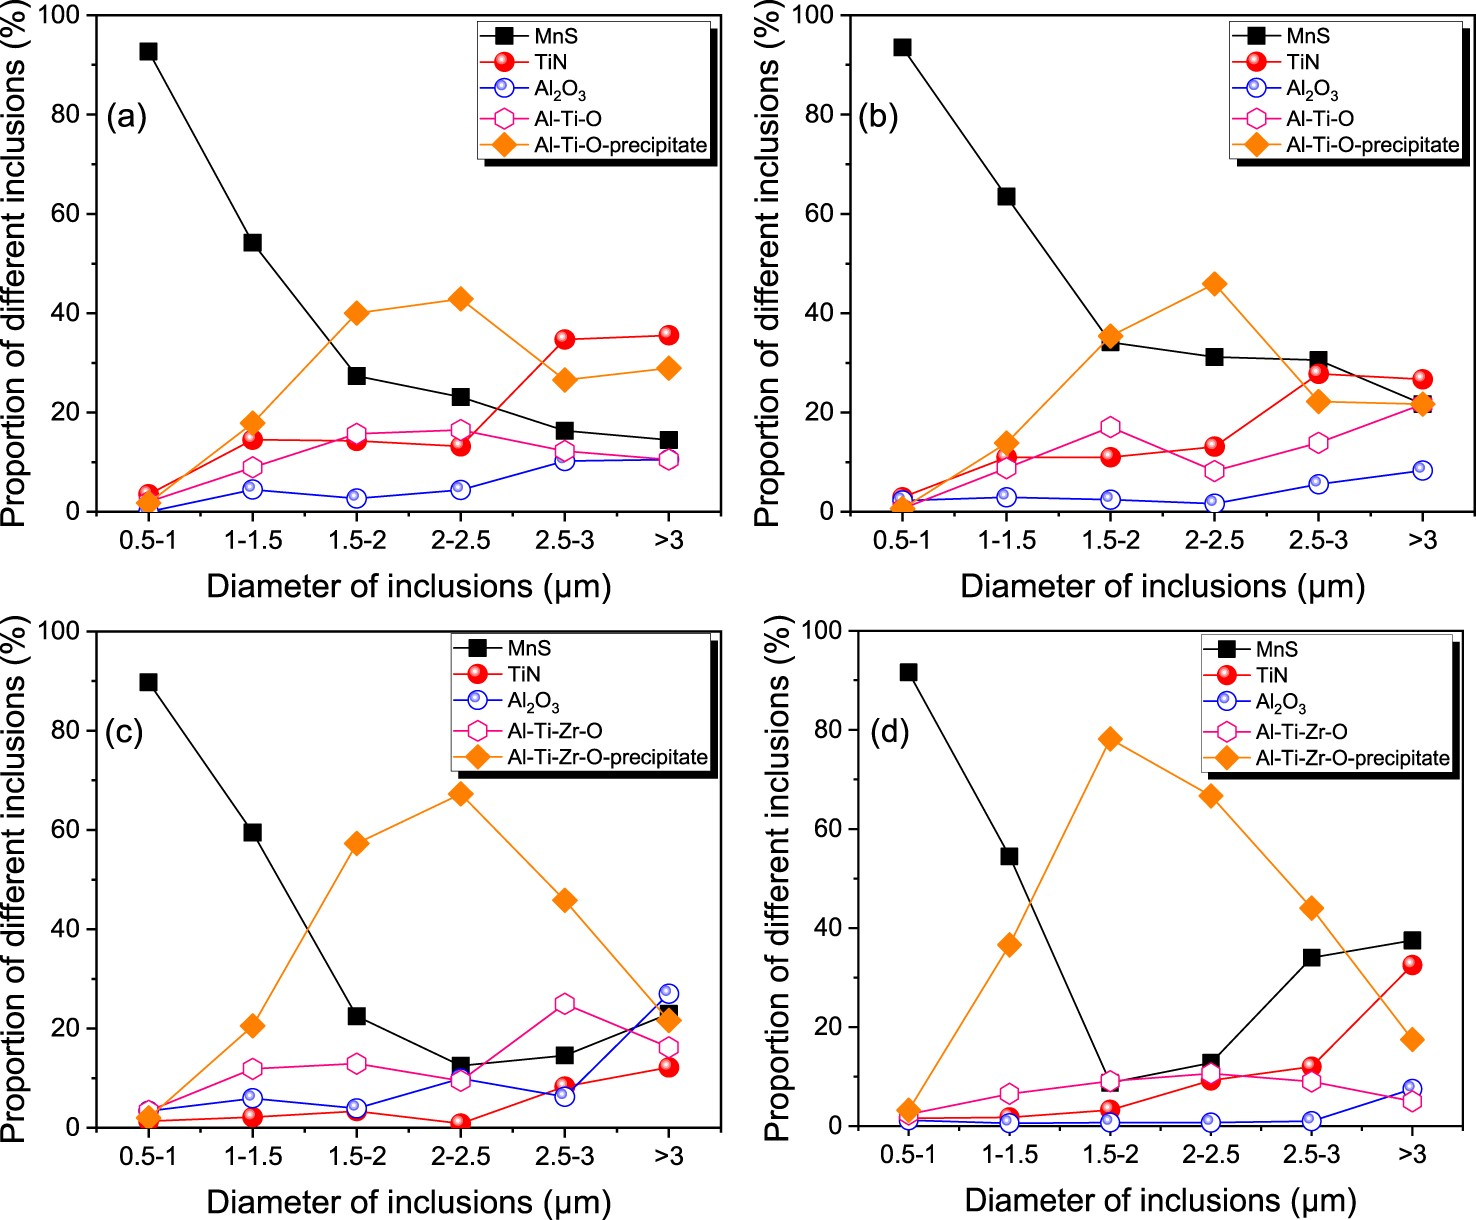
Surface of the fracture and microstructure in the HAZ
The average impact energy of samples is shown in Table 2. Without loading the welding thermal simulation, the average impact energy of the T1 steel was 25.7 J, and the average impact energy of the Z1 steel was 242.9 J. The average impact energy of the T1 steel and Z1 steel was reduced to 17.5 and 140.9 J respectively, when the sample was subjected to a simulated welding energy input of 300 kJ cm−1. Figure 10 shows the fracture characteristics of different impact test specimens. The torn area resembles bed scour in the T1 steel and Z1 steel after 300 kJ cm−1 input, and a large tear surface appeared in the fracture. The area of tear in the Z1 steel was smaller than in the other steel, and some dimples are found in Figure 10(c,d). This is illustrated by the higher impact energy associated with the smaller surface area of the rip. SEM images showing impact-fractured surfaces in the samples with varying heat inputs (a: 0 kJ cm−1 in the T1 steel, b: 300 kJ cm−1 in the T1 steel, c: 0 kJ cm−1 in the Z1 steel, d: 300 kJ cm−1 in the Z1 steel). Absorbed impact energy at −20°C.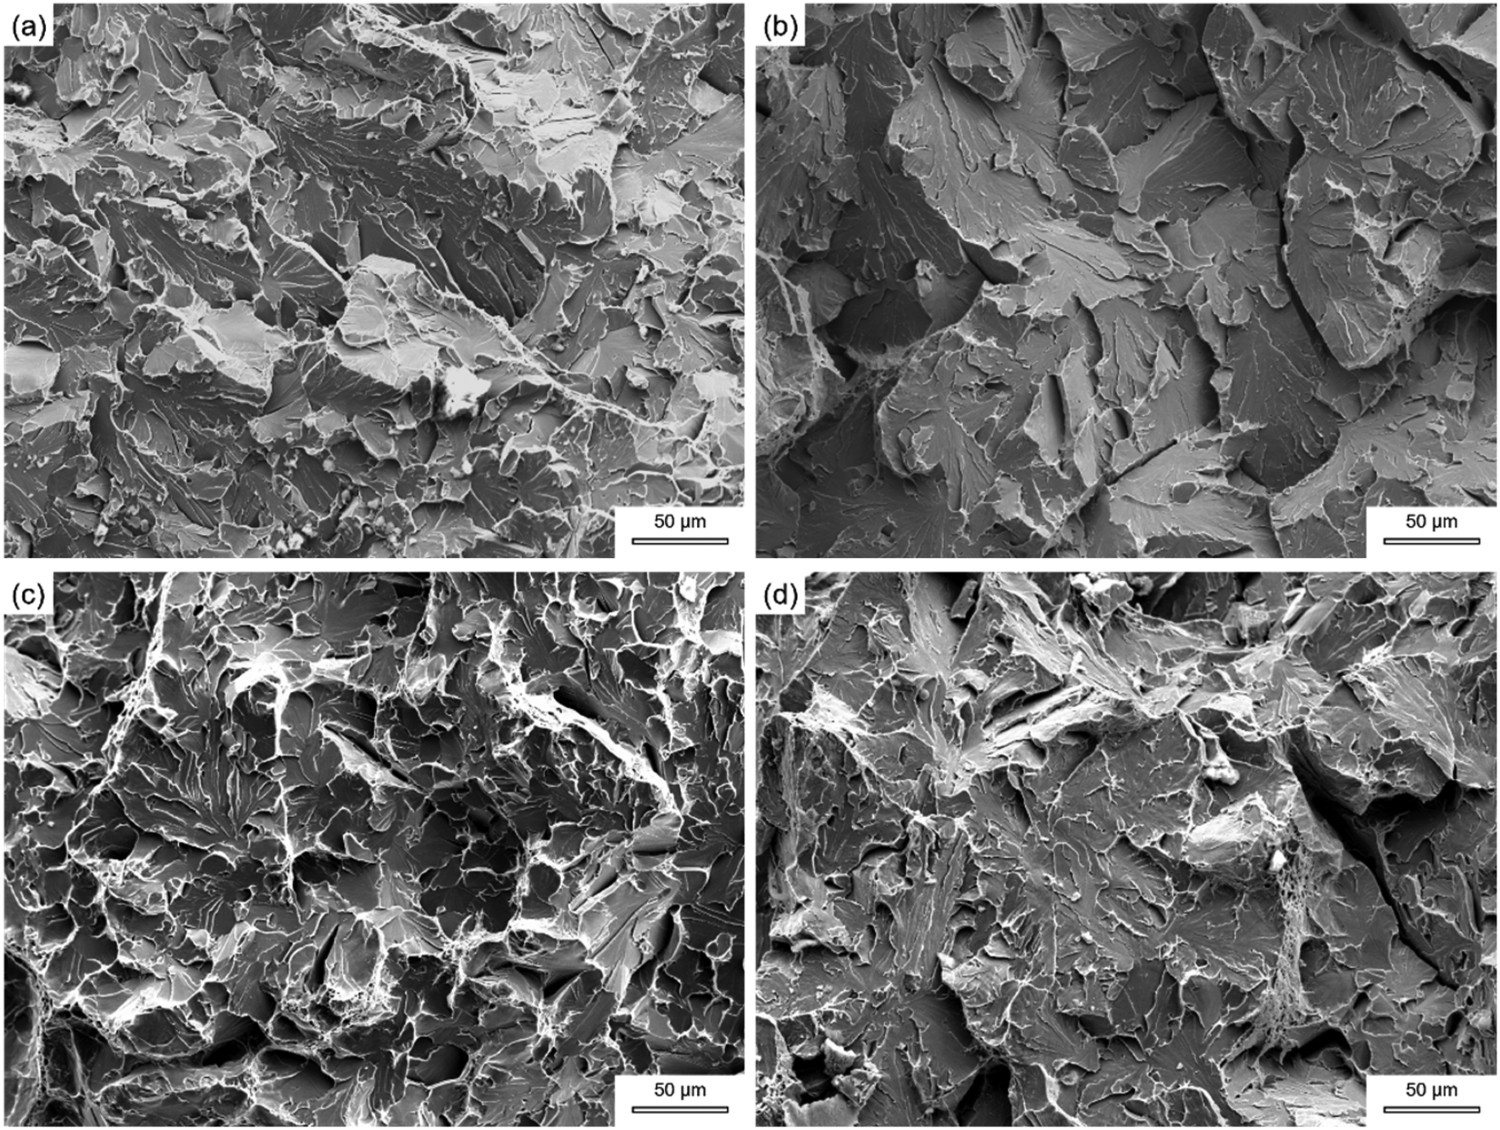
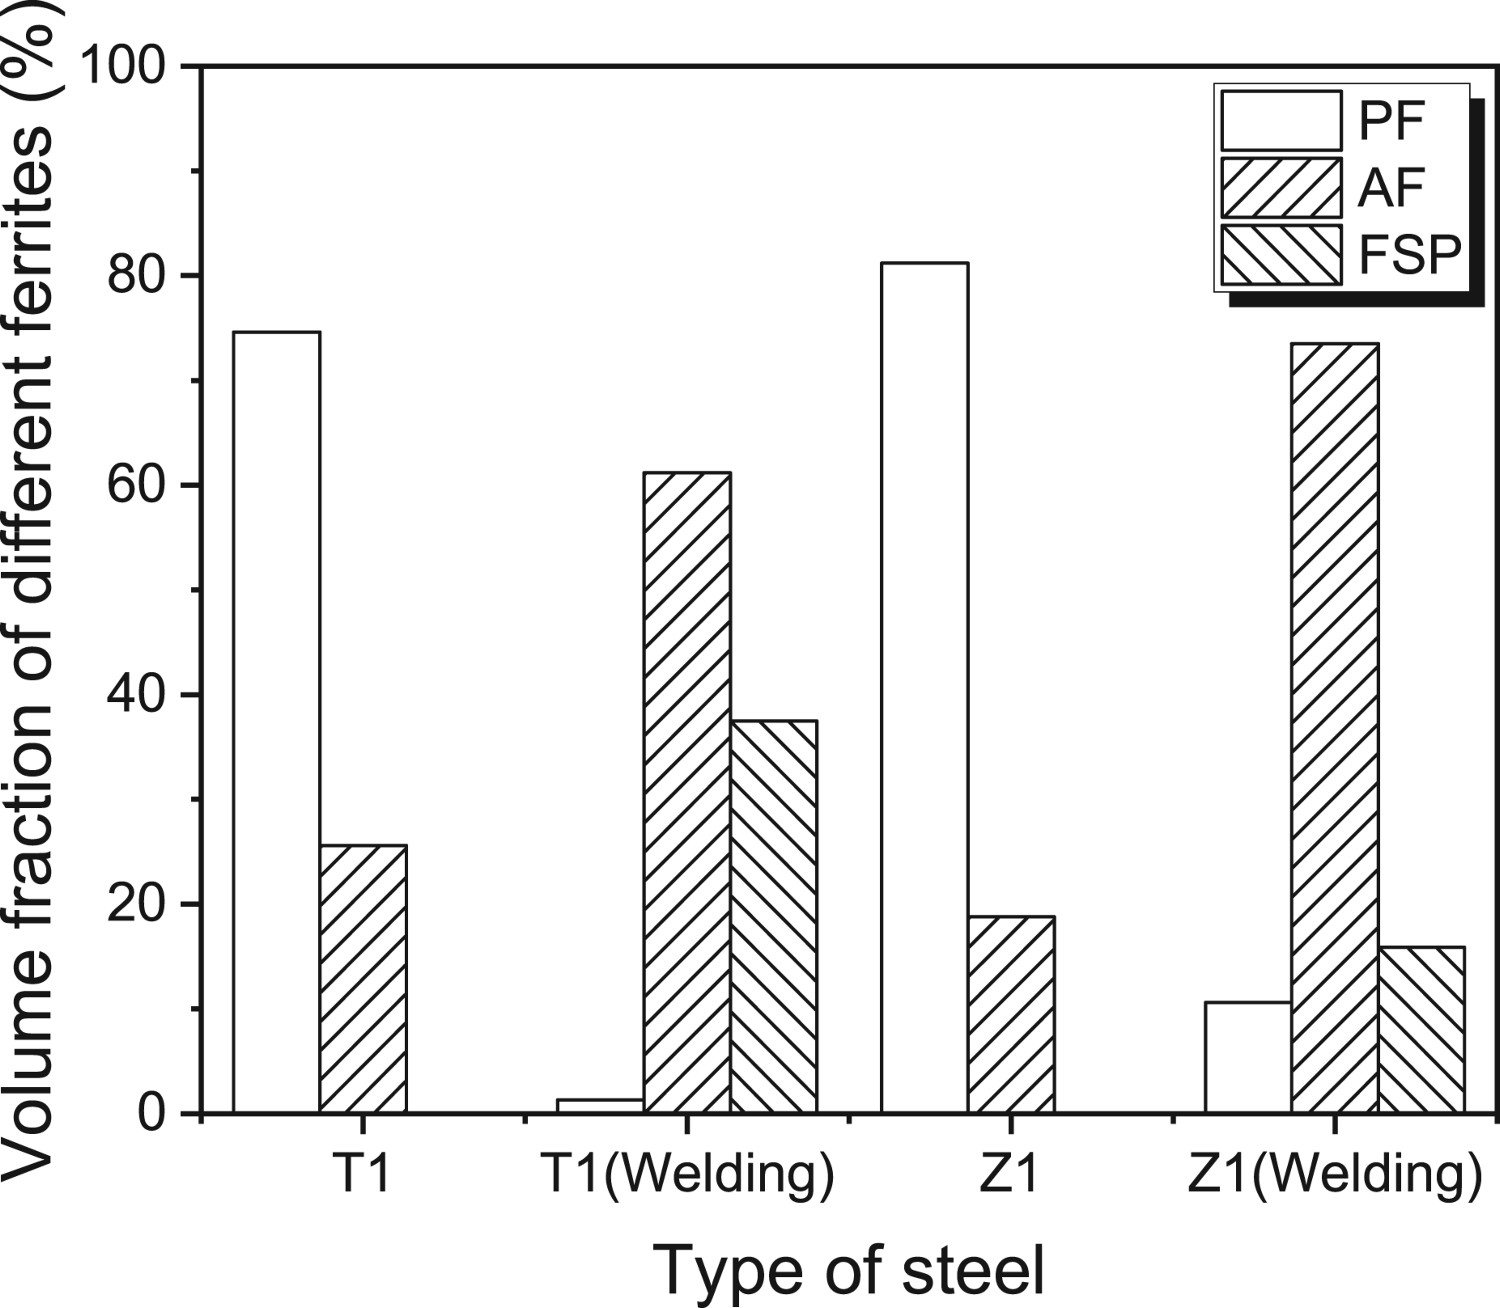
The optical microstructure in the HAZ is illustrated in Figure 11. The main type of ferrites were polygonal ferrite (PF) in Figure 11(a,c), and the pearlite was a dark dot in the photos. AFs and ferrites side-plate (FSPs) were the dominant ferrites in Figure 11(b), while AFs and PFs were the dominant ferrites in Figure 11(d). The microstructures of the corresponding samples were statistically analysed using a point counting methodology in accordance with the ASTM E562 standard. The volume fractions of PFs, AFs, and FSPs are shown in Figure 12. In Figure 12(a,c), the volume fraction of PFs was 74.6% and 81.2%, and FSPs were not counted. In addition, the average size of PFs in Figure 12(a) was 21 μm which was larger than it (14 μm) in Figure 12(c). In Figure 12(b,d), the volume fraction of AFs was increased to 61.2% in the T1 steel and 73.5% in the Z1 steel after the thermal simulation welding with a heat of 300 kJ cm−1. AFs played an essential role in changing crack propagation direction [32,33]. FSPs and PFs were the primary nucleated ferrite on the grain boundary of the austenite, which was not a desirable microstructure to enhance the toughness of steel [34–36]. The correct combination of AFs, FSPs, and PFs in Z1 steel with an input energy of 300 kJ cm−1 and the fact that the volume fraction of AFs reached 73.5% was responsible for the enhanced absorbed impact energy in Z1 steel compared to T1 steel. Optical microstructure with different steels (a: 0 kJ cm−1 in the T1 steel, b: 300 kJ cm−1 in the T1 steel, c: 0 kJ cm−1 in the Z1 steel, d: 300 kJ cm−1 in the Z1 steel). The volume fraction of different ferrites in the steel.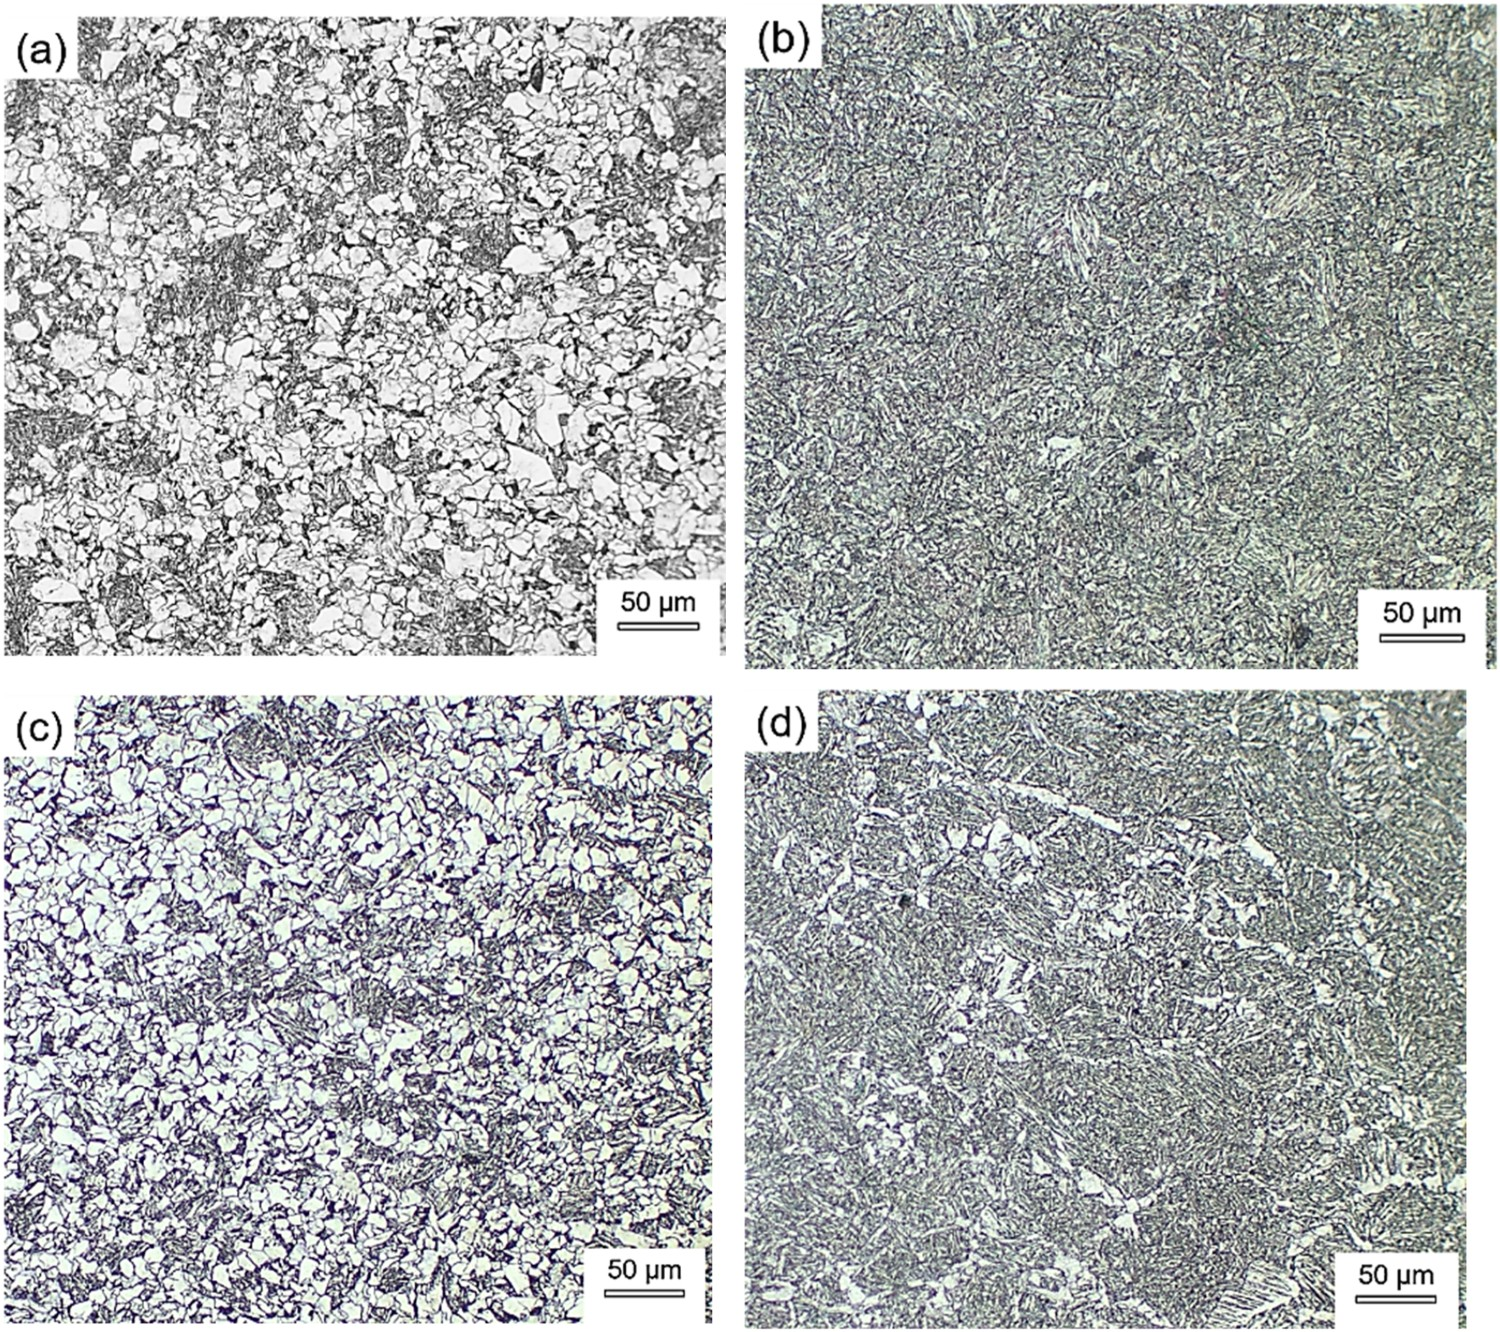
Nucleation potential of acicular ferrites
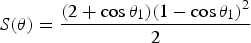
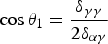
The nucleation of AFs on the surface of the inclusion is shown in Figure 13, indicating that Al-Ti-O-precipitation and Al-Ti-Zr-O-precipitation have a stronger potential to enhance the nucleation of AFs. In the previous work [37], the interface energy between Al-Ti-Zr-O-precipitation and ferrites or austenite could be calculated by Equation (3), and the stress angle between the inclusion and AFs was given by Equation (4). The nucleation of AFs on inclusions (a: 300 kJ cm−1 in the T1 steel, b: 300 kJ cm−1 in the Z1 steel).


To calculate the stress angle of the TiN, TiOx, and ZrO2, the following literature data were used: the interfacial energy between ferrite and austenite was 0.75 J m−2 and the interfacial energy between austenite and austenite was 0.75 J m−2 [39], the cosine of the contact angle in TiN, TiOx, ZrO2 were 0.673 [40], 0.808 [40], 0.557 [41]. According to Equations (5) and (10), if the value fi < S, the nucleation of AFs on inclusions more possibly occurred than the nucleation of FSPs on the grain boundary of austenites. The nucleation potential of AFs per unit area was calculated by Equation (12), and the average nucleation potential of inclusions was calculated by Equation (13).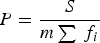

Results and parameters of the calculation.
Conclusions
The average impact energy was 25.7 J and 242.9 J for the T1 and T2 steel, respectively. When the sample was subjected to a simulated welding energy input of 300 kJ cm−1, the average impact energy of the steel above was reduced to 17.5 and 140.9 J, respectively. The volume fraction of AFs in the T1 steel and the Z1 steel was 74.1% and 81.2%, respectively, at 300 kJ cm−1 energy was loaded into the sample. The primary type of inclusions was transformed from Al-Ti-O-precipitation to Al-Ti-Zr-O-precipitation, and the number density and the average diameter of inclusions increased when the content of Zr was added to 80 ppm. Among them, the number of the Al-Ti-Zr-O-precipitation concentrated in 1–3 μm had a significant addition. By theoretical calculations, the nucleation potential of AFs per unit area increased from 24.4 to 76.7, and the average nucleation potential of inclusions reduced from 2.02 to 1.67 when the content of Zr was increased to 80 ppm. The ability to induce acicular ferrite transformation increased by raising the ratio of inclusions of 1–3 μm Al-Ti-Zr-O, which was a reason that the toughness was enhanced by improving the nucleation of AFs.
Footnotes
Disclosure statement
No potential conflict of interest was reported by the author(s).