
Abstract
Background: Alcohol use is a concerning issue for the military given its potential negative impact on human performance. Limited data are available regarding the incidence of alcohol use disorder in the military, which is critical to understand to evaluate force readiness, as well as for preventative initiatives and treatment planning. The aim was to examine the alcohol use disorder incidence rates (overall and across demographics) among active duty service members from 2001 to 2018. Methods: Data on 208,870 active duty service members between 2001 and 2018 from the Defense Medical Epidemiology Database was examined. Incidence rates were analyzed to determine the diagnostic rates of AUD (including both alcohol abuse and dependence), which were then examined by sex, age, service branch, military pay grade, marital status, and race. Results: Incidence rates of AUD in active duty service members (per 1,000 service members) ranged from 6.45 to 10.50 for alcohol abuse and 5.21 to 7.11 for alcohol dependence. Initial diagnoses of new-onset AUD occurred most frequently within 20–24 year-old, white, male, and non-married U.S. Army service members in the enlisted pay grades of E-1 to E-4. Statistically significant differences (p <.001) were found between observed and expected counts across all examined demographic variables. Conclusions: To our knowledge, this is the first study to provide a comprehensive examination of AUD incidence rates in an active-duty military population over an extended 18-year period and during the last decade. Incidence rates were higher than expected for alcohol dependence and lower than expected for alcohol abuse. Given the untoward effects of AUD on overall health and force readiness, active-duty service members may benefit from more advanced preventative interventions to decrease incidence rates of AUD over time. Future research should use these data to develop targeted interventions for the demographics at greatest risk.
Introduction
In the United States, an estimated 29.1% of individuals are diagnosed with an alcohol use disorder (AUD). 1 Alcohol use disorders, including abuse and dependence, can be highly disabling, leading to impaired productivity and social functioning, along with a negative impact on human faculties such as intuition, perception, memory, and reasoning. 2 AUD is a concerning issue for the military given its potential negative impact on human performance, particularly in situations that have significant occupational hazards. Further, combat exposure is a know risk factor for greater alcohol misuse in service members, compounding concerns related to occupational risk. 3 , 4 Notably, limited data are available regarding the incidence (i.e., the number of new diagnoses in a given year per 1,000 people) of AUD in the military, which is critical to understand to evaluate force readiness, as well as for preventative initiatives and treatment planning. The current study aimed to inform our understanding of the International Classification of Diseases (ICD) AUD incidence rates (overall and across demographics) among active duty service members from 2001 to 2018.
According to the World Health Organization's ICD-10 criteria, 5 alcohol abuse is defined as the disproportionate or maladaptive use of alcohol on a regular basis or binge sessions that contribute to problems in an individual's personal life; alcohol dependence is defined as an individual placing a higher priority toward alcohol use than other behaviors. Large scale studies of active duty military personnel have documented prevalence rates of AUD ranging between 17.6% and 19.5% for moderate drinkers, 15.4% to 25.5% for moderate to heavy drinking, and 6.0% to 20.1% for heavy drinking. 6 – 9 Similarly, studies examining binge drinking behavior found rates ranging from 26.6% to 47.0% of surveyed service members. 6 , 8
Whereas the prevalence of AUD (i.e., the total number of diagnoses during a certain timeframe proportionate to the total population at risk within the same timeframe) has been more extensively studied among active duty service members, incidence rates are less established and vary widely based on whether medical records or self-report data are used. A Medical Monthly Surveillance Report by the Armed Forces Health Surveillance Center 10 used medical record encounters from the Defense Medical Surveillance System (DMSS) of active duty service members between 2001 and 2010 to determine incidence rates of alcohol-related diagnoses and found an overall decrease in incidence rates over 10 years. Incidence rates were higher in 2001 (14.72 per 1,000 person years) than in 2010 (13.04 per 1,000 person years) with the highest rates among white, junior enlisted, Army males. In contrast, when using self-report data of 97,021 active duty service members during a slightly briefer timeframe (2001–2008), 24.1% reported binge-like or problem drinking. 11
Several significant gaps in the current literature are important to address. First, no studies have evaluated AUD incidence rates in nearly a decade. Second, the relationship(s) between AUD diagnoses and demographic variables is unclear thereby complicating the development of targeted preventative interventions. To address these gaps, the purpose of this study is to expand upon the findings from the Armed Forces Health Surveillance Center 10 by performing a retrospective analysis of active duty medical records from the Defense Medical Epidemiology Database (DMED) to determine whether there are differences in incidence of AUD (alcohol abuse and alcohol dependence) from 2001 to 2018 by demographic factors (e.g., age, sex, marital status, race, branch of service, and pay grade) among active duty U.S. military. Considering the current literature indicates that deployments are related to AUD 11 , 12 , and the military's more recent operational tempo for combat deployments have slowed (see Moore and Peterson 13 ), it was hypothesized that new- onset incidence rates of AUD per 1,000 person years would decrease from 2001 to 2018. In addition, consistent with results published from the Armed Forces Health Surveillance Center 10 , it was hypothesized that when examining demographic factors, junior enlisted males in the Army would be the most frequently diagnosed.
Method
Participants and procedures
Data source
Annual incidence data were retrospectively analyzed to determine the rates of AUD. Data from the DMED was those United States active duty military service members (N = 360,722) between the years 2001–2018 who had AUD diagnoses following the criteria described below. The DMED database validates its data against the Department of Defense's medical records and provides researchers with de-identified group-level count data. To ensure that incidence rates were not overestimated, only AUD diagnoses under the ambulatory visits category and from first occurrences were examined (i.e., first documented diagnosis within service member's military medical health record). Diagnostic rates were examined by all available demographics in DMED.
Participants
The total sample was primarily white (69.0%), male (85.0%), between the ages of 20 and 24 (33.0%), married (55.0%), in the Army (37.0%), and between the rank of E-1 to E-4 (44.0%). Age of participants were analyzed using six groups (i.e., <20, 20–24, 25–29, 30–34, 35–39, ≥40 years). Both males and females were included in the sex analysis. Service members were classified as either “married” or “not married.” Race was categorized as “white,” “black,” or “other.” Service branches were classified as Army, Navy, Marine Corps, and Air Force. Ranks were classified by enlisted (E-1 to E-4 and E-5 to E-9) and commissioned officers (O-1 to O-3, O-4 to O-9). This study was reviewed and deemed exempt by the local Institutional Review Board due to the inability to link data back to individuals using the de-identified data from the DMED. No statistical power analysis was conducted prior to the study as this study utilized a non-probability, purposive design examining only those service members who were diagnosed with AUD while serving on active duty.
Data analysis
AUD data (alcohol abuse and alcohol dependence) were accessed on October 8, 2019 using ICD-9 − 303.90 & 305.00 and ICD-10 – F10.20 & F10.10 diagnostic codes. It was not possible to report the location where the diagnosis was made (e.g., emergency room, routine medical appointment, or routine physical) due to the limitations in the DMED database. AUD diagnoses could have been made at any point in which a service member received medical treatment. Descriptive statistics and a one sample Chi-square goodness of fit test was used to analyze over-or-under representation of AUD within demographic subgroups. The one sample Chi-Square goodness of fit test estimated whether the observed distribution of cases in a specified categorical variable (e.g., new-onset AUD by sex) followed an expected, or hypothesized, distribution (e.g., sex distribution in the military), which was obtained from the DMED at time of data extraction. A significant finding for the one sample Chi-Square goodness of fit test indicated a significant difference between observed proportions and hypothesized distributions.
The hypothesized distributions of data for each military composition variable were considered the expected counts of diagnoses and each expected count was obtained from the DMED at the time of data extraction. Expected counts were derived from the average percentage of service members within a certain variable. For example, female service members accounted for 14.83% of the total active population, suggesting that females would account for 14.83% of AUD diagnoses during this study. Using the data from DMED, calculations of the mean yearly population of service members was 1,365,958, ranging from 1,283,682 in 2017 to 1,418,894 in 2010.
Results
Rate of incidence of AUD from 2001 to 2018
Alcohol abuse accounted for 57.9% (n = 208,870) of the new-onset AUD cases between 2001 and 2018. Incidence rates per 1,000 people ranged from 6.45 in 2018 to 10.50 in 2009 and averaged 8.47 (Figure 1; Average incidence rates of AUD from 2001 to 2018 [N = 360,722]). Initial diagnoses of new-onset alcohol abuse occurred most frequently within the following: (1) service members between 20 and 24 years old at 55%; (2) males at 87%; (3) not married at 66%; (4) white at 71%; (5) Army at 51%, and (6) in the enlisted pay grades of E-1 to E-4 at 74% of the sample (Table 1).
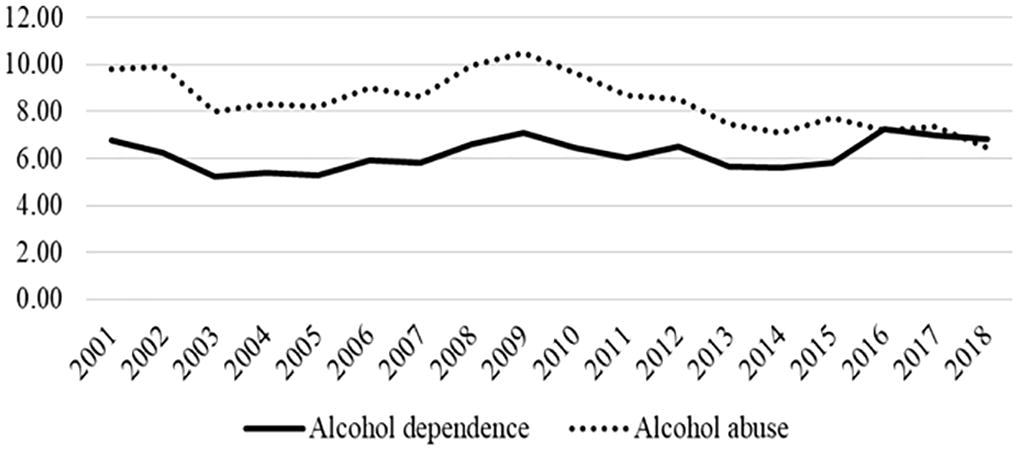
Average incidence rates of AUD from 2001 to 2018 (N = 360,722).
Demographics of military service members diagnosed with alcohol use disorder between 2001 and 2018 (N = 360,722).
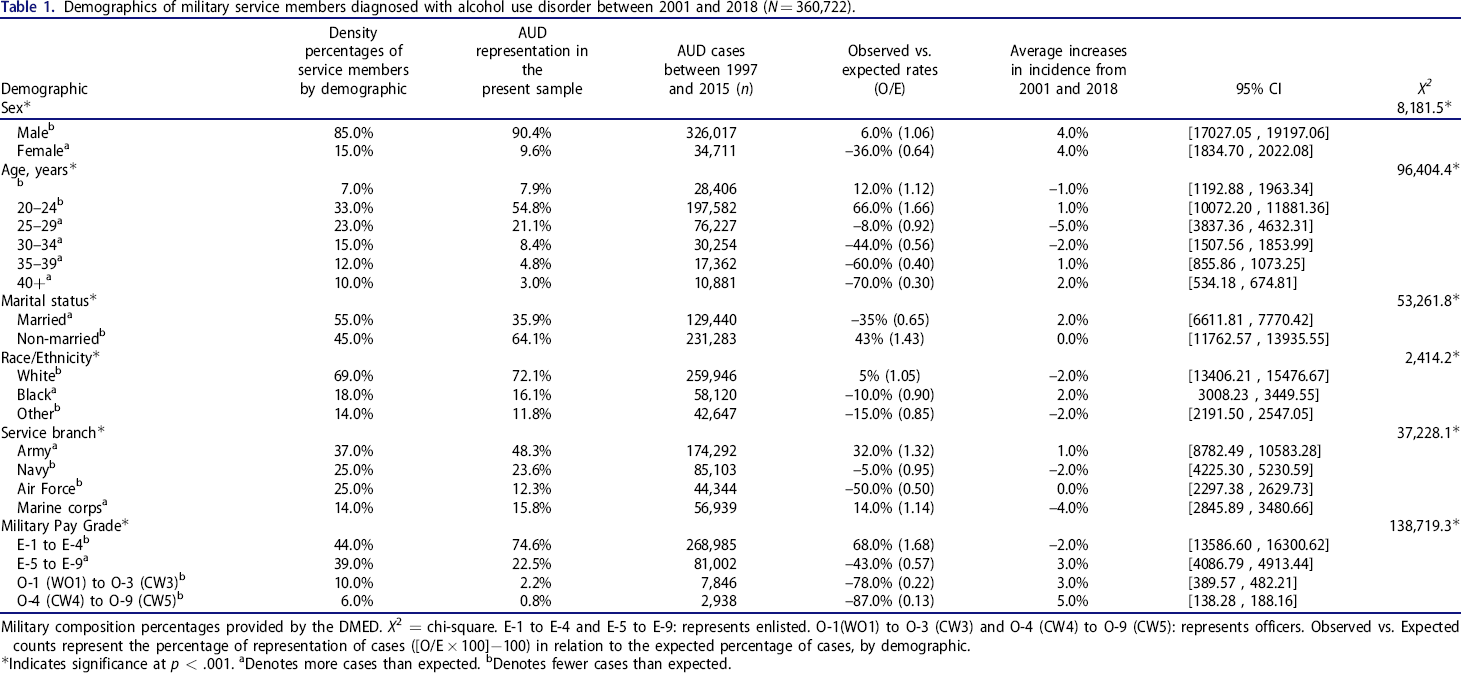
Military composition percentages provided by the DMED. X2 = chi-square. E-1 to E-4 and E-5 to E-9: represents enlisted. O-1(WO1) to O-3 (CW3) and O-4 (CW4) to O-9 (CW5): represents officers. Observed vs. Expected counts represent the percentage of representation of cases ([O/E × 100]−100) in relation to the expected percentage of cases, by demographic.
Indicates significance at p < .001.
Denotes more cases than expected.
Denotes fewer cases than expected.
Alcohol dependence accounted for 42.1% (n = 151,852) of new-onset cases between 2001 and 2018. Alcohol dependence incidence rates per 1,000 people ranged from 5.21 in 2003 to 7.23 in 2016 and averaged 6.18 (Figure 1). Initial diagnoses of new-onset alcohol dependence occurred most frequently within the following: (1) service members between 20 and 24 years old at 50%; (2) males at 86%; (3) not married at 61%; (4) white at 73%; (5) Army at 45%; and (6) in the enlisted pay grades of E-1 to E-4 at 68% of the sample (Table 2).
Counts of military service members diagnosed with alcohol use disorder by age from 2001 to 2018 (N = 360,722).
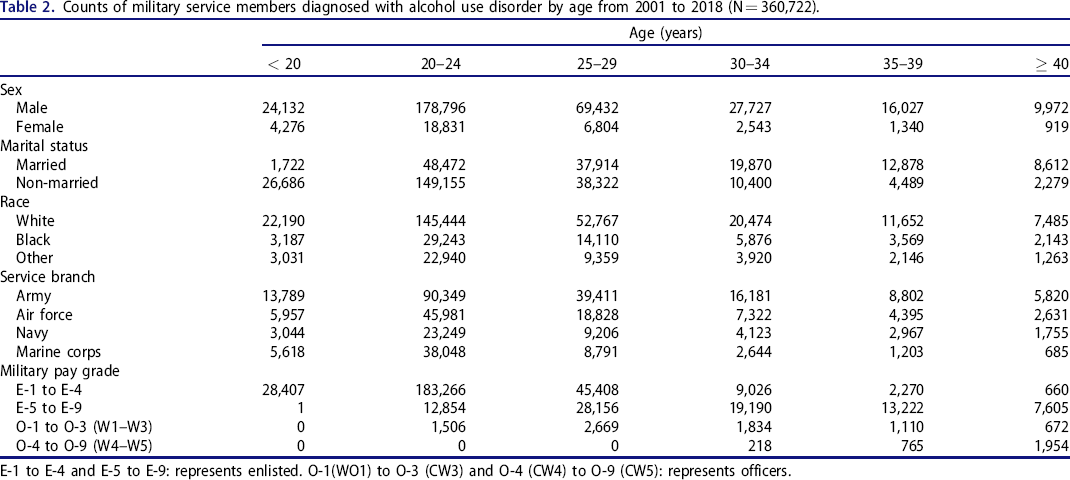
E-1 to E-4 and E-5 to E-9: represents enlisted. O-1(WO1) to O-3 (CW3) and O-4 (CW4) to O-9 (CW5): represents officers.
Representation of demographic factors within active duty service members
Age
There was a significant difference in the observed age distributions of new-onset AUD from the hypothesized distribution (X2 (5, 360,712) = 96404.35, p < .001). Active duty service members aged <20 years presented (n = 28,406; 7.9%) with a higher than expected (n = 25,249; O/E 1.12) distribution. The age group 20–24 years presented with the overall highest number of new-onset AUD (n = 197,582; 54.8%) and exceeded what was expected (n = 119,035; O/E = 1.66). The age group 25–29 was the second highest to present new-onset AUD (n = 76,227; 21.1%), however observed rates were lower than expected (n = 82,964; O/E = 0.92). Those aged 30–34 years likewise presented (n = 30,254; 8.4%) with a smaller than expected (n = 54,107; O/E = 0.56) distribution, as did those aged 35–39 years who presented with fewer cases than expected (n = 43,285), with the observed distribution at (n = 17,362; O/E = 0.40; 4.8%). Finally, the age group >40 years presented with the lowest amount of new-onset AUD diagnoses (n = 10,881; 3.0%), which was also fewer than expected (n = 36,071; O/E = 0.30).
Sex
There was a significant difference between the numbers of new-onset cases (X2 (1, 360,728) = 8,181.50, p < .001) by sex over time. Males presented with 326,017 (90.4%) new- onset AUD diagnoses, which was higher than expected (n = 306,619; O/E = 1.06), whereas females presented with 34,711 (9.6%) new cases, which was a lower than expected (n = 54,109; O/E = 0.64) distribution.
Marital status
The observed distribution of new-onset AUD by marital status was significantly different over time (X2 (1, 360,723) = 53261.8, p < .001). Service members who were not married presented with 231,283 (64.1%) cases of AUD, which was a higher than expected (n = 162,325; O/E = 1.43) distribution. Conversely, the number of new-onset cases in married service members (n = 129,440; 35.9%) were fewer than expected (n = 198,398; O/E = 0.65).
Race
Significant differences were observed by race over time (X2 (2, 360,713) = 2,414.18, p < .001). White service members presented with the highest number of new-onset AUD (n = 259,946; 72.1%) than expected (n = 246,428; O/E = 1.05). The observed distribution for black service members (n = 58,120; 16.1%) was fewer than expected (n = 64,286; O/E = 0.90). The service members who identified as Other presented with 42,647 (11.8%) new cases, which reflected fewer new-onset cases than expected (n = 50,000; O/E = 0.85).
Service branch
Significant differences in AUD incidence rates over time also existed by service branch (X2 (3, 360,678) = 37,228.13, p < .001). The service branch that presented with the highest number of new-onset AUD was the Army (n = 174,292; 48.3%), exceeding what was expected (n = 132,130: O/E = 1.32). The Navy had the second highest new-onset AUD cases (n = 85,103; 23.6%), which was lower than the expected number of cases (n = 89,277; O/E = 0.95). The Marines presented with a higher observed (n = 56,939; 15.8%) than expected distribution (n = 49,995; O/E 1.14). Lastly, the Air Force presented (n = 44,344; 12.3%) with fewer observed cases than expected (n = 89,277; O/E = 0.50).
Military pay grade
The distribution of AUD by military pay grade over time was significantly different from the hypothesized value (X2 (3, 360,771) = 138,719.34, p < .001). Enlisted service members E-1to E-4 presented (n = 268,985; 74.6%) higher observed cases than expected (n = 160,343; O/E = 1.68) and E-5 to E-9 presented with fewer observed cases (n = 81,002; 22.5%) than the expected distribution (n = 142,122; O/E = 0.57). Junior officers (O-1 to O-3) presented with fewer observed cases (n = 7,846; 2.2%) than expected (n = 36,442; O/E = 0.22). Officers ranked O-4 to O-9 presented with fewer observed cases (n = 2,938; 0.8%) than expected (n = 21,865; O/E = 0.13).
Discussion
Understanding the incidence rate of AUD (alcohol abuse and dependence) has important implications for appraising force readiness and developing strategic initiatives for prevention and treatment intervention. To our knowledge, this is the first study to examine AUD incidence rates across the duration of post-9/11 operations through 2018. As anticipated, overall new-onset AUD diagnoses in active duty service members decreased from 2001 (n = 22,603) to 2018 (n = 17,184), which is similar to the findings from the Armed Forces Health Surveillance Center. 10 Notably, the observed rates of new-onset AUD in the current study were lower during the duration of the study and specifically between 2001 and 2010 (range 5.21 to 10.50 per 1,000 person years) compared to the incidence rates between 2001 and 2010 reported by the Armed Forces Health Surveillance Center (range 10.00 and 14.72 per 1,000 person years). 10 The differences between the two studies are likely due to the fact that the Armed Forces Health Surveillance Center 10 study focused on alcohol-related diagnoses and included other diagnostic codes besides alcohol abuse (e.g., the toxic effect of alcohol, excessive blood-alcohol concentration, and alcohol poisoning), along with the exclusion of alcohol dependence.
Although aggregate abuse and dependence diagnoses decreased in keeping with our hypothesis, this was largely accounted for by changes in alcohol abuse. Specifically, incidence rates for alcohol abuse decreased from 2001 to 2018, whereas rates for alcohol dependence remained stable. These differences in rates within conditions suggests that the distinction between alcohol abuse and dependence may be important for strategic planning. That is, although abuse and dependence symptoms can both be inherently problematic, when not separating diagnoses, it could appear that problems with alcohol are improving over time, when in actuality more severe problems (i.e., dependence) might be occuring. Notably, in the 5th edition of the Diagnostic and Statistical Manual for Mental Disorders (DSM-5) 14 abuse and dependence diagnoses have been replaced with one AUD diagnosis with mild, moderate, severe subclassifications. ICD-10 codes for abuse and dependence continue to be used in DSM-5 to capture mild (F10.10) and moderate/severe (F20.20) subclassifications, respectively. Whether the incidence pattern observed in the current study holds over time for mild, moderate, and severe subclassifications would be an important direction for future research.
The overall decline in alcohol abuse corresponds with gradual slowing over time in the military's operational tempo for combat deployments, meaning that fewer service members were being deployed to combat zones. 13 One notable exception is the incidence rates of alcohol abuse from 2007 to 2009, which coincide with the influx and outflux of troops for two major post-9/11 operations. 15 – 17 Although there could be multiple contributing factors to this increase, these data are consistent with previous research documenting a positive relationship between combat exposure and increased rates of alcohol misuse. 3 , 4 , 8
In addition to post-9/11 operations, distinct differences were noted among the demographic factors and diagnoses of AUD. Concerning age, active duty service members 20 − 24 years old showed the highest number of cases for AUD and were statistically overrepresented among diagnoses. These findings were consistent with the Armed Forces Health Surveillance Center 10 , which found service members between the ages of 21−24 years most at risk for AUD. The number of cases of AUD decreases with each subsequent age group, although the 35−39 age group had fewer cases than the 25−29 age group, yet more than the >40 age group. In other words, previous research has found that individuals using alcohol at a moderate to a high level may eventually mature out of the need to use alcohol regularly as they age leading to the less likely he/she will be diagnosed with new-onset AUD. 18
Females were less likely than males to be diagnosed with an AUD. Only 9% of females were diagnosed with AUD during the study's timeframe. These findings are also consistent with the Armed Forces Health Surveillance Center (9.13%) and Smith and colleagues (15.3%). 10 , 11 The gap between sexes may be due to military men being more likely to use excessive drinking as a coping technique, 19 and have greater prevalence rates in alcohol use disorder. 20 This may also be related to previous findings showing combat exposure contributes to AUD. In the total force, females account for 15% of the population but in the deployed force they account for only 10.4%; 21 as the contemporary operating environment is largely asymmetrical warfare, it could be that combat exposure equally contributes to AUD in males and females. To our knowledge, this has not been examined in the current literature and we see this as an important avenue for future research.
With respect to marital status, active duty married service members were less likely to, while non-married service members were more likely to, be diagnosed with an AUD. Age could have played a factor in the distribution since the majority of service members are younger than 25 years old. These findings are not unique and previous literature has shown that being young and unmarried increases the risk for alcohol use in active duty service members. 22 – 25 This may demonstrate the benefits of marriage for active duty service members as it provides a support system and corresponding protective factors against alcohol misuse. 26
Of note, there was a significant difference in AUD rates between service branches. Service members in the Army had the greatest number of cases, followed by the Navy, Air Force, and Marines. Previous research has shown that the Army was at the highest risk for AUD 10 although the current study found a lower average incidence rate of 11.63 between 2001 and 2018. The differences between incidence rates may be a result of different drinking cultures within each branch, and this warrants further study. Alternatively, the increased rates of AUD in the Army may be explained by their generally higher rate of combat exposure compared to other branches, as well as higher rates of traumatic brain injury. 8 , 27 AUD incidence rates have been shown to be higher among those with versus without a history of TBI. 12 The contributing role of TBI and other common comorbidities (e.g., posttraumatic stress disorder, depression, etc.) on AUD incidence is an important area for future research. Future studies should further examine the role that external factors play in impacting the differences of AUD diagnoses amongst demographic factors in service members.
A strength of the study was the use of observed versus expected incidence rates to assess findings. Secondly, incidence rates were based on a healthcare provider-diagnosis of AUD, as opposed to self-report measures. However, diagnostic medical record data do introduce some limitations into this study. First, the DMED only provides information for service members who have been diagnosed with AUD within the military health system and does not include service members who may have been diagnosed elsewhere. Second, there are known challenges with analyzing large medical record datasets, such as measurement error, coding errors, and misdiagnosis. 28 Taking these limitations into account, there is a possibility of inflated AUD rates; noting that, incidence rates are likely underestimated.
Conclusions
This study provides an 18-year picture of AUD within active duty service members during post-9/11 operations. The reported incidence rates of AUD have important implications for planning service delivery or policy reform and offers information to assist with the proper acquisition and training of staff to provide evidence-based treatment to service members with AUD. For example, the DoD policy is to periodically assess the extent of alcohol and drug use (DoD, 1997), the timeline frequency may need to be modified based on operational tempo. 29 In addition, an insight into the demographics with the highest risk of developing AUD may help current and future preventative intervention efforts place a greater focus on service members within high-risk demographics in order to decrease incidence rates over time.
Footnotes
Disclosure statement
None of the authors report a conflict of interest. The views and information presented are those of the authors and do not represent the official position of the U.S. Army Medical Center of Excellence, the U.S. Army Training and Doctrine Command, or the Departments of Army, Department of Defense, or U.S. Government.
Author contributions
JJ, KS, BM, and SB conceived of the idea for the manuscript. JJ took the lead in writing the manuscript. All authors, JJ, KS, BM, and SB provided critical feedback and contributed to the writing of the manuscript.