
Abstract
This is the first account of the history of modelling dendritic and cellular solidification. While Part I reviewed the progress up to the year 2000 [Kurz W, Fisher DJ, Trivedi R. Progress in modelling solidification microstructures in metals and alloys: dendrites from 1700 to 2000. Intern Mater Rev. 2019;64:311–354], Part II retraces our modelling capabilities developed during the early years of the present century. Advances in in-situ X-ray observations of solidification of metallic alloys are also presented. While the most important contributions are mentioned, the authors are aware that such a historical review must leave many worthy articles by the wayside. This overview considers dendrite tip growth and morphology, rapid solidification, melt flow, fragmentation, columnar-to-equiaxed transition, dendrite spacings, coalescence, grain competition, and cellular growth. Modelling across the length scales from nano- up to macroscopic solidification phenomena by massive phase field computations or multiscale approaches show the potential for the simulation of real processes such as additive manufacturing, single crystal casting, welding or advanced solidification processes.
Dendrites at the end of the twentieth century
Dendrites are frequently observed patterns in nature. They are also the most important microstructural feature in materials, especially in solidification and phase transformation of metals and alloys. A first publication on a model of this structure can be dated back to the early eighteenth century, but it was not before the second half of the twentieth century that most of the important experimental observations and theories on dendrites were published. The history of observations and models of dendritic growth from 1700 to 2000 has been treated in the first overview [1]. The state of the art on modelling of solidification microstructures at the end of the twentieth century has been reviewed in detail by Boettinger et al. [2] and by Müller-Krumbhaar et al. [3]. Concentrating on dendritic growth, Brener et al. [4,5] presented their most comprehensive theoretical reviews on 2D dendritic growth in the 1990s and Karma [6] developed in his 1999 Les-Houches-lecture the equations of needle tip growth, of sidebranching, as well as tip splitting and other growth morphologies. He also introduced the concept of a model he later called ‘dendritic needle network’.
The achievements in the field of solidification microstructures beyond the year 2000 can be found until 2008 in Asta et al. [7] and until 2015 in Karma and Tourret [8]. In the latter article, these authors briefly reviewed the link between atomistic modelling of solid–liquid interfaces and quantitative simulations of dendrites using the phase-field (PF) method. They also recalled the key concepts behind their Dendrite Needle Network (DNN) model, which allows bridging of the different scales of the fine dendrites and the coarser grain structure. Rappaz [9] presented a brief review of even larger scale models, in particular the so-called mesoscopic model of dendrite growth and the integration of dendritic growth models into Cellular Automata coupled with Finite Elements (CAFE model).
At the origin of a dendrite is a morphological instability of the solid–liquid interface that develops into cells or, in crystals with their anisotropic properties, into steady-state needle-like growth forms. Behind the tip of the needles new morphological instabilities appear which develop into secondary side arms (branches). With increasing velocity, the branches appear closer to the tip until the tip itself becomes unstable and forms doublons or triplons, which are favoured at smaller anisotropy values; the result is the seaweed structure. Figure 1 shows the various morphologies as a function of the anisotropy of the interface energy, ε, and the supersaturation of the melt, Δ [5]. For 2D diffusional growth Brener et al. [10] write The building block of the dendritic structure is a … parabolic tip, and the basic element of the seaweed structure is a doublon. Growth morphologies as a function of interface energy anisotropy, ε, and supersaturation, Δ, in 2-dimensional diffusional growth. CD = compact dendrite, FD = fractal dendrite with a noisy tip, CS = compact seaweed in form of doublons, and FS = fractal seaweed with noisy tip. According to Brener et al. [10], modified by Karma [6]. The anisotropy of a cubic-symmetry crystal in 2-dimensions is described at first-order with a single term (1−ε cos(4θ)).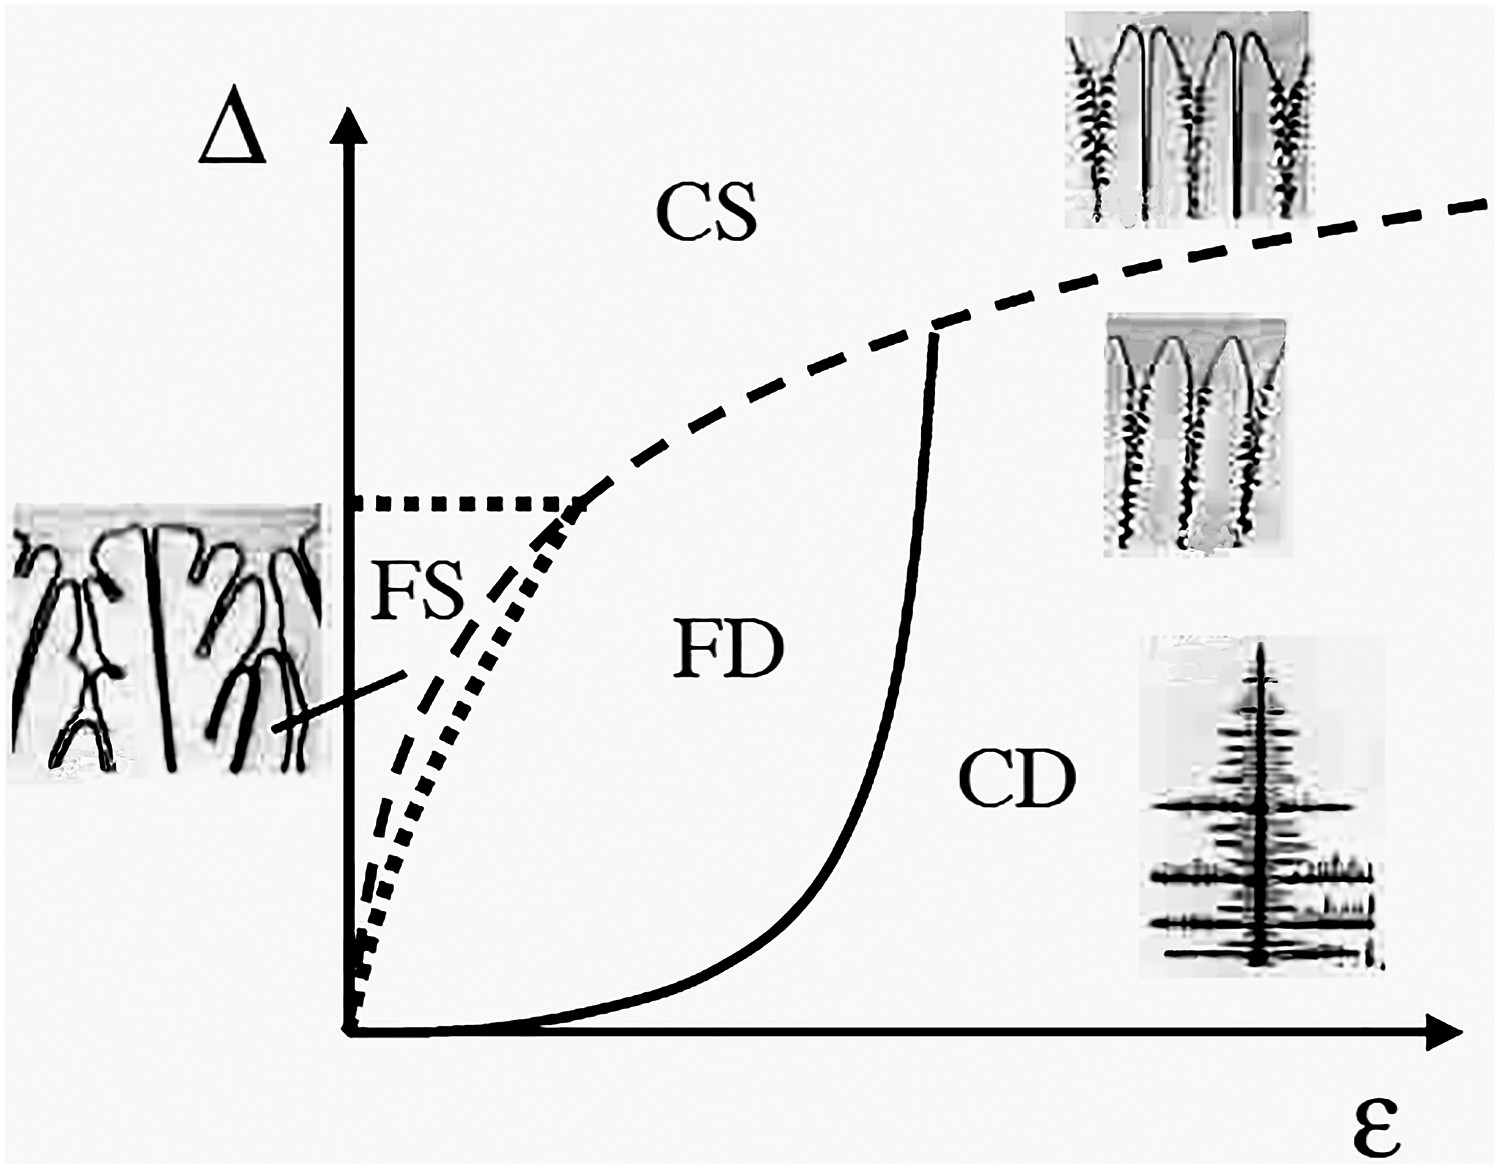
One of the essential findings of the late twentieth century was that an (even small) anisotropy of the solid–liquid interface is required for dendrites to form. The structural diversity is a consequence of the fact that small changes at the microscopic scale of the interface have dramatic consequences at the macroscopic scale of the pattern … [5]. (One could also replace the word microscopic by ‘nanoscopic’ or ‘atomistic’, as anisotropy is a result of atom interactions.) In quantitatively accurate simulations of the dendrite tip shape at small undercoolings Karma et al. [11] conclude:
that the ‘true’ tip radius is not an experimentally adequate parameter to characterize the tip operating state since the anisotropy-dependent shape distortion near the tip that fixes this radius is most likely not measurable. In contrast, the tip radius of the paraboloid which underlies the rest of the tip morphology (excluding this distortion) is both measurable and a good scaling parameter for the entire dendrite shape. The latter tip radius is indistinguishable from the Ivantsov prediction over the range of undercooling studied … .
Even if the role of anisotropy, whether of the solid–liquid interfacial energy or of the attachment kinetics or both, was recognised before the end of the twentieth century, several important questions remained. For example: How can we extend the analysis of interface energy anisotropy to 3 dimensions? How to describe the 3D anisotropy of the interfacial energy, knowing that the stiffness of the interface is the parameter to consider for the selection of the dendrite growth direction and that higher-order terms in the development of the anisotropy are amplified in the relationship linking stiffness and energy? What happens when the anisotropies of a crystal (interface energy, attachment kinetics, solute trapping) are competing? How to measure and obtain the anisotropy parameters of the interface, whether from experimental means or from atomistic simulations?
While atomistic calculations have contributed to address the last question, at least regarding the interfacial energy anisotropy [12,13], one of the most important methods developed at the end of the last century to address the other questions is the phase-field (PF) method. While the history of its development has been described in part I [1], its application to microstructure formation has experienced a fantastic development since 2000. The principal idea of the PF method is summarised in Figure 2. The sharp solid–liquid interface is replaced by a diffuse interface, usually at least two orders of magnitude thicker than the physical one, over which properties vary smoothly. Instead of tracking the position of a sharp solid–liquid interface, a non-conserved order parameter φ is introduced to describe the solid–liquid transition (see Figure 2). The evolution of φ is described according to a Cahn–Hilliard type equation that ensures that the free energy f(C,φ) always decreases with time, where C is the composition.
1
The coupled partial differential equations governing the evolutions of C and φ are usually solved on a fixed regular grid, using an explicit time-stepping procedure (see ‘Selected papers' at the end of this article for more details). Different length scales in the phase-field model [13]. The order parameter φ of the PF method varies smoothly over the thickness W of the interface (usually at least 100 times larger than the nanometre-thick physical interface for reasonable computation times), while the local free energy f is a function of φ and composition C. The atomistic calculation allows to calculate the parameters of the solid-liquid interface, in particular its anisotropy. The characteristic lengths are: tip radius ρ, capillary length d0, thermal length lT, and solute diffusion length lD.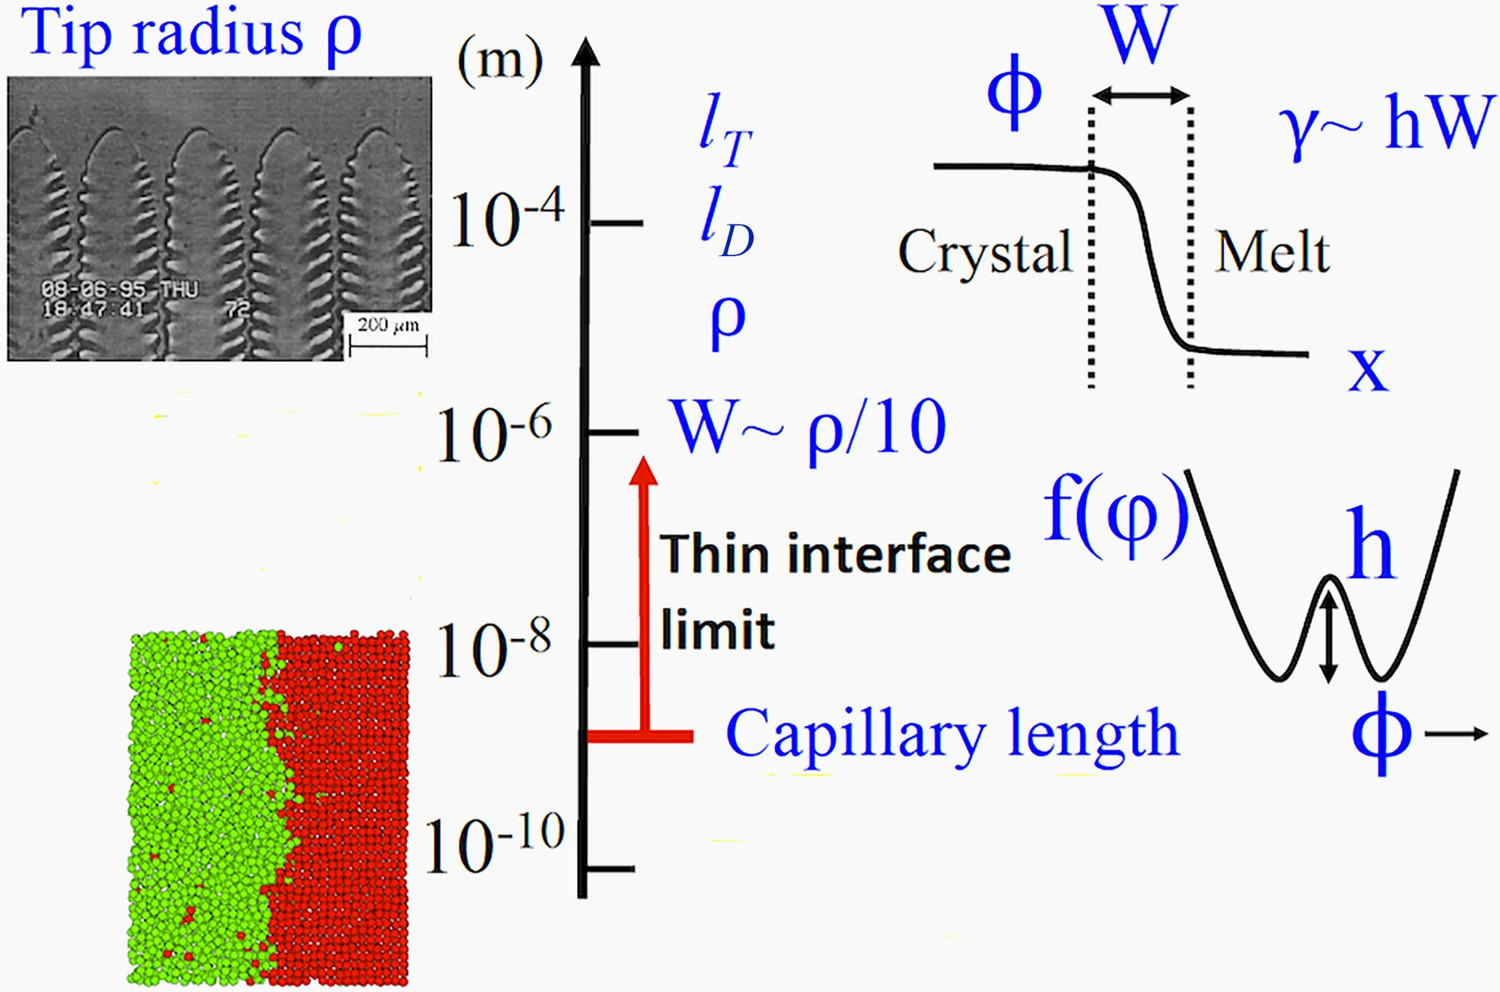
Other questions regarding primary phase formation in solidification have been investigated in the present century using PF, but other larger-scale approaches have also been developed. The effect of fluid flow on growth of dendritic grains is one of the topics that needed closer analysis, e.g. by combining PF with the Lattice Boltzmann method (see Section ‘Dendrites in flow’). Competition of columnar grains with different orientations during directional solidification, columnar-to-equiaxed transition (CET), transition from globular-to-equiaxed dendritic morphologies, and equiaxed grains transport, are many topics that have been investigated during the past twenty years using meso- or micro-macroscopic approaches in addition to PF. Finally, as important for the formation of solidification defects such as porosity or hot tearing, the last stage of solidification of dilute alloys by coalescence of two merging solid–liquid fronts has become a new field of investigation, together with refined analyses of coarsening over the entire length of the mushy zone.
Finally, and this is probably as important as numerical modelling, two new essential experimental tools have been further developed, leading to a better understanding of microstructure formation. Emerging in the last decade of the previous century, in situ X-ray radiography, tomography and topography observations have been made possible thanks to the powerful beams provided by dedicated synchrotron lines. Similarly, orientation imaging provided by Electron Back-Scattered Diffraction (EBSD) has been increasingly used to correlate the crystallographic orientation of dendrites and grains with their morphology, extension and competition.
Tip growth and dendrite morphology
The early years of the twenty-first century were much oriented to modelling and measuring the all-important, but small, anisotropic features of metallic crystals and their effect on dendrite morphology and orientation. Hoyt et al. [12] presented new simulation methods, the cleaving technique and the capillary fluctuation method, for calculating interfacial energies, as well as a method for evaluating the attachment kinetic coefficient. It became evident that it is the stiffness, not the interfacial energy alone, that controls the fluctuation spectra. In a further study [13], molecular dynamics (MD) simulations were used to determine the thermodynamic and kinetic properties of a solid–liquid interface, as well as the anisotropy parameters of the interfacial energy. These parameters were then used as input for phase-field (PF) simulation of dendritic growth in pure Ni [13,14]. The dependencies of the fourfold and six-fold anisotropy coefficients calculated by Becker et al. [15] supported the hypothesis that they may be at the origin of dendrite orientation changes even for small variations in composition.
The interfacial energy, γ, of a cubic crystal in contact with the liquid can be developed in 3 dimensions using cubic harmonics [16]:
Deviation from ⟨100⟩ was observed in thin coatings of Al–Zn alloys deposited by hot-dipping on steel sheets [20]. In directional solidification of Al–Zn alloys, a continuous Dendrite Orientation Transition (DOT) was observed: while ⟨100⟩ dendrites grow for C Results of 3D simulations of fcc Al–Zn dendrite morphologies for (a) equiaxed [16] and (b) columnar growth conditions [17]. In (a), the anisotropy parameter ε1 is varied while ε2 = − 0.02 is constant. In (b), the parameters are varied along the line drawn in the ε1–ε2 space (called a1 and a2 in [17]).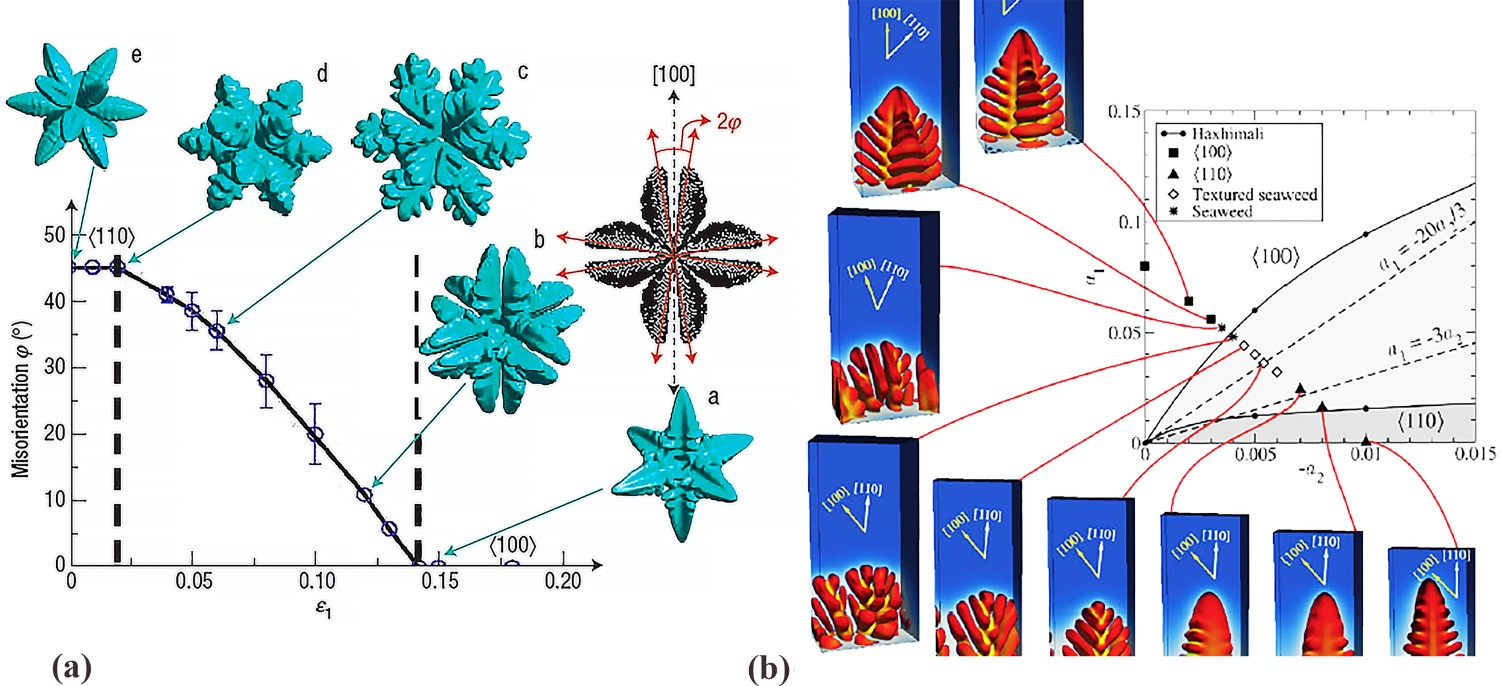
Growth of intermetallic dendrites is influenced by ordering processes. Assadi et al. [28] studied seaweed formation in NiAl intermetallic which appeared at relatively small growth rates. They attributed the loss of a preferred crystal growth direction to transient entrapment of the chemical and orientational disorder at the solid/liquid interface.
Lee and Losert [29] studied the stability of succinonitrile (SCN)-coumarin 152 dendrites and cells by locally heating the tips with a laser. This allowed the authors to investigate the modes of instability of growth patterns by triggering subcritical transitions between stable microstructures. Interest in the question of dendrite tip stability continued over the years. For example, Singer and Bilgram [30] studied experimentally the stability of dendrites in undercooled liquid Xenon by rapidly displacing the tip into cooler melt. They observed three morphologies; dendrites, doublons and seaweed structure. Later Chen et al. [31] examined tip instabilities during the initial transient in a directionally solidified Al–4 wt%Cu alloy growing along ⟨100⟩. X-ray imaging and 2D phase-field computations revealed transitions from cells to dendrites to seaweed structure when the growth rate was increased. Above a critical growth rate, cell/dendrite tips underwent morphological instability leading to tip splitting, even for ⟨100⟩ tips, if strong noise was included in the computations as predicted by Brener et al. [10]. The effect of a non-isothermal and non-isosolutal dendrite tip on its growth has been demonstrated by Li et al. [32].
The question of side branching is another on-going topic. For a discussion of this phenomenon we have first to return to earlier work. The most elaborated theoretical analysis of the dendrite tip in 3D can be found in Brener and Temkin [5], who extended Langer’s theory of noise-induced sidebranching [33] to non-axisymmetric tip shape to obtain an improved agreement with experimental observations [34]. In those studies, selected noise amplification has been the main mechanism of dendrite side-branching in undercooled growth and is believed to be its only origin. It was shown that all perturbations of the Ivantsov parabola are linearly stable when anisotropic surface tension is treated self-consistently and that a neutral stability point cannot be defined [35]. More recently two other approaches were proposed to model side branch formation near dendrite tips. These theories however have not been validated after marginal stability theory was abandoned. i. Xu et al. [36] proposed an Interfacial Wave Theory with a «trapped-wave mechanism interpreted in terms of wave reflection and interaction. ii. Glicksman et al. [37] developed a model where the oscillating tip induces a limit cycle and deterministically generates a time-periodic sequence of side branches.
These deterministic theories contradict the results of the rigorous linear stability analysis of Kessler and Levine [35] and of Brener et al. [5,38]. The latter authors found that the steady state solution corresponding to the largest dendrite tip velocity within the discrete spectrum of the exact solutions was linearly stable. The other solutions from this spectrum had unstable modes of tip-splitting origin. Brener [39] also points out
that the fact that steady state solutions (without oscillations) are linearly stable does not in general contradict the possibility that, in addition to such linearly stable solutions, there may exist also oscillatory (limit cycle) solutions. These two types of solutions may exist simultaneously since the problem of dendritic growth is a nonlinear one.
In a detailed study of directionally solidified succinonitrile in thin cells Pocheau et al. [40] found that sidebranches develop in the form of bursts. The coherence of sidebranching in a burst seems to have a deterministic origin and the uncorrelated bursts to a stochastic origin. In recent PF simulations, Mullis [41] and Shang et al. [42] observed deterministic side branch formation in undercooled dendrites. On the other side, Echebarria et al. [43] never observed this limit cycle in pure undercooled melts or isothermal dendritic alloy solidification. Sidebranching was found to be a transient phenomenon where oscillations decay very slowly, when the surface energy anisotropy is small, consistent with the theoretical prediction of the linear stability analysis of Kessler and Levine [35] showing that the decay rate of oscillatory modes vanishes in the limit of small surface energy anisotropy. This possibly suggests that some authors concluded that a limit cycle was sustained when it was in fact a long transient. For directionally growing dendrites however it was found that tip oscillations persist over a finite range of spacings in simulations in which noise is switched off [43]. The nonlinear limit cycle for a positive temperature gradient existed only in a narrow range of spacings close to the maximum spacing, where tertiary branch insertion provides a driving force for non-linear oscillations. For most of the smaller spacings, the limit cycle was absent and noise amplification was the sole mechanism of sidebranching.
In 2012 Melendez and Beckermann [44] returned to quantitative experiments of free dendritic growth in succinonitrile–acetone alloys. In a systematic study under 1 g conditions, they measured the steady state rate of the dendrite tip, its radius (Figure 4), the non-axisymmetric amplitude of the fins behind the tip, and the envelope width, projection area, and contour length of the branches far from the tip. The most important finding of this research was that, within the uncertainty of the measurements and for the limited range of composition (0.0086 < C0 < 0.4976 mol%), the tip selection parameter σ* was independent of solute content. However, σ* decreased with undercooling from a value of 0.02 at ΔT = 0.1 K to 0.012 at ΔT = 1.0 K. The experimental tip Péclet numbers agreed with the results of the Li-Beckermann (LB) stagnant film model [45] which confirms the usefulness of the approximate transport solution. This study, contrary to earlier findings in 2005 by Ramirez and Beckermann [46], confirmed the maximum in growth rate in dilute alloys that had been found in experiments by Chopra and Glicksman [47] and modelled by Karma and Langer [48] and Lipton et al. (LGK) [49]. Koss et al. [50] used a pressure change instead of temperature change for the analysis of tip growth. They found that the tip velocity followed immediately the pressure change while the tip radius lagged somewhat behind the change and the total transition times were similar. Freely growing SCN dendrite (C0 = 0.1045mol% acetone, ΔT = 0.125 K). Best fit: green dots with a 4th order polynomial (A4=0.005) and red dots with a parabola (A4=0) [44].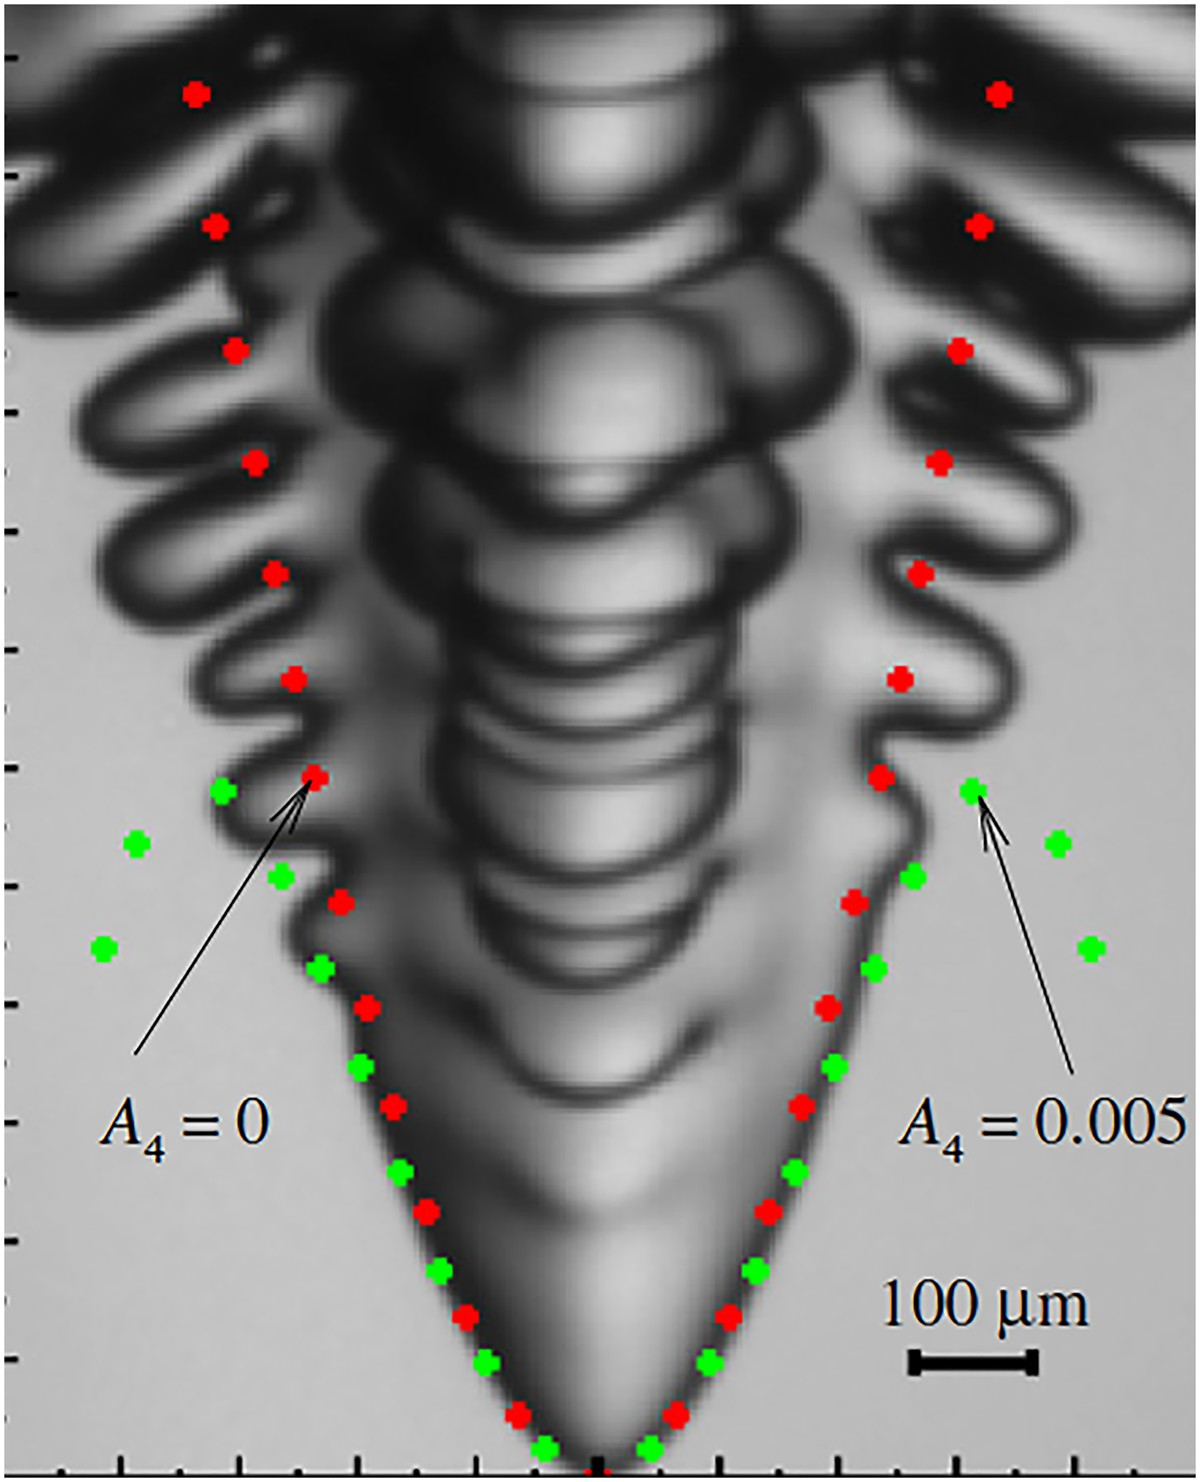
A peculiar dendrite morphology, discovered by Herenguel in 1948 [51] and specific to aluminium alloys, has been the subject of new investigations by Henry et al., using mainly EBSD [52]. It was clearly established that feathery grains are made of dendrites growing along ⟨110⟩ instead of ⟨100⟩-directions and split in their centre by a coherent {111} twin plane. Salgado et al. [53] used focused ion beam nanotomography and energy-dispersive spectroscopy to measure in a TEM the solid composition near the twin plane of Al-30 wt%Zn twinned dendrites. This study together with PF calculation of half a ⟨110⟩ twinned dendrite [54] confirmed the conjecture of Henry et al. that a twinned dendrite tip is a doublon. The liquid composition increases in the liquid channel separating the double-tip, while the tip itself has a composition close to that of a regular dendrite tip. While the growth mechanism of twinned dendrites was much better understood, the origin of the twins was still a mystery until the recent discovery of Kurtuldu et al. [55]. These authors showed that trace elements, such as Cr in Al-Zn alloys, favour the formation of Icosahedral Short-Range Order (ISRO) clusters in the liquid. These clusters can aggregate into icosahedral quasicrystals on which the fcc phase can form by heteroepitaxy, thus producing multiple twin relationships among nearest-neighbour grains.
Equiaxed and columnar growth
Dendrites are the main constituents of grains if interdendritic eutectic is absent or present in small fractions. Grains and their constituents are under the most important microstructural features of an alloy. Numerous dendrite trunks, which are connected with the seed, form one columnar grain. A single dendrite fills the space of one equiaxed grain. Simulation of such microstructures englobes many scales, from atoms in a crystal with anisotropic properties to dendrite tips, to grains and finally to castings, welds or additively manufactured parts. To cope with these different scales, multiscale models are necessary. A short overview of such models can be found in [56].
Equiaxed grains in undercooled melts: Strictly speaking, ‘equiaxed’ means that a grain has primary dendrite arms of equal length as measured from the nucleation centre, e.g. truly equiaxed grains in regular cubic metals have a cruciform shape with 6 ⟨100⟩ primary arms of equal length. This only occurs when the melt is isothermal, i.e. the undercooling for all the primary arms is the same. Under such conditions the formation of an equiaxed grain nucleated below the liquidus induces a negative temperature gradient at the solid–liquid interface, i.e. the temperature of the interface is higher than that of the bulk of the liquid. When the latent heat rejection rate associated with the growth of the grains is larger than the extracted heat flux, a rise in temperature of the solidifying part, i.e. a recalescence, is observed. A recalescence is therefore associated with an increase in temperature of a volume element while the overall enthalpy of the system is still decreasing. Recalescence should not be confused with reheating due to variations in the processing conditions. A very abrupt recalescence (very rapid rise in temperature of the specimen) is observed when the first nuclei form at large undercoolings leading to a high initial growth rate, e.g. during droplets atomisation. In castings, recalescence and formation of nearly equiaxed grains are observed near the last region to solidify.
Equiaxed growth can manifest itself in the form of three morphologies: If the nuclei density is high and the interaction of the diffusion fields stabilises spherical growth, so-called globules form; If the nuclei density is low, i.e. nuclei are sufficiently distant from each other, dendritic grains develop. In between these two extremes, so-called globular-dendritic equiaxed grains form.
In a positive thermal gradient, grains can still nucleate continuously and grow with a more or less elongated shape (see hereafter). Generally, a polycrystalline equiaxed microstructure is made up of many equiaxed globular, globular-dendritic or dendritic grains depending not only on the cooling rate but also on the nuclei density. Common to the modelling of equiaxed morphologies is the difficulty to have access to nucleation parameters, which have to be determined by experiments. Such morphologies have been observed by Xu et al. [57] who studied grain growth of AlTiB-inoculated Al-10 wt%Cu alloys with X-ray tomography. If the grains are fully globular, spherical growth models can be used [58], while for coarse grains with well-developed dendritic morphologies, the concept of grain envelope with a velocity given by that of the leading dendrite tips can be used. Martinez et al. [58] analysed the stability of spheroidal crystals. Unfortunately, there is no analytical model for globular-dendritic grains, i.e. for grains with a spherical front which is destabilised but does not develop into fully developed dendrites.
A transition from globular to dendritic equiaxed growth has been simulated by phase field by Diepers and Karma [59]. These authors took as a criterion for this transition the onset of a negatively curved portion of the otherwise convex solid–liquid interface. Considering the 4-fold symmetry of a cubic equiaxed grain, a simple analytical derivation of the destabilisation of a spherical front in a grain of finite size has also been derived in [60], using the mode 4 of the Mullins-Sekerka stability analysis. The results of this analytical model correspond surprisingly well to the phase field simulations. The critical final grain size, dg-d, for which the globular grain starts to develop instabilities is given by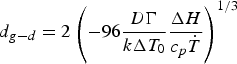

A phase-field (PF) model has been applied by Ramirez et al. [61] for the simulation of heat and mass diffusion of dendrites growing into an undercooled alloy melt. The model uses the thin-interface limit of Karma and Rappel [62,63] and includes an antitrapping current [64] for local equilibrium at the interface. The latter is necessary as the enlarged interface thickness of the PF method, necessary for a reasonable computation time [65], leads to artificially enhanced solute trapping. Two-dimensional simulations show that modelling of both the microstructure and the solute distribution in the solid leads to reasonable results. Ofori-Opoku and Provatas [66] developed a 2D multi-phase-field model for the simulation of the growth of multiple equiaxed dendritic grains. Grain impingement and coalescence including solid-state back-diffusion was treated and grain boundary energies evaluated. The results correspond to Rappaz et al.’s theory of coalescence of two solid–liquid interfaces [67]. Gong et al. [68] developed a PF model for a more efficient computation of large numbers of grains in binary alloys. An orientation gradient energy was incorporated into the PF model, which enables simulation of grain boundaries in polycrystals on ordinary computers. Microstructure formation of a nickel-alloy in 3D was computed with the PF method by Yang et al. [69]. The microstructure evolution of single and multiple equiaxed dendrites under different undercoolings was presented (Figure 5). A polycrystal of equiaxed dendrites obtained by 3D PF computation [69]. Domain size 768 μm.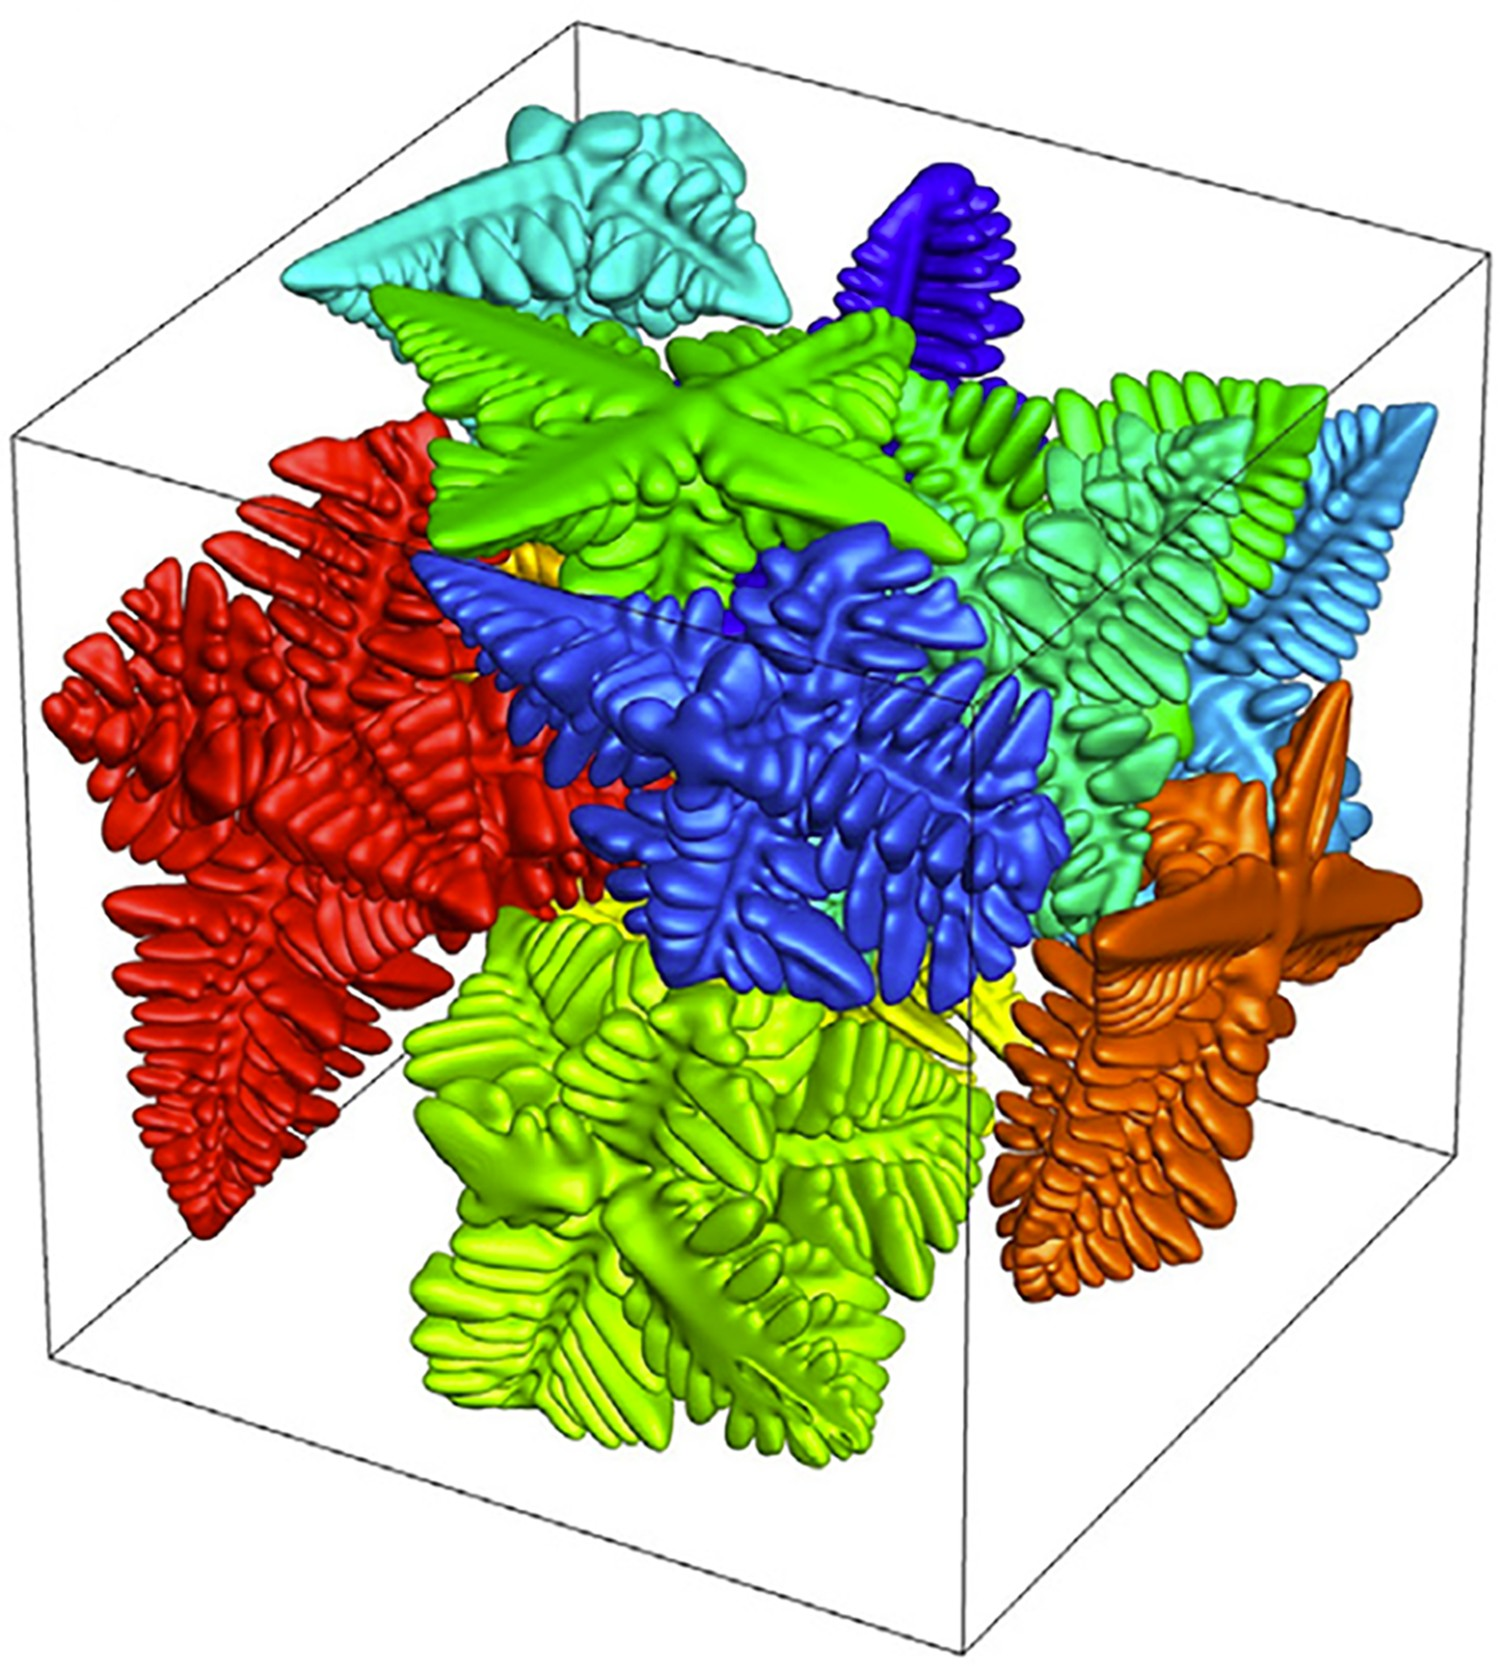
For the simulation of equiaxed solidification of technical alloys, a multicomponent phase field model coupled to a thermodynamic database has been presented by Böttger et al. [70]. To simplify the complex phase equilibria of commercial Mg–Al–Zn and Al–Si–Cu–Mg–Ni alloys, these authors used quasi-binary extrapolations of the ternary and quinary phase diagrams. Zhang et al. [71] used a 3D cellular automaton (CA) model for dendritic growth in multicomponent alloys. The effect of interactions between the alloying elements on the diffusion coefficient of solutes in the solid and liquid phases has been considered and applied to the solidification of ternary Al–Cu–Mg alloy.
Yang et al. [72] found qualitative agreement between experimental results of equiaxed hexagonal α-Mg grains obtained from X-ray tomography images and results from 3D PF simulations (Figure 6). Equiaxed dendrite morphology: (a) phase field simulation and (b) X-ray-tomography image [72]. Domain size 819.2 μm.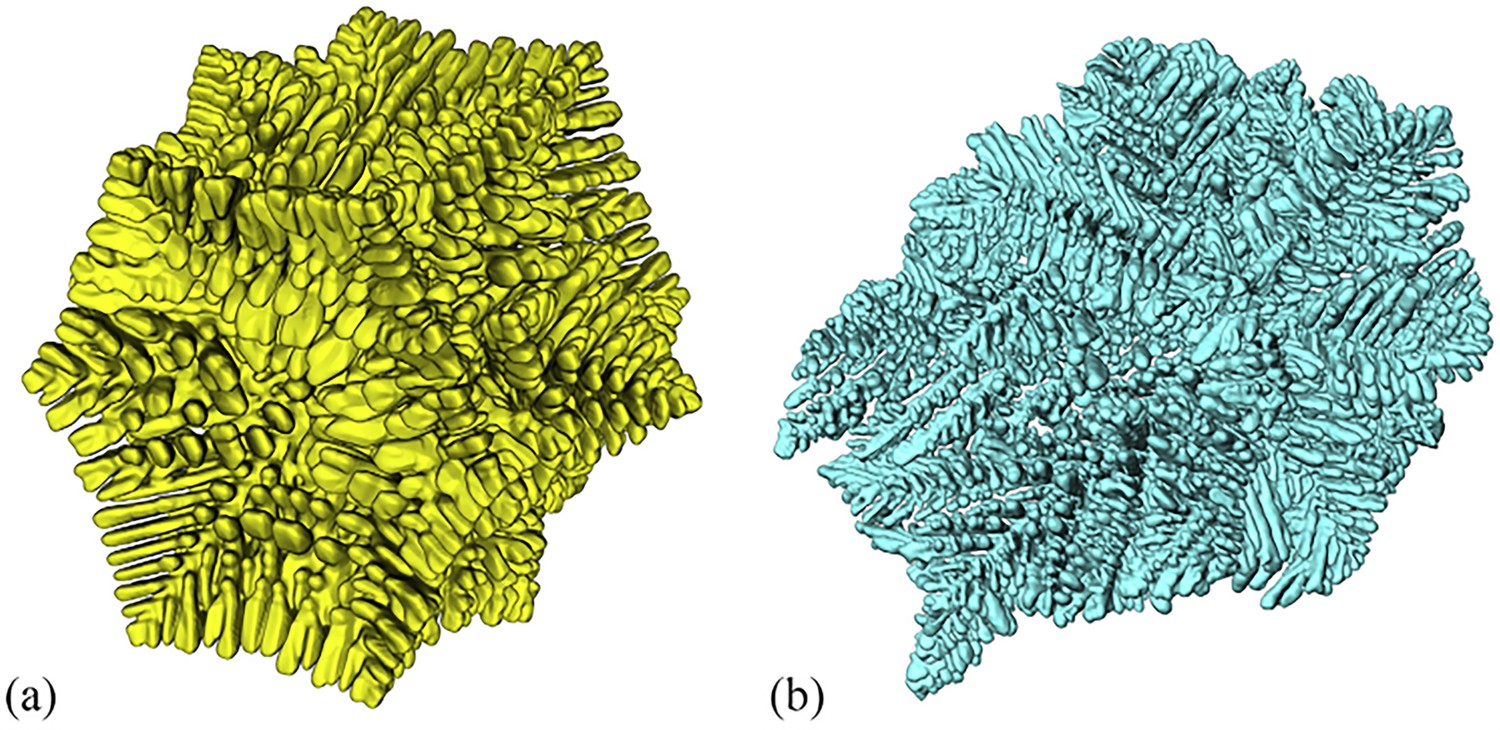
The drawback of the PF method, especially in 3D, is the very long computation time which requires the use of supercomputers. Therefore, other methods have been developed to allow the simulation of large numbers of grains in reasonable times. One of these methods, the Cellular Automata (CA) technique, originally developed by Rappaz and Gandin in the 1990s [73,74], has been used by many authors for the modelling of fully dendritic grains, whether equiaxed or columnar. In this method, which can be coupled with Finite Element (FE) for the calculation of a macroscopic temperature field (so-called CAFE method), the growth kinetics of a free dendrite tip is used to describe the capture of CA cells. It only approximates, however, the solutal interactions between diffusion fields of neighbouring grains (see Section ‘Grain competition’).
Many authors have tried to overcome the drawback of the CA method by introducing solute diffusion and an estimation of curvature in the calculations. Sometimes referred to as ‘modified CAFE’, such methods are in fact pseudo-front tracking methods where the solid–liquid interface is tracked by using special ‘interfacial cells’ separating solid and liquid cells [75–82]. The local curvature of the interface is based on various algorithms. The simplest ones estimate the percentage of solid cells within a volume containing many cells [75,76]. More refined algorithms are based either on solid fraction first- and second-derivatives [77–80] or a field of distances to the interface (i.e. level set) [81,82]. In some cases, a comparison is made either with analytical solutions, such as LGK, or with PF results. However, if these methods often use a fairly coarse mesh and a simple curvature algorithm, the computation cost is greatly reduced compared to PF but the results are only qualitative. The resulting dendrite tip growth is not validated and the anisotropy introduced by the coarse cells is not assessed [9]. With much finer meshes and refined curvature algorithms, the method becomes quantitative and produces results close to the PF method, but with a computation cost which becomes also comparable. Furthermore, these refined curvature algorithms have been developed mainly for 2D geometries and are quite difficult to extend to 3D. A review of CA-type models for the prediction of microstructures can be found in [83].
Another interesting technique proposed at the end of last century by Steinbach and Beckermann is the so-called ‘mesoscopic envelope model’ (MEM) of equiaxed solidification [84,85]. It is based on the description of a smooth envelope stretched over the tips of active primary and secondary dendrite arms, with an internal volume fraction of solid. A confocal envelope surrounding the first one at some fixed distance (boundary layer δf) is defined to estimate the ‘far-field’ condition in the liquid for the growth (Figure 7(a)). Initially developed for thermal dendrites, the model is split into two contributions: the heat diffusion equation at long range is calculated with a standard 3D numerical solution, while the velocity of the envelope is calculated using the temperature difference between the melting point, i.e. at the active tip position, and the temperature at the confocal envelope position normal to the interface. Using this temperature difference across the stagnant film thickness δf and the growth model of Cantor and Vogel [86] for a parabolic tip, this allows to deduce the local Peclet number at any position of the envelope. The radius-velocity contributions are then separated using either a marginal stability or solvability criterion. The propagation of the envelope with a regular and fixed grid is based on an evolution equation similar to PF, by introducing a field parameter φ across the film thickness. Unlike the standard CA approach, it accounts for soft impingement of dendritic grains and gives a more realistic morphology, typically cruciform under isothermal conditions, of equiaxed grains.
The model has been extended to solutal columnar dendrites by Delaleau et al. [87]. It finds today a revival in the work of Založnik, Combeau and coworkers [88–90]. The model can treat equiaxed and columnar structures with fluid flow in 3D. The computational cost of MEM is several orders of magnitude lower than PF and can bridge the gap between microscopic and macroscopic phenomena. Souhar et al. [90] present impressive results showing the potential of this method for 3D modelling of multiple equiaxed grains (Figure 7(b)). The drawback of this approach is a fixed envelope distance and of course the loss of the internal dendritic features within the envelope. Like the CA, the initial growth of side dendrite arms close to the tip does not follow the same growth kinetics of ‘active’ branches which have escaped from the solutal field of neighboring arms, and thus their different kinetics is not accounted for.
Synchrotron X-ray imaging has made good progress in the period of this review. In 2013, Bogno et al. [91] presented in situ real-time images of equiaxed grains during growth in Al–10 wt%Cu alloy. The dendrite morphology with well-developed secondary arms at the moment of maximum tip velocity is clearly visible in Figure 8(a). The lengthening of the primary dendrite arms followed two growth regimes. In a first stage, the tip velocity increases corresponding to free dendritic growth, and later the velocity decreases approaching zero due to the overlap of the solute diffusion fields between neighboring grains (Figure 8(b)). This transient behaviour has been studied in more detail by Chen et al. [92]. Such results are a valuable input for the simulations. X-ray radiography results in Al-10 wt% Cu, (a) images of early stage of growth of a polycrystal and (b) tip velocity of two equiaxed dendrites [91].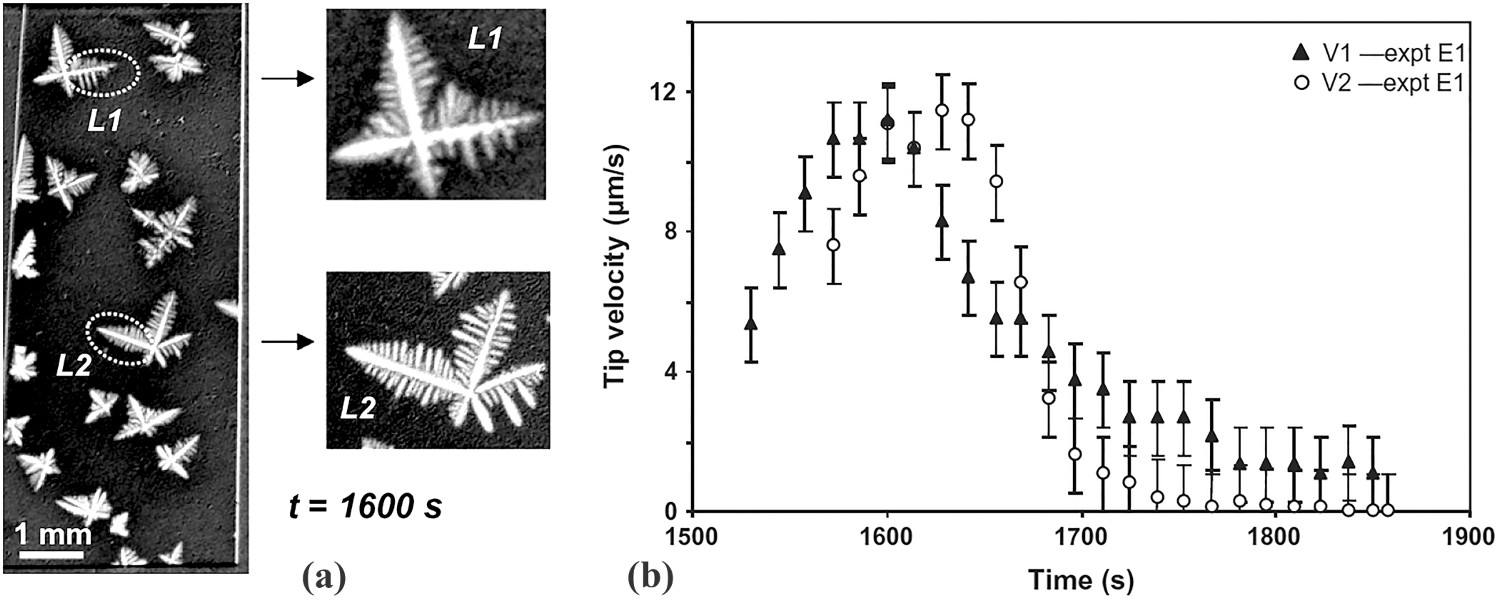
Many other groups have produced X-ray radiography images of equiaxed dendrites. Nogita et al. [93] could produce real-time images of solidification of Al–Si alloys despite their small difference in the atomic number (and absorption) of the elements. In such a case, phase contrast is used instead of absorption contrast. Yang et al. [72] characterised the morphology of Mg dendrites for Mg-30 wt%Sn and Mg--30 wt%Gd alloys. By evaluating the spherical harmonics, an anisotropy growth function was developed that describes the growth of an eighteen-branch α-Mg dendrite. Becker et al. [94] published X-ray radiography images of solidifying Al-Ge polycrystalline specimens, with a post-processing transformation of the absorption grey-level contrast into colours in order to better reveal the solute fields (Figure 9(a)). Just for comparison, Figure 9(b) presents results of PF simulation of dendritic polycrystals of an Al-4 wt%Cu alloy in a slowly cooling melt [68]. Murphy et al. [95] presented first results of space experiment of a grain-refined Al–20 wt%Cu sample. The complete solidification sequence from nucleation, equiaxed dendritic growth, and grain impingement was observed using X-ray radiography. Solute fields surrounding equiaxed dendrites. (a) X-ray radiography images of Al-24 at% Ge alloy at two solidification times. The dendrites, which grow along ⟨110⟩ directions for this Ge composition, are surrounded by dark blue coloured (Ge-rich) liquid showing the overlap of solute diffusion fields [94]. (b) 2D PF results of solute distribution in Al-4 wt%Cu at four solidification times [68].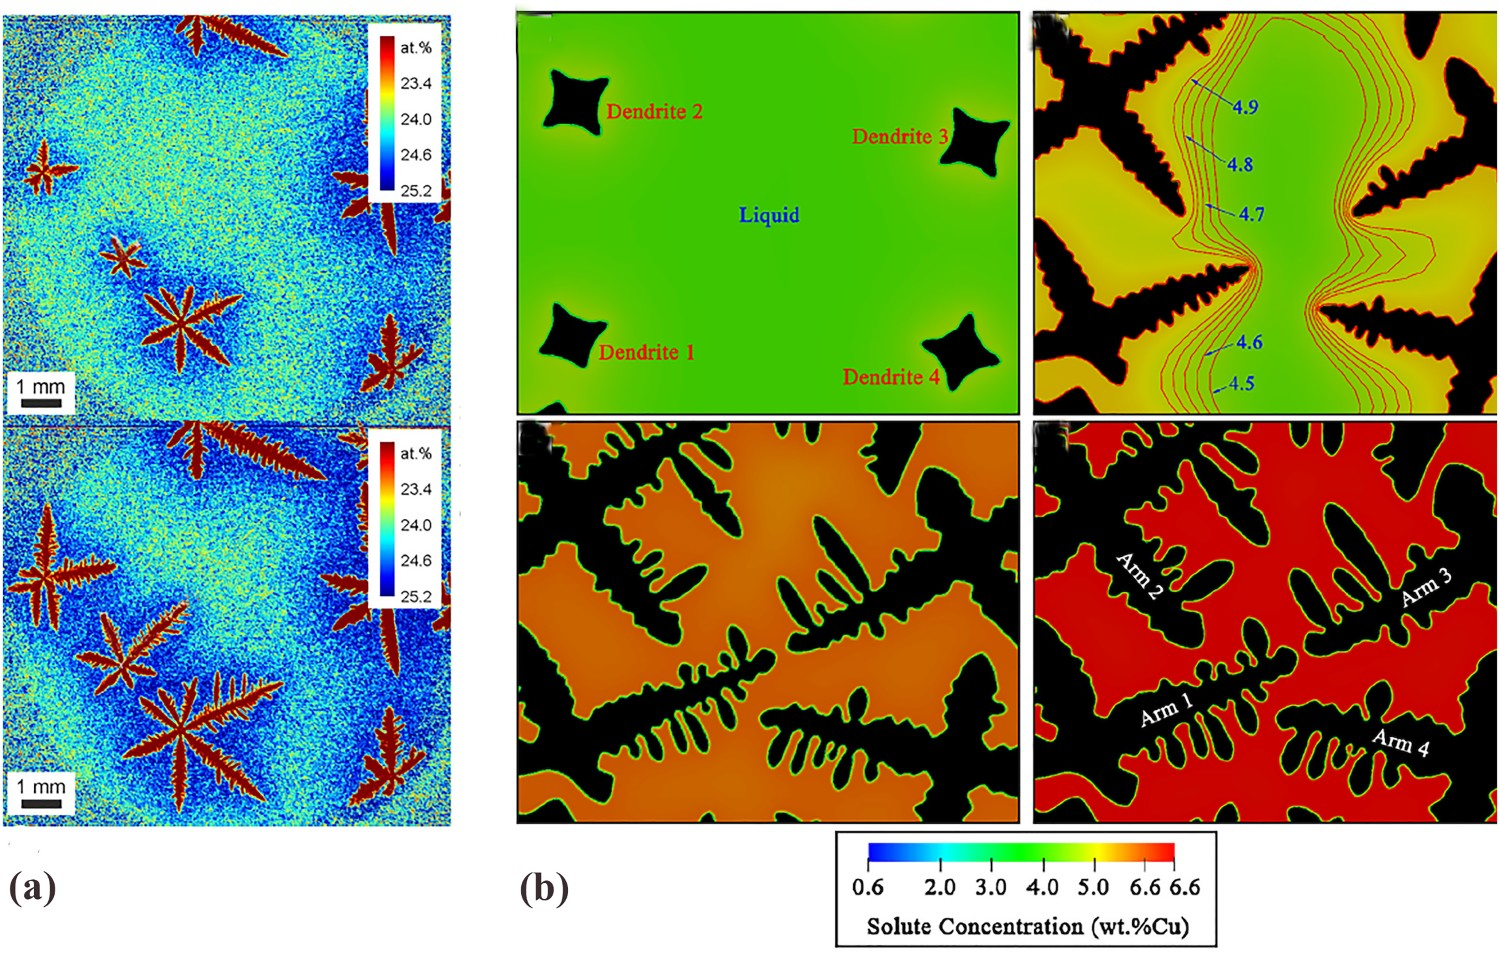
An interesting way of influencing dendrite morphology has been shown by Daudin et al. [96]. Addition and dispersion of yttria nanoparticles in an Al alloy formed complex hyperbranched equiaxed dendrite morphologies.
Directional growth of columnar dendrites (see also section on primary spacing): In contrast to free growth in an undercooled melt, it is the positive temperature gradient in constraint (directional) growth which strongly influences the interface dynamics in the tip region of alloys [43]. This type of growth creates arrays of dendrites with a characteristic range of primary trunk spacings. Developments in computer hardware and programming techniques, such as adaptive remeshing [97] or massive parallelisation on GPUs [98], allow today phase-field computations of large columnar dendritic arrays [99,100]. Microstructure formation of a nickel alloy in 3D was computed with the PF method [69]. The distribution of primary dendrite spacings was analysed as well as the competitive growth in directional solidification of polycrystals. Xing et al. [101,102] examined columnar dendrites growing at an angle to the growth direction. Cells, dendrites with secondary branches and dendrites developing tertiary branches were found depending on the primary spacing, the growth angle and the velocity. As the computations were 2D the results are only preliminary.
Wang et al. [76] published results of Cellular Automaton-Finite Difference (CA-FD) computations for columnar dendritic grains in 2D and 3D. The simulations capture the microstructural development and primary spacing selection, by both branching and overgrowth mechanisms. However, as mentioned before, the algorithm they used for the curvature is too simple to produce fully quantitative results and the influence of the grid was not assessed.
Založnik Viardin et al. [88,103] compared results of the MEM (mesoscopic envelope method – see above) for the simulation of columnar dendritic arrays with results of 2D PF simulations. Despite the more detailed morphology obtained from the PF method, the MEM, using an analytical tip growth model, gave reasonable results for larger arrays of dendrites, while drastically reducing the computation time. Comparison between both methods showed good agreement for: (i) stable primary spacing; (ii) solute diffusion at the scale of the array, (iii) solute undercooling at the columnar tips, and (iv) solidification path in the mushy zone.
Du et al. [104] studied the morphology of hcp α-Mg dendrites with synchrotron X-ray tomography and growth directions with EBSD technique. The anisotropic surface energy obtained from ab-initio computations was used in a 3D PF model and agreement between simulated dendrites and experimentally observed morphologies has been found. In 2005 Mathiesen and Arnberg [105] carried out X-ray imaging of columnar dendritic growth of Al–30 wt%Cu with spatial and temporal resolutions of 1.4 μm and 150 ms. The morphology and velocity of the dendrites could be determined. The absorption contrast was used by these authors to estimate the solute field ahead of, and within the mushy zone. The higher resolution of the X-ray radiography method resulted in detailed images of metal dendrites. Clarke et al. [106] compared X-ray observations of a directionally solidified Al-Cu alloy with PF simulations to explore microstructure selection phenomena in thin samples. A microstructure selection map was presented together with measured cell/dendrite tip radii and primary spacings. The results are, however, affected by the specimen geometry, i.e. the sample thickness is in some cases larger and in others smaller than the dendrite spacing leading to a 3D-2D transition.
Rapid solidification
Under rapid solidification conditions, growth becomes increasingly controlled by attachment kinetics and its anisotropy. In PF computations of highly undercooled pure Ni, Bragard et al. [107] showed that the magnitude and anisotropy of attachment kinetics obtained from atomistic simulations [12,108] could yield dendrite growth velocities consistent with experiments. At high undercooling (high growth rate), the capillary anisotropy was found to have a small effect on growth while varying the magnitude of the kinetic anisotropy led to a drastic change in growth morphology, again consistent with experimental observations (Figure 10). Later Nestler et al. [109] extended the work to higher undercoolings and found stable spherical morphologies at Δ > 1. Equiaxed grain morphology in pure Ni at high undercooling, Δ, at constant capillary anisotropy, εc = 0.018, and different attachment kinetic anisotropy parameters, εk: (a) dendritic structure at εk = 0.13 (Δ = 0.7); (b) dense-branching morphology at εk = 0 (Δ = 0.6) [107].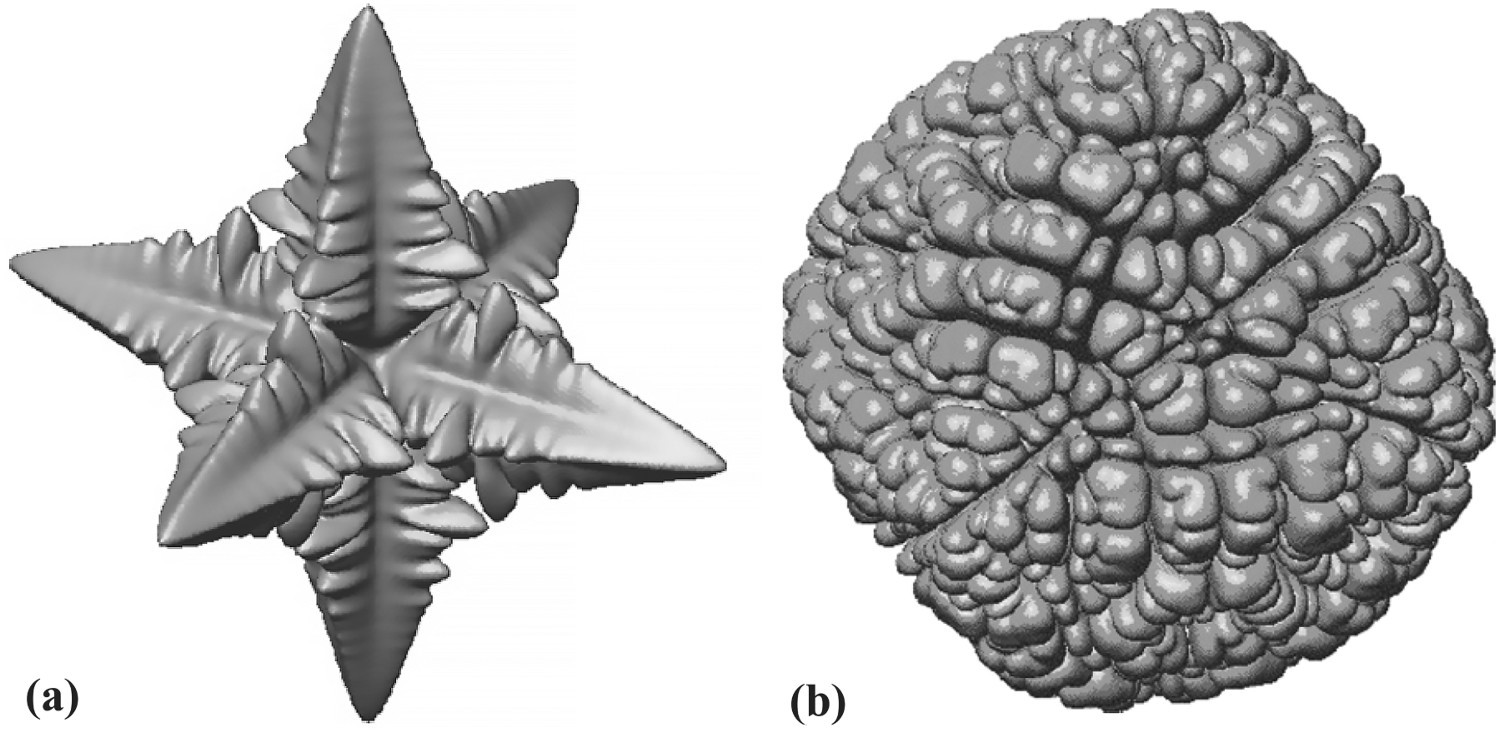
Galenko et al. [110] studied rapid dendritic growth of a dilute Ni-1%Zr alloy in electromagnetically levitated, highly undercooled drops. These authors measured dendrite growth velocities as a function of undercooling and found a transition to partitionless solidification at a critical undercooling of ΔT* = 198 K corresponding to a velocity of 21 m/s. The experimental results were analysed using sharp-interface and diffuse-interface models. With the analytical sharp-interface (Ivantsov-solvability) model, the growth across the whole range of undercoolings could be computed. Reasonable agreement between theory and experiment was found except for low undercoolings where fluid flow seemed to affect the growth relationship [111]. Also the effect of solute trapping [112,113] (and its anisotropy) is strongly controlling the dendrite tip growth. Alexandrov and Galenko [114] compared their boundary integral model with experiments on a Ni–B alloy of Eckler et al. [115] and could obtain a reasonable correspondence (Figure 11(a)). Figure 11(b) shows also the tip radius, at low undercooling for solutal and thermal growth, and at high undercooling purely thermal growth that is partitionless above 18.9 m/s. Due to the required high solidification rates, experimental work on the latter topic is missing. Diffusionless transformation up to absolute stability with plane front growth, however, has been observed in solid-state transformations [116] where a low diffusion coefficient reduces the critical rates of these phenomena. Dendrite tip velocity vs. undercooling for Ni-0.7at%B alloy [114]. (a) Experimental results (diamonds [115]) and theoretical tip velocity (curve). (b) Theoretical tip velocity and tip radius as a function of undercooling. The different growth regimes are: (1) solute diffusion controlled; (2) transition from solutal to thermal regime; (3) purely thermally controlled (partitionless) growth.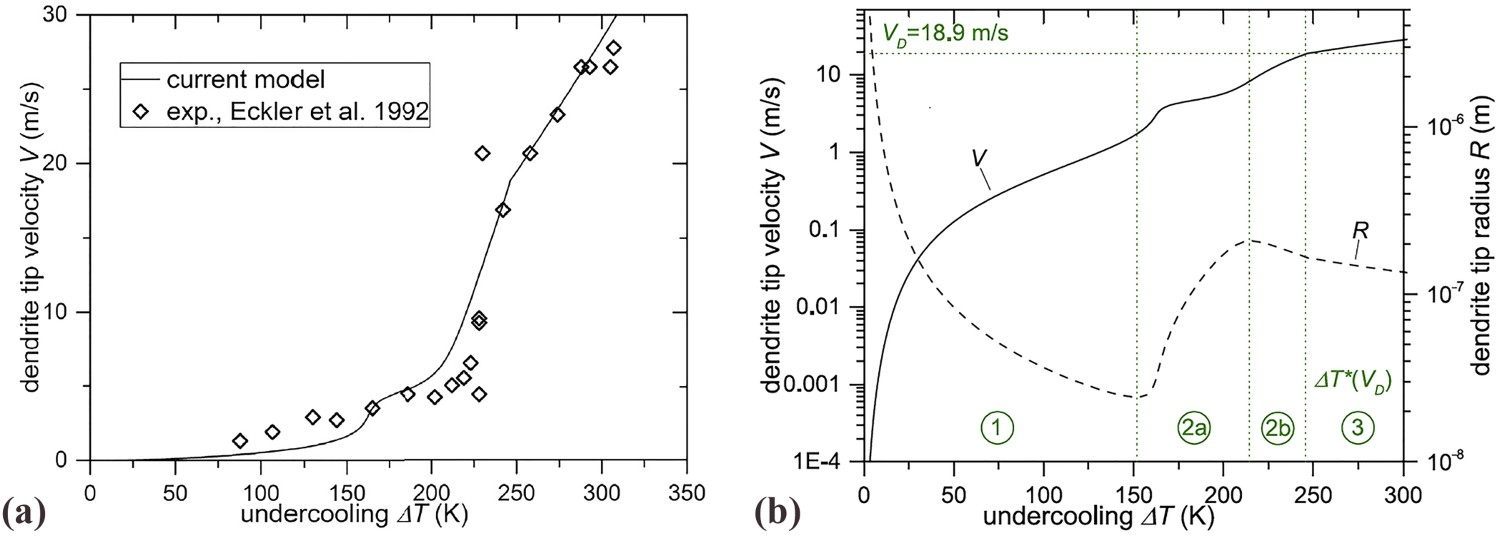
Hartmann et al. [117] undertook levitation experiments with a highly undercooled NiAl melt. They found a sharp rise in the slope of the V(ΔT) relationship at ΔT ≅ 250 K. The results of the sharp interface model indicated a progressive disorder trapping at undercoolings above 50 K with an abrupt drop to complete disorder at a critical undercooling ΔT = 225 K corresponding to V=1.6 m/s. Wang et al. [118] found in Cu50Zr50, a glass-forming alloy, a maximum of the growth velocity at ΔT = 200 K that was attributed to the effect of the temperature-dependent diffusion coefficient. If the corresponding low growth temperature interferes with the glass transition temperature amorphous solidification is the result [119].
A change of dendrite growth direction has been observed in Al-4.5 wt%Cu droplets rapidly solidified using a pulsed-atomisation technique. Combining ex-situ X-ray micro-tomography and EBSD characterisations, Bedel et al. [120] found various dendrite morphologies, mostly growing with ⟨111⟩ trunks and arms. This change of orientation from ⟨100⟩ at low speed to ⟨111⟩ under rapid solidification conditions is different from the Dendrite Orientation Transition observed in Al–Zn [16]. It is probably due to an attachment kinetics contribution, most likely linked with the presence of icosahedral short-range order (ISRO) of atoms in the liquid indirectly evidenced in Al- and Au-based alloys via the effect on nucleation of trace elements [55,121].
Results of highly undercooled dendrite growth experiments are often compared with sharp interface models of Ivantsov-marginal stability/solvability type [122–125]. In PF computations Mullis [126] varied the parameters for dendritic growth over a wide range and found apparently inconsistencies in the results of the analytical sharp interface models. In this context it can be mentioned that, in the low undercooling limit, Karma in 1985 [127,128], using a boundary layer model of coupled thermal and solutal diffusion, found essentially identical results of the effect of the solute field on σ* for marginal stability and linear solvability. For larger undercooling, the correspondence of solvability and marginal stability was less clear. In order to assess the validity of Mullis’ criticism more work is needed. In any case, it was always clear that σ* is not constant under all growth conditions and a way out of this, for practical purposes, is calibration of σ* with experiment, as has been done for example by Oguchi and Suzuki for Fe–C [129] and for Al–Cu [130].
A useful overview of rapid solidification of undercooled melts specifically applied to intermetallics can be found in Herlach [131].
Dendrites in flow
The question that occupied several researchers in the beginning of the twenty-first century was the influence of fluid flow on the stability of the dendrite tip. Especially PF modelling of dendrite growth in the presence of fluid flow that started before 2000 [1] has become a topic of special interest over the past decades. Using a 2D PF model based on the work of Beckermann et al. [132], Tong et al. [133] studied the effects of fluid flow on free dendritic growth in a supercooled melt. They also compared their results with Bouissou and Pelce’s solution [134] based on Oseen–Ivantsov’s solution for steady state growth under forced flow at small Reynolds numbers. Dendrite tips growing upstream showed a change in tip selection parameters and a distortion of the dendrite morphology close to the tip. An increase of amplitude and frequency of the sidebranches has also been found. Jeong et al. [135] published a PF model using an adaptive finite-element grid (Figure 12). They discussed the qualitative difference in flow between 2D and 3D approximations and found good agreement between their results and those from solvability theory for 2D. These authors developed their model further [136] and studied the growth of succinonitrile and pivalic acid dendrites in undercooled melt in the presence of a forced flow in 3D. Their objective was to clarify the contradictory results of different authors on the effect of flow on the stability parameter σ* (see the article for more details). In the presence of fluid flow, the isolated dendrite tips grew faster with a smaller radius and σ* was only weakly lowered with flow rate. Comparison with results of an analytical theory, and experimental results revealed discrepancies that were attributed to the effect of structural elements of the dendrite behind the tip. Based on PF modelling of a Ni-Cu alloy, Lan and Shih [137] showed that flow increased sidebranching. Streamlines of forced flow (from left to right) passing a stationary equiaxed dendrite [135].
A phase field model using a multigrid approach for the simulation of the coupled thermal–solutal–convective case was developed by Guo et al. [138]. The plate like morphology of the dendrites result in unnatural flow patterns. The effects of flow on equiaxed and columnar growth have been analysed in 2D and 3D using a front tracking approach [139] and with the CAFV method [140]. These authors clearly showed that flow around dendrites is qualitatively different for both cases and that the results of 2D modelling could be misleading.
Das et al. [141] presented Monte-Carlo simulations of dendritic growth in forced flow. These authors showed that the morphology of the dendritic array is strongly influenced by convection especially when flow is turbulent and penetrates the interdendritic spaces. Fine compact structures are the result. These results are relevant for the intensive liquid shear technology for obtaining fine-grained cast structures by Fan et al. [142].
Li and Beckermann [45] extended the diffusional Ivantsov-marginal stability model [49] to the growth of a dendrite with natural thermo-solutal convection. The results of the stagnant film approximation were compared with experimental data for succinonitrile–acetone alloys by Chopra et al. [47]. It was found that the Li-Beckermann model agreed with the measured dendrite tip velocities and radii for low solute concentrations. At higher concentrations, the model-results deviated from the experimental data. The reason for this discrepancy was not clear. In related phase-field computations, Lu et al. [143] observed that σ* was essentially independent of the flow velocity under their experimental conditions. LaCombe et al. [144] concluded from microgravity experiments on pivalic acid that there is still a discrepancy between experimental and theoretical σ* values which is not fully understood. As already presented in Chapter 2, Melendez and Beckermann [44] undertook quantitative experiments of free dendritic growth in succinonitrile–acetone alloys under 1 g. The influence of natural thermo-solutal convection on growth was strongest at low tip velocity, V (Figure 13), decreased with increasing V and became negligible at V > 300 μm/s corresponding to ΔT = 1 K. The most important finding of this research was that, within the uncertainty of the measurements and for the limited range of composition, the tip selection parameter σ* was independent of the solute content but decreased with undercooling.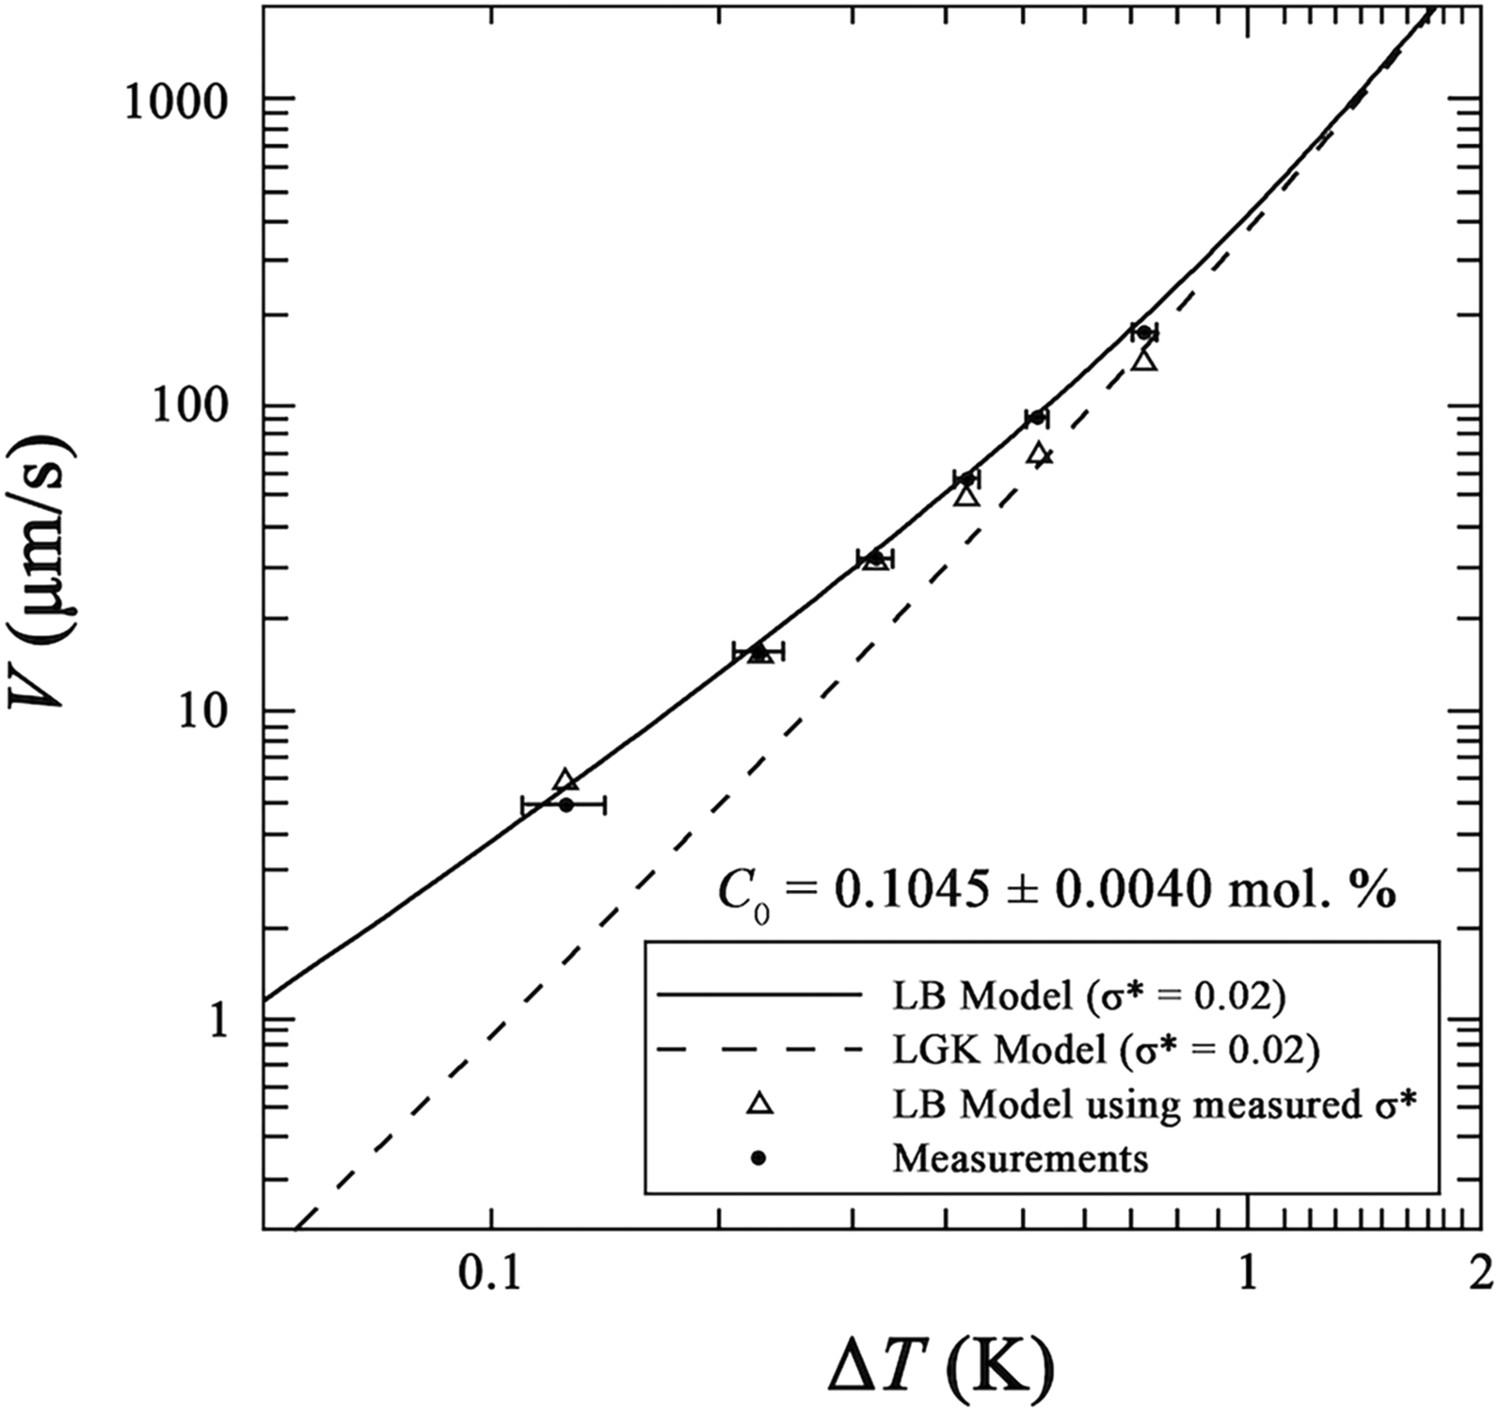
A method of damping convection on earth is directional solidification in thin tubes. This simple and highly useful method has been presented by Liu et al. [145].
Galenko and coworkers [146–148] developed another Ivantsov-solvability model for dendrite growth in fluid flow for low and high Péclet (growth and flow) numbers, and considering a small anisotropy of surface energy and attachment kinetics contributions. Transitions from solute diffusion-limited, to thermally-controlled and finally to kinetically-limited growth have been obtained. In Figure 14, experimental results on Ni-Al from containerless processing under 1 g and μg conditions and theoretical results are compared. The work shows that sharp interface models based on Ivantsov-solvability are useful for modelling a large range of growth velocities [122]. Dendrite growth velocities of beta-phase in Ni50Al50 obtained in electromagnetic levitation as a function of undercooling. Dots are experimental results; blue dots from terrestrial experiments and red dots from microgravity. Curves are the result of sharp interface model with and without convection [131,146].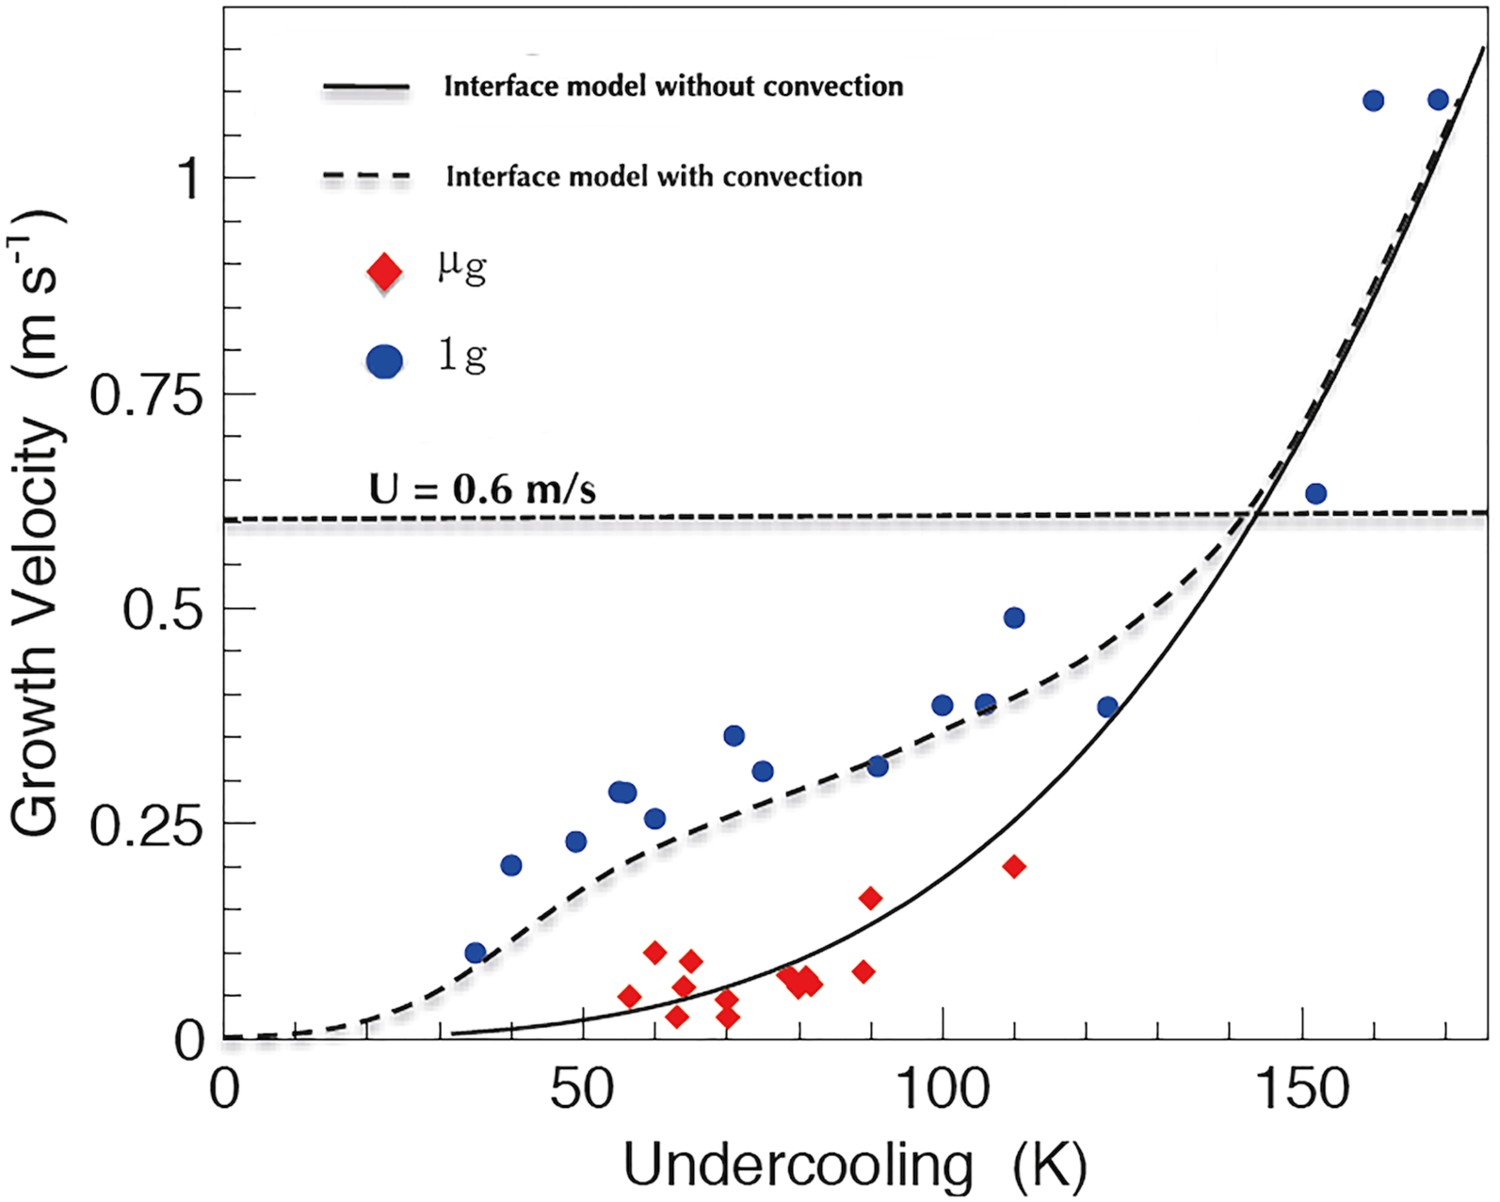
The absence of flow effects in space has been studied over many decades. As summarised by Nguyen-Thi et al. [149]:
It is now obvious that the earlier enthusiastic dreams regarding the potential of space manufacturing of innovative materials have given way to more realistic expectations. However, microgravity experimentation still offers a unique and efficient way for in-depth analysis of the pattern formation during directional solidification, in the limit of diffusive transport.
The settling of dendrites in the melt is another problem of flow. Badillo et al. [150,151] presented detailed measurements of growth rate of equiaxed dendrites settling in an undercooled succinonitrile–acetone melt (Figure 15). The average tip growth rate of the six ⟨001⟩ trunks is the same as in purely diffusion-controlled growth, while each of them has a different growth rate depending on its angle relative to the apparent flow during the fall. A similar study has been carried out previously by Gerardin et al. [152]. Equiaxed dendrite settling in an undercooled transparent SCN-acetone melt [150].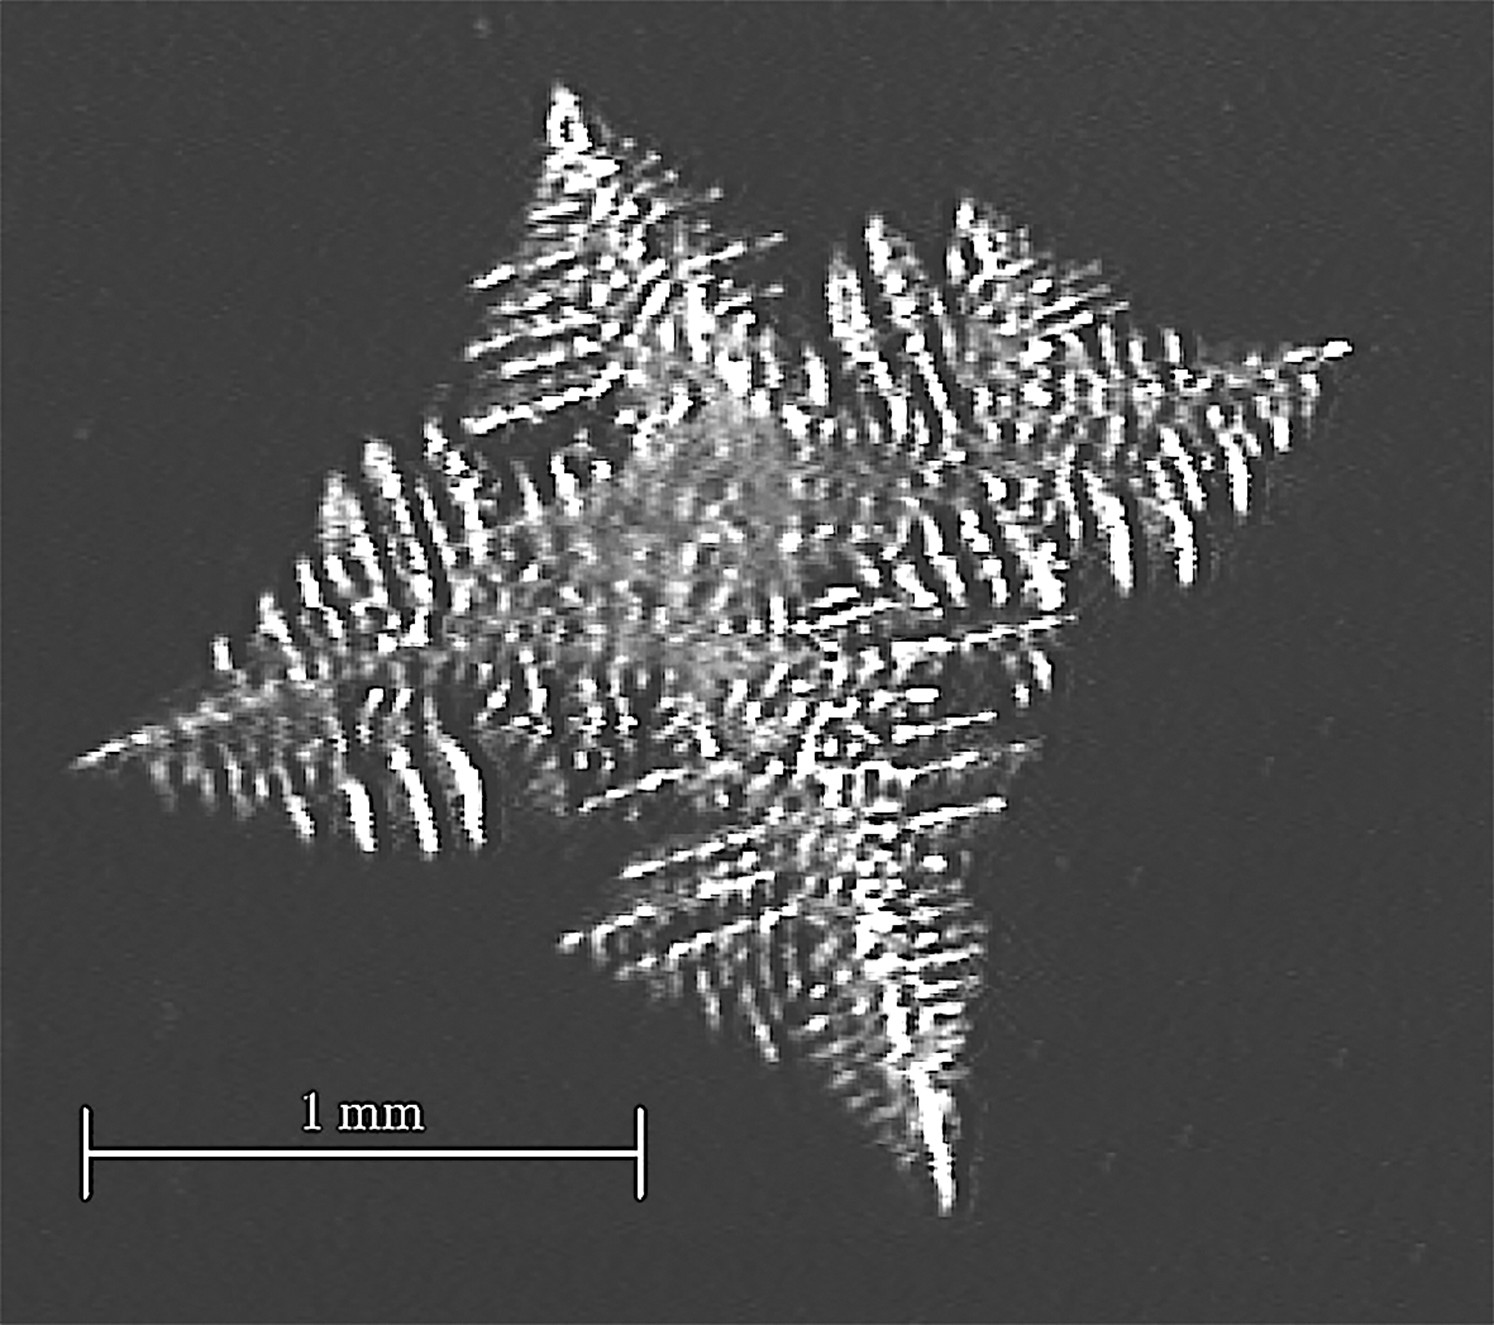
The simulation of the formation of microstructure in the presence of natural or forced convection can be done with various techniques. The microstructure itself is calculated according either to the PF method or a coarser approach, e.g. a modified CA method in which the curvature is estimated with the algorithm of Beltran-Sanchez and Stefanescu [77]. The temperature and/or solutal field is calculated with the corresponding diffusion equation with a transport term, while the velocity field is usually deduced from a finite volume (FV) or finite element (FE) solution of the Navier–Stokes (NS) equation. An appropriate penalty term is introduced for the solid–liquid interface in order to make the velocities of the liquid and solid phases equal [132]. This standard approach is typically adopted in [133,135,136].
In order to take advantage of the regular grid usually associated with PF or CA calculations, an increasing number of recent contributions have used a lattice-Boltzmann method (LB) for the fluid flow simulations [153–171]. A description of the various LB methods can be found in [153,154]. In off-lattice methods, pseudo-particles of fluid are free to move and interact via short-range interparticle forces, which include repulsion, dissipation and some randomness, in a way similar to molecular dynamics. In lattice-Boltzmann models, pseudo-fluid particles can only move along the axes of the lattice with a velocity distribution given by Boltzmann transport equation, and collision rules at vertices. Probably the first papers on dendritic growth in melt flow using LB coupled with PF (PFLB) has been presented by Miller et al. [155,156]. Medvedev and Kassner [157] applied a similar approach to calculate the 2D growth of dendrites and doublons in a shear flow, with a comparison with the solution of Bouissu and Pelcé [134]. They found that doublons are particularly stable.
As demonstrated in [158], the coupling of a modified CA with LB is much more efficient than the standard solution based on CA coupled with FE computations of fluid flow, while producing very similar results. A similar work was done in 2D by Sun et al. [159], with a comparison of the LB-CA results with an analytical solution and with the LGK solution, for a dendrite growing into a forced flow. These authors then analysed the growth of dendrites in the presence of natural convection [160]. The group of Felicelli [158] showed in 2D that convergence of LB-CA toward the LGK solution was reached when the mesh size is smaller than 0.5 μm. The same group [161] then made a parallel version of their LB-CA code to perform 2D computations of 100 randomly oriented dendrites on 3000 cores in an undercooled melt, and later 3D computations with 36 billions grid points on 40,000 cores of columnar dendrites growing within 1 mm3 volume [162].
An intense activity on LB coupled with PF has been developed in Japan by the group of Takaki [163–166]. Rojas and Takaki [163] calculated the growth of a stationary dendrite in a force flow and a dendrite which is settling, including translation and rotation. They compared their results with those of Beckermann et al. [132]. Sakane et al. [164] introduced massively parallel computations on 128 GPUs to calculate 3D dendrite growth in a forced flow. With 10243 mesh points and 60,000 steps, they obtained for one dendrite in a forced flow a result similar to that shown in Figure 12 [135]. They also calculated several grains in 3D, and in another paper [165] the growth of the six arms of an equiaxed grain having various inclinations with respect to a forced flow. Finally, Takaki et al. [166] made 2D LB-PF calculation of many grains moving and growing in a fluid flow, including possible collision and coalescence among their population (Figure 16). More work dealing with LB-PF is listed in [167–171]. Equiaxed dendrites moving, rotating, growing, and colliding in a melt flow as a function of time [166]. Cell length 3.071 mm.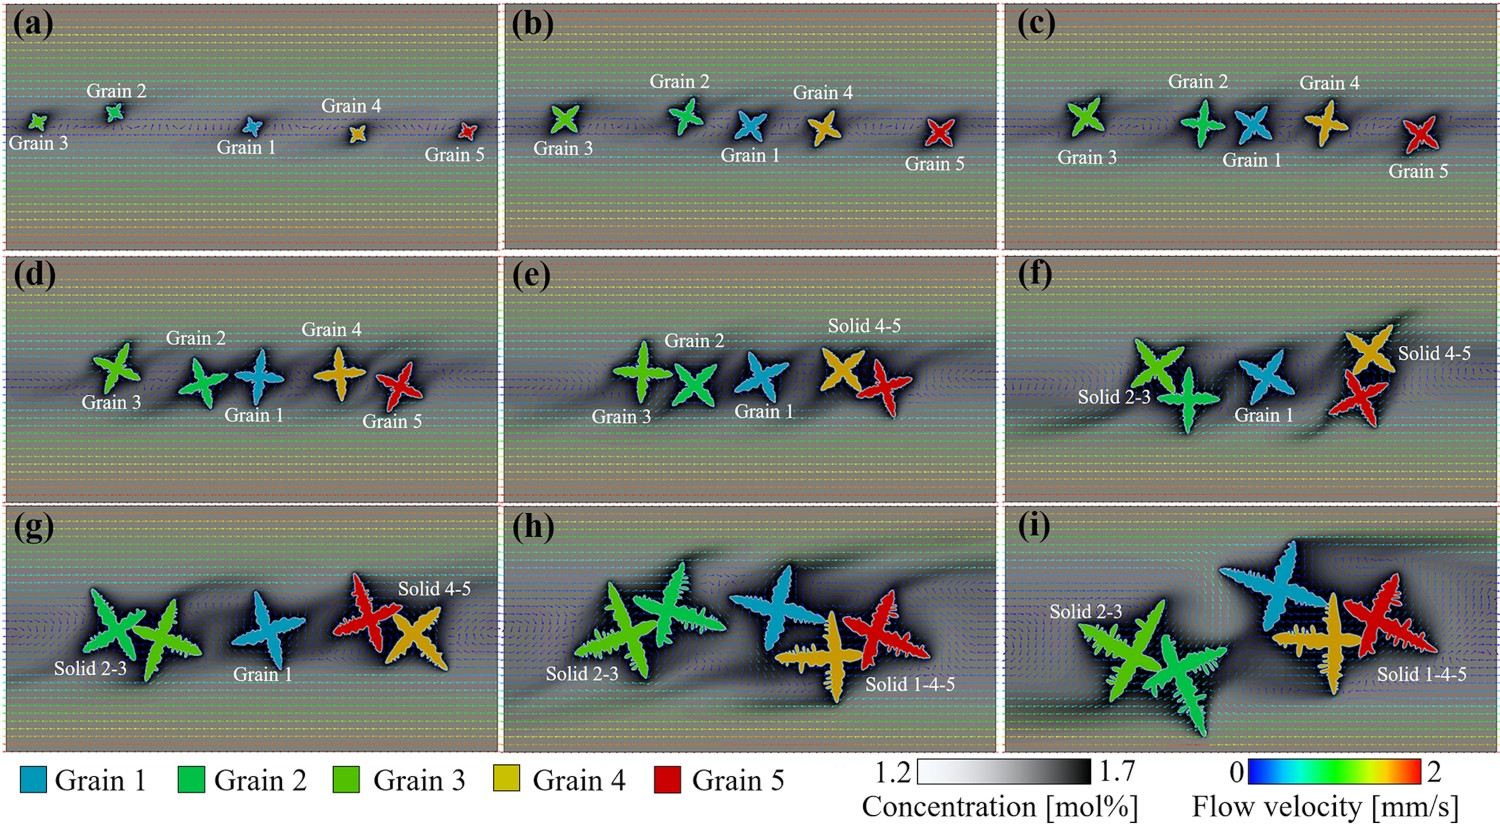
Another model, the mesoscopic envelope model (MEM, Section ‘Equiaxed and columnar growth’), can treat growth of equiaxed and columnar structures with fluid flow in 3D [89]. The computational cost of this model is several orders of magnitude lower than the above models and can bridge the gap between phase-field and macroscopic models.
However, as concluded by Yin et al. [158]:
Despite the significant improvement in computational efficiency of the model [LB-CA] introduced in this work, we are still a long way from undertaking the simulation of large castings with microscale resolution. However, with the rapid advancement in massively parallel supercomputers, currently in the petaflop range and aiming soon for exaflop performance, we think that highly parallelizable solidification models are more likely to someday serve as reliable prediction tools of microscale defects in actual manufacturing processes.
On the experimental side we mention the work by Shevchenko et al. [172] who studied directional solidification of Ga–In alloy with X-ray radioscopy. Flow affected the grain growth primarily due to convective transport of solute; acceleration of dendrite trunks and branches at the upstream side, suppression of side branches at the downstream side, change of inclination of the dendrites and the angle between trunks and secondary arms. Aussillous et al. [173] developed another interesting technique for the visualisation of flow phenomena during solidification, magnetic resonance imaging, MRI. This technique is for non-metals and suitable model alloys have to be selected.
Fragmentation
Fragmentation is a process of separation of dendrite arms which can initiate growth of new grains. Two different fragmentation phenomena have been observed: (i) at low undercooling the detachment of secondary arms of columnar dendrites and (ii) at high undercoolings grain refinement, the mechanisms of which are not fully understood.
Case (ii) has been treated in the first part of this review [1]. Herlach and coworkers [174,175] used the Karma model of dendrite trunk break-up [176] to explain the experimental observations of grain refinement in highly undercooled melts. This model is based on the capillarity-induced Rayleigh-Taylor instability of dendrite trunks (assumed to be cylinders). The higher the growth rate the finer are the dendrite trunks and the more rapidly will they fragment during recalescence. The model allows a semiquantitative interpretation of the experimental findings. In contrast to this model Mullis and Cochrane [177] explained the spontaneous grain refining at high undercooling with multiple tip-splitting. In later work of this group [178], three different grain refining mechanisms have been identified: recrystallisation, dendrite fragmentation and dendritic seaweed fragmentation, the respective mechanism depending on a balance between the capillary and attachment kinetic anisotropies. The topic is still open to a final conclusion.
Case (i), detachment of arms or patches of arms of columnar dendrites, is happening preferentially in the low solid fraction region close to the tips of the columnar dendritic front. There the curvature of arms is high and bulk fluid flow induces thermal and solutal fluctuations in the mushy zone that destabilise the branches and move them into the bulk melt. If the fragments reach an undercooled region of the melt, they grow. This is an important mechanism for grain refinement, positive for polycrystalline materials [179] and negative for single-crystals [180].
The increasing spatial and temporal resolution of in situ synchrotron X-ray microscopy has produced interesting observations of the details of the processes involved. Such experiments have been used for the observation of fragmentation in Sn-Bi [181,182], Al–Cu [183–185] and Al–Si [186]. According to Mathiesen et al. [183] local solute-enrichment due to buoyancy driven convection in Al-Cu led to the detachment of tertiary arms at their roots (Figure 17). Al-rich low-density tertiary arms with their quaternaries were seen to float upwards in a Cu-enriched liquid. This process was specifically active at divergent grain boundaries. Nguyen-Thi et al. [187] observed in X-ray radiography the continuous detachment of secondary branches and discussed the effect of gravity in experiments on earth and in μg environment. The mechanisms of fragmentation by ultrasonic pulses have also been studied by synchrotron X-ray imaging [188]. It is a potential method of grain refinement in castings. In situ observation of fragmentation during directional solidification of an Al–20 wt%Cu alloy [183].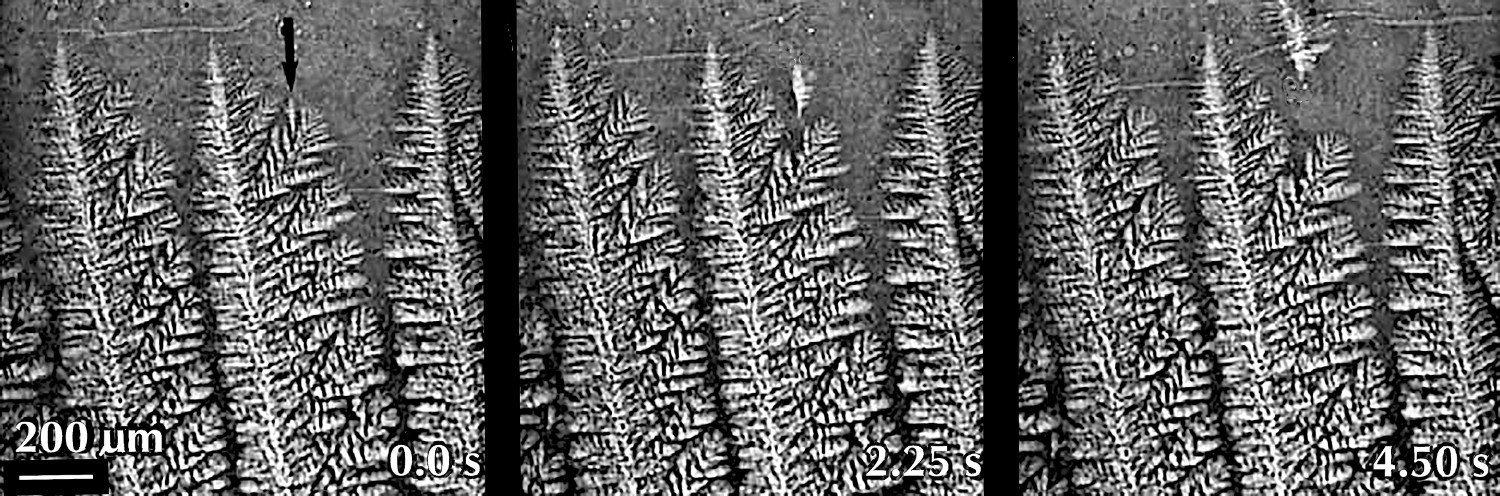
In situ observations of solidification of metals have added valuable information on the mechanisms of fragmentation and stimulated theoretical work. During solidification, the columnar dendrites can be subject to mechanical deformation which might contribute to the detachment of arms [189,190]. The phenomenon is dominated by melting, first by the mechanism of detachment and second by the survival of the detached crystals in the melt. Rettenmayr [191] published a review on melting under diffusion control, including kinetic phenomena that differentiate melting from ‘inverse solidification’, such as solute partitioning and concentration gradients. In this article the author also discusses the various mechanisms that lead to fragmentation. Wesner et al. [192] undertook 2D and 3D phase-field computations on the effect of thermal cycling on equiaxed dendrites during melting and fragmentation. Slightly below the liquidus, the structure coarsened, while for a critical superheating above liquidus, fragmentation occurred (Figure 18). The effect of solidification (increasing solid fraction during cooling) on pinching-off of branches in columnar growth has been examined numerically by Neumann-Heyme et al. [193]. These authors found that the behaviour of the neck, which attaches the dendrite branch to the stem, is the critical element of the process. Pinching-off occurs for certain geometrical parameters and cooling rate. It is bounded by two other mechanisms: retraction and coalescence (Section 'Secondary arm spacing'). Long dendrite arms pinch-off, while short ones retract (Figure 19). From 4D synchrotron X-ray imaging work on Al-15 wt%Cu Cai et al. [194] concluded that fragmentation was probably due to transgranular liquation cracking, a result of deformation by buoyancy and the Gibbs-Thomson effect. Equiaxed dendrite in Al–4%Cu alloy. (a) Solidified dendrite, (b-d) Melting structures at T=925 K (∼5 K above liquidus) as a function of time. [192]. Domaine size 160 μm. Competition between retraction, pinch-off and coalescence of a secondary arm during solidification under various cooling rates 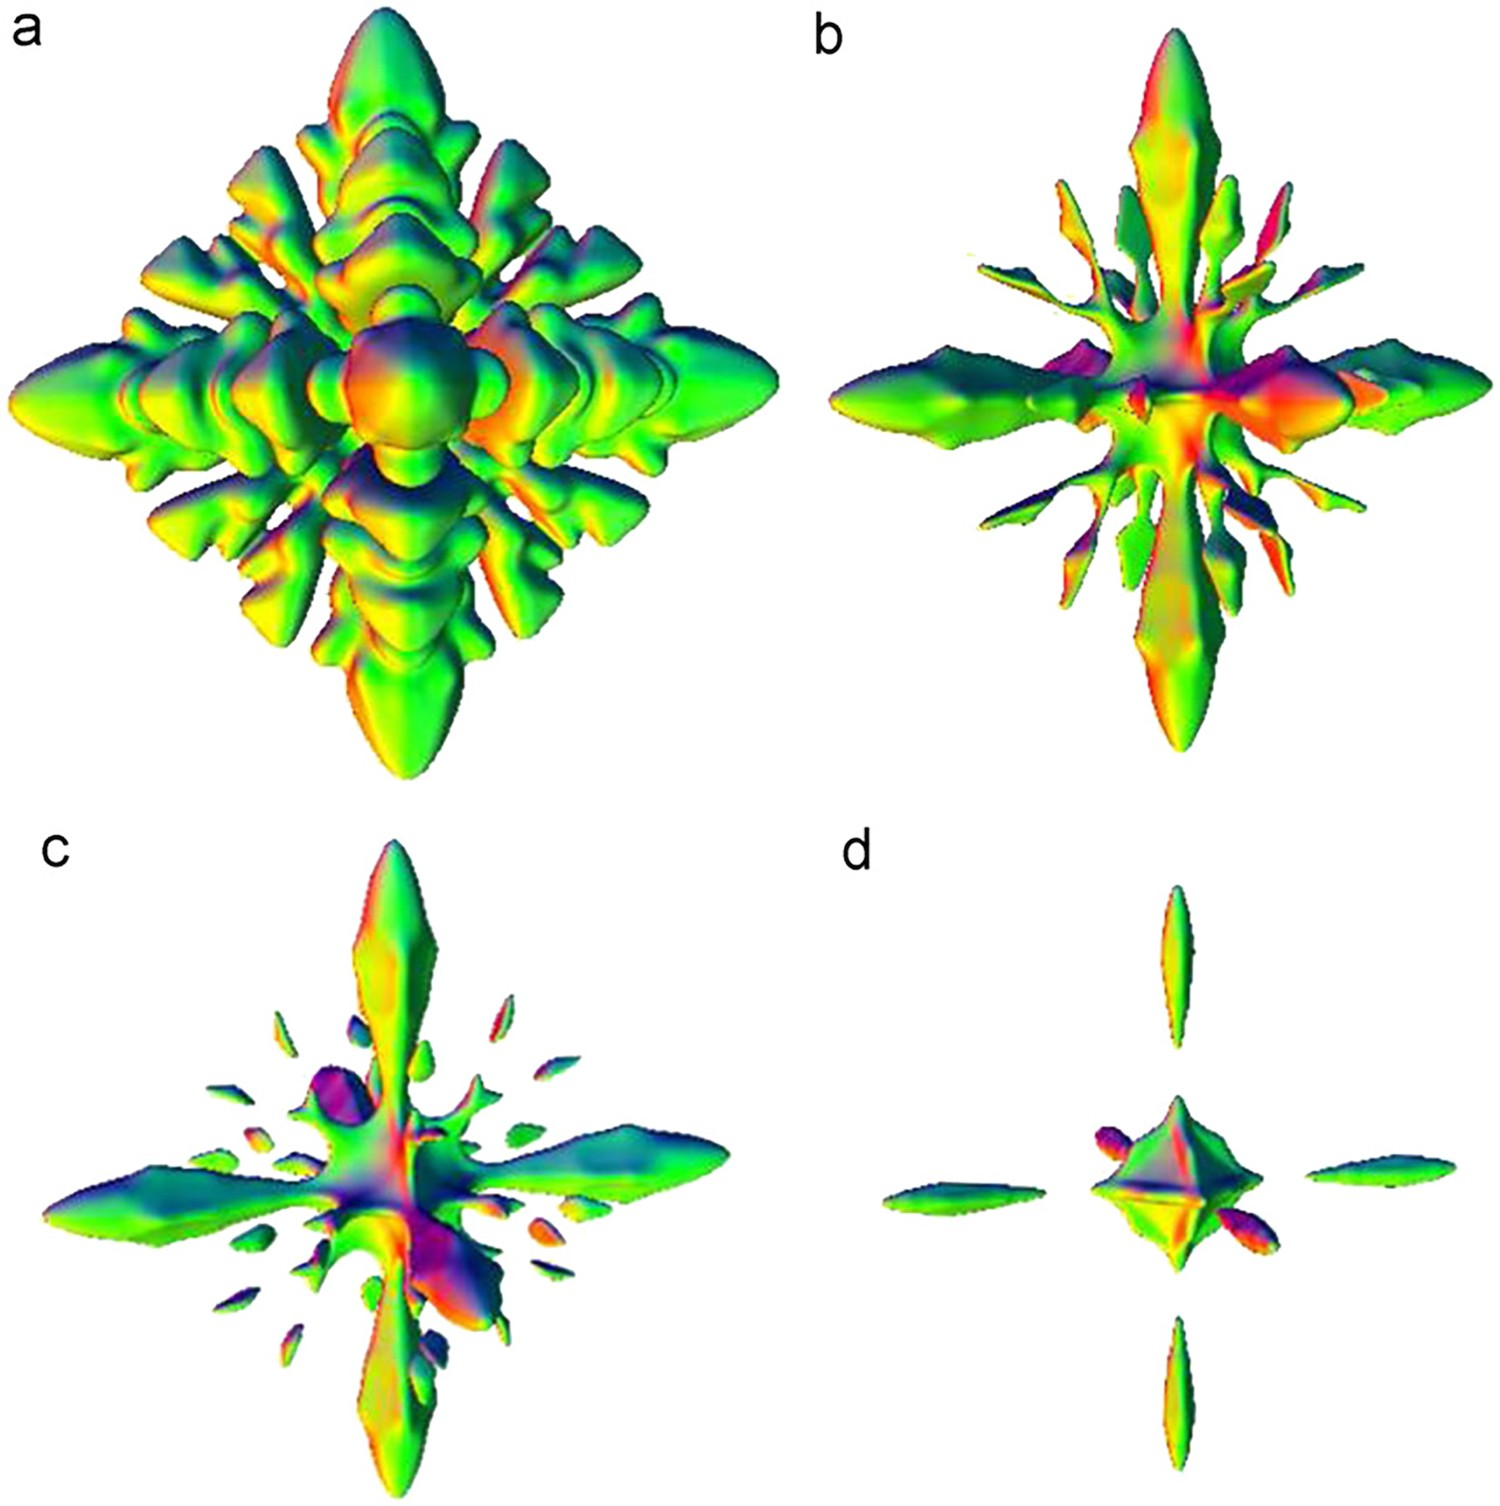

Stirring of the melt contributes to fragmentation. From synchrotron X-ray radiography experiments with an Al-15 wt%Cu alloy, Liotti et al. [195] obtained parameters for grain refining through fragmentation due to the action of a pulsed electromagnetic field. Li et al. [196,197] found that even a static magnetic field, if strong enough (up to 10 T), in a positive temperature gradient could cause the dendrites to fragment producing a CET. Numerical computations showed that a torque due to the thermoelectric magnetic force is created on the dendrites. Also an electric current creating flow by the Lorentz force [198] or ultrasonic pulses [199] can fragment dendrites.
In large-scale continuous casting of steel for example, electromagnetic stirring is used for the production of a more homogeneous equiaxed microstructure. In directional solidification experiments on Cu-based alloys, Campanella et al. [200] showed that the action of electromagnetic stirring strongly depends on the penetration of the liquid into the interdendritic spaces, specifically in the low solid fraction tip region of the structure. These authors developed a remelting criterion similar to that of Flemings [201]: if solidification shrinkage is neglected, melting occurs when the component of the velocity of the interdendritic fluid along the thermal gradient is larger than the speed of the isotherm. They concluded that remelting occurs if:
Cool and Voorhees [204] studied isothermal coarsening of dendritic Pb-Sn alloys aboard the International Space Station. The morphology of the structure, the number of fragments, the change in length scale, interfacial shape, connectivity of the structures as a function of time were determined using three-dimensional reconstructions. The authors concluded that it is possible to predict the number of fragments during coarsening by a measurement of the surface area per unit volume.
Closely related to fragmentation and remelting is the development of freckles. This phenomenon is specifically harmful in the processing of superalloy castings such as single crystal turbine blades, but also in the formation of A-segregates during continuous casting of steel. We cite here only a few recent papers that analyse the phenomenon. Madison et al. [205] studied convective instabilities in 3D fluid flow simulations using information of an experimentally obtained dendritic superalloy array. The permeability, a function of interfacial area with a maximum at 0.65 solid fraction, was found to influence the formation of convective instabilities. Yuan and Lee [206] developed a 3D dendrite growth model that takes into account solute distribution, interdendritic thermo-solutal flow and remelting. In good agreement with experiments, freckling happened above a critical Rayleigh number, as predicted also by the modified Rayleigh number [207]. X-ray radiography was applied to freckle formation by Karagadde et al. [208]. Simulation and in situ X-ray imaging in a Ga–In alloy showed that variations of the cooling rate, the grain orientation, and, most important, the primary trunk spacing were key variables. Interesting enough was the finding that converging grains developed preferentially freckles.
Columnar-to-equiaxed transition (CET)
The CET is a structural transformation with important consequences for the properties of as-solidified products. Equiaxed structures are generally more homogenous (for example due to stirring in continuous casting of steel, see above), while columnar grains are interesting for uniaxial load applications such as turbine blades. After Tiller’s 1962 CET model [209] (that was too complicated to be used by most researchers), it was not before 1984 that Hunt [210] presented a first simple criterion. This deterministic approximation of the real mechanism has stimulated much research in the field of the CET (see part I [1]). Since the year 2000 many more studies appeared in the literature, so many that only a very limited selection of papers is presented here; this the more as the subject has been summarised in detail in reviews by Spittle up to 2005 [211] and by Mirihanage et al. [212] up to 2012.
In deriving its CET criterion, Hunt made a drastic approximation which corresponds typically to a Bridgman experiment in which the thermal gradient G and velocity of the isotherm vT are given and fixed. He assumed that equiaxed grains can nucleate and grow in the constitutionally undercooled region ahead of the columnar dendrite tip region. In zeroth approximation, it can be shown that for zero nucleation undercooling Hunt’s transition criterion can be obtained simply by the equality of the thermal length of the constitutionally undercooled region ahead of the columnar dendrites and the distance between the nuclei [1]
Hunt’s criterion is typically useful in situations where the melt is heavily inoculated with very efficient particles, e.g. TiB2 or TiC in Al alloys. As shown by Greer and coworkers [214], the typical nucleation undercooling associated with such inoculants is a fraction of a degree, i.e. a value smaller than the undercooling of columnar dendrites. In many situations, the transition from columnar to equiaxed morphologies is more complex for several reasons.
First, as shown by Gandin in a detailed thermal study of non-inoculated castings solidified under 1D conditions [215], the CET can be correlated directly with the velocity of columnar dendrites. In 1D Al-7%Si ingot, it has been shown that the velocity of the columnar dendrite increases with time as the superheat is progressively eliminated. At about two thirds of the height of the casting, the velocity of the columnar dendrites starts to decrease as the thermal gradient in the liquid tends to zero or becomes even negative. This corresponds precisely to the beginning of the equiaxed zone observed in the castings. Such conditions, typically favour dendrite arms remelting/fragmentation (see Section ‘Fragmentation’), and these fragments can survive and grow into equiaxed grains in the undercooled region.
Second, even with fixed thermal gradient and isotherms velocity, the columnar dendritic boundary layer interactions are weak near the tips and equiaxed grains can develop even behind the columnar growth front. There are various intermediate morphologies which appear, especially grains nucleating and growing in a thermal gradient (Figure 20). The resulting misoriented and elongated grains are similar to experimental observations by Mokadem et al. [216] as well as to in situ X-ray radiography observations, e.g. by Nguyen-Thi [217] et al. or by Dong et al. [218]. A few elongated grains formed at mid-height of 1D castings can also be observed in the microstructures presented in [215]. The shape factor of grains constantly nucleating and growing in a thermal gradient has been calculated with the growth kinetics of eutectics (formally similar to that for dendrites/eutectics used by Hunt in his CET model) [219]. The shape factor S (ratio of the grain extensions in the direction of, and opposite to the thermal gradient) varies between S = 1 (truly equiaxed grains) and S = ∞ (columnar grains), with a dependence on the thermal gradient and isotherm velocity similar to those obtained with Hunt’s criterion for various equiaxed grain fractions (see [60]). The analytical and numerical solutions proposed in [219] were used as a test to compare a more complex solution of the CET and the shape of grains based on a front tracking technique [220]. Columnar to equiaxed transition from CAFD modelling of Dong and Lee [221]. As often in reality, the transition is sluggish and the so-called equiaxed grains have a form factor S >> 1 and show different orientations.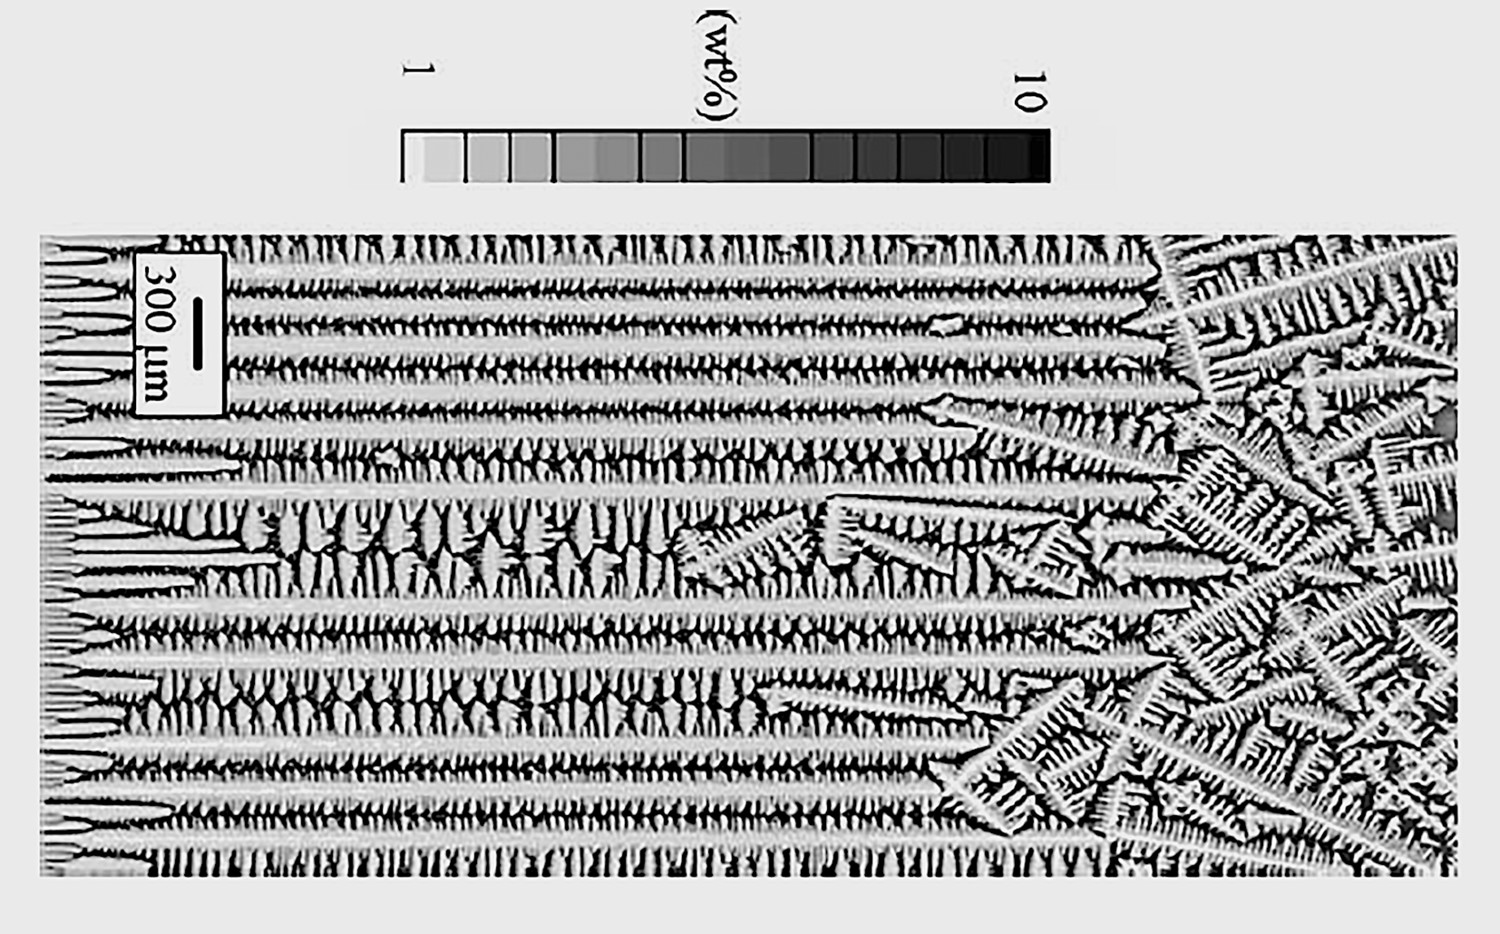
The CET can be modelled using various approaches, from a more macroscopic view at the scale of a whole casting down to a small solidifying specimen. They can be categorised as: (i) analytical models, for example that by Hunt [210] and others [180,211]; (ii) multiscale approaches which combine analytical models of nucleation and growth of columnar and equiaxed growth, coupled with heat- and mass-transfer equations at the scale of a whole casting. The extension of the pioneering work of Beckermann’s group [222] along this line is mainly pursued by Combeau and Založnik’s group [223], as well as by Ludwig and Wu’s group [224]; (iii) stochastic approaches such as the CAFE model by Gandin et al. [74] or the CAFD model by Dong and Lee [221]; (iv) mesoscopic models such as the dendritic needle network model [225] applied to the CET by Geslin and Karma [226]; and (v) phase-field simulations by Badillo and Beckermann [227] or Montiel et al. [228]. The analytical models (i) and (ii) use average microstructural quantities, while the models (iii)-(v) consider nucleation and growth of individual grains at specific (randomly distributed) locations. Except for (ii), the CET simulation methods, if they sometimes consider convection effects, macrosegregation and grain growth, do not yet take into account the transport of heterogenous particles and nuclei or dendritic fragments.
In many research papers, Hunt’s CET model is used for the interpretation of the experiments. However, Hunt in its original paper used the simple hemispherical extremum growth model for the dendrite tip. This model was adapted with a more realistic dendrite growth model, thus changing the limits for this transition [229,230]. This is especially important in additive manufacturing where rapid solidification conditions prevail. Rebow and Browne [231] determined the influence of σ* on columnar growth and on the CET for two Al alloys. Besides the approximations applied, the main problems of deterministic CET models are: (i) The columnar dendrite array is modelled as a single Ivantsov needle without taking into account the diffusional interaction between these needles in the tip region, and (ii) the models assume steady state conditions, i.e. the important transients are not considered. These deficiencies can only be avoided by numerical models, e.g. [226].
Martorano et al. [213] developed a multiscale model in which the local composition of the liquid due to the interaction of the solute fields of the grains (as equivalent cylinders or spheres) were used for columnar and equiaxed dendrite tip growth. This modification resulted in important changes of the CET condition. Based on results for Al–Si alloys, these authors also concluded that the origin of the equiaxed structure is possibly the fragmentation of columnar dendrites.
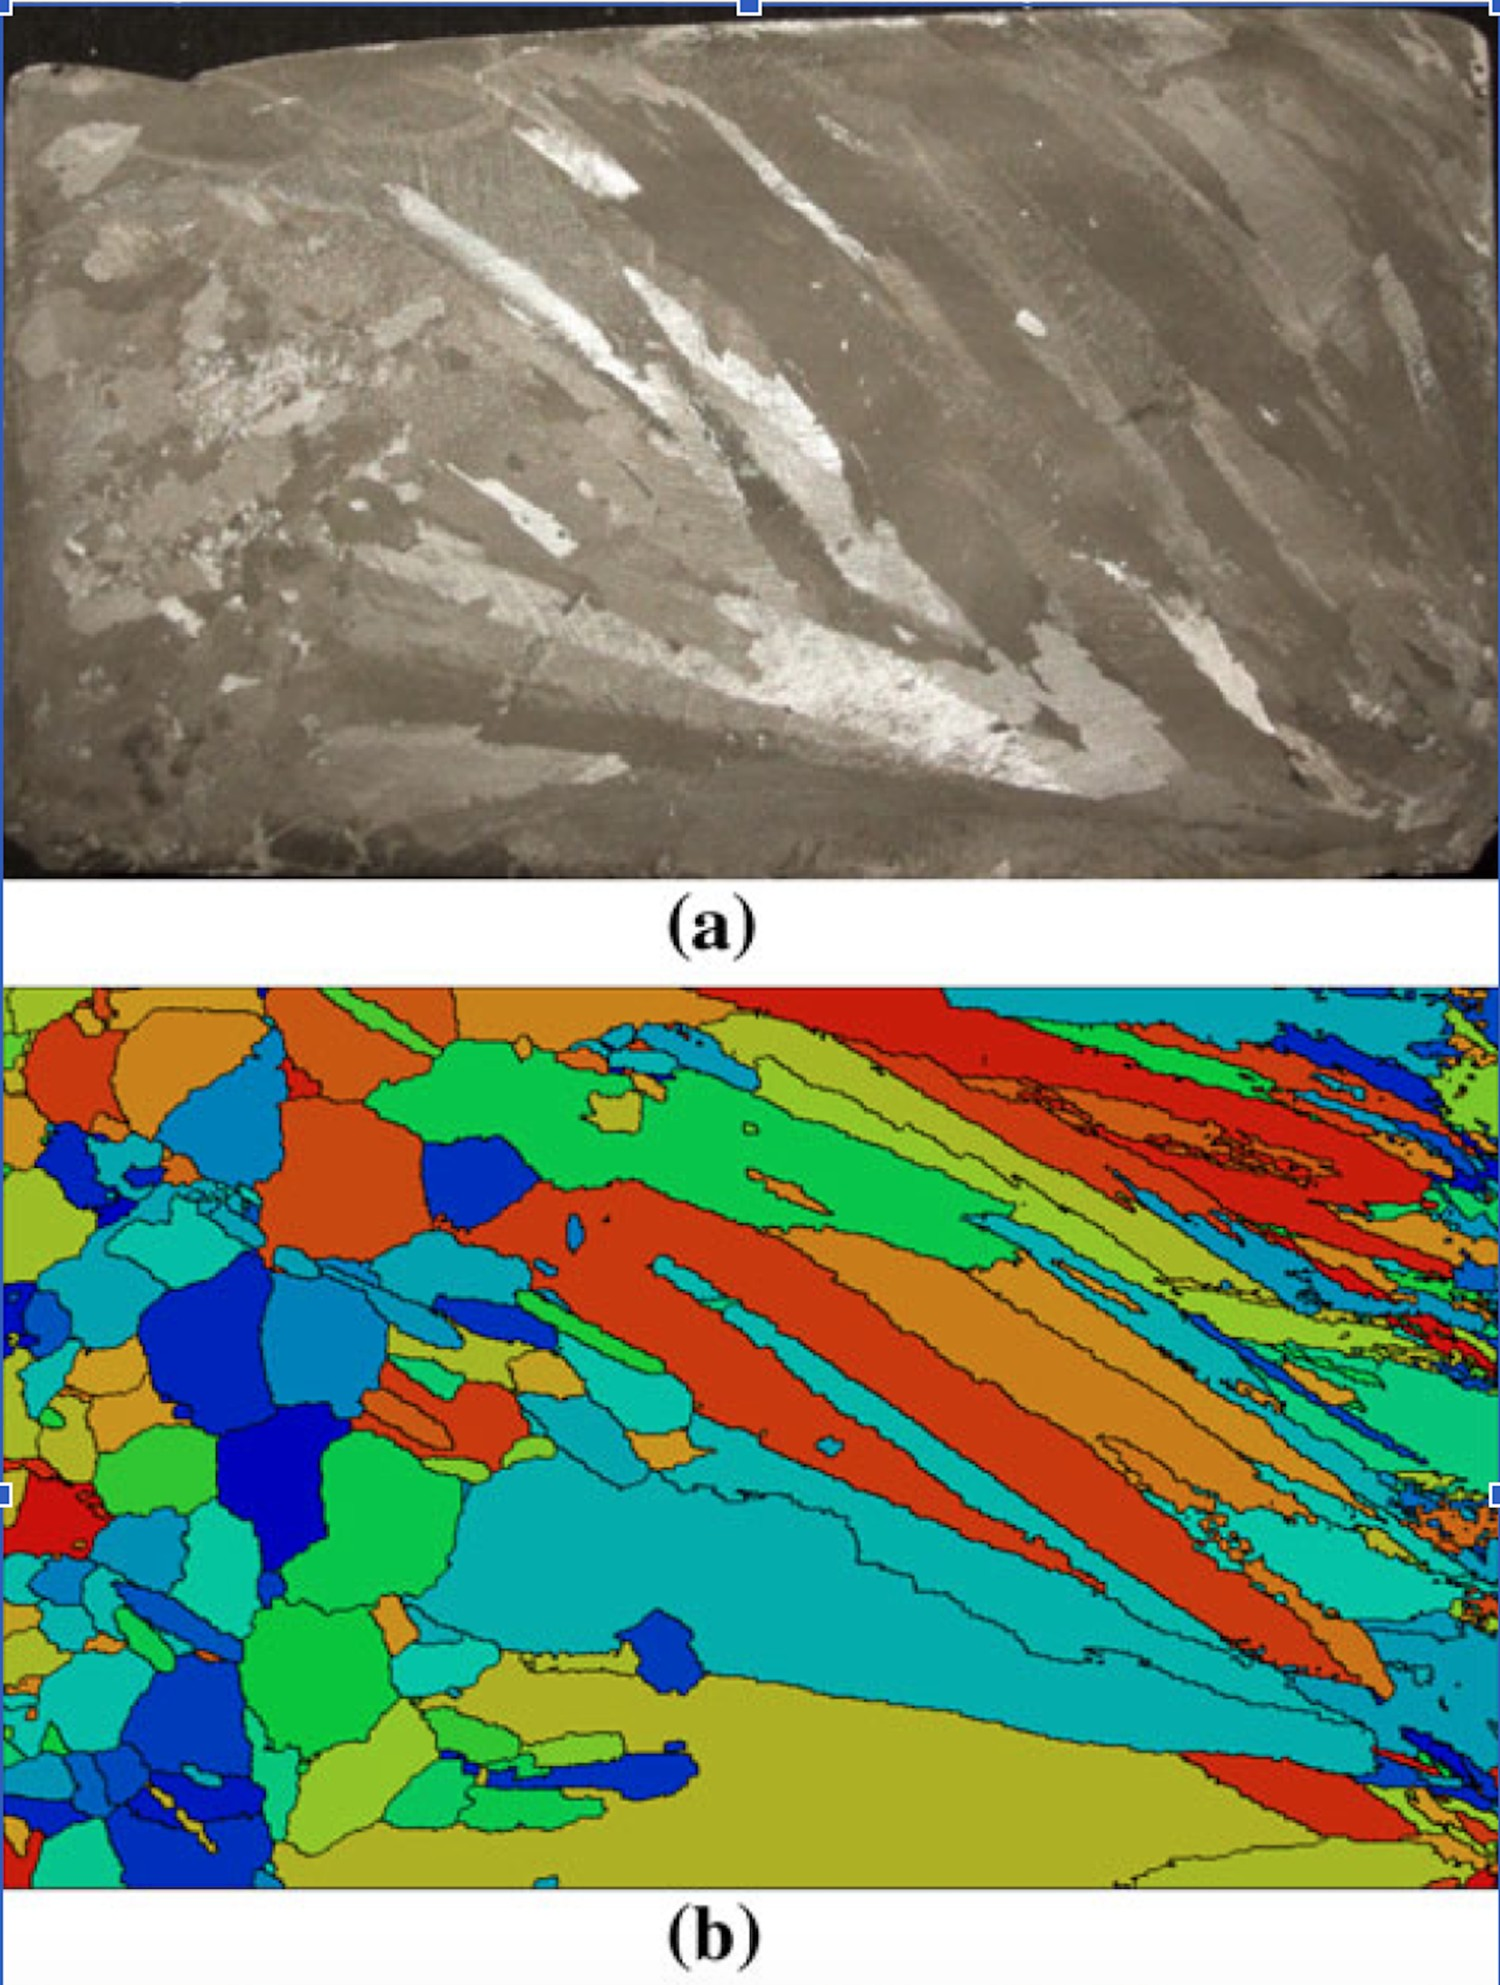
A cellular automaton-finite difference (CAFD) model was developed for the simulation of solidification of binary alloys by Dong and Lee [221]. The model allowed computing the growth of equiaxed and columnar dendritic grains in 2D and 3D, with the ⟨100⟩ directions either aligned or inclined with respect to the grid. The CET in castings has been examined and modelled extensively by Gandin et al. [74,232–234] with their CAFE technique (Figure 21). Initially the CAFE model [74] assumed a uniform initial composition of the liquid and neglected convection, i.e. nucleation and growth of grains was only coupled with a heat balance. More recently, Gandin and coworkers have included convection and solute transport [232–234]. As macrosegregation is predicted at the level of the FE mesh, the local composition interpolated at the CA level can be used to compute the dendrite growth kinetics. Furthermore, the effect of fluid flow on the dendrite growth kinetics is accounted for in these CAFE simulations via a stagnant film approximation in the liquid ahead of a paraboloidal dendrite [235]. These improvements in the CAFE approach make it most suitable for the modelling of grain structures in actual castings. It provides also a direct view of the final grain structures, with the complex transitions from columnar to elongated and finally to truly equiaxed grains with a recalescence (see Figure 22). However, the FE mesh is usually coarser than the CA grid, which itself is coarser than dendrite tip radius. In contrast to PF or DNN, complex solutal interactions between dendrite tips located next to grain boundaries are only approximated in CAFE. This can have an effect in particular on grain competition at grain boundaries (see Section ‘Grain competition’). CAFE simulation of columnar and equiaxed growth of a Al-7 wt%Si cylinder (h = 173 mm, d = 70 mm) [232]. Microstructure of a Sn-3 wt%Pb casting with cooling from the right face; (a) metallographic section, (b) 3D CAFE simulation including convection. Size of casting : 100 x 60 x 10 mm [234].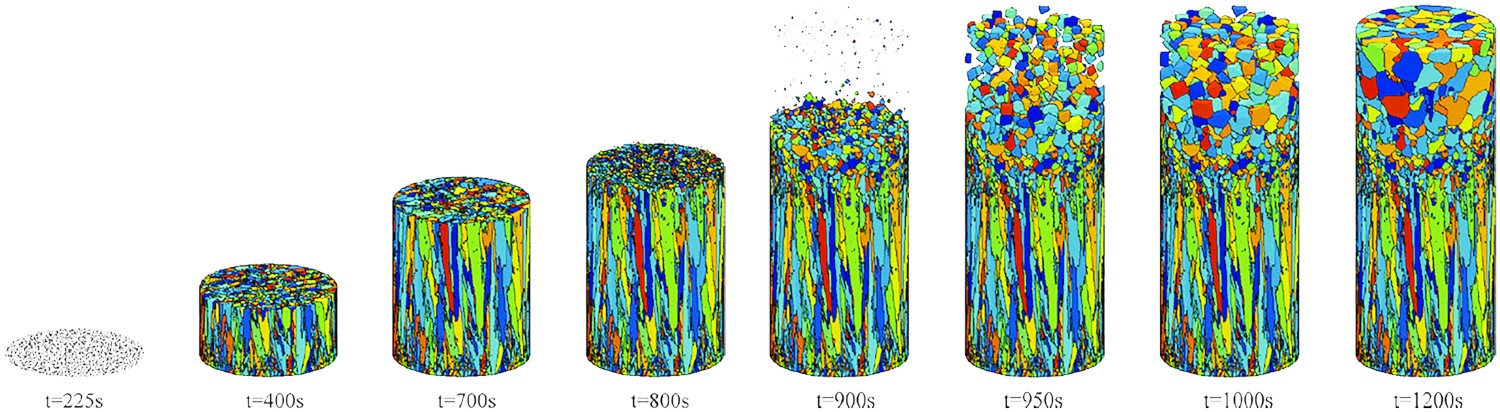
In 2006, Badillo and Beckermann [227] published a first 2D phase-field investigation of the CET. They studied the CET as a function of the variables, G, V, spacing of inoculant particles, nucleation undercooling, and interface energy anisotropy. Besides either columnar or purely equiaxed structures, mixed microstructures were also found. Crystal anisotropy had also a strong influence. The comparison with Hunt’s model showed the same tendency. Later Viardin et al. [236] presented another 2D PF simulation of the CET.
A recent interesting approach to multiscale modelling of dendritic grains and their interactions is the DNN (dendrite needle network) method. In this model, the primary, secondary and higher order branches are represented by a network of needles that interact through their diffusion fields. This allows quantitative simulation of transient growth regimes and the dynamics of complex networks in dendritic arrays in undercooled or directional growth situations. However, as an important simplification, it is necessary to set a value for the secondary branch spacing. More important if the CET is to be modelled under realistic thermal conditions, the DNN does not consider the concept of volume fraction of solid and thus cannot be simply coupled with a heat balance, e.g. to predict recalescence. DNN simulation is faster than PF by four to five orders of magnitude in 2D and 3D, respectively. DNN is therefore well suited to model interacting and competing phenomena of multiple dendrites, e.g. at grain boundaries. The principle idea of this technique was presented by Karma in 2001 [6]. Tourret and Karma [237] developed the method for 2D cases and later extended it to 3D [225]. Figure 23 presents the results of the DNN computations of Geslin and Karma [226] in a G–V diagram together with computed microstructures. CET results from Geslin and Karma [226] for a ‘frozen temperature gradient’ approximation. (a) G–V diagram computed with DNN results (dots) and curves from GTK [230]. (b-d) microstructures from DNN simulations; (b) at low growth rate columnar growth dominates with some small isolated grains between columnar dendrites. At higher rate (c) the transition happens over a certain distance and the grains are elongated and not equiaxed (see also Figure 20). Such a structure has also been found in Al–Si [238], in a superalloy [214] and analysed in [219,220]. For a sufficiently low temperature gradient (d) the transition is sharp.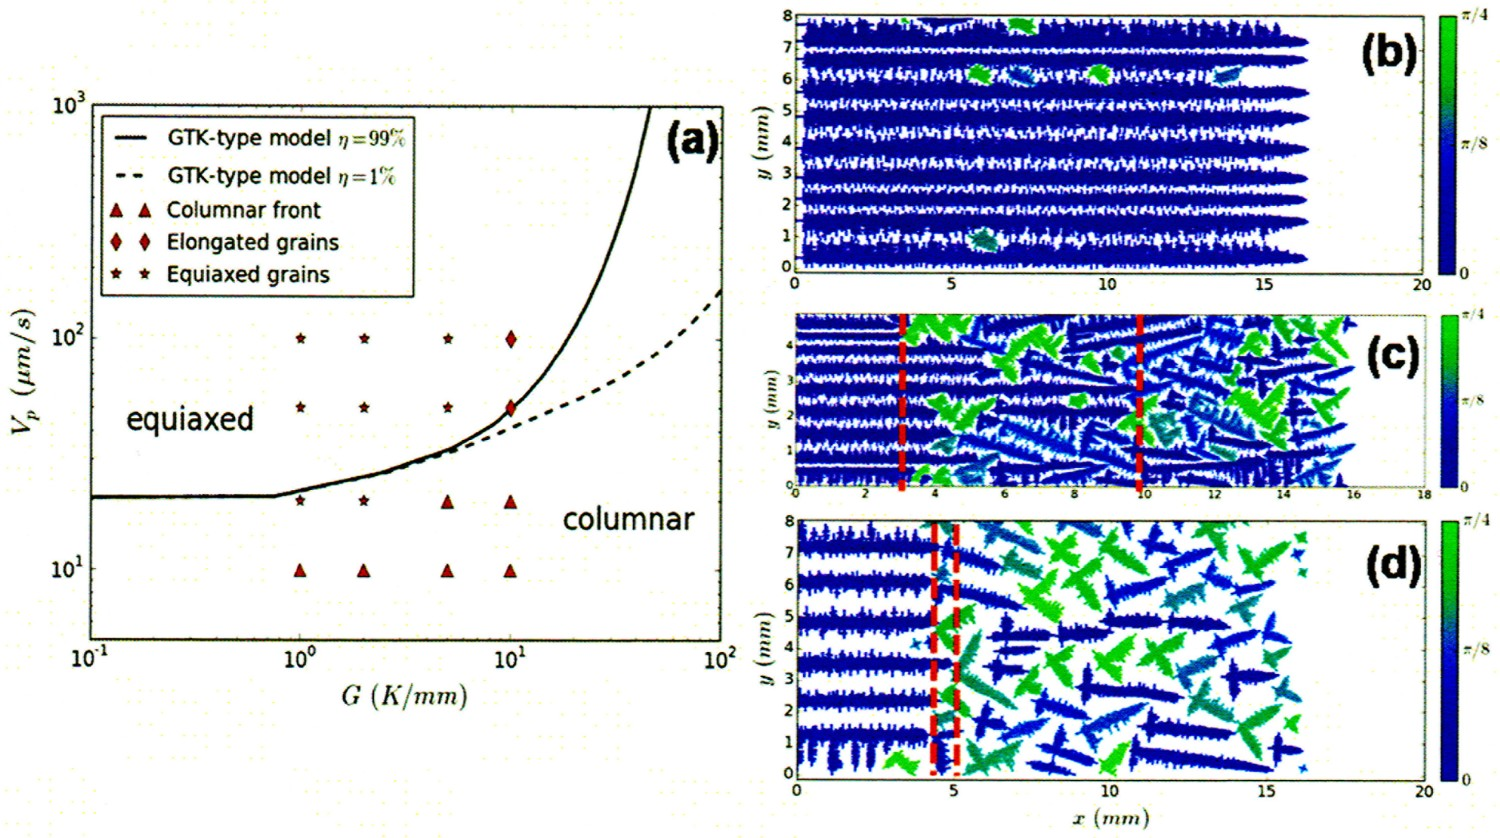
X-ray imaging techniques were used to observe the CET in-situ and in real time. Early use of synchrotron X-ray radiography for the CET was by Reinhart et al. [239], and Mathiesen et al. [183]. Nguen-Thi et al. [217] studied the phenomenon in Al-3.5 wt%Ni and showed the elongated morphology of the equiaxed grains growing in the positive temperature gradient. Another X-ray study has been published by Dong et al. [218], who found that in Al-15 wt%Cu alloy the liquid–solid density difference influences strongly the formation and transport of fragments leading to a CET.
In the last decade, micro–macro models of solidification have been applied to industrial processes. Ahmadein et al. [224] developed a volume-averaged solidification model that takes into account all stages from nucleation to globulitic growth, to globule-dendrite transition, to dendrite growth, grain movement and melt flow. Micro- and macrosegregation are also considered. Such simulations are of interest for the optimisation of processing of large castings. Leriche et al. [223] developed a similar multiphase approach for the determination of the CET in ingot castings. These methods span across many length scales, from the dendrite tip to a casting measuring several cm or meters. CET models were also applied with a certain success to welding [228,240–242], to additive manufacturing [243], or the control of crystallographic orientation in superalloys [244] that was based on previous research on SX deposition [180].
Dendrite spacings
In directional solidification (DS) experiments where G > 0, dendrites grow in arrays with a certain range of trunk spacings (λ1). Behind the tip, secondary branches (with spacing λ2) and sometimes higher order arms develop. The secondary arms increase their spacing by competitive growth and by ripening. Dimensional arguments lead to several simple relationships for these microstructural characteristics [245]. The spacings determine the distribution of inhomogeneities of the material and are important indicators for the properties of as-solidified products.
Primary spacing
The primary spacing, λ1, is a characteristic attribute of columnar dendrites, it does not exist in equiaxed structures. It defines the average distance between dendrite trunks and generally shows large variations. The primary spacing varies with alloy composition, C0, and solidification processing conditions, i.e. G, V and melt flow. Three purely diffusional growth models [246–248] led to the following proportionality

There has been numerical work on modelling primary spacings in purely diffusional environments, first in 2D and then in 3D with a cellular automaton-finite difference (CA-FD) model [76]. As stated before, such models are not fully quantitative as the estimation of the curvature cannot account accurately for the interface energy anisotropy. Developments in computer hardware and programming techniques, such as adaptive remeshing [97] and massive parallelisation [98], allowed more recently phase-field computations of large dendritic arrays and their stability range. Wang et al. [252] using a model by Karma et al. [64] examined the array stability in 2D and found a steady-state spacing close to the lower stability limit. The primary dendrite spacing in directional solidification of a Ni-based superalloy (CMSX-4 and equivalent) was systematically studied using 2D PF simulations [253]. The distribution of dendrite spacings for different velocities, temperature gradients and grain orientations was presented. These results are from 2D simulations which do not represent the real processes of dendrite competition.
In modelling diffusional columnar growth of hundreds of interacting dendrites with PF, Takaki et al. [100] observed predominance of hexagonal arrays (Figure 24(a)) with a spread of λ1(min)/ λ1(max) of 1:1.6–1:2 and a maximum frequency at approximately 20% above the minimum spacing. The mean spacings follow approximately Equation (5) (Figure 24(b)) which shows, once more, that the geometric mean of tip radius and thermal length of the dendrite, is a reasonable approximation of the scale when flow is absent. Clearly fluid flow changes this relationship as it interferes, among others, with the thermal length. 3D PF simulation of diffusional primary spacing by Takaki et al. [100]. (a) Cross section of a ⟨100⟩ Al-3 wt%Cu single crystal. The length of the image is 760 μm. (b) Primary spacings from PF computations (coloured dots) and experiments (black crosses) as a function of C01/4V−1/4G−1/2 from Equation (5). Straight lines are from diffusional primary spacing models [246,247]. The most advanced physical analytical model of Trivedi [248] lies in-between both lines, close to the experimental results.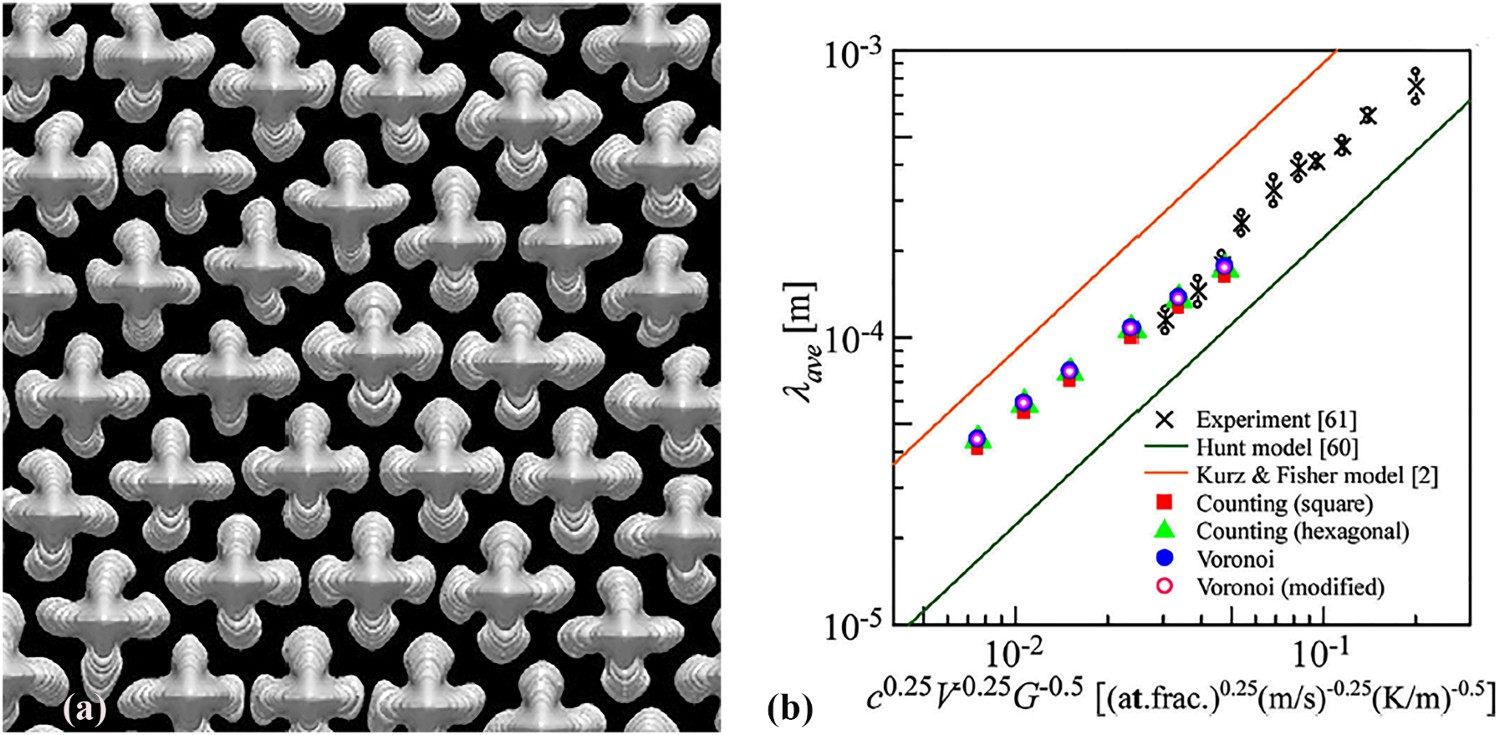
Tourret et al. [254] evaluated the primary spacing range of a hypoeutectic Al–Si alloy with the 3D DNN model (see Section ‘Columnar-to-equiaxed transition’) and compared the theoretical results with in situ X-ray measurements. This paper shows the importance of the appropriate value of the stability constant σ* that influences the primary spacing, and it shows also the potential of the DNN method for micro–macro modelling.
Viardin et al. [103] applied the MEM to the growth of columnar dendritic structures. The authors showed that this technique (Section ‘Equiaxed and columnar growth’), while drastically reducing the computation time, reproduces the expected evolution of the primary spacing, either by a spacing decrease due to the development of tertiary branches or by a spacing increase due to the elimination of trunks (Figure 25). Dendrite spacing selection according to (a) PF method and (b) MEM (mesoscopic envelope model) [103]. Domain width 1 mm.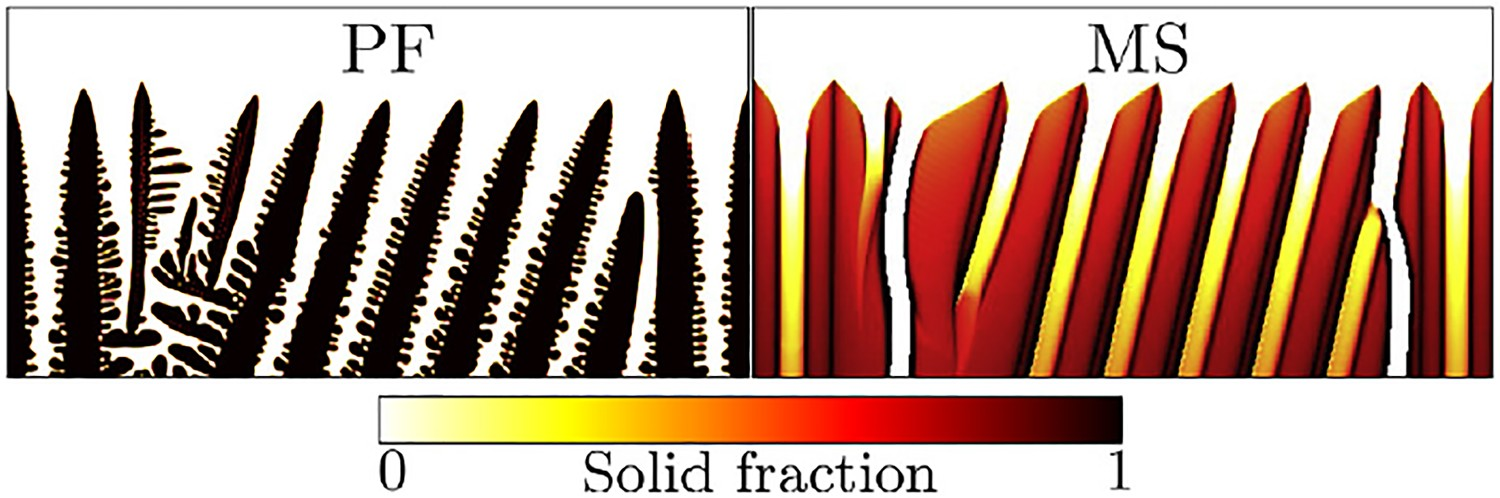
Dendrites which grow with an angle to the heat flow direction experience a different spacing relationship due to the multiple branching-competitive growth mechanism in the tip region leading to increased primary spacings with angle. This phenomenon has been studied in the past (see ref [1]). Equation (5) was multiplied by a function F(θ) [255]. More recently new insight into the dynamics of the processes has been published [256,257]. Using 2D and 3D CAFD simulations, Wang et al. [76] could capture the primary spacing selection by both branching and overgrowth mechanisms, but with the restrictions mentioned before concerning the influence of the grid and the absence of calibration with PF calculations.
Numerous authors measured primary spacings of directionally solidified (DS) alloys in 1 g environment and used Equation (5) for the interpretation of their experimental findings. Generally, deviations from diffusional theory have been observed which in most cases can be explained by the action of convection in the 1 g environment, as has been shown by Dupouy et al. in 1989 [258]. At the origin of fluid flow under terrestrial solidification conditions are solutal a/o thermal density differences. The resulting macrosegregation induces compositional changes which can lead to dendrite/cell transition with different growth relationships. Trivedi et al. [259] studied the effect of convection in directional solidification of various binary alloys. They observed dendritic microstructures with six nearest neighbours that showed the highest order in the range of the cell to dendrite transition. Interdendritic flow (present under 1 g) reduced the mean primary dendrite spacing, decreased the ratio of the upper and lower spacings, and reduced the order of the structure. Similarly, Zimmermann and Weiss [260] found in directionally solidified Cu-29.5 wt%Mn alloy that the primary spacing was about 25% smaller in 1 g than under microgravity. Steinbach [261] examined with PF the interaction between spacing selection and convection. Solidification of an Al-Cu alloy with the g-vector in the direction of growth resulted in an unstable upward flow and a smaller spacing, while an opposite g-vector tended to increase the spacing.
Secondary arm spacing
Much work has been undertaken to characterise secondary spacings. The use of serial sectioning [262] and of X-ray micro-tomography [263] has contributed to a better qualitative and quantitative picture. Changes of morphology (characterised by curvature), scale and volume fraction have been determined without any simplifying assumptions (see the detailed introduction in Mendoza et al. [264]). The latter authors, using the serial sectioning technique, found a complex pattern of the local mean interface curvature H = (κ1 + κ2)/2 of Al-15 wt%Cu dendrites (Figure 26(a)), where κ1 and κ2 are the two principal curvatures. Measurements of the probability density of principal curvatures allowed the conclusion that the interfaces were mostly of saddle-shape, and that local concave spherical regions of the solid (region 4 in Figure 26(b/c)) were more stable than the convex ones (region 1 in Figure 26(b/c)). A similar study with hexagonal Mg-Zn alloys has been published by Guo et al. [265]. The group of Voorhees et al. added useful insight into the corresponding phenomena through a series of detailed studies of interface evolution using serial sectioning [266,267], and X-ray micro-tomography [268]. It is interesting that even faceted crystals, such as primary Si in Al-29.9 wt%Si alloy, evolve, when expressed as surface/volume ratio, Sv, according to the well-known relationship which characterises non-faceted secondary arm coarsening Sv ∝ t-1/3 and due to twins do not tend towards their equilibrium Wulff shape [269]. Recently Philippe and Voorhees [270] developed also an Ostwald ripening model for non-ideal multicomponent alloys that takes into account off-diagonal terms in the diffusion tensor. It might be useful to mention also the paper by Ode et al. [271] who applied a PF model to coarsening in practically useful Fe and Al alloys. They showed that the exponent of the coarsening equation is independent of the solute diffusivity in the melt and of the interface energy, and increases in an approximately linear fashion with m/(1–k), where m is the liquidus slope and k the partition coefficient. In another PF study Li et al. [272] evaluated the effect of the initial size distribution of polydisperse particles on the transient ripening behaviour. Local curvatures of an Al(Cu) dendrite. (a) Mean curvature (red to light blue positive, dark-blue negative) in the tip region; (b) schematic view of local solid-liquid interface topology as a function of principle curvatures 

Limodin et al. [273] used in situ synchrotron X-ray microtomography at constant cooling rate to study the progress of solidification in the mushy columnar zone of Al–10 wt%Cu (Figure 27). Two different coarsening mechanisms, accompanied by growth, were found: remelting of small arms (as observed by Chen and Kattamis [274]) and coalescence of arms at high solid fraction as modelled by Mortensen [275]. In the follow-up, Terzi et al. [276] found in the same alloy another intermediate mechanism, which they called interdendritic groove advancement. Such a mechanism, typical for temperature gradient zone melting (TGZM), was already proposed by Allen and Hunt in 1976 [277]. X-ray microtomography images showing the evolution of dendrite morphology in Al-10%Cu during solidification at constant cooling rate as a function of time and temperature [273]. From left to right: 219s, 623°C; 384s, 615°C; 603s, 604°C; 1104s, 579°C.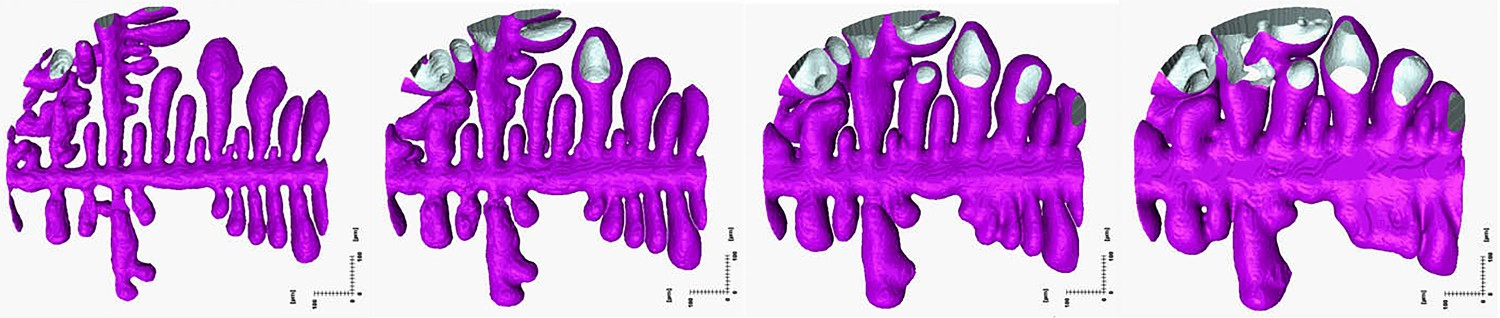
In in situ X-ray tomographic experiments on dendritic morphologies in an Al-24 wt%Cu alloy (using a time-interlaced model-based iterative reconstruction (TIMBIR) methodology), Gibbs et al. [278] made an interesting observation. The secondary arms of Al dendrites were not cylindrical (as in transparent organics), but rather platelike. (Flat secondary arms have also been observed in Al–Zn dendrites where the anisotropy of Zn influences their shape [279].) Often the tips of these arms split, which is not observed in organics. The authors found (at least for this highly concentrated Al–Cu alloy) [278]
a lack of self-similarity of the structure, no significant coarsening of the structure, power laws for the volume fraction transformed, surface area and surface area per volume that are different from those seen in transparent organic materials, and a markedly different side branch structure from that seen in transparent organic materials.
It would be interesting to study less concentrated alloys to see if these findings persist; this would shed new light on the usability of results on organic dendrites for the interpretation of metal dendrites. Details of the coarsening process of a hexagonal Mg–Sn alloy was observed with fast synchrotron X-ray microtomography by Shuai et al. [280].
Finally we mention the systematic measurements in Al-(3-24 wt%)Cu alloys by Gündüz and Cadirli [281] and in succinonitrile-3.6 wt% acetone alloy by Üstün et al. [282] both on primary and secondary spacings, on dendrite tip radii, and mushy zone depths in directional solidification experiments. As has been discussed above, the primary spacings are those for not-defined convective conditions and should therefore be used with care. The secondary spacing is decisive for the properties of castings. With this in mind, Ferreira et al. [283] proposed improved models for unsteady-state solidification and back diffusion of ternary Al–Cu–(Si;Mg) alloys.
Segregation and last stage solidification
As we have seen in the previous sections, many studies are concerned with dendrite tip growth and the morphology in the tip region. It is however as important to understand the last stage of solidification of alloys, i.e. the roots of directionally solidified (DS) dendrites or the grain boundaries in equiaxed solidification. In these regions, segregation products such as the enriched residual melt and the coarsened secondary arms interact. Feeding of liquid, especially in dilute alloys, becomes difficult and harmful defects (pores or hot-cracks) are often formed there. In more concentrated alloys with a substantial fraction of interdendritic eutectic, these problems are suppressed. Formation of precipitates/eutectics in the enriched last interdendritic liquid can either reinforce or deteriorate the mechanical properties of the materials. Knowledge of the microstructure of this last part of the solidification process involving segregation, coarsening and coalescence and its control is therefore fundamental for the quality of cast products.
Figure 28 shows the evolution in time of the morphology of columnar dendrites. Superimposed are three images of corresponding morphologies obtained by different modelling techniques. In Figure 28(a), coarsening of secondary arms, their coalescence and final drop formation in an organic model alloy can be observed [284]. 3D PF modelling of a directionally solidifying dendrite for fs < 0.8 by Neumann-Heyme et al. [285] is shown in Figure 28(b). The transformation of continuous interdendritic liquid channels into a continuous solid with isolated droplets has been calculated in 2D using PF by Geng et al. [286] (Figure 28(c)). The latter authors specifically examined the effect of back diffusion during last stage solidification. Morphology of interdendritic liquid in a single columnar grain behind the tip according to three models: (a) columnar dendrites in 2D DS of a succinonitrile-acetone alloy as a function of time (at dendrite tip t=0, fs=0) [284]; (b) 3D PF result of the morphology of an Al-6 wt%Cu dendrite for a solid fraction 0<fs< 0.8 [285]; (c) 2D PF morphology of interdendritic liquid channels in Al-4 wt%Mg close to coalescence (λ1=12.8 μm) [286].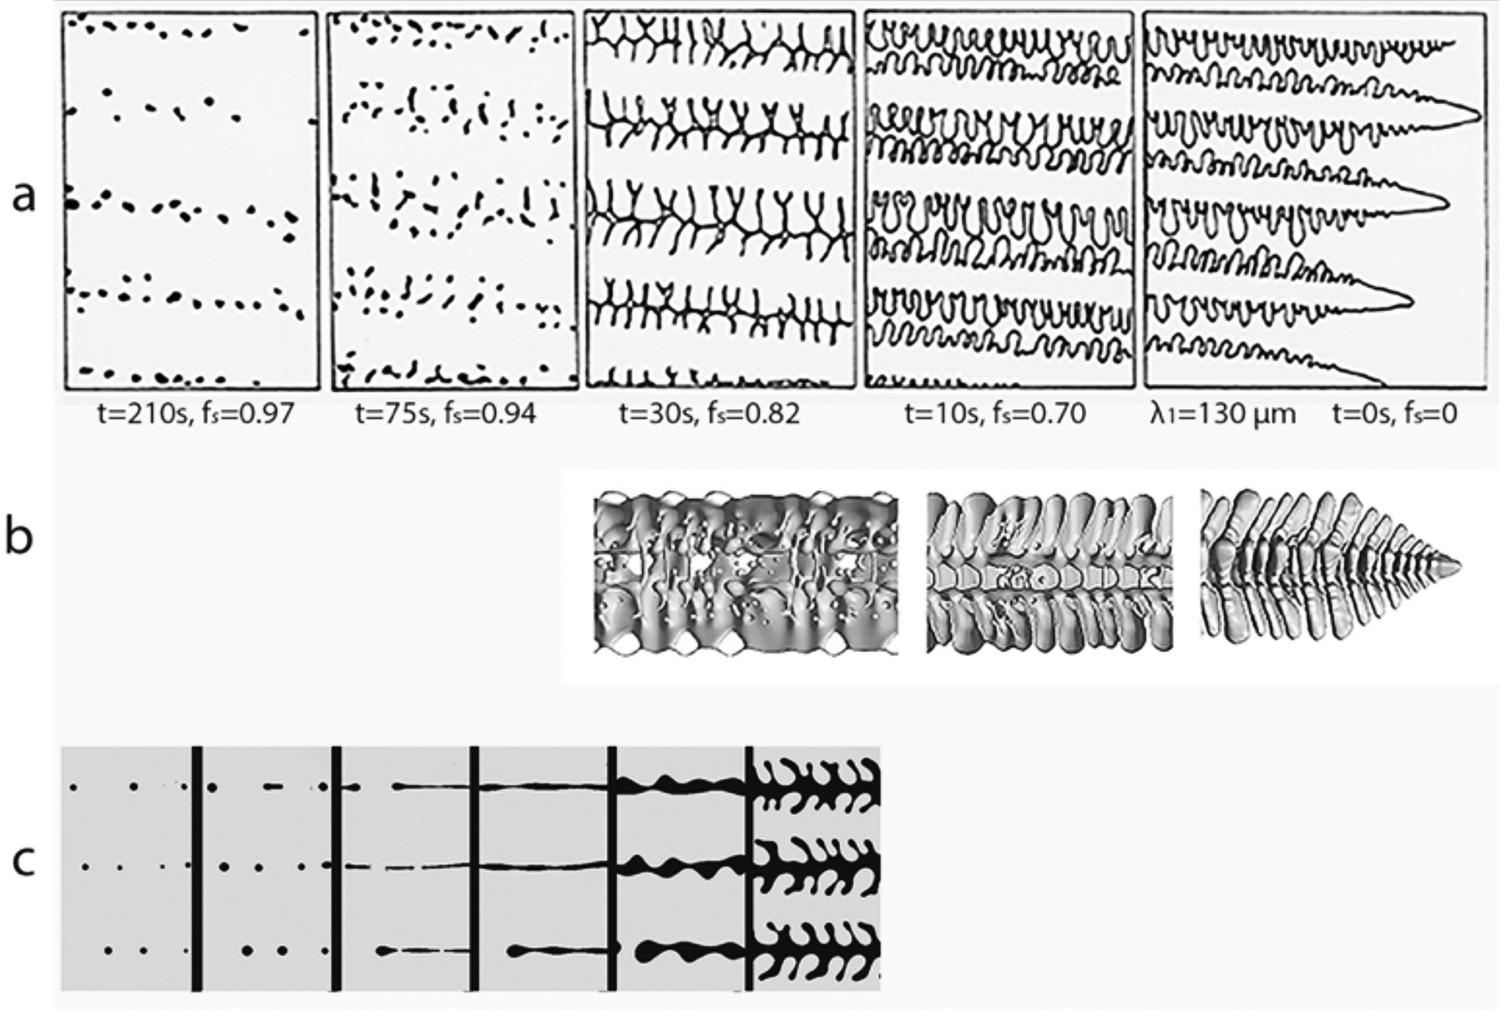
The specific area of the dendritic solid–liquid interface as a function of time and volume fraction solid was also evaluated and a general evolution equation described the effects of growth, coarsening and interface coalescence [285]. The evolution of the interdendritic region (mushy zone) depends, under others, on the change of composition with volume fraction of solid, called microsegregation. This phenomenon is accompanied by dendrite tip supersaturation, by secondary arm coarsening, solid state (back) diffusion, and for the case of columnar growth (under G > 0) by temperature gradient zone melting.
Microsegregation has been subject of research for many years producing various analytical microsegregation models. The early work by Gulliver and Scheil has been analysed and reviewed by Glicksman and Hills in 2001 [287]. Microsegregation models which take into account back diffusion, initially proposed by Brody-Flemings [288], and its improvements by later research have been reviewed by Kraft and Chang in 1997 [289], and Won and Thomas in 2001 [290]. The most realistic approximation at the end of the last century including coarsening has been developed by Voller and Beckermann [291]. Won and Thomas [290] proposed a simple model of microsegregation including the effect of coarsening and the δ/γ transformation of the peritectic. Shin et al. [292] developed another analytical model for back diffusion and coarsening and successfully applied it to the calculation of the eutectic fraction in Al–4.9 wt%Cu.
The analytical models for evaluating microsegregation are only approximations of the real processes. Numerical models allow more quantitative results and have been reviewed just before the turn of the century by Voller and Beckermann [291] and by Howe and Kirkwood [293]. A 2D pseudo-front tracking (PFT) method for the simulation of microstructure formation and microsegregation in multicomponent alloys has been presented by Du et al. [294,295]. The model has been coupled with thermodynamic data calculated by the phase equilibria software Thermo-Calc for the evolution of the type, amount and composition of the interdendritic phases. The influence of the primary phase morphology on microsegregation was discussed, as well as impingement, coupled and divorced eutectic growth, coalescence, coarsening and grain size. The PFT method has also been applied to microsegregation of an Al-4 wt%Cu alloy for cooling rates between 10−2 and 2 × 10⁴ K/s [296]. The fraction of eutectic calculated with the model agreed with the experimental measurements over the range of cooling rates studied.
Zhu et al. [297] reviewed progress in modelling of microsegregation in solidification of multicomponent alloys (phase field, front tracking, and cellular automaton techniques). A two-dimensional cellular automaton model that was coupled with phase diagram information was proposed for the simulation of microstructure and microsegregation of multicomponent alloys. Other examples of work on the simulation of multicomponent alloys is by Michelic et al. [298] using a modified virtual front tracking model for industrially interesting steels, and by Natsume et al. [299] who computed microsegregation and peritectic transformation for Fe–C–Mn–Si–P–Mo alloy.
Gandin et al. [300,301] modelled the free dendritic growth in a highly undercooled melt. The authors computed the temperature evolution, the segregation, and the eutectic volume fraction of a single grain corresponding to a droplet and compared them to their experimental results of three Al–Cu alloys. Their paper forms the basis for progress in understanding of the details of rapid solidification in droplet solidification. Tourret and Gandin [302] modelled the segregation of Ni–Al alloys that undergo different consecutive phase transformations such as dendrite growth, followed by two interdendritic peritectic transformations and one eutectic transformation. The model takes into account the growth kinetics of the different microstructures and diffusion in all phases. According to the authors computation with this model is efficient so that it can be used in practical applications.
Besides changes in composition due to segregation the morphology and size of the last liquid is important. Serial sectioning was used to characterise the morphological changes during coarsening of dendrites at high volume fraction of solid (Figure 29) [266], a region which is difficult to observe. Topological characteristics and the transitions of liquid morphologies, such as films, fibres and spheres were quantified. PF modelling with the observed morphology as initial condition allowed the follow-up of the evolution of the structure. Filaments formed from liquid walls, and drops developed through morphological instabilities of liquid channels. Such findings allow better modelling of the feeding of the residual liquid (important for pore formation) as well as of the mechanical behaviour of the solid–liquid two-phase structure. Morphologies of late stage solidification visualised by serial sectioning of a DS Al-15 wt%Cu dendritic sample after 90-min coarsening. (a) solid without liquid channels at fs = 0.74, (b) corresponding interdendritic liquid without the solid phase. Liquid walls, channels and filaments surrounding the central dendrite can be seen [266].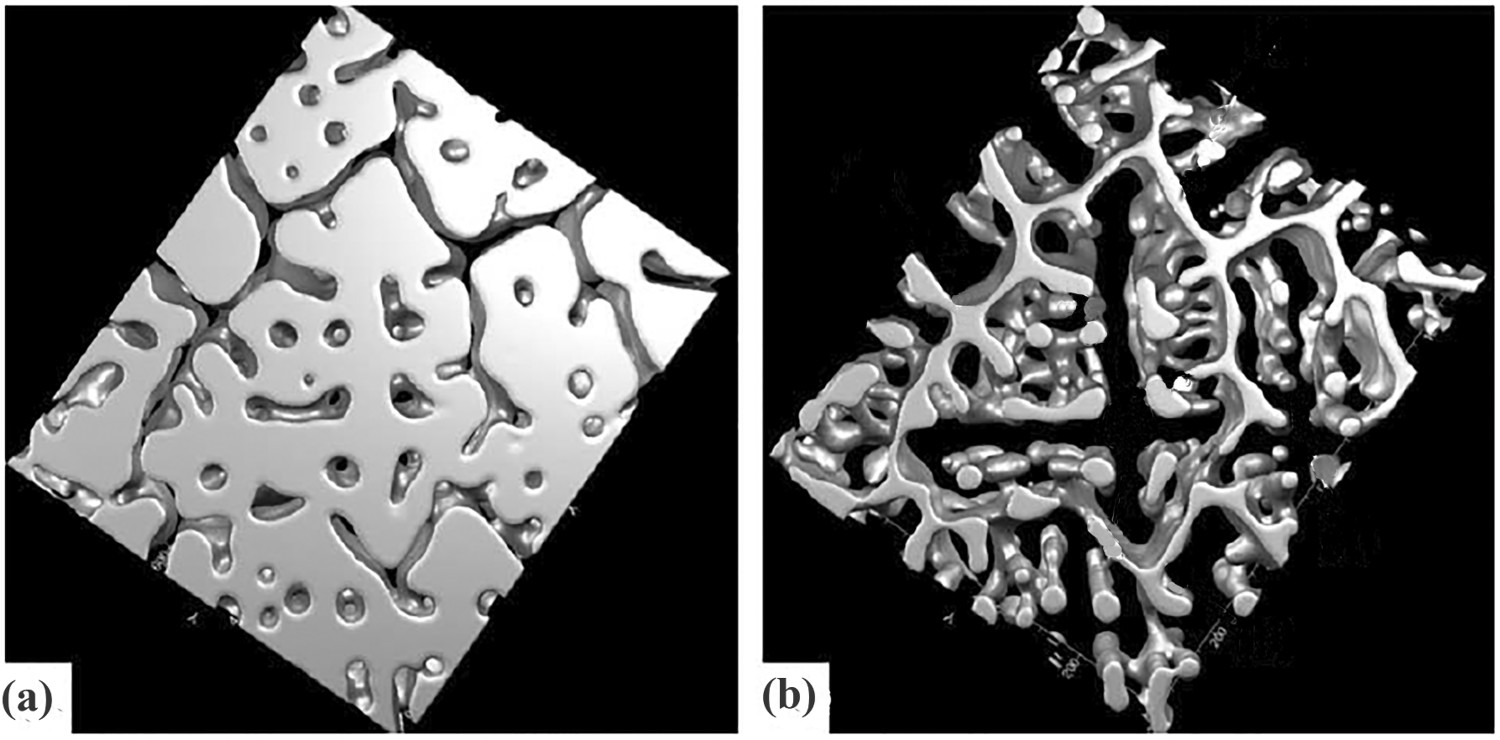
It should be pointed out that during interdendritic coalescence (not to be confused with secondary branch coarsening) the dendrites belonging to the same grain join without an energy barrier, since there is no grain boundary after merging into a single solid. Such boundaries are said to be ‘attractive’, since a surface energy (2γ) is removed from the system after coalescence [67]. In this case attraction and coalescence occurs as soon as the two diffuse solid–liquid interfaces interact and the liquid film becomes unstable and breaks up into droplets (Figure 28a,c). To be realistic, the corresponding PF calculations must therefore take into account the real thickness (a few nm) of the solid–liquid interface.
At a grain boundary, however, columnar or equiaxed grains are misoriented and the boundary has an excess energy, γgb, after complete solidification [303]. Rappaz et al. [67] analysed coalescence at grain boundaries using the concept of disjoining pressure from fluid dynamics and modeled the phenomenon with a PF technique developed by Tiaden et al. [304] and Nestler and Wheeler [305]. For pure substances as well as for alloys considering back-diffusion, it has been shown that the two solid–liquid interfaces remain attractive (and unstable) if γgb < 2γ (low angle boundaries). They are ‘neutral’ for γgb = 2γ and become ‘repulsive’ (and stable) if γgb > 2γ (high angle boundaries). In this last case, the liquid film at a repulsive grain boundary remains below the melting point of a pure substance or below the solidus of an alloy. Rappaz et al. introduced a coalescence undercooling, ΔTgb, given by [67]: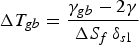
Coalescence at grain boundaries during solidification is the inverse of grain boundary pre-melting upon heating. As shown in several studies of pre-melting using phase-field crystal [306], molecular dynamics [307] and density functional theory [303], as well as in studies of coalescence and shearing of grain-boundaries [308], Equation (6) is too simple to capture all the phenomena occurring during melting at grain boundaries (and thus probably during coalescence upon solidification). For example, a symmetric tilt grain boundary in a pure substance exhibits qualitative differences during melting depending on the misorientation [306]. In the case of a grain boundary misorientation angle θc, above which the grain boundary is repulsive (high-angle boundary) a pre-melted layer increases logarithmically in width as the melting point is approached upon heating. For θ < θc, liquid pockets surrounding dislocations already exist below the melting point. The solid bridges in between can persist above the melting point as can be expected from an attractive boundary upon heating.
The effect of the misorientation of grain boundaries reflecting the transition between attractive to repulsive behaviour as the misorientation is increased above 13 deg. has been clearly demonstrated by the development of hot cracks in laser welding of Ni-based bicrystals [309] (Figure 30). Hot cracking and solid bridges established across a grain boundary have been observed in situ also in succinonitrile-acetone alloy by Farup et al. [310]. Hot crack length, L, in laser welding of superalloy bi-crystals with different grain boundary angles θ = 2α [309]. Inserts show microstructure and EBSD map; left for θ = 12 deg. (no crack) and right θ = 20 deg. (solidification crack).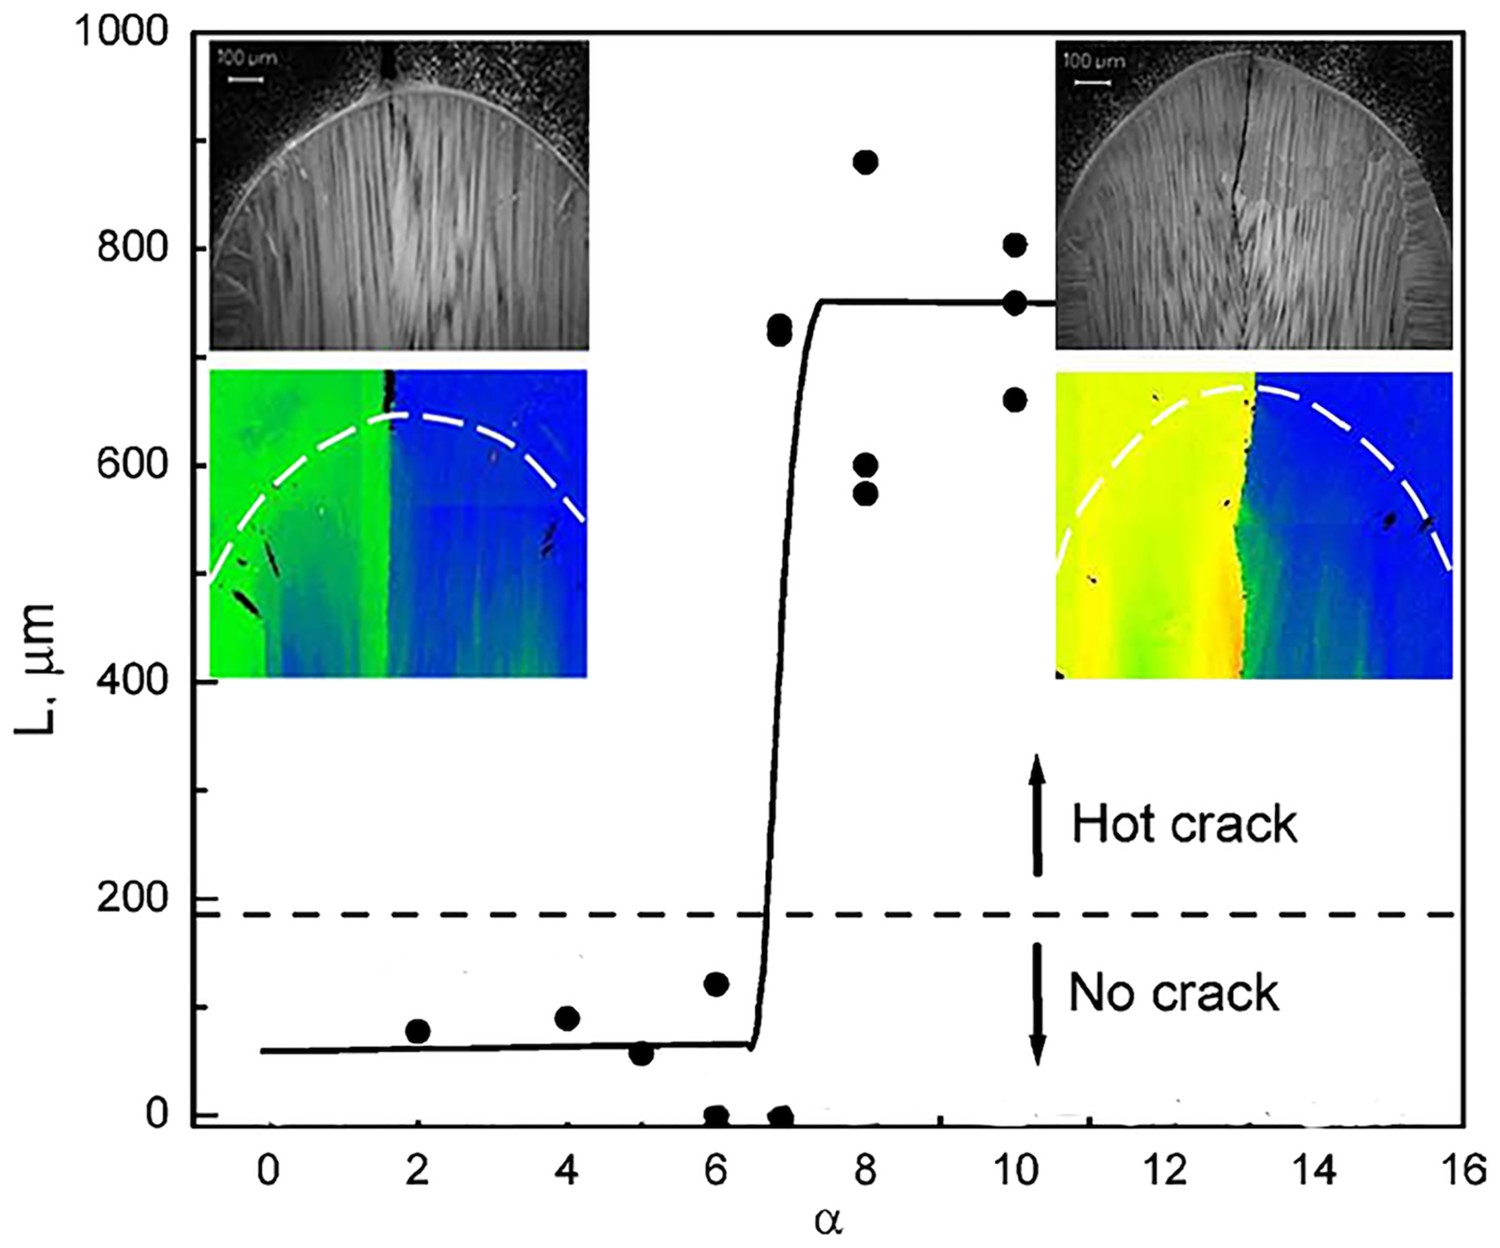
Montiel et al. [311] applied a 2D PF model to study the evolution of isothermal interdendritic channel size distribution of liquid pools during late-stage solidification of Mg–Al alloys as a function of cooling rates. Small channels between secondary branches of the primary phase and larger channels between grains were observed. These authors rightly state that the structure of liquid channels at the late stages of solidification essentially forms the template from which eutectic and intermetallic phases will be patterned. Boussinot and Apel [312] studied the influence of temperature gradient zone melting on the evolution of the last interdendritic liquid in directional solidification.
Based on Equation (6), Vernède et al. [313] developed a 2D granular solidification model for equiaxed grains originally proposed by Mathier et al. [314]. Assuming randomly-oriented globular grains, the model considers back-diffusion in the solid, complete mixing in the liquid and the disappearance of continuous liquid paths at the last stage of solidification. Figure 31 shows the gradual percolation of such equiaxed grains during solidification in a positive temperature gradient. The equiaxed globular grains have a random orientation and the last stage of solidification is governed by back diffusion in the solid and the grain boundary energy after complete solidification. Such simulations are important for the understanding and modelling of hot cracking [315], in particular for the assessment of the effect of grain size. Results of a 2D granular model [313] showing the evolution of the percolation of equiaxed globular grains during solidification of Al-1 wt%Cu. The microstructure evolves from (a) isolated grains in a continuous network of liquid channels to (d) percolated grains with isolated liquid films. Grain size = 130 μm.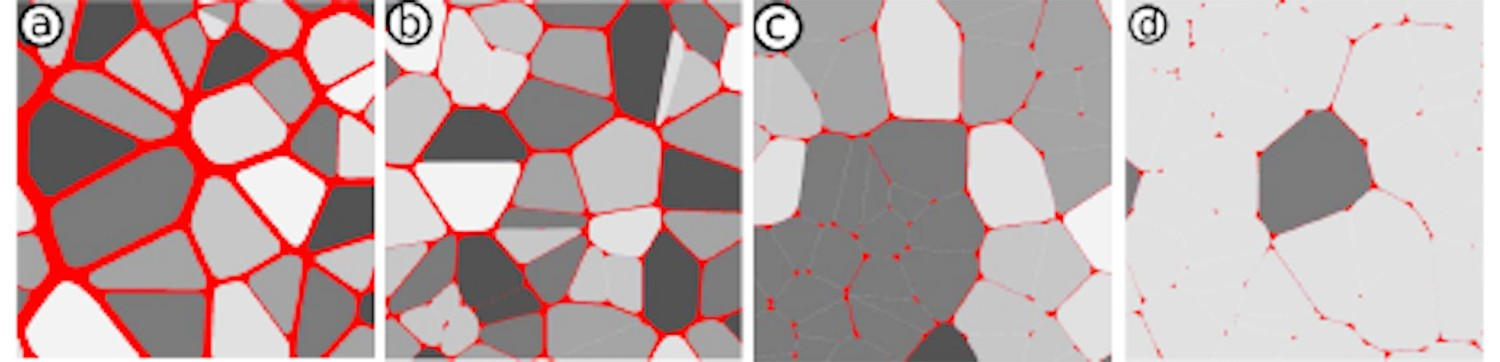
Based on PF modelling, Wang et al. [316] made an interesting observation: solute segregation at grain boundary channels depends not only on their misorientation angle, but also on the convergent/divergent nature of the boundary. Divergent grains show more extended liquid channels than convergent grains (Figure 32). In their analysis they combine the solid fraction-temperature relationship from PF simulations with hot cracking models such as RDG [317]. Evolution of liquid channels in columnar growth of an Al-2.0 wt%Cu alloy. Bicrystals with 30° misorientation angle: (a) convergent growth, (b) divergent growth [316].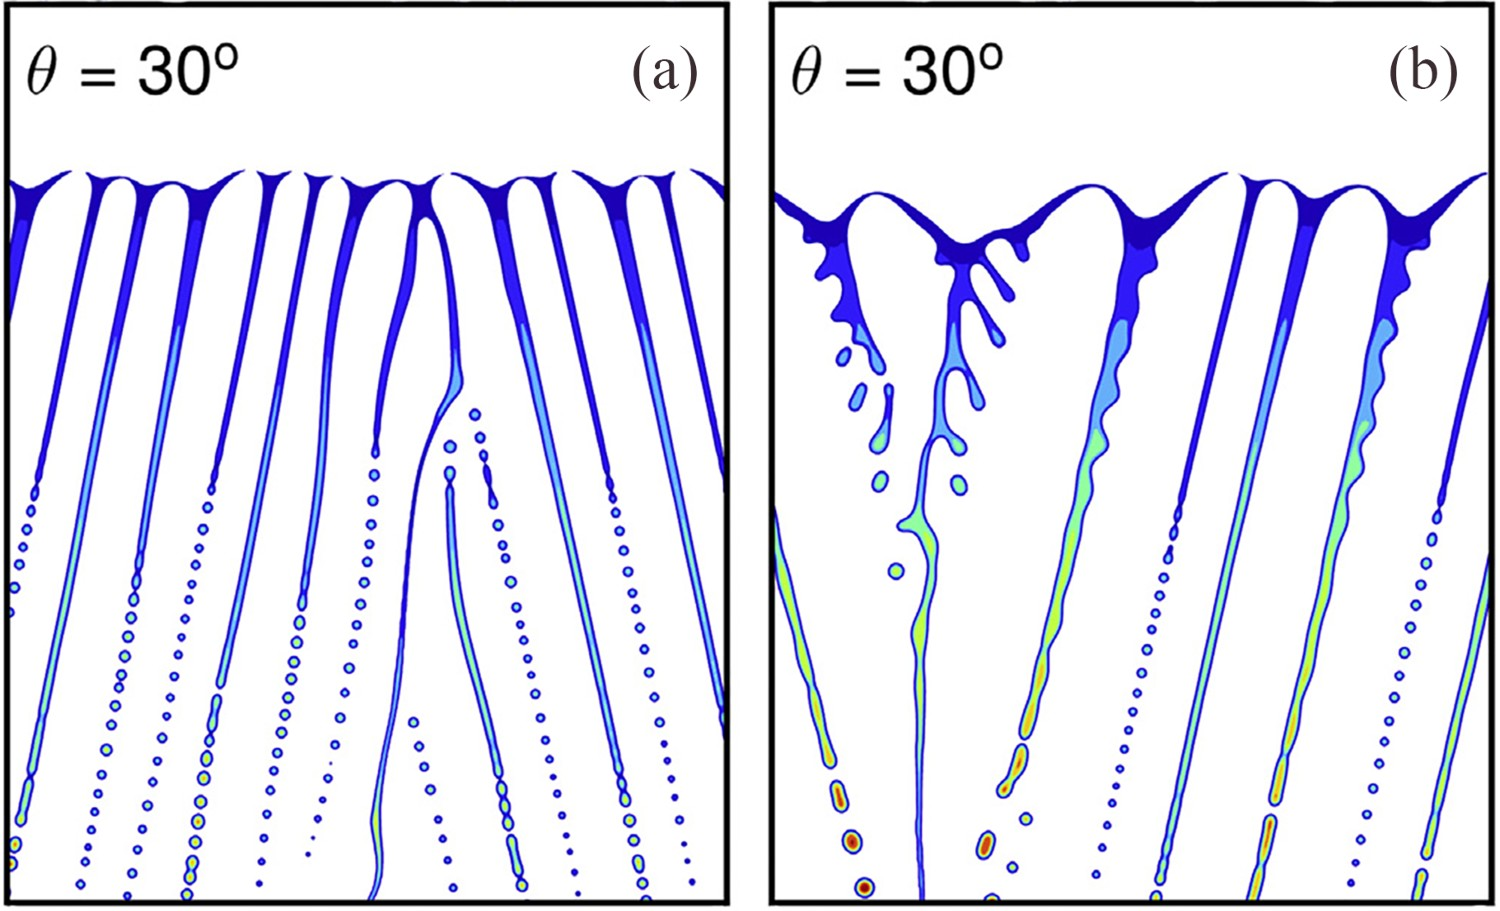
In the final interdendritic liquid brittle intermetallic phases often precipitate which impair the properties of as-solidified products. A powerful non-destructive method of imaging these phases is X-ray tomography. We mention here only a few publications which are representative for the field. High resolution X-ray computed tomography has been used by Kastner et al. [318] to analyse the morphologies of interdendritic precipitates in industrial Al casting alloys. Puncreobutr et al. [319] observed the development and morphology of such precipitates during solidification of Al–7.5Si–3.5Cu-0.6Fe (wt.%) alloy with synchrotron X-ray tomography. This technique has been applied also by Zhao et al. [320] for the study of harmful brittle precipitates in recycled Al alloys. Such observations can form the foundation of processing conditions that result in improved particle morphologies with less harmful effects on the mechanical properties. For more details on defect formation in solidification processing the reader is referred to reference [9].
On the other side, alloys such as Al-6 wt%Si with a large volume fraction of interdendritic eutectic are used for their excellent castability combined with good mechanical properties [321].
Grain competition
Solidification often starts at the inner surface of a mould or chill plate with numerous equiaxed grains from which columnar dendrites develop. The columnar grains compete with each other over a certain distance, and finally form a texture. The dendrite tip temperature varies with the angle between the grain and the growth direction. The lower tip temperature (higher undercooling) of the more rapidly growing misoriented grains has been traditionally used to decide about the elimination of grains [322]. In this way the grain selector in a single crystal casting is supposed to eliminate all but one grain with, for superalloys with cubic crystal structure, ⟨001⟩ trunk orientation [74,323].
The phenomenon has been analysed in more detail by several groups. For example, Wagner et al. [324] found in experiments that the suppression of secondary arms by the diffusion field of neighbouring dendrites stops dendrite overgrowth and might stabilise an unfavourably oriented grain. Zhou et al. [325] confirmed in experiments with bicrystals of superalloys that for grains with diverging trunk directions, the grain boundary is in-between the two orientations, thus favouring the expansion of the well-aligned ⟨001⟩ grain. However, for converging grains, the result does not necessarily follow the simple Walton-Chalmers rule [322]. Due to solute interactions between two converging nearest-neighbour dendrite tips, the misoriented grain might overgrow the well-aligned grain. Yu et al. [326] confirmed this last phenomenon by in situ observations with a succinonitrile–acetone alloy.
The grain competition was simulated with the PF approach in 2D by several authors. Li et al. [327] analysed the effect of solute field interaction of dendrites at a converging grain boundary in directional solidification. It was shown that the diffusion layers in front of the dendrites at grain boundaries were responsible for overgrowth of one grain by the other. Again, unfavourably oriented grains could overgrow in some cases the favourably oriented one. Also, the tip undercooling was shown to be not only a function of growth rate but also of the primary spacing, both depending on the angle of the dendrite trunk. The arm formation which is influenced by the diffusion fields at the tips also plays a role. Heat flow effect on the other side has been found to be negligible. The unusual overgrowth behaviour was reanalysed by Takaki et al. [328] in detailed 2D PF simulations of a directionally solidified Al-Cu alloy. It was found that below a critical angle between the converging grains overgrowth of unfavourably oriented grains took place while above the critical angle the favourably oriented grain took over. Tourret and Karma [99] undertook also a systematic 2D PF study of the competition of columnar dendritic grains in directional solidification, this time for a succinonitrile-acetone alloy (Figure 33). The influence of G and the orientation of neighbouring grains on the primary spacing and on the orientation of grain boundaries were shown. Again, it was found that the loss of misoriented grains was not simply related to the tip temperature difference and that under certain circumstances unfavourably oriented grains could persist. Another result of Tourret and Karma’s computer experiments was that the strength of microscopic thermal fluctuations in the tip area influenced the direction of grain boundaries, i.e. grain selection became a stochastic process. Competition of columnar grain growth in 2D PF simulation. (a) (b) elimination of grain boundary dendrites at a converging boundary; (c) (d) insertion of tertiary branches at a diverging grain boundary [99]. Domain width 2558 μm.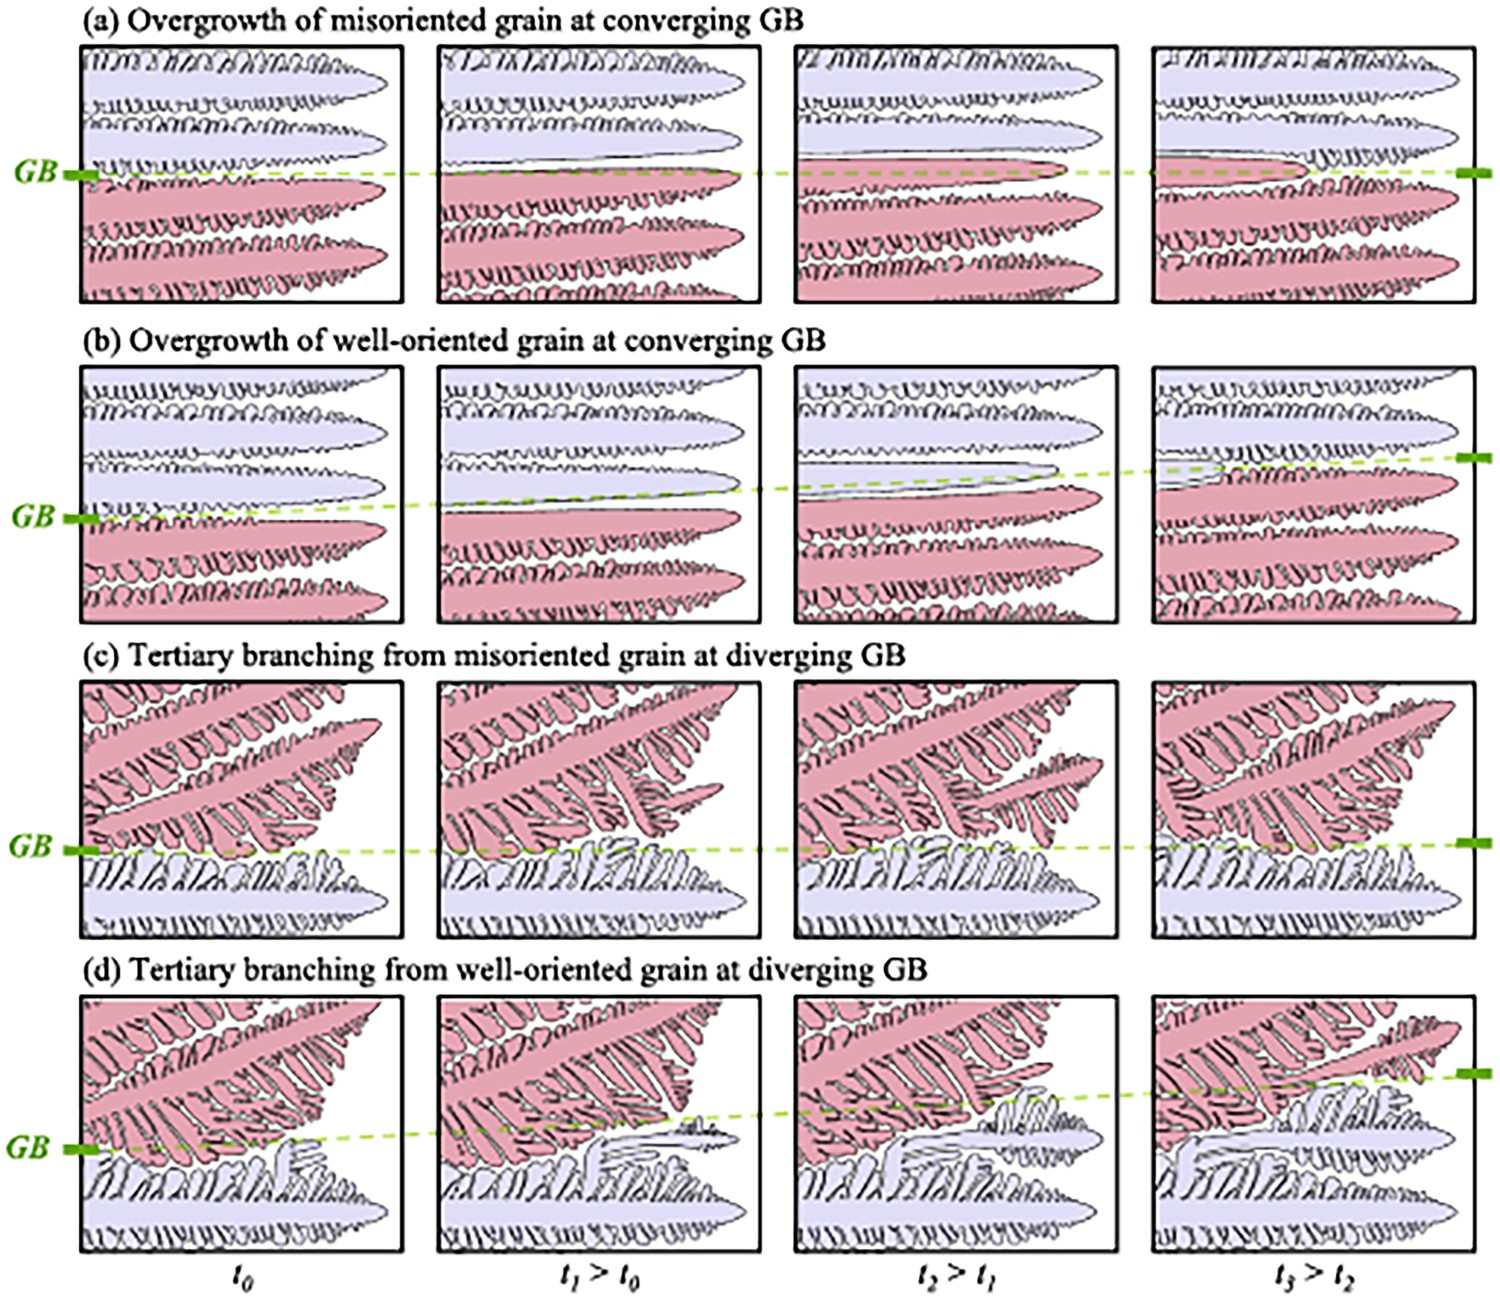
The results of 2D simulations do not completely represent reality, as the branching behaviour of 3D dendrites is different. A first 3D phase field simulation of multiple dendrite growth has been published by Eiken in 2010 [25] and in 2013 with a 2.4 PFLOPS supercomputer by Takaki et al. [329]. The latter authors also found that unusual growth, i.e. dendritic grains that were oriented off ⟨001⟩ would survive over quite long distances and sometimes overgrow the well-oriented grains. Tourret et al. [330] studied with PF the competition between columnar grains in 2D and in 3D for small sample thicknesses with a single row of dendrites. This allowed variation of grain orientation around the growth axis between the grains and its effect on the grain competition. The results are interesting but quite complex, the reason why we refer the reader to the original article for more details. Guo et al. [331] presented a 3D PF study of columnar grain competition due to secondary and tertiary branching behaviour in diverging grain boundaries with various crystallographic orientations. However, these authors did not consider a rotation of secondary branches.
With a larger number of columnar grains, Takaki et al. [332] could realistically simulate in 3D the evolution of columnar grain texture as a function of distance (Figure 34). They made the interesting observation that unusual growth is less probable in 3D than in 2D. Large-scale 3D PF simulation of directional growth of Al-3 wt%Cu after 8s, 26.8s, 133.9s (V = 100 μm/s, G = 100 K/mm). Case 2, see original paper for details [332]. Domain width 768 μm.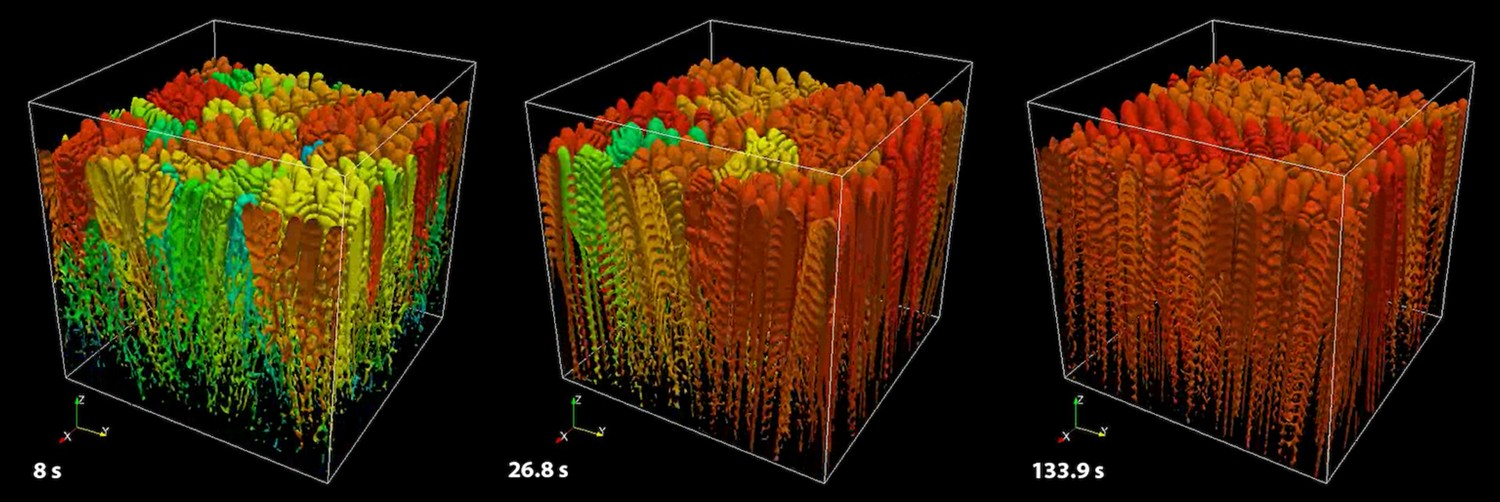
Pineau et al. [333] compared the potential of the Cellular Automaton (CA) technique for two-dimensional growth competition among columnar dendritic grains of succinonitrile – 0.4 wt% acetone alloy with the PF method. The computations with the CA method were much more efficient than with PF. Despite the simplifications of the CA method, in particular the approximation of solute field interactions between dendrite tips, it offered a realistic and useful alternative for simulation of structures in solidification processing. However, the CA technique has to be calibrated by the PF method for a more quantitative simulation of sidebranching competition. The DNN method [225] and the mesoscopic envelope model (MEM) [103] are also well suited to model interacting and competing phenomena such as the grain competition. This is work for the future.
Cellular growth
Cells are an intermediate structure between plane front and dendrites. At low velocity in directional growth this structure is stabilised by the constraint of the positive temperature gradient in the liquid. At higher velocity, close to absolute stability (a function of the solidification interval), cells are stabilised by the action of capillarity. In between these two cellular regimes, dendrites form in most alloys. Cells are generally characterised by branchless cylinders with rounded tips (also called fingers) that are relatively flat close to the limit of constitutional undercooling, VCU, they are elongated (deep cells, Figure 35(a) continuous curve) above VCU, and, at higher velocity, show a sharp (parabolic) tip when the conditions come close to the cell-dendrite transition. Low V cells have been analysed since the early 1950s, first by the group of Chalmers as has been presented in part I [1] of this historic overview. Cell morphology and growth in directional solidification. (a) Steady-state shapes of cells with blunt (finger F, continuous curve) and parabolic (needle N, interrupted curve) tips. (b) Microstructure map: regime I for fingers at low velocity, regime II coexistence of fingers (small spacings) and needles (large spacings) and merging of both domains into a single regime III with continuous change from F→N with increasing spacing [334].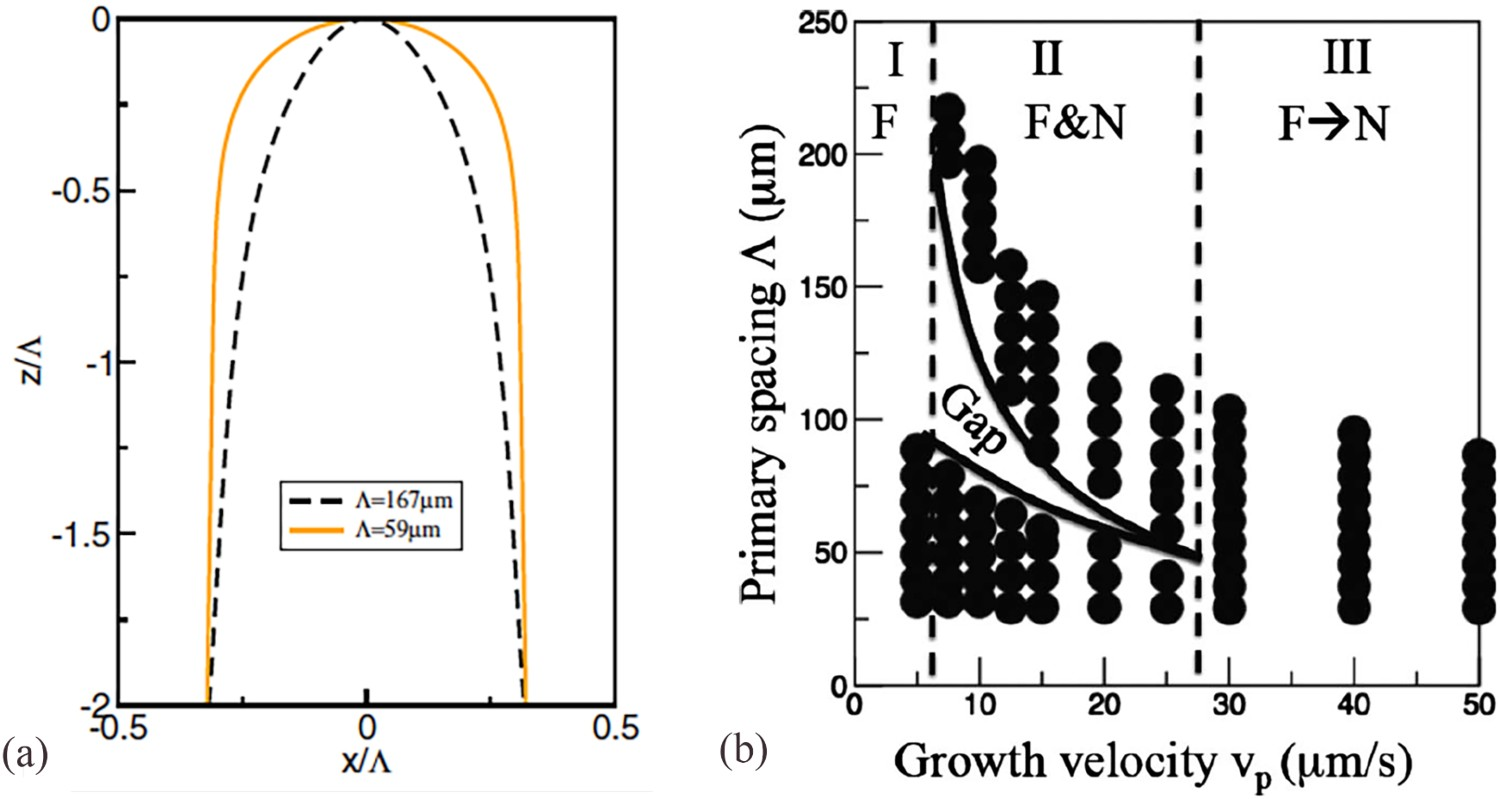
The transition from plane front growth to low amplitude cells close to constitutional undercooling has been modelled with 2D PF by Bi and Sekerka [335]. They obtained nearly sinusoidal cell shapes close to the limit of stability. Tip splitting and coarsening have also been observed. In an in-depth analysis of cell growth Gurevich et al. [334] established a microstructure map which distinguished between fingers (deep cells) and needles (with sharp parabolic tips) (Figure 35(b)). Three regimes were found; at low velocity fingers with rounded tips, as have been seen before by Echebarria et al. [65], at intermediate velocity a coexistence of both fingers and needles, and at high velocity the merging of both branches into a single one. A gap in steady-state solution is observed, which depends on anisotropy. The transition to regime III is moved to a lower velocity as the anisotropy is increased. The shape of the finger in regime I scales with spacing, and the ratio of spacing to tip radius is found to be constant. In fact, a range of local spacing exists in an array with varying cell shapes. However, all finger shapes are shown to collapse to a single shape when scaled with the local spacing.
PF modelling of cell growth in the whole V–λ range, from constitutional undercooling to absolute stability, has been performed by Takaki et al. [336]. These authors successfully compared the theoretical results with the prediction of Mullins–Sekerka theory for a given concentration and temperature gradient by varying the pulling velocity. Trivedi et al. [337] studied the cell-to-dendrite transition at low velocity directional solidification of succinonitrile–salol. It was found that the diffusion coupling between the neighbouring cells is at the origin of multiple solutions of the microstructure (cell shapes and scales) which play a key role in the cell-dendrite transition that is not sharp. Above a critical spacing the cell-to-dendrite transition is observed. It is given by the geometric mean of three lengths (thermal diffusion, solute diffusion, and capillary lengths) and is inversely proportional to composition. In experiments with succinonitrile–camphor Teng et al. [338] also studied the cell-to-dendrite transition. They measured the critical primary spacing and the corresponding critical range of transition rates (i.e. the onset of sidewise instability due to the variation of local spacings).
In situ observations of the spatio-temporal evolution of the interface shapes of a transparent model system under purely diffusional conditions were carried out in the International Space Station [339]. These experimental observations have been published later by Bergeon et al. [340] together with PF modelling. Besides steady-state growth, they observed the presence of a novel breathing mode of oscillations in 3D cellular pattern at low velocity. A group of cells exhibited locally coordinated oscillations of tip position, velocity and cross-sectional area with time. A magnified view of the hexagonal arrangement of cells is shown in Figure 36 [341]. Cells in SCN-camphor alloy directionally solidified in μg environement; (a) view of a basic arrangement of a cellular array grown at V = 1.0 μm/s, G = 19 K/cm. A locally hexagonal order is identified by the groups of cells (1,2,3), (4,5,6) and (7). (b) The cells in each group oscillate together and show a phase shift of 2π/3 [341].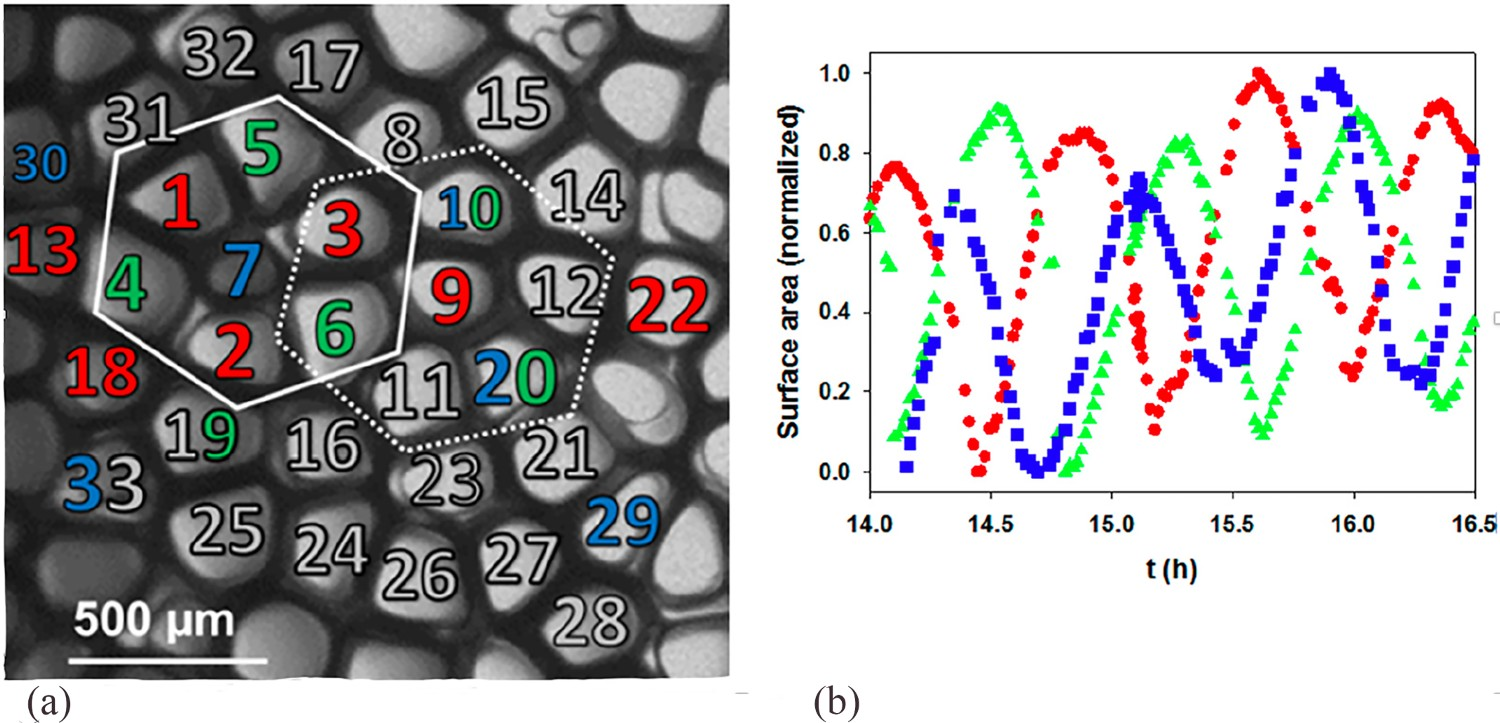
The effect of crystalline anisotropy on cellular array formation was examined by Ma and Plapp [342], who simulated with 3D PF the dynamics of cellular fronts as a function of the crystal anisotropy and found tip splitting and cell overgrowth at small anisotropy and stable arrays at high values of crystal anisotropy. Figure 37 shows a quasi-steady state morphology of a slowly changing distribution of cells and the evolution of fraction solid and morphology with distance. 3D phase-field simulation of a cellular array. (a) solid-liquid interface. (b) Transverse sections of the array (a) showing the evolution of solid as a function of distance [342].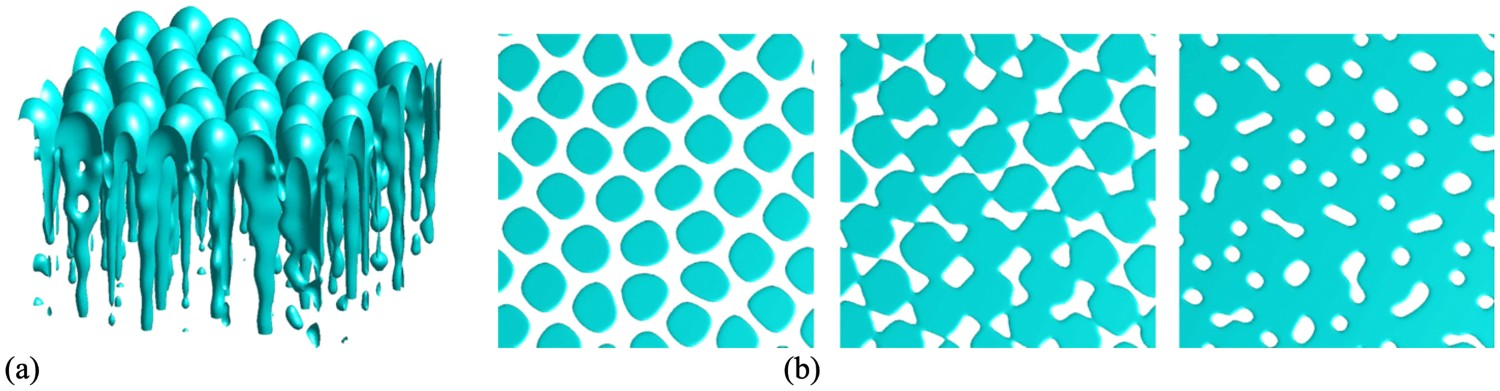
In recent research, Song et al. [257] investigated the dynamics of tilted array patterns that form during directional solidification. In in situ experiments and PF simulations in thin samples they observed tertiary branching at the diverging edge of the sample that acts as a source of new cells and create a uniform spacing. Models which have been developed are in good agreement with phase-field simulations and experiments. A detailed overview of in situ observations of solidification structures with details of cell growth can be found in Akamatsu and Nguyen-Thi [343].
Experimental values of cellular spacings have been published by several authors. Rex et al. [344] studied primary cell spacings close to the planar-cellular transition in directional growth of a dilute succinonitrile-acetone alloy. The experiments were performed under purely diffusive growth conditions and the interface morphology was observed in top-view. Both the primary spacing as well as the number of neighbours of each individual cell vary over a substantial range. Cai et al. presented 4D synchrotron tomographic imaging of the transition in morphology from initial cellular to dendritic growth in directional solidification [194]. Spacings under steady state directional solidification on earth (presence of flow) for Al-Ti have been obtained by Gündüz et al. [345]. Spacings under non-steady state conditions of directional castings have been presented by the group of Garcia [346–348].
Outlook
The representative volume for microstructure simulation within a weld or a small casting is between 1 and 1000 mm3, while the secondary dendrite arm spacing and the dendrite tip radius are typically in the range of 1–100 μm and 0.1–10 μm, respectively. To be resolved at such scales, even with an artificially increased diffuse solid–liquid interface, PF simulations of the microstructure forming in such a volume thus require 1010–1013 nodal points. First 3D PF simulations with typically 40003 nodes have been made, thanks to massive parallel computations performed on multiple GPUs of PFlops computers. It is however still necessary to make strong assumptions, e.g. use of binary alloys, no liquid movement, no grain displacement, etc. Based on such considerations, it is fairly evident that the simulation of a large number of dendrites and grains in 3D for multi-component alloys with fluid flow and grain motion requires the use of approximate methods; for example, the mesoscopic envelope model (MEM), or cellular automata-finite element (CAFE) models that integrate analytical models to accelerate computations. On each scale one can take advantage of the information gained from another simulation performed with a refined model.
Keeping in mind that solidification is a multiscale, multi-physics, multicomponent problem in 4D (space and time) the critical questions are then: (i) which model to use for which scale; (ii) how to pass the information from one scale to another, which could be called ‘chaining’, or alternatively (iii) when ‘coupling’ of phenomena occurring at different scales is needed in order to give the ‘right’ answers, which are the best approximations to solve the problem. Let us take one example to clarify this difference between chaining and coupling of various models. In a Bridgman experiment, the velocity of the isotherms can be assumed to be equal (and opposite) to the pulling velocity of the specimen under steady state conditions. Knowing the (assumed fixed) thermal gradient, columnar dendrite growth of an alloy can be calculated using these values, e.g. by a PF models which only considers solute diffusion and capillarity. The PF model in this case is ‘chained’ to the thermal field. Consider now a transient situation from an initially flat solid–liquid interface, to cells and dendrites. This unsteady situation requires a ‘coupling’ between a transient heat balance (with appropriate boundary conditions) and the PF model: the actual velocity of the solid–liquid front is unknown, the thermal field influences the growth of the microstructure, and the associated latent heat release associated with the growth of the microstructure modifies the heat balance under such unsteady conditions. As an example, the CAFE model can be used in both modes, i.e. chained or fully coupled.
The important last stage of solidification, in particular coalescence of two solid–liquid interfaces between dendrites and grains, is another challenge for two reasons: first, it occurs at the scale of the actual thickness of the solid–liquid interface (of a few atomic diameters) and second, the grain boundary energy which is a function of composition, temperature and orientation (5 angular parameters) is poorly known. Finally, the formation of defects such as porosity, precipitation of secondary phases, of eutectics or peritectics, and deformation and hot tearing in real alloys are other important topics which, due to space limitations, had to be neglected in this review.
On the experimental side, the extensive use of 4D X-ray imaging techniques has produced new insight into the complex phenomena of growth, coarsening, dendrite fragmentation, columnar-to-equiaxed transition, and defect formation. Thanks to dedicated synchrotron beam lines and to faster and more sensitive cameras, such observations will continue to provide very useful information to model microstructure formation. The influence of the ‘mould’ in such observations should however be kept in mind, since the experiments are restrained to a limited volume (typically less than 0.5 mm thickness for radiography and 1 mm diameter for tomography).
In the following, we draw a list of topics for future research directions at various scales and accounting for multiple phenomena.
Solid–liquid interfaces
Solid–liquid interface properties in real systems are highly needed for performing realistic PF simulations and thus Direct measurements of equilibrium shapes of solid in liquid (or liquid droplets in solid), giving access to γ-plot and anisotropy of interface energy. Atomistic simulations based on realistic interatomic potentials and appropriate methods for metals (e.g. embedded atom). Correlations between the nature of the structural order in undercooled melts, e.g. ISRO, and attachment kinetics. Account of higher-order terms in the solid–liquid interface anisotropy expansion of cubic and hexagonal systems which can influence orientation selection. Large scale MD simulations that characterise the departure from chemical equilibrium at the interface (function of orientation) in order to incorporate this knowledge into PF simulations. The combination of DFT (density functional theory) with artificial intelligence which could allow in the future ab initio computations of solidification structures.
Phase equilibria and diffusion
Multiscale modelling of multicomponent systems (3–10 elements) for technical alloys, superalloys, high-entropy alloys has to be linked with thermodynamic data bases. Faster computational algorithms and improved thermodynamical models for the access and the calculation of multicomponent phase equilibria. Application of inverse methods using experimental microstructure selection maps to improve phase diagrams. Measurement of diffusion coefficients in the liquid, e.g. from quenched steady-state solute profiles in directional planar-front solidification. Application of inverse methods based on dendrite growth kinetics to deduce diffusion coefficients. Analysis of the effect of concentration dependent and off-diagonal diffusion terms on diffusional transformation kinetics in multicomponent systems.
Dendrite tip
While fundamental understanding of dendrite tip growth has been gained before 2000, there is still a need to further investigate this field in the light of more recent discoveries. Influence of trace elements on dendrite growth directions and kinetics via an attachment kinetic contribution associated with atomic ordering in the liquid. Influence of solute elements on dendrite growth directions and kinetics via a modification of the solid–liquid interfacial energy and its anisotropy. Formation of specific dendrite morphologies such as twinned dendrites in aluminium alloys, ‘edgy’ dendrites in zinc alloys, dendrites with two different principal curvature radii, facetted dendrites. Solute trapping under additive manufacturing conditions, in particular when diffusion is slowed down by partial ordering of atoms in the liquid.
End of solidification
The final stages of dendritic solidification (0.9 < fs < 1) need to be further studied in dilute and more concentrated alloys as they largely control the final properties of the components. X-ray tomography investigations and PF simulations of mushy zone morphology at high fs. Microsegregation near dendrite roots and grain boundaries. Morphological stability of residual interdendritic liquid pockets (films and fibres developing into spheres) in dilute alloys. 3D modelling of percolation of grains in the mushy zone under realistic conditions for dilute alloys. Modification of the morphology of interdendritic precipitates and eutectic in more concentrated alloys (facetted growth and defect mechanisms). Defect control (morphology/size/distribution of porosity and cracks). Macro/micro stress–strain effects at grain boundaries. Quantitative evaluation of the mechanical properties of the mushy zone, especially at high volume fractions of solid. 3D models that encompasses solidification, coalescence, feeding and deformation in the mushy zone.
Fluid flow effects and grain movement
Melt flow is omnipresent in solidification processing, due to solidification shrinkage, thermal- or solutal natural convection or forced convection (e.g. in twin roll or squeeze casting). It interferes with the growing structure, a structure that modifies the flow. Moving/settling grains in a stagnant liquid also feel an apparent flow. Natural and forced flow phenomena act differently on the processes. Influence of flow on dendrite growth kinetics with various orientations. Influence of flow on primary dendrite spacing. 3D PF modelling coupled with LB (lattice Boltzmann) flow simulations for stationary and moving grains. Sedimentation (or floatation) of equiaxed grains in a quiescent liquid. Flow along/across the mushy zone. Flow instabilities in directional solidification. Multiscale multicomponent modelling of real alloys with various types of convection (natural, forced, Marangoni, shrinkage flow, etc.), including sedimentation of grains and transport of solute (macrosegregation). X-ray imaging of flow phenomena.
Fragmentation and remelting
Mechanisms of fragmentation are not well understood but are strongly linked with rapidly changing thermal conditions (e.g. recalescence, reheating) and/or convection. They are, however, fundamental for a realistic microstructure simulation as fragmentation is a source of new equiaxed grains. Simulation and in situ observations of fragmentation process under various flow conditions, e.g. induced by natural or forced convection. Simulation and in situ observations of fragmentation process during rapidly changing thermal conditions. Fundamental study of melting in alloys, which usually occurs under non-equilibrium conditions. Transport of fragments and their melting/solidification behaviour in the presence of fluid flow.
Grain structures
Grain structures are very important for many as-cast products and are the result of a competition between nucleation (at mould surfaces or within the bulk of the liquid) and growth. Fundamental study of heterogeneous nucleation induced by partial ordering in the liquid or by intentionally added inoculant particles. For columnar structures, study of texture development and grain competition at grain boundaries. For equiaxed morphologies, analysis and modelling of globular and dendritic grains and their transitions. Study of the transport of inoculant particles and equiaxed grains by convection. Columnar-to-equiaxed transition, equiaxed growth in the boundary layer of columnar dendrites in the presence of fragmentation and study of the outer equiaxed-to-columnar transition. Influence of the grain structure on the flow in the mushy zone. Study of the influence of equiaxed grain transport on macrosegregation.
Phase and microstructure competition
Microstructure- and phase-selection under changing solidification conditions is not well understood. These phenomena are typically unsteady and therefore more difficult to model. Transient growth of dendrites emerging from the eutectic interface at the limit of the coupled zone. Phase competition of stable and metastable phases, growth of intermetallics. Application of solidification models to solid state transformations (diffusional, diffusion-less). Final microstructure–property relationship. Modelling of rapid solidification under conditions of additive manufacturing. Imaging of phase and microstructure competition.
Processing and multiscale modelling
Integration of microstructure theory and modelling into actual casting and welding processes is a key to predicting properties and defects of components. The grain structure, which can experience settling, is also key in predicting macro- and meso-segregation such as freckles. As stated at the beginning of this section, this can only be done via the use of multiscale modelling for which each scale (diffuse solid–liquid interface, dendrites, grains, component) is approached with the appropriate technique, while passing the necessary information from one to the other. Improvement of existing models such as CAFE, MEM, DNN, validation for smaller volume elements with PF simulations and comparison between the various approaches. Development of new, and improvement of multiscale models for 3D simulations with flow, in particular coupling of CA-type approaches and LB method. Application of multiscale models to processes such as additive manufacturing, welding and advanced casting processes, and comparison with actual instrumented experiments. Prediction of meso- and macro-segregation in castings. Studies of the possibilities for improving processing by modifying the interaction between flow and microstructures, solidification under intense melt shear. Development of the multiscale phase-field crystal (PFC) approach that allows the treatment of complex phenomena where the crystal structure and defects are important (twinned dendrites, grain coalescence).
Conclusion
Since its beginning the science of solidification has made great progress, essentially in the last century, as reviewed in [1]. The years 2000–2018 covered in this overview have seen a rapidly increasing number of contributions in this field, which could not all be referenced in the present review. We apologise to those who are not mentioned here. Thanks to the advent of increasingly more powerful computers with PFlops performances and to the use and optimisation of models (MD, PF, CA, LB, etc) adapted to various scales, the solidification knowledge has been deepened. The limitations of 2D results have been realised leading to more 3D modelling. In parallel to the development of models, carefully controlled experiments and new observations and analytical tools have greatly contributed to our understanding of solidification phenomena. Among the latter, in situ X-ray imaging (radiography, tomography, topography) and fast EBSD orientation imaging are the most useful tools now available to solidification scientists.
Solidification models are important for the optimisation and control of processes, microstructures and defects. They allow to capitalise the knowledge gained over the years, based on comparison with experiments, rather than reveal completely new phenomena or microstructures. Nevertheless, experiments, sometimes validated by computations, have revealed a few unexpected behaviours. For example: (i) Competition of columnar grains is not as simple as initially predicted by Walton and Chalmers and solutal interaction at dendrite tips must be accounted for; (ii) Solute elements, either non-metallic or with a crystallography different from the solvent, can change the ‘standard’ growth directions of dendrites; (iii) ISRO in the liquid conjectured by Frank in the 50’s appears to influence both nucleation and growth of fcc grains. This last example is probably quite important and needs much further investigations: liquid might not be as disordered as we think and this can influence the formation of the solid, as beautifully revealed by the formation of quasicrystals!
Footnotes
1
If the temperature is assumed to be known, e.g., isothermal problem, the microstructure is then governed by solute diffusion and capillarity. But the temperature can also be part of the problem if the microstructure is governed by both thermal and solute diffusion.
2
In 2D, the first-order term of a cubic crystal involves cos(4θ), while the second-order term involves cos(8θ). In 3D, the first-order term involves (nx4+ny4+nz4), where (nx, ny, nz) are the components of the unit normal, function of (θ,ϕ), while the second-order term involves nx2ny2nz2.
Acknowledgements
The authors are grateful to Efim Brener, David Browne, Jonathan Dantzig, Alain Karma, and Ingo Steinbach for helpful discussions. Our thanks go also to Di Cui for his cooperation with the figures and references.
Disclosure statement
No potential conflict of interest was reported by the authors.