
Abstract
Violence by patients is a known hazard for New Zealand general practitioners, 1 nurses, 2 doctors in training, 3 psychiatrists, 4 and medical students. 5 A recent study of healthcare workers in inpatient psychiatric units found that 11.8% of all adverse incidents were verbal threats, and another 3.8% were verbal threats to harm. 6 Although only a minority of staff report these events to management, a small number of healthcare workers report ongoing distress as a consequence of an incident or incidents 1 , 4 and team leaders in mental health services are aware of the risk of patient aggression to their staff. 7
In the last decade, much of the continuing care of persons with disabilities of all types has not been provided directly by hospital or health organizations, but instead contracted 8 with non-governmental organizations (NGOs). To our knowledge, there has been no investigation of the risk of aggression to support workers from the clients and families they interact with, or their training in communications skills or aggression management. As support workers move into the home of the disabled as a fundamental part of their work, risk may be higher.
In the community, many preventive measures, such as alarm systems or crisis management teams, are not available. However, the interpersonal style of practitioners may be a factor modifying the risk to support workers. In a previous survey of medical students, questions on communication skills were incorporated, and an association between a hurried, non confident and anxious communication style and increased risk of assault was found. 5
The objective of the present research was to examine the experience of violence in non-governmental healthcare workers.
METHODS
Population
We had the support of two Dunedin-based services that provided support services to persons with disabilities in the three most southern regions in New Zealand. The data used were obtained from an anonymous survey of these community support workers. The services employed 689 full-time and part-time support workers. The surveys were sent out with the employees’ payslips; at the time the survey was conducted, 597 were receiving payslips. The sample of 597 support workers received the survey up to three times. The participants were working with clients who had identified disabilities related to old age, intellectual ability, medical conditions, trauma, and mental illnesses.
Instrument
The survey consisted of four parts. First, we modified the perception of patient-initiated aggression tool (POPAS) for use in New Zealand 9 by adding two of the more distressing events from previous surveys (stalking and complaint) and modifying the language for the New Zealand reader (instrument available from the authors on request). This instrument measures the practitioner's estimation of the rate of events on an ordinal scale (from ‘never’ to ‘very often’). It was initially used within psychiatric wards. 10 Participants were initially asked to rate the frequency with which they considered their clients had been verbally aggressive, threatening, humiliating, physically aggressive, destructive, had attempted to attack, had hit, injured, sexually harassed, sexually assaulted, stalked or been harassed by means of formal complaint.
Second, we measured the distress the participant had experienced using the Impact of Events Scale, Revised, 11 a 22-item scale that measures the response to trauma in the previous week. In a community sample of Vietnam veterans, 12 a score over 33 on the IES-R had 91% sensitivity, 82% specificity, and a positive predictive value of 0.91 for detecting clinical posttraumatic stress disorder (PTSD) (defined as a score over 50 on the PTSD Checklist).
The third component consisted of 28 communication-style questions that were developed from Hannah's post conversation Social Impressions Questionnaire 13 used in a pilot survey of medical students. 5 In that survey, seven communication questions were associated with aggression. The themes of these questions included a sense of impatience, being hurried and irritable, patient blaming and a sense of entitlement to the patient's time. An exploratory factor analysis on that data guided the authors in reducing the number of questions to 28 for this survey.
The final part of the instrument asked the participant's age, gender, ethnicity, qualifications, training in managing aggression or in self defence, types of support within their service, hours of work, types of disabilities their clients had, and their experience of the key worker.
Procedure
Ethical approval was obtained from the Southern Region Health Ethics Committee. After negotiation with each employer and caregiver representatives, we obtained from each organization a list of employees, but for reasons related to employee privacy we were only able to attach the survey to their payslip (and not mail separately). We used research numbers on the return envelopes to remove respondents from the next mail-out. We used three mail outs with one organization; the other organization permitted two.
Statistical analysis
The frequencies for the 12 violence and 28 communication items were tabulated and Cronbach's alpha estimated to assess the reliability of these scales. The components of the instruments were dropped in a stepwise manner to maximize internal reliability. An exploratory factor analysis was performed using polychloric correlations, and the factors described. Exploratory factor analyses failed to find a sensible factor structure beyond a one factor solution for violence and a two factor solution for communication. The questions for these factors (12 for violence, 12 for communication scale one, and seven for communication scale two) were summed. We used multivariate linear regression to estimate the effect of demographic and communication factors on the violence scale. All analyses were undertaken in Stata 10.1 14 and p < 0.05 was considered statistically significant.
RESULTS
Response rate
We received 264 responses (a 40.5% response rate). We were able to compare gender for responders and non-responders, and found no difference (χ2 = 0, p = 0.995).
Population
Sixteen participants did not give demographic details. Most support workers were female (208 (83.9%) and 40 (16.1%) male). Most of the caregivers were born in New Zealand (87.4%), and of NZ European/Pakeha ethnicity (80.4%). A smaller number of participants were Maori (7.3%), English (7.3%), Scottish (3.8%) or Irish (3.4%). All other ethnic groups contributed less than 1% to the total. Most caregivers were older; 181 (71.0%) of those who responded to the question were over 45 years.
Qualifications and training
The minority of support workers had a qualification appropriate for health or disability support work (87/236, 35.9%); 44% of the sample indicated that they had no qualification. About half of all caregivers had received some training around violence; 140/251 (55.8%) had received training in aggression management, such as break-away techniques and de-escalation and 113/249 (45.3%) had been trained in self defence. Most (226/242, 93.4%) support workers stated that there was a policy of debriefing in their workplaces.
Types of disability
Two hundred and forty-five participants gave information about their type of work. Of these, 17 worked with the physically disabled, 13 with medically disabled, 52 with intellectually disabled, 96 with disabilities of old age, and 66 with mental health disability. Most men worked in intellectual disability: 18 of 40 men (45%), compared with 33 of 208 women (15.8%) and in mental health (15/40, 38% male, 50/208, 24% female). There were two men working with older persons with disabilities (compared with 88 women) and two men working in young persons and medical (compared with 36 women). The difference by work type was significant (χ2 = 54.0, p < 0.001).
Although primary disorders were noted, most caregivers considered that their clients had multiple disabilities. Of note is a very high perceived comorbidity of intellectual disability and mental health disability (62.2% and 58.2%). Those with old age as primary disability in most cases also had a physical disability (64.7%) and/or a chronic medical condition (53.8%).
Aggression as measured by the POPAS-NZ
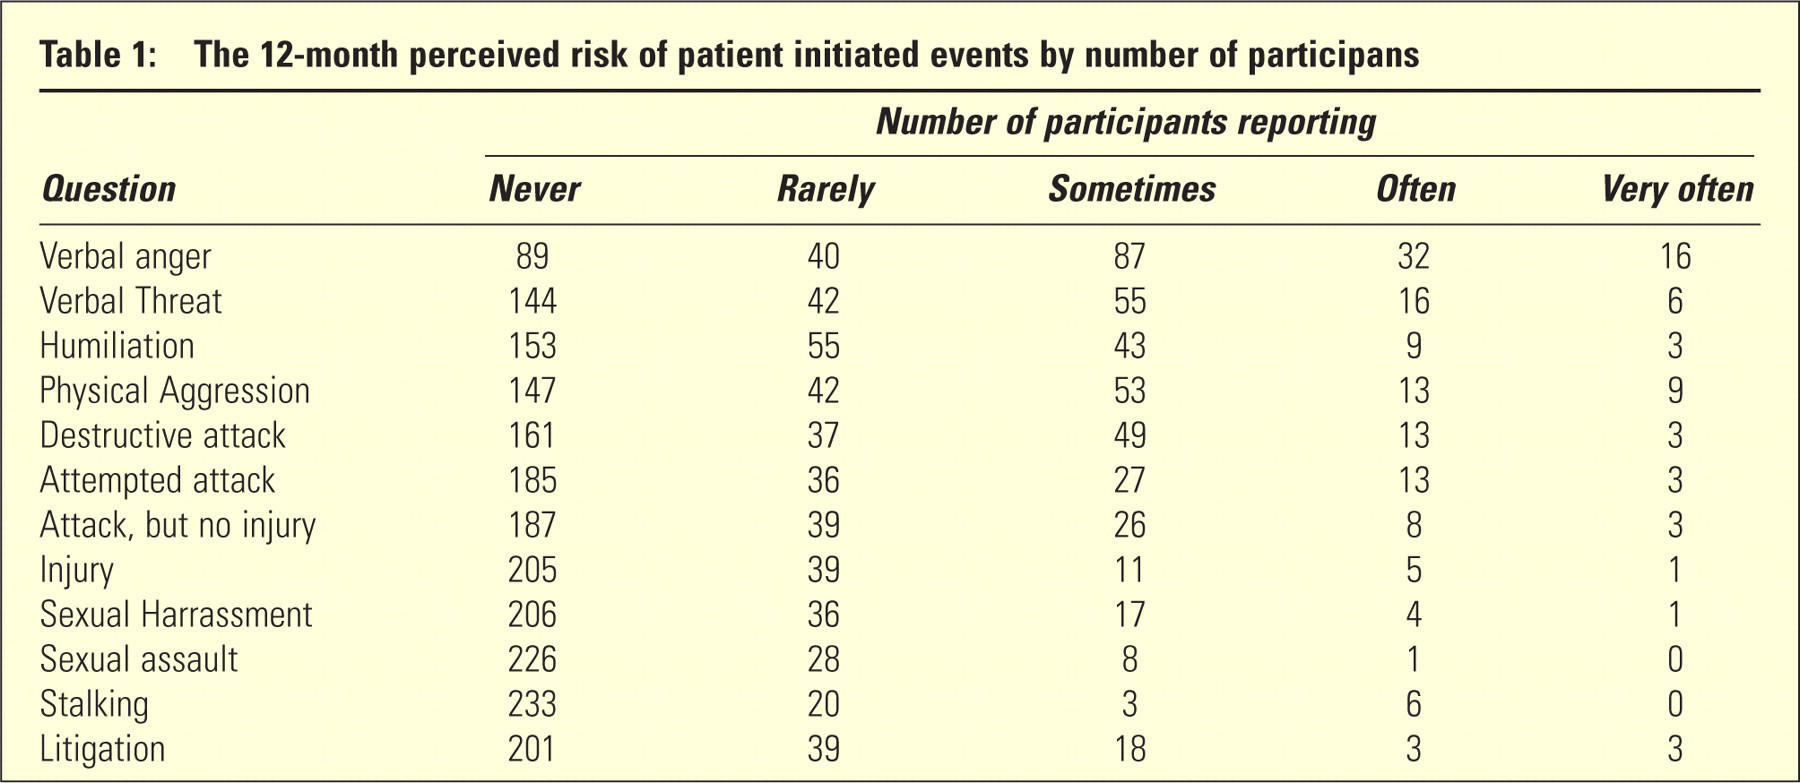
The perceived rate of adverse events is shown inTable 1. The 12 items reliably interacted as one scale (Cronbach's Alpha 0.91). Some support workers did experience verbal forms of aggression or destructive behaviour, less experienced physical aggression, and a minority were injured, sexually harassed, stalked or harassed by means of formal complaint. However, a minority of support workers noted, even for the more serious forms of aggression, that these events were not rare.
The 12-month perceived risk of patient initiated events by number of participans
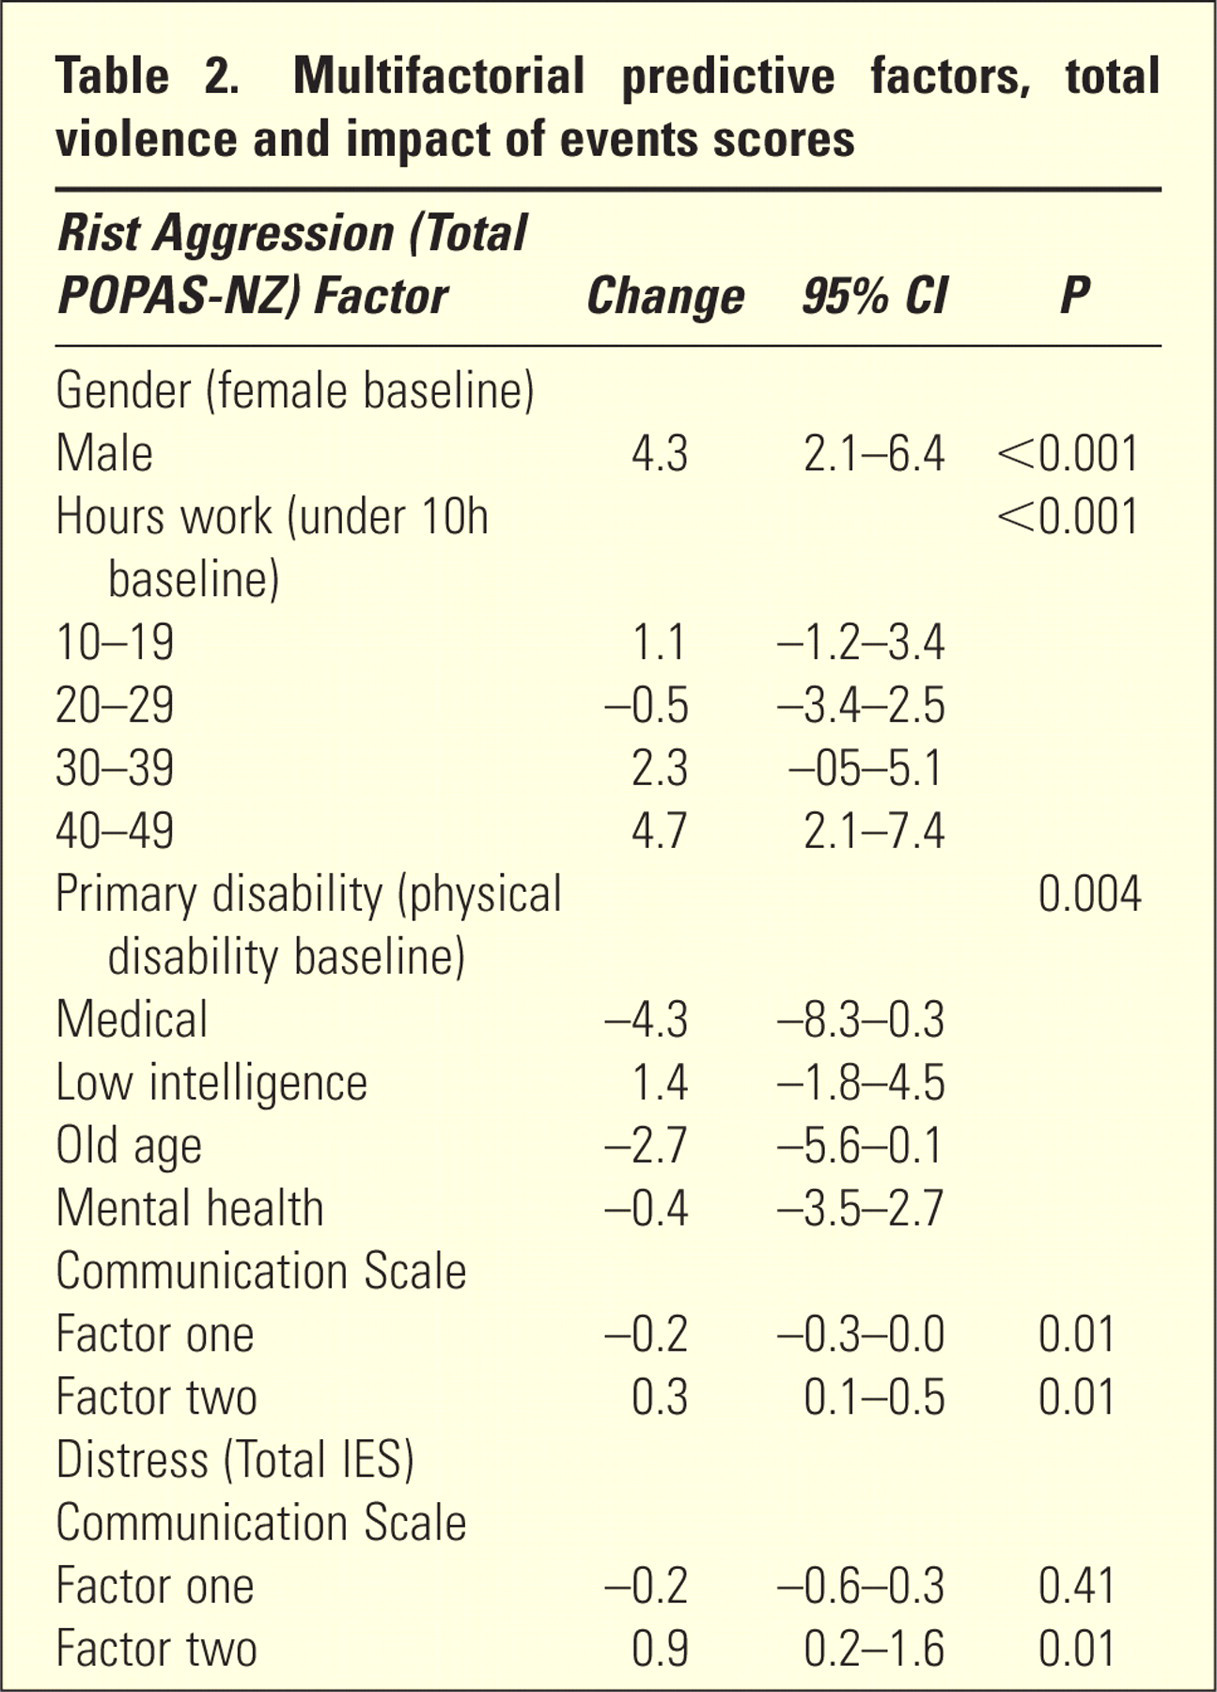
The median total violence score was 5 (interquartile range 12.25) with a range of scores from 0 to 44. A higher total violence score was associated with age and gender, the primary disability of clients, and numbers of hours worked (Table 2). The length of time worked was not associated with perceived total violence risk. After correcting for all factors, communication scale 1 was associated with a significant decrease and communication scale 2 with a significant increase in total violence scores.
Multifactorial predictive factors, total violence and impact of events scores
Ongoing distress
We estimated the distress per week by using the IES-R. The median was 2, interquartile range 12. The range of scores was 0 to 44: 15/264 (5.7%) participants had IES-R scores greater than 33, which would be consistent with current clinical PTSD. Although consistent with a diagnosis of PTSD, causation in these cases is unknown. There was no significant association of IES-R scores with gender (F = 0.46, p =0.70), age (F = 1.86, p = 0.09), primary disability of the client (F = 0.38, p = 0.85), hours worked per week, or (F = 1.02, p = 0.40) factor 1 on the communication scale. However, factor 2 was associated with an increase on the IES-R (Table 2).
DISCUSSION
This paper is the first, to our knowledge, to examine perceived aggression among community support workers. This survey indicates that patient aggression is a workplace risk for support workers, and the pattern of aggression is similar to that for other health workers. 1 – 5 Working in mental health, physical disability and intellectual disability does seem to lead to an increased perception of violence toward support workers. It appears that the communication style or approach that a care-giver uses in their work can affect their risk of aggression, after allowing for type of work, gender, age and training.
We used the POPAS-NZ total violence measure instead of the raw survey data. This has allowed us to estimate associations and correct for confounding factors, but it may be that this measure combines serious and non serious forms of aggression. To our knowledge, the POPAS is the only outcome measure for patient aggression that has been used away from an inpatient unit. We have reported reasonable internal reliability for this scale; therefore, it would be possible (as is often the case with the ordinal nature of Likert scales) to use the summed score as a measure of total perceived violence. The reliability of the survey is improved by decreasing the items to seven (anger, threats, physical aggression, destruction of property, attempted assault, assault/being hit, and injury). We suggest that either scale may be a useful tool for ascertaining the perceived burden of violence for clinical workers.
A possible limitation of this study is that it is based on the participants’ perception of their risk of violence, and their perception of their communication style. There has been no attempt to verify any aggression event or the participants’ communication style. The response rate is lower than in earlier surveys, and this may be due in part to the method of mailout. However, both the response rate and the correlation of communication and perceived aggression is consistent with the rate found with medical students. 5 It appears that we had a representative sample in relation to gender, which was the only demographic that was ethically available for us to obtain without a consent process from potential participants. The possibility remains, however, that those who experienced aggression may be over-represented, or that people with a certain communication style also perceive greater threats.
When work is done within the community, the methods available to reduce risk are different to those in hospital settings. It is difficult to manipulate the culture, architecture or staffing ratios, as can be done in a hospital. We suggest that those factors amenable to manipulation, such as communication style, may be appropriate areas for intervention to reduce workers’ experience of aggression. Further research should also examine the correlation between perceived and actual aggression by using different reporting methods.
Footnotes
Acknowledgements
We wish to thank the staff and management of the care workers’ organizations that participated in this research. The project was funded by a University of Otago Research Grant. Anne Howarth helped obtain and code the data.