
Abstract
The aim of this study was to analyse the relationship between sociometric types, behavioural categories and academic achievement in a sample of 1,349 compulsory secondary education students (51.7% boys), ranging in age from 12 to 16 years. The students’ sociometric identification was performed by using the Programa Socio and academic performance was measured by school marks provided by teachers in the subjects of Spanish language, mathematics and average academic performance. The results show that sociometric types were significant predictors of academic achievement, as students who were rated positively by their peers (popular, leaders, collaborators and good students) were more likely to have high academic achievement (in mathematics, Spanish language and average academic achievement) than students rated negatively by peers (rejected-aggressive, rejected-shy, neglected and bullies).
Interaction between peers is vitally important for the cognitive, emotional and social development of adolescents (Inglés, 2009). The reciprocal relationships that occur between peers, particularly during this stage of development, condition the learning of skills and attitudes towards said interactions (Bukowski, Brendgen, & Vitaro, 2007; Inglés, Delgado, García-Fernández, Ruiz-Esteban, & Díaz-Herrero, 2010). Despite the family initially holding an important position as the socializing context, relationships with classmates gain importance, intensity and stability as the peer group becomes the most important socializing context (Inglés, 2009; Oliva, 1999).
Recent studies have pointed out that the status a student holds among their peers involves important conditions such as being accepted, appreciated, preferred and respected. These factors create a reinforcement of positive social skills, as well as improving self-concept and increasing self-esteem. Conversely, low psychosocial adjustment in the school environment (being rejected or ignored) becomes a risk factor for these children since they may feel stressed, lonely and dissatisfied, which negatively affects their well-being and their school performance (Juvonen, Nishina, & Graham, 2000; Ladd, Herald, & Andrews, 2006; Wentzel, 2003). The study of sociometric types in adolescence is especially important for this reason.
Sociometric nomination expresses the position or social status that the student presents in his/her group or classroom, according to the opinion of his/her peers. Currently, bidimensionality is the classification method most accepted by the scientific community, which considers the social preference and social impact of the variables from which five sociometric types are derived: popular, rejected, neglected, controversial and average (García-Bacete, 2007; Muñoz Tinoco, Moreno Rodríguez, & Jiménez Lagares, 2008).
The present study intends to examine the relationship between the different sociometric types and academic achievement in Spanish students in compulsory secondary education. This is because the previous empirical evidence, obtained from samples made up of foreign students, revealed the existence of a close relationship between adolescents’ social status and academic achievement (e.g., Hatzichristou & Hopf, 1996; Wentzel & Asher, 1995), revealing that the rejected students presented greater academic difficulties, greater academic failure and less motivation concerning their studies than the accepted students. In the Spanish educational system, compulsory secondary education is an obligatory and free educational phase that completes basic education, comprised of four academic years that normally take place between 12 and 16 years of age.
Hereafter, we present the reasons justifying the importance of this study of sociometric types and academic achievement in compulsory secondary education, as well as the principal findings from studies that have addressed the relationship between both constructs, and the knowledge that the present study seeks to contribute.
Sociometric types and academic achievement
Several studies have focused on the connection that exists between the quality of the relationships between a student’s peer group and their social and academic adaptation in school (Wentzel, 2003). The children that showed helpful and cooperative behaviour tended to be more positively valued by their peers and were more successful in school. On the contrary, children that behaved aggressively and violated social norms tended to be rejected by their classmates and tended to perform poorly (Coie, Dodge, & Kupersmidt, 1990). Along these lines, in a study performed with 423 students between the ages of 11 and 13 years, Wentzel (1995) found that independence, self-confidence, impulse control and displaying pro-social and non-aggressive behaviours in class could have important ties between sociometric types and academic results during early adolescence.
Pérez-Sánchez and Castejón (1996) also studied the relationship between psychosocial factors (family educational environment, intelligence, self-concept and popularity) and academic achievement in a sample of 270 Spanish students (children and adolescents). The results showed a positive relationship between the students’ popularity and their academic performance.
Plazas, Penso, and López (2006) later performed a study with a sample of 156 Columbian secondary education students with the aim of establishing whether or not an interaction effect existed among sociometric status and gender on academic achievement. Sociometric status was evaluated according to peer nominations for categorizing the students into six groups: popular, rejected, excluded, controversial, average and unclassified. The analysis of variance did not reveal a significant effect of the sociometric interaction status and gender on academic achievement, although it did show a significant effect independent of the two main variables. In the post hoc test, a direct relationship was presented between performance and social preference, as well as between performance and social impact. A significant difference was also found between controversial girls and boys.
For their part, Meijs, Cillessen, Scholte, Segers, and Spijkerman (2010) compared the effects of social competence on academic achievement in a sample of 512 students, ranging from 14–15 years old, from two northwestern European schools. A differentiation was made within the popular sociometic type. This differentiation was between ‘sociometric popularity’ as a measure of acceptance and ‘perceived popularity’ as a measure of social dominance. The results showed that perceived population was significantly related to social competence, but not to academic achievement in either of the two schools. Sociometric popularity was predicted from the interaction between academic achievement and social competence.
Recently, Graziano, Geniatti, Pertosa, and Consoli (2010) examined the relationship between social rejection and several indicators of psychosocial adjustment (academic achievement, pro-social behaviour, self-regulated behaviour and emotional competence) in a group of 169 Italian adolescents. The results indicated that the students with a high school rejection rate obtained lower scores in academic achievement, in self-regulated behaviour and emotional competence. These results showed a positive relationship between acceptance by peers and academic achievement.
The present study
Even though there have been many authors who have related sociometric types to academic achievement, this relationship was not clearly defined in the bibliography on the topic. The present study’s main contribution consisted of analysing the relationship between sociometric types and academic achievement (academic marks from the teacher in Spanish language, mathematics and average academic achievement) by expanding the number of sociometric types examined (popular-preferred, rejected-aggressive, rejected-shy and ignored-neglected) and the behavioural categories that may appear within a social group (leader, pleasant-humour, collaborator, aggressive-bully, passive-inhibited [lets others dictate] and good student-good grades).
The present study had the following specific aims: to examine academic achievement differences in the subject of mathematics between compulsory secondary education students according to sociometric types and behavioural categories; to examine the academic achievement differences in the subject of Spanish language between compulsory secondary education students according to sociometric types and behavioural categories; to examine the average academic achievement differences between compulsory secondary education students according to sociometric types and behavioural categories; and to confirm whether sociometric types predict academic achievement in the subjects of mathematics, Spanish language and the average academic achievement of compulsory secondary education students.
The following hypotheses were created from the previous empirical evidence: the students who are positively nominated by their peers (popular, leaders, pleasant, collaborators and good students) will present significantly higher scores on academic achievement in mathematics than the students who are negatively nominated by their peers (rejected-aggressive, rejected-shy, neglected, bullies, obedient-lets others dictate); the students who are positively nominated by their peers will present significantly higher scores on academic achievement in the Spanish language than the negatively nominated students; the students who are positively nominated by their peers will present significantly higher scores in average academic achievement than the students who are negatively nominated by their peers; and the sociometric types will be a significant predictor of achievement in mathematics, Spanish language and average academic achievement.
Method
Participants
A random cluster sampling was performed (geographic zones from the region of Murcia and the Alicante province: central, north, south, east and west). In order for all the geographic zones to be represented, between one and three schools per zone, according to population, were randomly selected. This added up to a total of 20 schools from rural and urban areas (14 public and six private). Once the schools were established for the study, four classrooms were randomly selected, adding up to approximately 120 participants per school.
There was a total of 1,594 students who participated from the first through fourth year of compulsory secondary education (sampling error = 0.02), from which 116 (7.28%) were excluded due to errors or omissions in their responses or for not obtaining the written informed consent for participation from their parents. An additional 129 (8.09%) were excluded because they were foreigners who did not have sufficient proficiency in the Spanish language. Therefore, the final sample was made up of 1,349 students (697 boys and 652 girls), with an age range of 12–16 years (M = 13.81; SD = 1.35). The percentage of students who had not repeated a school year was 86.30%. The ethnic composition of the sample was the following: 88.9% Spanish, 6.34% Latin American, 3.37% rest of Europe, 0.75% Asian and 0.64% Arabs. The distribution of the participants by gender and academic year was the following: 386 in the first year of compulsory secondary education (203 males and 183 females), 325 in the second year of compulsory secondary education (173 males and 152 females), 318 in the third year (172 males and 146 females), and 320 in the fourth year (149 males and 171 females). The Chi-square test was used to determine homogeneity of the frequency distribution. No statistically significant differences were found to exist between the eight groups according to gender and school year.
Instruments
Sociometric types: sociometric nomination test
The sociometric test is an instrument that allows the ways that individuals within the groups interact to be discovered and reveals the group’s structure in order to identify preferred, rejected and ignored individuals. as well as leader figures, cooperative persons, troubled individuals, etc. The sociometric nomination method is based on Moreno’s (1934) measurements of attraction and repulsion, expressed in measurements of choice and rejection, and classified through the social preference and social impact dimensions proposed by Peery (1979). Participants can be identified as preferred, rejected, ignored, controversial and average by taking account of these two orthogonal dimensions and through the use of statistical techniques.
This study focused on the analysis of preferred-popular, rejected (rejected-aggressive and rejected-shy) and ignored-neglected participants, since these categories comprise the greatest number of students (García-Bacete, 2007), and in turn, represent the best (preferred) and worst social adjustment (rejected and ignored) in the academic context. In addition, the different behavioural categories that could appear within a social group were analysed: leader, nice, collaborator, bully, passive-inhibited and good student. The probabilistic nomination procedure with three inter-gender choices was used, since it was considered to be the most appropriate and adjusted sociometric nomination test (García-Bacete, 2007). The sociometric identification of the students was performed by using the Programa Socio (González, 1990) (a free sociometic computer program) that allows the upper and lower limits of the positive and the negative nominations received for a group or a class of students to be obtained. This procedure reached high discriminant validity in students in the fourth year of primary education, with 80% agreement between behavioural identification and sociometric identification (García-Bacete, 2006).
Academic achievement
This variable was measured through the academic marks supplied by the teachers in the subject areas of Spanish language and mathematics. The average academic achievement of the participants was also taken into account. For the statistical analysis, the grades in Spanish language, mathematics and average achievement were used in two categories: (a) high academic achievement: those students who obtained a score of 8 or more points on their marks in the respective subjects; and (b) low academic achievement: those students who had obtained a mark lower than 5 points in Spanish language, mathematics and average achievement. Many previous empirical studies considered the achievement variable to be continuous. However, in this study we have treated it as categorical in the logistic regressions (high versus low achievement).
Procedure
An interview was performed with the participating schools’ directors and counselors to present the study’s aims, describe the evaluation instruments, request permission and encourage their collaboration. Afterwards, a meeting was held with the parents to explain the study to them and to request their written informed consent authorizing their children to participate in the study.
The questionnaires were collectively and voluntarily answered in the classroom. An identification number was assigned in advance to each response sheet given to each participant, which were corrected by computer afterwards. The questionnaire’s instructions were read aloud to the participants, emphasizing the importance of not leaving any question unanswered. The researchers were present during the tests’ administration in order to clarify any doubts and to verify that each participant completed the test independently.
Statistical analysis
The sociometric identification of the students was performed by using the Programa Socio (González, 1990) that allowed the lower and upper limits of the positive nominations received (LI (Np) and LS (Np)) and the lower and upper limits of negative nominations (LI (Nn) and LS (Nn)) received to be obtained for a group or class of students. This was carried out through binomial probability calculations, in order to find the t-test value associated with a particular asymmetry and a probability level lower than .05 (Salvosa’s tables). Identification was accomplished by applying the following criteria: Preferred = Np ≥ LS (Np) and Nn < M (Nn), Rejected = Nn ≥ LS (Nn) y Np < M (Np) and Ignored = Np ≤ 1 and Nn < M (Nn).
The following was performed with the aim of analysing the relationship between the sociometric types and academic achievement: (a) student’s t-tests of differences between means for marks in mathematics, Spanish language and means of students according to sociometric types; and (b) F tests (ANOVA) of differences in means between groups in academic achievement according to sociometric types.
Due to the study’s large sample size, the Student’s t-tests and the F test (ANOVA) could mistakenly identify statistically significant differences. For this reason, the d index (standardized mean difference for the F and t-test and effect size of differences in prevalence) proposed by Cohen (1988) was included, which allowed an evaluation of the magnitude or effect size of the differences found. Effect size interpretation was simple: values less than or equal to .20 indicated a very small effect size, between .20 and .49 was small, between .50 and .79 was moderate, and values greater than .80 indicated a large effect size (Cohen, 1988).
Predictor equations for sociometric types were established by using logistic regression, following the forward stepwise regression procedure based on the Wald statistic. The coefficients of each variable in the regression equation and the statistics attained by the models when classifying the participants according to the group they belonged to (e.g., popular, rejected, aggressive, rejected-shy, neglected, leader, humour, collaborator, bully, obedient and good student/good grades) were presented in the logistic regression analysis. Logistic modeling allowed us to estimate the probability of an event, incident or result occurring (e.g., low academic achievement) versus it not occurring, in the presence of one or more predictors (e.g., the rejected-aggressive sociometric type).
This probability was estimated through the statistic called odd ratio (OR), which was interpreted in the following way: OR > 1 indicated a positive prediction, OR < 1 indicated a negative prediction, whereas a value of 1 indicated that there was no prediction (De Maris, 2003).
Results
Figure 1 presents a graph of the differences in the students’ academic achievement scores according to the sociometric types and behavioural categories analysed. Differences in the students’ academic achievement scores according to sociometric types and behavioural categories.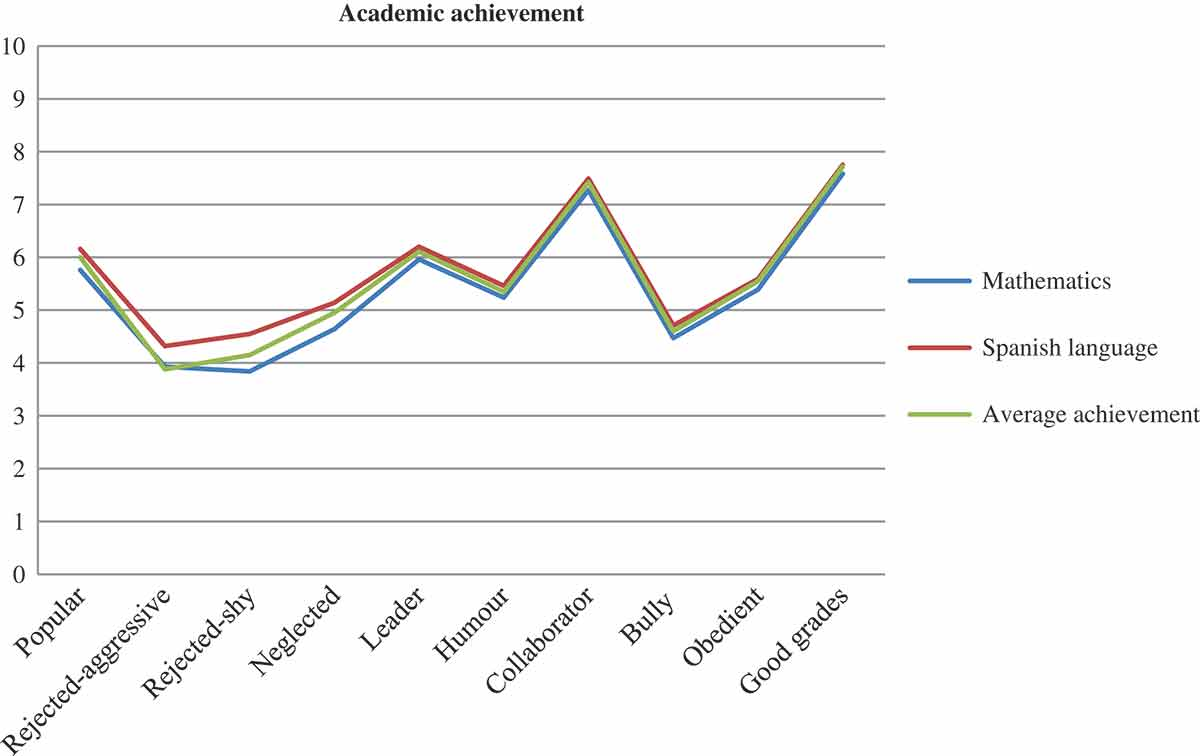
Achievement in mathematics
Differences in the students’ academic achievement scores according to sociometric types and behavioural categories.
The results showed that significantly higher mean scores were found in the popular student group versus the non-popular, in the non-rejected-aggressive group versus rejected-aggressive, in the non-rejected-shy group versus the rejected-shy group, in the non-neglected group versus the neglected, in the leaders rather than the non-leaders, in the collaborators versus the non-collaborators, in the group of non-bullies versus the bullies, and in the group with good grades versus the group that did not receive good grades. The effect size of these differences was small for the popular, non-neglected and leader groups (d < 0.50), of moderate magnitude for the non-rejected-aggressive, non-rejected-shy and non-bully groups (d ≥ 0.50), and of large magnitude for the collaborators and good grades groups (d ≥ 0.80).
Achievement in Spanish language
Table 1 shows that significantly higher mean scores were found in the popular student group versus the non-popular, in the non-rejected-aggressive group versus rejected-aggressive, in the non-rejected-shy group versus the rejected-shy group, in the non-neglected group versus the neglected, in the leaders rather than the non-leaders, in the collaborators versus the non-collaborators, in the group of non-bullies versus the bullies, and in the group with good grades versus the group that did not receive good grades. The effect size of these differences was small for the popular, non-neglected and leader groups (d < 0.50), of moderate magnitude for the non-rejected-aggressive, non-rejected-shy and non-bully groups (d ≥ 0.50), and of large magnitude for the collaborators and good grades groups (d ≥ 0.80).
Average academic achievement
Table 1 shows that significantly higher mean scores were found in the popular student group versus the non-popular, in the non-rejected-aggressive group versus rejected-aggressive, in the non-rejected-shy group versus the rejected-shy group, in the non-neglected group versus the neglected, in the leaders rather than the non-leaders, in the collaborators versus the non-collaborators, in the group of non-bullies versus the bullies, and in the group with good grades versus the group that did not receive good grades. The effect size of these differences was small for the popular, non-neglected and leader groups (d < 0.50), of moderate magnitude for the non-rejected-aggressive, non-rejected-shy and non-bully groups (d ≥ 0.50), and of large magnitude for the collaborators and good grades groups (d ≥ 0.80).
Comparison of scores between groups in academic achievement according to sociometric types and behavioural categories.
Results derived from the binary logistic regression for the probability of being nominated by peers according to academic achievement.
Note. B = coefficient; SE = standard error; p = probability; OR = odds ratio; CI = confidence interval at 95%.
Logistic regressions
The binary logistic regression analyses revealed that the sociometric types and some behavioural categories were significant variables for predicting academic achievement. New logistic models were able to be created from the analysed sample. These new models predicted the probability of being selected as popular, rejected-aggressive, rejected-shy, neglected, leader, nice, bully, collaborator and good student through the academic achievement variable. Academic achievement (achievement in Spanish language, mathematics and mean academic achievement) was included as a predictor variable in all of the logistic models created.
The proportion of cases classified correctly by the logistics models varied according to the sociometric type analysed: the popular sociometric type model allowed for a correct estimation in 85.3% of the cases (Nagelkerke R 2 = .02), the rejected-aggressive sociometric type model had 97.2% of the cases estimated correctly (Nagelkerke R 2 = .08), the rejected-shy model had a correct estimation in 98.3% of the cases (Nagelkerke R 2 = .05), the neglected sociometric model displayed a correct estimate in 95.1% of the cases (Nagelkerke R 2 = .02), the leader category model had a correct estimation in 75% of the cases (Nagelkerke R 2 = .04), the nice behaviour category showed a correct estimation in 73.8% of the cases (Nagelkerke R 2 = .01), the collaborator model had 82.3% of the cases estimated correctly (Nagelkerke R 2 = .40), the bully model permited a correct estimation in 75.2% of the cases (Nagelkerke R 2 = .11), and the good grades category model had a correct estimation in 85.5% of the cases (Nagelkerke R 2 = .55).
Just as indicated in Table 3, the OR from the logistics models for predicting sociometric types showed: (a) that for each point increase in achievement in Spanish language, the students presented a 17% greater probability in being selected as popular and 21% greater probability of being chosen as leaders; (b) that for each point increase in achievement in mathematics, the students were 13% less likely to be chosen as neglected and 16% more likely to be selected as bullies; and (c) that for each point increase in mean academic achievement, the students presented a 33% lower possibility of being selected as rejected-aggressive, a 28% lower possibility of rejected-shy, a 7% lower probability of being seen as nice, a 125% greater probability of being collaborators, a 38% lower probability of being chosen as bullies and a 216% greater probability of being selected as good students.
Discussion
The aim of this study was to analyse the relationship between sociometric types and academic achievement (in mathematics, Spanish language and mean achievement) in a sample of compulsory secondary education students, thus expanding the results found in the bibliographic review. The number of sociometric types has also been increased in the present study (preferred-popular, rejected, rejected-aggressive, rejected-shy and ignored-neglected). In addition, different behavioural categories that may appear within a social group have been analysed: leader, nice, collaborator, problematic-aggressive, passive-inhibited and good student.
On the one hand, the results pointed out that the group of students positively nominated by their peers as popular, non-rejected-aggressive, non-rejected-shy, non-neglected, leaders, collaborators, non-bullies and possessing good grades, obtained significantly higher scores in achievement in mathematics, Spanish language and in mean academic achievement than the students negatively nominated as unpopular, rejected-aggressive, rejected-shy, neglected, non-leaders, non-collaborators, bullies and those without good grades, thus confirming the present study’s first, second and third hypotheses. These results are along the same line as previous studies that related acceptance by peers with greater academic achievement (Graziano et al., 2010; Meijs et al., 2010; Pérez-Sánchez & Castejón, 1996; Plazas et al., 2006; Wentzel, 2003; Wentzel & Asher, 1995). These are large magnitude differences (d ≥ 0.80) for the groups of students nominated as collaborators and those that obtain good grades in the case of achievement in mathematics and in Spanish language, and for the groups of students nominated as non-rejected-aggressive, collaborators and good grades in the case of mean academic achievement. The analysis between the groups showed that the popular student group presented significantly higher mean scores in achievement in mathematics than the rejected-aggressive, rejected-shy and neglected groups. Regarding achievement in Spanish language, the popular students presented significantly higher mean scores than the rejected-aggressive, rejected-shy and neglected students. In mean academic achievement, the popular students presented significantly higher mean scores than the rejected-aggressive, rejected-shy and neglected students. Only the collaborators presented significantly higher mean scores in mean academic achievement than the bully group in the behavioural categories.
The logistic regression analysis permitted the creation of new predictive models with a high percentage of accurate cases (75–97.2%). The predictive and reciprocal relationship maintained by sociometric types, behavioural categories and academic achievement is found in these models. Just as indicated in the fourth hypothesis, sociometric types and some behavioural categories were a significant predictor of academic achievement, since the students who were positively nominated by their classmates (popular students, leaders, collaborators and good students) presented a greater probability of possessing high academic achievement (in mathematics, Spanish language and average achievement) than the negatively nominated students (rejected-aggressive, rejected-shy, neglected and bullies).
This study’s results coincide with the findings from several transversal and longitudinal studies that have shown that pro-social behaviour is positively and significantly related to academic self-efficacy (Bandura, Caprara, Barbaranelli, Gerbino, & Pastorelli, 2003; Garaigordobil, Cruz, & Pérez, 2003; Inglés, Pastor, Torregrosa, Redondo, & García-Fernández, 2009). Numerous studies on pro-social behaviour and sociometric types have shown that adolescents who presented significantly higher levels in pro-social behaviour tended to be more popular among their classmates and obtained better academic results, whereas those that behaved more aggressively and antisocially tended to be rejected and performed less or failed in school (Buhs, Ladd, & Herald, 2006; Inglés et al., 2009; Jiménez, 2003; Loveland, Lounsbury, Welsh, & Buboltz, 2007; Lozano & García, 2000; Lubbers, Van Der Werf, Snijders, Creemers, & Kuyper, 2006; Torregrosa et al., 2012; Warden & Mackinnon, 2003; Wentzel & Caldwell, 1997; Wentzel & Watkins, 2002; Zettergren, 2003).
In addition, this study’s results highlight, on the one hand, the usefulness of sociometric methods in research performed in educational institutions due to their easy application and empirical validity (Muñoz Tinoco et al., 2008), among other reasons. On the other hand, the methods are useful because of their relationship with sociometric types with different cognitive-motivational and social variables and their influence over academic achievement. Thus, teachers and psycho-pedagogues could use sociometric types as a tool for identifying possible deficiencies in interpersonal skills. The results described in this study could additionally help in guiding the teaching staff in the development of strategies and interventions that could eliminate obstacles to classroom learning. The evidence has shown that developing feedback activities for teachers enables them to improve their teaching strategies and, consequently, improve the students’ results (Rosenfield, Silva, & Gravois, 2008).
On a practical level, this study’s results suggest working with teachers and administrators to create educational environments and school climates that facilitate learning and that encourage the socio-personal development of the student body (Pertegal, Oliva, & Hernando, 2010), overcoming obstacles that lead to discrimination and adapting education to new social demands (Viguer & Solé, 2012).
This study was not without limitations. In the first place, even though the sampling method guaranteed that the target population was represented in the final sample, the study’s findings cannot be generalized to Spanish students at other educational levels (nursery education, primary education, baccalaureate and higher education). Future research should confirm whether the results found in compulsory secondary education differ or remain the same for other educational levels. In the second place, it is also not appropriate to generalize the findings to secondary education Spanish students diagnosed with learning disorders or psychopathological disorders (for example, schizophrenia, depression, etc.). These are aspects that can clearly alter a student’s social and academic behaviour. Furthermore, keeping in mind the principle of situational specificity that characterizes social behaviour, it would be difficult to extend the obtained results to secondary education students from other cultures and ethnicities. In the third place, it would be interesting for future studies to include different sources to assess social conduct (self-reports, peers, teachers and parents) in order to analyse any inter-source concordance. Future research should analyse the different groups of ignored and rejected students (Estévez, Herrero, Martínez, & Musitu, 2006), as well as the controversial and average sociometric categories, since the omission of these analyses can generate incomplete results when classifying students into a certain sociometric type. It would be advisable for future studies to utilize longitudinal designs in an attempt to contribute more conclusive data with respect to the influential relationships between these variables. Finally, future research should investigate whether the results found in this study are confirmed by using other academic achievement indicators such as standardized achievement tests in several different curricular subjects.
Relación entre tipos sociométricos y rendimiento académico en una muestra de estudiantes de Educación Secundaria Obligatoria
La interacción entre iguales es de vital importancia para el desarrollo cognitivo, emocional y social de los adolescentes (Inglés, 2009). Las relaciones recíprocas que acontecen entre pares, durante esta etapa del ciclo vital, condicionan el aprendizaje de habilidades y actitudes hacia dichas interacciones (Bukowski, Brendgen, & Vitaro, 2007; Inglés, Delgado, García-Fernández, Ruiz-Esteban, & Díaz-Herrero, 2010). A pesar de que la familia ocupa un lugar preferente como contexto socializador, las relaciones con los compañeros ganan importancia, intensidad y estabilidad y el grupo de iguales se convierte en el contexto de socialización más importante (Inglés, 2009; Oliva, 1999).
Estudios recientes han destacado que el estatus que mantiene el escolar entre sus pares implica condiciones importantes como ser aceptado, apreciado, preferido y respetado. Estos factores generan un reforzamiento de habilidades sociales positivas, así como la mejora del autoconcepto y el aumento de la autoestima. Por el contario, el bajo ajuste psicosocial en el ámbito escolar (ser rechazados e ignorados) se convierte en un factor de riesgo para estos niños, pues pueden ocasionarles estrés y sentimientos de soledad e insatisfacción, afectando negativamente a su bienestar y su desempeño escolar (Juvonen, Nishina, & Graham, 2000; Ladd, Herald, & Andrews, 2006; Wentzel, 2003). Por tanto, el estudio de los tipos sociométricos en la adolescencia resulta de especial importancia.
La nominación sociométrica expresa la posición o estatus social que presenta el estudiante en su grupo-aula, según la opinión de sus iguales. Actualmente, la bidimensionalidad es la metodología de clasificación más aceptada por la comunidad científica, considerando la preferencia social y el impacto social las variables a partir de las cuales se derivan cinco tipos sociométricos: populares, rechazados, olvidados, controvertidos y medios (García-Bacete, 2007; Muñoz Tinoco, Moreno Rodríguez, & Jiménez Lagares, 2008).
Puesto que la evidencia empírica previa, realizada con muestras de escolares extranjeros, ha revelado la existencia de una estrecha relación entre el estatus social de los adolescentes y el rendimiento académico (e.g., Hatzichristou & Hopf, 1996; Wentzel & Asher, 1995), en tanto que los estudiantes rechazados presentan mayores dificultades académicas, mayor fracaso escolar y menor motivación hacia los estudios que los estudiantes aceptados, el presente estudio pretende examinar la relación entre los diferentes tipos sociométricos y el rendimiento académico en estudiantes españoles de Educación Secundaria Obligatoria (ESO). En el sistema español, la Educación Secundaria Obligatoria (ESO) es una etapa educativa obligatoria y gratuita que completa la educación básica, constando de cuatro cursos académicos que se realizan ordinariamente entre los 12 y los 16 años de edad.
A continuación, se exponen los motivos que justifican la importancia del estudio de los tipos sociométricos y el rendimiento académico en la ESO, así como los principales hallazgos de los estudios que abordan la relación entre ambos constructos, y los conocimientos que pretende aportar el presente trabajo.
Tipos sociométricos y rendimiento académico
Diversas investigaciones se han centrado en la relación que existe entre la calidad de las relaciones entre el grupo de iguales y la adaptación social y académica del estudiante en el colegio (Wentzel, 2003). Así, los niños que muestran conductas de ayuda y de cooperación tienden a ser valorados más positivamente por sus iguales y tienen más éxito académico. Por el contrario, los niños que actúan agresivamente y violan las normas sociales tienden a ser rechazados por sus compañeros y suelen ser estudiantes con pobre rendimiento (Coie, Dodge, & Kupersmidt, 1990). En este orden de ideas, Wentzel (1995) encontró, en una investigación realizada con 423 estudiantes de 11 y 13 años, que la independencia, la autoconfianza, el control del impulso y la manifestación de conductas prosociales y no agresivas en clase podrían tener importantes vínculos entre los tipos sociométricos y los resultados académicos durante la adolescencia temprana.
Pérez-Sánchez y Castejón (1996) también estudiaron la relación entre factores psicosociales (clima educativo familiar, inteligencia, autoconcepto y popularidad) y el rendimiento académico en una muestra de 270 alumnos españoles (niños y adolescentes). Los resultados mostraron una relación positiva entre la popularidad de los alumnos y su rendimiento académico.
Posteriormente, Plazas, Penso, y López (2006) realizaron un estudio con una muestra de 156 estudiantes colombianos de educación secundaria con el objetivo de establecer si existía un efecto de interacción entre el estatus sociométrico y el sexo sobre el rendimiento académico. El estatus sociométrico se evaluó según las nominaciones de los pares para categorizar a los estudiantes en seis grupos: popular, rechazado, excluido, controvertido, promedio y no clasificado. El análisis de varianza no reveló un efecto significativo de la interacción del estatus sociométrico y el género sobre el rendimiento académico, aunque sí mostró un efecto significativo independiente de las dos variables principales. En la prueba post hoc, se presentó una relación directa entre el rendimiento y la preferencia social, así como entre el rendimiento y el impacto social, y una diferencia significativa entre chicas y chicos controvertidos.
Por su parte, Meijs, Cillessen, Scholte, Segers, y Spijkerman (2010) compararon los efectos de la competencia social en el rendimiento académico en una muestra de 512 estudiantes de 14–15 años de edad de dos colegios del noroeste de Europa. Se diferenció dentro del tipo sociométrico popular entre ‘popularidad sociométrica’ como medida de aceptación y ‘popularidad percibida’ como medida de dominancia social. Los resultados mostraron que la popularidad percibida estaba relacionada significativamente con la competencia social, pero no con el rendimiento académico, en ambos colegios. La popularidad sociométrica se predijo a partir de la interacción entre el rendimiento académico y la competencia social.
Recientemente, Graziano, Geniatti, Pertosa, y Consoli (2010) examinaron la relación entre el rechazo social y varios indicadores de ajuste psicosocial (rendimiento académico, conducta prosocial, conducta autorregulada y competencia emocional) en un grupo de 169 adolescentes italianos. Los resultados indicaron que los estudiantes con un alto índice de rechazo escolar obtuvieron puntuaciones más bajas en rendimiento académico, en conducta autorregulada y competencia emocional. Estos resultados señalan la relación positiva entre la aceptación por parte de los iguales y el rendimiento académico.
El presente estudio
Aunque existen numerosos autores que relacionan los tipos sociométricos con el rendimiento académico, esta relación no está claramente definida en la bibliografía sobre el tema. La principal aportación del presente estudio consiste en analizar la relación entre tipos sociométricos y rendimiento académico (calificaciones académicas del profesor en lengua castellana, matemáticas y rendimiento académico medio) ampliando el número de tipos sociométricos examinados (populares-preferidos, rechazados-agresivos, rechazados-tímidos e ignorados-olvidados) y categorías conductuales que pueden aparecer dentro de un grupo social (líder, simpático-humor, colaborador, agresivo-peleón, pasivo-inhibido (se deja mandar) y buen estudiante-buenas notas).
Concretamente, el presente estudio tiene como objetivos específicos: examinar las diferencias de rendimiento académico en la asignatura de matemáticas entre estudiantes de ESO según los tipos sociométricos y categorías conductuales; examinar las diferencias de rendimiento académico en la asignatura de lengua castellana entre estudiantes de ESO según los tipos sociométricos y categorías conductuales; examinar las diferencias de rendimiento académico medio entre estudiantes de ESO según los tipos sociométricos y categorías conductuales; y comprobar si los tipos sociométricos predicen el rendimiento académico en las asignaturas de matemáticas, lengua castellana y rendimiento académico medio de los estudiantes de ESO.
A partir de la evidencia empírica previa, se plantean las siguientes hipótesis: los estudiantes nominados positivamente por sus iguales (populares, líderes, simpáticos, colaboradores y buenos estudiantes), presentarán puntuaciones significativamente superiores en rendimiento académico en la asignatura de matemáticas que los estudiantes nominados negativamente por sus iguales (rechazados-agresivos, rechazados-tímidos, olvidados, peleones, obedientes-se dejan mandar); los estudiantes nominados positivamente por sus iguales presentarán puntuaciones significativamente superiores en rendimiento académico en la asignatura de lengua castellana que los estudiantes nominados negativamente por sus iguales; los estudiantes nominados positivamente por sus iguales presentarán puntuaciones significativamente superiores en rendimiento académico medio que los estudiantes nominados negativamente por sus iguales; y los tipos sociométricos resultarán un predictor significativo del rendimiento en las asignaturas de matemáticas, lengua castellana y del rendimiento académico medio.
Método
Participantes
Se realizó un muestreo aleatorio por conglomerados (zonas geográficas de la Región de Murcia y la provincia de Alicante: centro, norte, sur, este y oeste). Con el fin de que todas las zonas geográficas estuvieran representadas, se seleccionaron aleatoriamente entre uno y tres centros por zona en función de la población, computándose en total 20 centros de áreas rurales y urbanas (14 públicos y seis privados). Una vez determinados los centros del estudio, se seleccionaron aleatoriamente cuatro aulas computándose aproximadamente 120 sujetos por centro.
El total de sujetos reclutados fue 1,594 estudiantes de 1° a 4° de ESO (error muestral = 0.02), de los que 116 (7.28%) fueron excluidos por errores u omisiones en sus respuestas o por no obtener por escrito el consentimiento informado de los padres para participar en la investigación y 129 (8.09%) fueron excluidos por ser extranjeros con importantes déficit en el dominio de la lengua española. Por tanto, la muestra definitiva se compuso de 1,349 estudiantes (697 chicos y 652 chicas), con un rango de edad de 12 a 16 años (M = 13.81; DT = 1.35). El 86.30% de los estudiantes fueron no repetidores. La composición étnica de la muestra fue la siguiente: 88.9% españoles, 6.34% hispanoamericanos, 3.37% resto de Europa, 0.75% asiáticos y 0.64% árabes. La distribución de los sujetos por sexo y curso académico fue la siguiente: 386 en 1° de ESO (203 chicos y 183 chicas), 325 en 2° de ESO (173 chicos y 152 chicas), 318 en 3° de ESO (172 chicos y 146 chicas) y 320 en 4° de ESO (149 chicos y 171 chicas). Por medio de la prueba Chi-cuadrado de homogeneidad de la distribución de frecuencias, se comprobó que no existían diferencias estadísticamente significativas entre los ocho grupos de sexo x curso (χ2 = 4.53; p = .21).
Instrumentos
Tipos sociométricos: test de nominación sociométrica
El test sociométrico es un instrumento que permite descubrir las formas de interacción de los individuos dentro de los grupos y revelar la estructura del grupo con el fin de identificar personas preferidas, rechazadas e ignoradas. así como figuras líderes, cooperativas, conflictivas, etc. El método sociométrico de nominación se basa en las medidas de Moreno (1934), la atracción y la repulsión, plasmadas en medidas de elección y rechazo, y se clasifican mediante las dimensiones de preferencia social e impacto social, propuestas por Peery (1979). Teniendo en cuenta estas dos dimensiones ortogonales y mediante técnicas estadísticas los sujetos pueden ser identificados como preferidos, rechazados, ignorados, controvertidos y medios.
Este trabajo se centró en el análisis de sujetos preferidos-populares, rechazados (rechazados-agresivos y rechazados-tímidos) e ignorados-olvidados, ya que son éstos los que agrupan el mayor número de alumnos (García-Bacete, 2007) y, a su vez, representan el mejor (preferidos) y peor ajuste social (rechazado e ignorados) en el contexto académico. Además, se analizaron las distintas categorías conductuales que pueden aparecer dentro de un grupo social: líder, simpático, colaborador, peleón, pasivo-inhibido y buen estudiante. Se empleó el procedimiento de nominación probabilística de tres elecciones inter-género, considerado como el más adecuado y ajustado en pruebas de nominación sociométrica (García-Bacete, 2007). La identificación sociométrica de los estudiantes se realizó mediante el Programa Socio (González, 1990) que permite obtener los límites inferiores y superiores de las nominaciones positivas recibidas y de las nominaciones negativas recibidas para un grupo o clase de alumnos. Dicho procedimiento ha alcanzado una alta validez discriminante en alumnos de 4° Primaria, encontrando un 80% de acuerdo entre la identificación conductual y la sociométrica (García-Bacete, 2006).
Rendimiento académico
Esta variable fue medida mediante las calificaciones académicas proporcionadas por los profesores en las asignaturas de lengua castellana y matemáticas. Además, se tuvo en cuenta el rendimiento académico medio. Para la realización de los análisis estadísticos, las calificaciones en lengua castellana, matemáticas y rendimiento medio fueron operacionalizadas en dos categorías: (a) alto rendimiento académico: aquellos alumnos que obtuvieran una puntuación en las calificaciones de 8 o más puntos, en las respectivas asignaturas; y (b) bajo rendimiento académico: aquellos alumnos que hubiesen obtenido una calificación por debajo de 5 puntos en lengua castellana, matemáticas y rendimiento medio. Muchos de los trabajos empíricos previos consideran la variable rendimiento como continua. Sin embargo, en este estudio se ha tratado como categórica en las regresiones logísticas (alto versus bajo rendimiento).
Procedimiento
Se llevó a cabo una entrevista con los directores y orientadores de los centros participantes para exponer los objetivos de la investigación, describir los instrumentos de evaluación, solicitar permiso y promover su colaboración. Posteriormente, se celebró una reunión con los padres para explicarles el estudio y solicitar el consentimiento informado por escrito autorizando a sus hijos a participar en la investigación.
Los cuestionarios fueron contestados de forma colectiva y voluntaria en el aula, asignando previamente un número de identificación a las hojas de respuesta entregadas a cada sujeto, las cuales fueron posteriormente corregidas mediante ordenador. A continuación, se leyeron en voz alta las instrucciones, enfatizando la importancia de no dejar ninguna pregunta sin contestar. Los investigadores estuvieron presentes durante la administración de las pruebas para aclarar posibles dudas y verificar la administración independiente por parte de los participantes.
Análisis estadísticos
La identificación sociométrica de los estudiantes se realizó mediante el Programa Socio (González, 1990) que permite obtener los límites inferiores y superiores de las nominaciones positivas recibidas (LI (Np) y LS (Np)) y de las nominaciones negativas recibidas (LI (Nn) y LS (Nn)) para un grupo o clase de alumnos, a través de los cálculos de la probabilidad binomial, con el fin de encontrar el valor de la prueba t asociado a una asimetría determinada y un nivel de probabilidad menor que .05 (tablas de Salvosa). La identificación se consigue aplicando los siguientes criterios: Preferidos = Np ≥ LS (Np) y Nn < M (Nn), Rechazados = Nn ≥ LS (Nn) y Np < M (Np), e Ignorados = Np ≤ 1 y Nn < M (Nn).
Con el objetivo de analizar la relación entre los tipos sociométricos y rendimiento académico se llevaron a cabo: (a) pruebas t de student de diferencias de medias para las calificaciones en matemáticas, lengua castellana y medias de estudiantes según los tipos sociométricos y (b) pruebas F (ANOVA) de diferencias de medias entre grupos en rendimiento académico según los tipos sociométricos.
Debido al elevado tamaño muestral del estudio, las pruebas t de student y la razón F (ANOVA), pueden detectar erróneamente diferencias estadísticamente significativas. Por esta razón se incluyó el índice d (diferencia media tipificada para la prueba F y t y tamaño del efecto de diferencias de prevalencias) propuesto por Cohen (1988), que permite valorar la magnitud o el tamaño del efecto de las diferencias halladas. La interpretación del tamaño del efecto resulta sencilla: valores menores o iguales a .20 indican un tamaño del efecto muy pequeño, entre .20 y .49 pequeño, entre .50 y .79 moderado y mayores de .80 un tamaño del efecto grande (Cohen, 1988).
El establecimiento de ecuaciones predictoras de los tipos sociométricos se realizó mediante la técnica estadística de regresión logística, siguiendo el procedimiento de regresión por pasos hacia delante basado en el estadístico de Wald, En el análisis de regresión logística se presentan los coeficientes de cada variable en la ecuación de regresión y los estadísticos alcanzados por los modelos a la hora de clasificar a los sujetos según el grupo al que pertenecen (e.g., popular, rechazado agresivo, rechazado tímido, olvidado, líder, humor, colaborador, peleón, obediente y buen estudiante/buenas notas). El modelado logístico permite estimar la probabilidad de que ocurra un evento, suceso o resultado (e.g., bajo rendimiento académico), frente a que no ocurra, en presencia de uno o más predictores (e.g., tipo sociométrico de rechazado agresivo).
Esta probabilidad es estimada mediante el estadístico denominado odd ratio (OR), que se interpreta de la siguiente forma: OR > 1 indica predicción en sentido positivo, OR < 1 indica predicción en sentido negativo, mientras que el valor 1 indica que no hay predicción (De Maris, 2003).
Resultados
En la Figura 1 se presentan a nivel gráfico las diferencias en las puntuaciones de rendimiento académico de los estudiantes en función de los tipos sociométricos y las categorías conductuales analizadas. Diferencias en las puntuaciones de rendimiento académico de los estudiantes en función de los tipos sociométricos y categorías conductuales.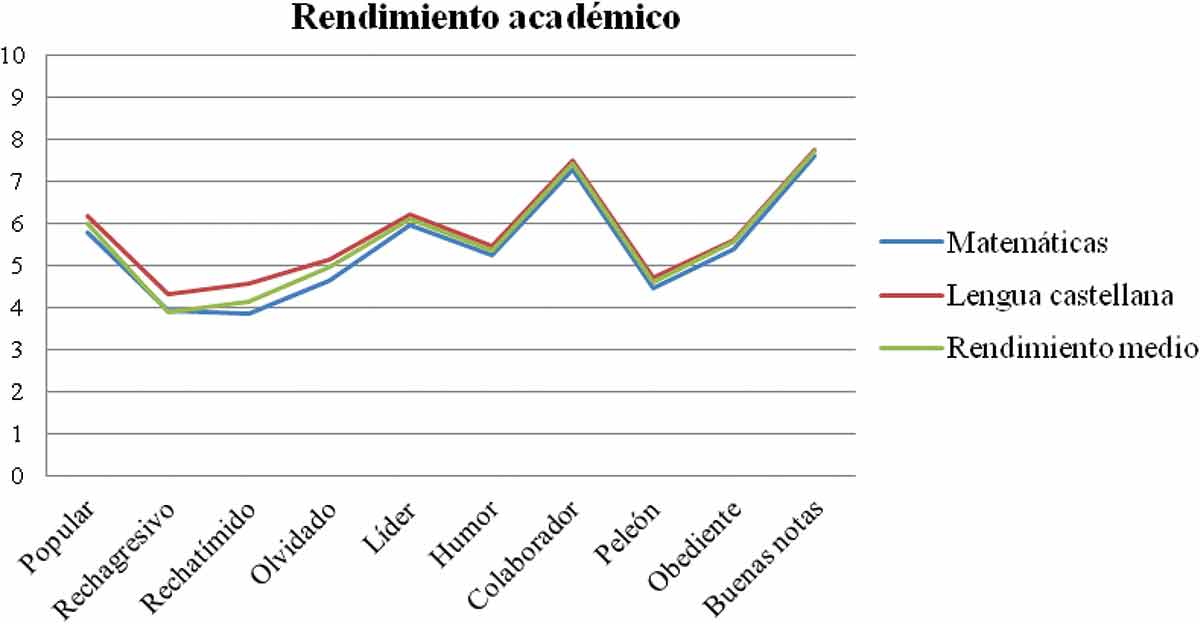
Rendimiento en matemáticas
La Tabla 1 presenta las diferencias entre estudiantes según los tipos sociométricos y las categorías conductuales en relación al rendimiento académico (rendimiento académico en matemáticas, en lengua castellana y rendimiento medio).
Diferencias en las puntuaciones de rendimiento académico de los estudiantes en función de los tipos sociométricos y categorías conductuales.
Rendimiento en lengua castellana
La Tabla 1 muestra que se encuentran puntuaciones medias significativamente más altas en el grupo de estudiantes populares frente a no populares, en el grupo de no rechazados-agresivos frente a rechazados-agresivos, en el grupo de no rechazados-tímidos frente a rechazados-tímidos, en el grupo de no olvidados frente a olvidados, en el grupo de líderes frente a no líderes, en el grupo de colaboradores frente a no colaboradores, en el grupo de no peleones frente a peleones y en el grupo de buenas notas frente a los que no tienen buenas notas. El tamaño del efecto de estas diferencias es de magnitud pequeña en el grupo de populares, no olvidados y líderes (d < 0.50), de magnitud moderada en el grupo de no rechazados-agresivos, no rechazados-tímidos y no peleones (d ≥ 0.50) y de magnitud grande en el grupo de colaboradores y buenas notas (d ≥ 0.80).
Rendimiento académico medio
La Tabla 1 indica que se encuentran puntuaciones medias significativamente más altas en el grupo de estudiantes populares frente a no populares, en el grupo de no rechazados-agresivos frente a rechazados-agresivos, en el grupo de no rechazados-tímidos frente a rechazados-tímidos, en el grupo de no olvidados frente a olvidados, en el grupo de líderes frente a no líderes, en el grupo de no simpáticos frente a simpáticos, en el grupo de colaboradores frente a no colaboradores, en el grupo de no peleones frente a peleones y en el grupo de buenas notas frente a los que no tienen buenas notas. El tamaño del efecto de estas diferencias es de magnitud pequeña en el grupo de populares, no olvidados, líderes y no simpáticos (d < 0.50), de magnitud moderada en el grupo de no rechazados-tímidos y no peleones (d ≥ 0.50) y de magnitud grande en el grupo de no rechazados-agresivos, colaboradores y buenas notas (d ≥ 0.80).
Comparación de puntuaciones entre grupos en rendimiento académico en función de los tipos sociométricos y categorías conductuales.
Regresiones logísticas
Los análisis de regresión logística binaria mostraron que los tipos sociométricos y algunas categorías conductuales fueron variables significativas para la predicción del rendimiento académico. A partir de la muestra analizada fue posible crear nueve modelos logísticos que pronosticaron la probabilidad de ser elegido como popular, rechazado-agresivo, rechazado-tímido, olvidado, líder, simpático, peleón, colaborador y buen estudiante a través de la variable rendimiento académico. El rendimiento académico (rendimiento en lengua castellana, en matemáticas y rendimiento académico medio) fue incluido como variable predictora en todos los modelos logísticos creados.
La proporción de casos clasificados correctamente por los modelos logísticos osciló según el tipo sociométrico analizado: el modelo de tipo sociométrico popular permite una estimación correcta del 85.3% de los casos (R 2 Nagelkerke = .02), el modelo de tipo sociométrico rechazado-agresivo permite una estimación correcta del 97.2% de los casos (R 2 Nagelkerke = .08), el modelo de tipo sociométrico rechazado-tímido permite una estimación correcta del 98.3% de los casos (R 2 Nagelkerke = .05), el modelo de tipo sociométrico olvidado permite una estimación correcta del 95.1% de los casos (R 2 Nagelkerke = .02), el modelo de categoría conductual líder permite una estimación correcta del 75% de los casos (R 2 Nagelkerke = .04), el modelo de categoría conductual simpático permite una estimación correcta del 73.8% de los casos (R 2 Nagelkerke = .01), el modelo de categoría conductual colaborador permite una estimación correcta del 82.3% de los casos (R 2 Nagelkerke = .40), el modelo de categoría conductual peleón permite una estimación correcta del 75.2% de los casos (R 2 Nagelkerke = .11) y el modelo de categoría conductual buenas notas permite una estimación correcta del 85.5% de los casos (R 2 Nagelkerke = .55).
Resultados derivados de la regresión logística binaria para la probabilidad de ser nominado por los iguales en función del rendimiento académico.
Nota. B = coeficiente; ET = error estándar; p = probabilidad; OR = odds ratio; IC = intervalo de confianza al 95%.
Discusión
El objetivo de este estudio fue analizar la relación entre los tipos sociométricos y el rendimiento académico (en matemáticas, lengua castellana y rendimiento medio) en una muestra de estudiantes de ESO, ampliando así los resultados hallados en la revisión de la bibliografía. También se ha ampliado en el presente trabajo el número de tipos sociométricos (sujetos preferidos-populares, rechazados, rechazados-agresivos, rechazados-tímidos e ignorados-olvidados), analizando, además, diversas categorías conductuales que pueden aparecer dentro de un grupo social: líder, simpático, colaborador, problemático-agresivo, pasivo-inhibido y buen estudiante.
Por una parte, los resultados señalaron que el grupo de estudiantes nominados positivamente por sus compañeros como populares, no rechazados-agresivos, no rechazados-tímidos, no olvidados, líderes, colaboradores, no peleones y con buenas notas, obtuvieron puntuaciones significativamente más altas en rendimiento en matemáticas, en lengua castellana y en rendimiento académico medio que los estudiantes nominados negativamente como no populares, rechazados-agresivos, rechazados-tímidos, olvidados, no líderes, no colaboradores, peleones y los que no tienen buenas notas, confirmándose de esta forma la primera, la segunda y la tercera hipótesis del presente trabajo. Estos resultados van en la misma línea de estudios anteriores que relacionan la aceptación por parte de los iguales con un mejor desempeño académico (Graziano et al., 2010; Meijs et al., 2010; Pérez-Sánchez & Castejón, 1996; Plazas et al., 2006; Wentzel, 2003; Wentzel & Asher, 1995). Estas diferencias resultaron de magnitud grande (d ≥ 0.80) para los grupos de estudiantes nominados como colaboradores y los que obtienen buenas notas en el caso del rendimiento en matemáticas y en lengua castellana, y para los grupos de estudiantes nominados como no rechazados-agresivos, colaboradores y buenas notas en el caso del rendimiento académico medio. Los análisis entre los grupos mostraron que el grupo de estudiantes populares presentó puntuaciones medias significativamente más altas en rendimiento en matemáticas, que los estudiantes rechazados-agresivos, rechazados-tímidos y olvidados. En cuanto al rendimiento en lengua castellana, los estudiantes populares presentaron puntuaciones medias significativamente más altas que los estudiantes rechazados-agresivos, rechazados-tímidos y olvidados. Respecto al rendimiento académico medio, los estudiantes populares presentaron puntuaciones medias significativamente más altas que los estudiantes rechazados-agresivos, rechazados-tímidos y olvidados. En cuanto a las categorías conductuales, únicamente los estudiantes colaboradores presentan puntuaciones medias significativamente más altas en rendimiento académico medio, que los estudiantes peleones.
Los análisis de regresión logística permitieron crear nueve modelos predictivos con un alto porcentaje de casos acertados (75–97.2%), a partir de los cuales se constató la relación predictiva y recíproca que mantienen los tipos sociométricos y categorías conductuales y el rendimiento académico. Tal y como se indicó en la cuarta hipótesis, los tipos sociométricos y algunas categorías conductuales resultaron ser un predictor significativo del rendimiento académico ya que los estudiantes nominados positivamente por sus compañeros (populares, líderes, colaboradores y buenos estudiantes) presentaron mayor probabilidad de tener un alto rendimiento académico (en matemáticas, lengua castellana y rendimiento medio) que los estudiantes nominados negativamente por sus compañeros (rechazados-agresivos, rechazados-tímidos, olvidados y peleones).
Los resultados de este estudio coinciden con los hallazgos de diversas investigaciones transversales y longitudinales que han revelado que la conducta prosocial se relaciona positiva y significativamente con la autoeficacia académica (Bandura, Caprara, Barbaranelli, Gerbino, & Pastorelli, 2003; Garaigordobil, Cruz, & Pérez, 2003; Inglés, Pastor, Torregrosa, Redondo, & García-Fernández, 2009), y numerosas investigaciones sobre conducta prosocial y tipos sociométricos señalan que los adolescentes que presentan niveles significativamente más elevados en conducta prosocial tienden a ser más populares entre sus compañeros y a obtener mejores resultados académicos, mientras que los que actúan de manera agresiva y antisocial tienden a ser rechazados y a rendir menos o fracasar en la escuela (Buhs, Ladd, & Herald, 2006; Inglés et al., 2009; Jiménez, 2003; Loveland, Lounsbury, Welsh, & Buboltz, 2007; Lozano & García, 2000; Lubbers, Van der Werf, Snijders, Creemers, & Kuyper, 2006; Torregrosa et al., 2012; Warden & Mackinnon, 2003; Wentzel & Caldwell, 1997; Wentzel & Watkins, 2002; Zettergren, 2003).
Además, los resultados de este estudio ponen de relieve, por una parte, la utilidad de los métodos sociométricos en las investigaciones realizadas en centros de enseñanza, entre otros motivos, por su fácil aplicación y su validez empírica (Muñoz Tinoco et al. 2008) y, por otra parte, por la relación de los tipos sociométricos con diferentes variables cognitivo-motivacionales, sociales y su influencia sobre el rendimiento académico. Por tanto, profesores y psicopedagogos podrían emplear los tipos sociométricos como una herramienta para identificar posibles déficits en habilidades interpersonales. Asimismo, los resultados descritos en este estudio podrían contribuir en el asesoramiento al profesorado en relación al desarrollo de estrategias e intervenciones que eliminen las barreras al aprendizaje en el aula. La evidencia ha puesto de manifiesto que el desarrollo de actividades de feedback hacia el profesorado les capacita para mejorar sus estrategias de enseñanza y, consecuentemente, mejorar los resultados de los estudiantes (Rosenfield, Silva, & Gravois, 2008).
A nivel práctico, los resultados de esta investigación apuntan a trabajar con el profesorado y las administraciones para crear ambientes educativos y climas escolares facilitadores del aprendizaje y que promocionen el desarrollo sociopersonal del alumnado (Pertegal, Oliva, & Hernando, 2010), superando los obstáculos que conducen a la discriminación y adecuando la educación a las nuevas exigencias sociales (Viguer & Solé, 2012).
Esta investigación no está exenta de limitaciones. En primer lugar, aunque el muestreo empleado garantiza la representatividad de la muestra reclutada respecto a la población diana, los resultados hallados en esta investigación no pueden generalizarse a estudiantes españoles de otros niveles educativos (educación infantil, educación primaria, bachillerato y educación superior). Futuras investigaciones deberían confirmar si los resultados hallados en ESO difieren o se mantienen en otros niveles educativos. En segundo lugar, tampoco resultaría adecuado establecer generalizaciones de los hallazgos a estudiantes españoles de ESO diagnosticados con trastornos del aprendizaje o trastornos psicopatológicos (por ejemplo, esquizofrenia, depresión, etc.), aspectos que pueden alterar claramente el comportamiento social y académico de los estudiantes. Además, teniendo en cuenta el principio de especificidad situacional que caracteriza el comportamiento social, difícilmente los resultados obtenidos podrían extrapolarse a estudiantes de Educación Secundaria de otras culturas y etnias. En tercer lugar, sería interesante que futuros trabajos incluyeran distintas fuentes de evaluación de la conducta social (autoinformes, iguales, profesores y padres) para analizar la concordancia inter-fuentes. Futuras investigaciones deberían analizar los distintos grupos de estudiantes ignorados y rechazados (Estévez, Herrero, Martínez, & Musitu, 2006) así como las categorías sociométricas de controvertidos y medios, pues la omisión de estos análisis puede generar resultados incompletos a la hora de clasificar a los alumnos en un determinado tipo sociométrico. Sería aconsejable que futuros trabajos utilicen diseños longitudinales a fin de aportar datos más concluyentes respecto a las relaciones de influencia entre estas variables. Finalmente, próximos estudios deberían estudiar si los resultados hallados en esta investigación se confirman utilizando otros indicadores del rendimiento académico tales como los tests estandarizados de rendimiento en diversas materias curriculares.
Footnotes
This project was made possible through Proyecto SEJ 2004-07311/EDUC, belonging to the Plan Nacional de Investigación Científica, Desarrollo e Innovación Tecnológica del MEC, granted to the second author. / Este trabajo ha sido realizado a través del Proyecto SEJ 2004-07311/EDUC perteneciente al Plan Nacional de Investigación Científica, Desarrollo e Innovación Tecnológica del MEC concedido al segundo autor.