
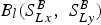
Abstract
In laser beam welding, when the width of weld seam is less than 0.1 mm, present vision sensor-based measurements can barely obtain the seam width and seam position stably and reliably. A seam measuring method based on narrow depth of field (NDOF) is proposed in this article, which aims to detect this kind of narrow and small weld seam with great accuracy. This measurement system consists of a multiple optical magnifier, a Charge-Coupled Device/Complementary Metal Oxide Semiconductors (CCD/CMOS) camera, and an external light-emitting diode lighting unit. First, the principle of the NDOF method is explained. Second, key features of weld seam are extracted by image-processing algorithm. Lastly, the result of experiment reveals that the NDOF method can meet the demanded detection precision. Measurement accuracy for the seam width and seam position is 6 and 8 μm, respectively.
Introduction
When two pieces of plates whose thicknesses are less than 2 mm are joined together for laser welding, both width and the offset of the seam should be no more than 0.1 mm. 1 , 2 It requires great assembly quality for this kind of butt joint welding. The diameter of the laser beam spot is about 0.3 mm under this welding condition. In the welding process, the focus of laser spot should exactly follow the centre of the trajectory line of the joint seam. Meanwhile, according to welding procedure, there should be appropriate defocusing amount between the spot of the laser beam and the surface of the seam. The defocusing amount can be either positive or negative. Therefore, to obtain excellent welding quality, the width and centre of the seam, and the normal vector of its local surface should be precisely measured before welding.3-6
Machine vision technology has long been used to inspect welding surfaces and adjust the moving path of a robot during laser welding. These studies have brought about many improvements in the automation of laser welding. 7 However, there is very little published works put effort on micro butt joint laser welding with stringent accuracy demand.
A robust welding seam extraction algorithm was proposed by Chen et al. 8 for two-dimensional weld seam by using vision sensor. It aimed at extracting single pixel wide weld paths, but the measurement accuracy and welding speed were not mentioned. The seam detection for weld seam with width no less than 0.2 mm was investigated by Lee and Na 9 The position of the focal point could be kept at the centreline of the seam with a maximum error of 80 μm when the welding speed was under 1 mm s−1. Xu et al. 10 introduced the canny edge detection algorithm and PID algorithm for seam detection, which aimed at real-time seam-tracking for butt joint. The experiment data shown that the deviation range from the torch to the seam centre was with-in ±0.169 mm at a welding speed of 3 mm s−1. This method was only applicable to plane weld seam. The task frame conducted by Ming et al. 11 was finding tangent, normal, and bi-normal of the three-dimensional weld seam. The average accuracy of the whole system, including the registration error between the robot and the vision system, was about 0.48 mm. Graaf et al. 12 summarised that the seam-tracking accuracy requirement was less stringent for robotic arc welding than for laser welding. It was indicated that detection accuracies down to 0.2 mm had to be achieved for laser welding. The simulation results demonstrated that the tracking accuracy (0.1–0.5 mm) could be reached. 12 The above few researchers have put their efforts on improving the welding accuracy and welding speed with specific experimental data. However, with regard to weld seam with width no more than 0.1 mm, extensive research is required to meet the accuracy and efficiency demands of this kind of seam.
Most recently, Gao and Chen 13 aimed at detecting micro gap weld (gap width is less than 0.05 mm) using a magneto-optical sensor for butt joint laser welding. It was argued that the micro gap seam was too narrow to measure using the principle of optical triangulation; therefore, the magneto-optical method was adopted. The centreline position accuracy that could be achieved by this method was 0.083 mm at a welding speed of 3 mm s−1 and it was only applicable to magnetic materials. With regard to a weld-assembly where the weld gap is less than 0.1 mm, the reflected light deforms slightly. The grey value of seam image captured by an ordinary camera changes a little around the seam. That is why most current optical triangulation-based vision technique of weld seam detection is just about effective when the width or the offset of the seam is larger than 0.1 mm.11, 14-16
Optical magnifier lens can observe micro gap weld but the depth of field is too shallow. The distance between weld seam surface and lens fluctuate because of heat distortion and mechanism vibration during welding process. Therefore, the weld image may probably become blurry or is out of the visual field during welding process. Optical magnifier lens is rarely used in seam detection for this reason, and there is no other effective automatic detecting method for micro gap butt joint at present. Therefore, a novel seam measurement method based on narrow depth of field (NDOF) for laser welding is proposed. It takes the advantage of the optical magnifier and solves the problem brought by the NDOF.
In addition, the efficiency of the image-processing algorithm is of great importance to laser-based machine vision system. 17 This issue is always critical because this algorithm is the main factor that limits the performance of the laser-based machine vision system. Algorithms that are currently available for the detection of seam feature of the weld joint are mainly pattern recognition, Canny edge detection, Hough Transform and line regression. These algorithms can extract seam feature in a robust and precise manner although there are disturbances such as fume, laser light and splash in the welding process. However, these algorithms for weld seam feature detection are computationally intensive and time-consuming, which greatly limits the productivity of the welding process.8, 10, 18-20 Thus, to tackle these challenges, a NDOF-based seam detection algorithm is developed in this study. The centre position and width of the seam weld, along with the normal vector of its local surface can be detected with rigorous accuracy at a fast welding speed.
The principle of measurement based on NDOF for laser welding
According to principles of imaging, if focal length f = 50 mm, aperture value of camera F = 1.4 and optical magnification factor is 4, a clear weld seam image could be obtained when the object distance is in the range of 62.460–62.539 mm. On the contrary, the weld seam image would be blurry if the object is out of this area. As it is shown in Fig. 1, this area is called NDOF area in this article, and let it denote Ω. Plane Σ is perpendicular to optical axis and it passes through the centre of the area Ω. Σ is the centre plane of the NDOF area. Figure 1 shows the theory of seam measurement based on NDOF for laser welding. This is especially designed to measure the geometric information of weld seam, which is tight or without misalignment.
The schematic diagram of the seam measurement method-based NDOF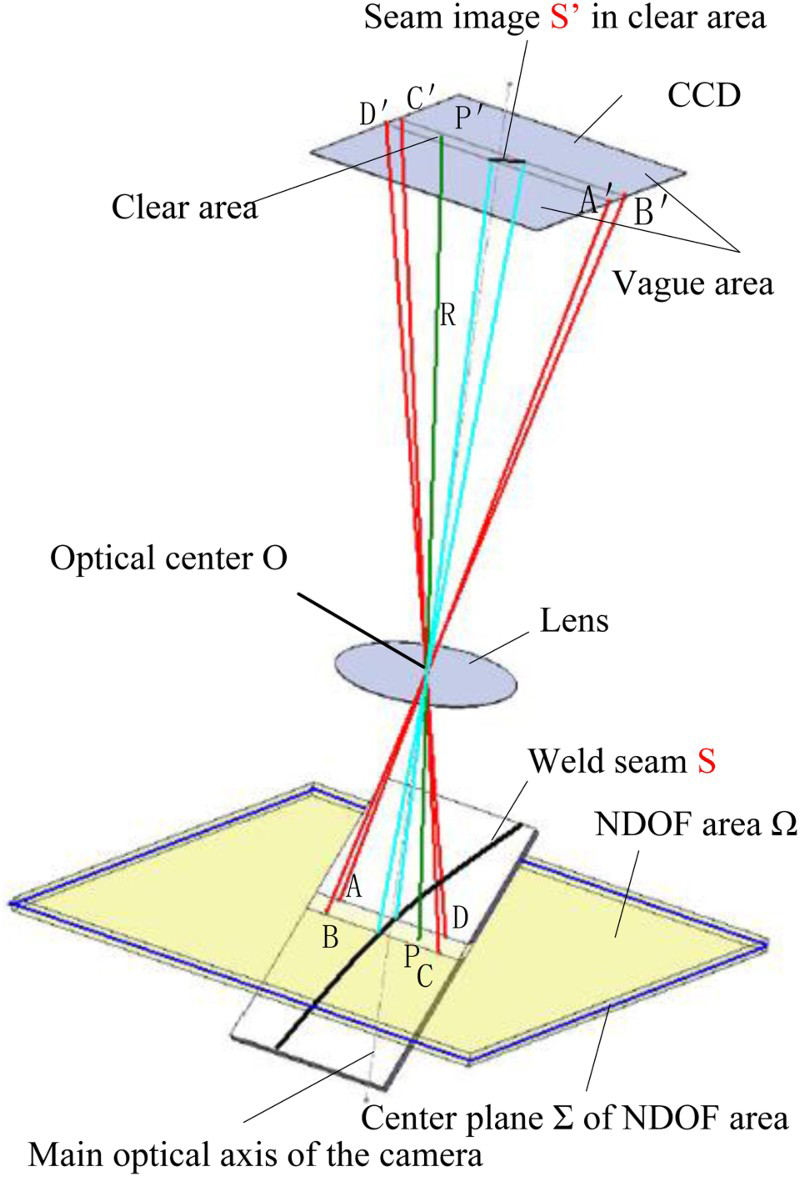
As shown in Fig. 1, the area ABCD is formed by the intersection of seam surface and the NDOF area Ω when a photo of the seam surface is taken. The intersection area ABCD can form a clear image A'B'C'D’, whereas the other area of the seam surface which is not intersected with the area Ω, cannot have a distinct image. As shown in Fig. 2, a photo is taken for the local area of the seam surface according to the above descriptions. The photo consists of three parts. The two sides of the photo are indistinct, which is in sharp contrast to the clear area in the centre. This clear area is formed by the intersection of the seam surface and the NDOF area Ω, that is, the area A'B'C'D’ described above.
The image of weld seam based on NDOF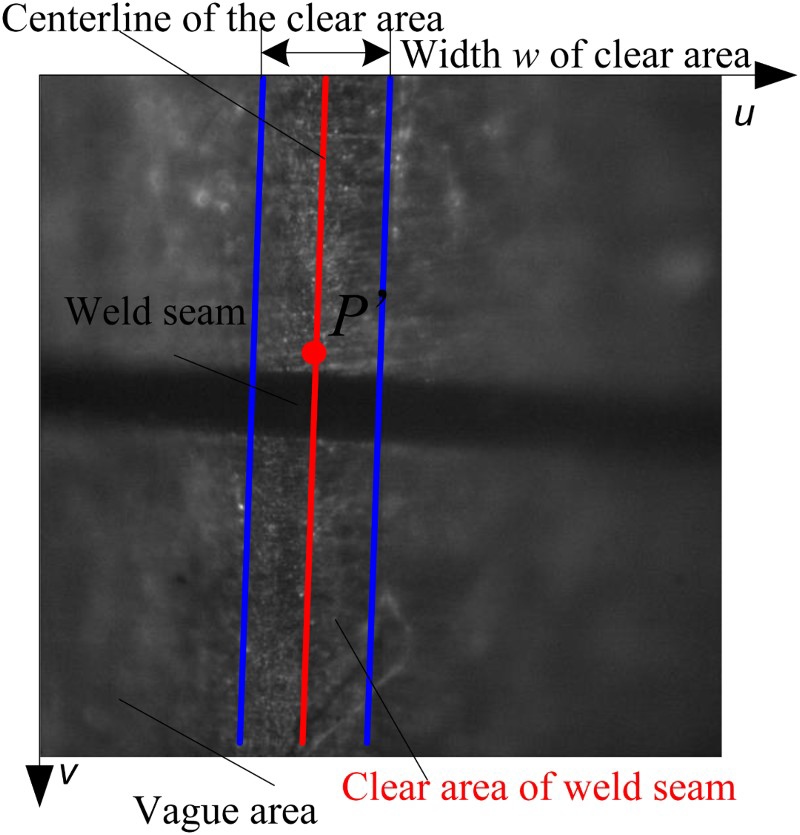
The size of the area that can be imaged is about 1.3 mm2 when optical magnification factor is 4 and the size of the photosensitive area of Charge-Coupled Device (CCD) is 5 mm2. Thus, it can be seen that the visual field is very small. The following condition can be assumed: (1) the local surface ABCD of the seam in the imaging area can be regarded as a tiny plane, (2) intersection line of the plane Σ and local surface of seam can be regarded as straight line, and its image is l, which is the centreline of the clear area in Fig. 2. Therefore, in Figs. 1 and 2, if there is a line R that passes through the optical centre of lens O and an arbitrary point on line l, only can this line R have one intersection point P with plane Σ. P is the space point on the intersection line of the plane Σ and local surface of seam, and it is corresponding to point P′.
Based on the above principles, the three-dimensional coordinate value of the points on the intersection line of the plane Σ and local surface of the seam can be obtained by photography affine transformation when the equation of the centreline l of the clear area in Fig. 2 is obtained. The three-dimensional machine coordinate value of other points on the seam surface can be calculated in the same manner when different photos of the seam are taken. The local surface of the seam can be regarded as a tiny plane when the distance of the two images is close enough. In this way, the approximate normal vector of this tiny plane can be obtained by planar surface fitting method to points on the seam. The centre and the width of the seam in the image can be calculated by image analysis when the image and the equation of the centreline l in Fig. 2 are obtained.
In Fig. 3, the structure of the measuring system is designed based on the theory of NDOF for laser welding. The system consists of CCD/Complementary Metal Oxide Semiconductors (CMOS) industrial camera, lens, and an exterior light-emitting diode (LED) lighting device. The camera is properly mounted so that the main optical axis has a certain angle with the local surface of the weld seam. Thus, as shown in Fig. 3, the plane Σ of the camera has an angle α with the local surface of the seam. Then, the clear area is visible in the image when the relative position between the camera and the seam is appropriately adjusted. The intersection line of the NDOF area Ω and the local surface of the seam is in the camera's range of vision, which is the rectangular area ABCD shown in Fig. 3.
The seam measurement system based on NDOF: a two-dimensional view and b three-dimensional view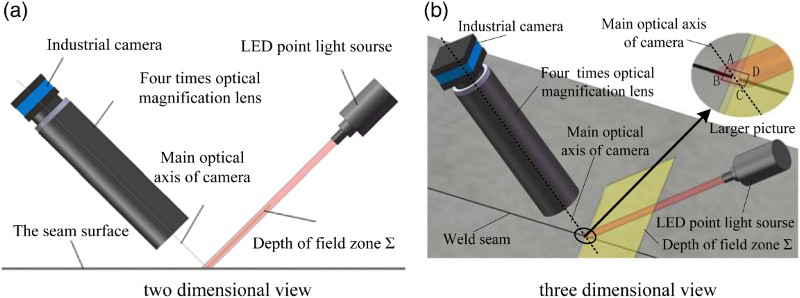
Overview of seam measurement algorithm based on NDOF
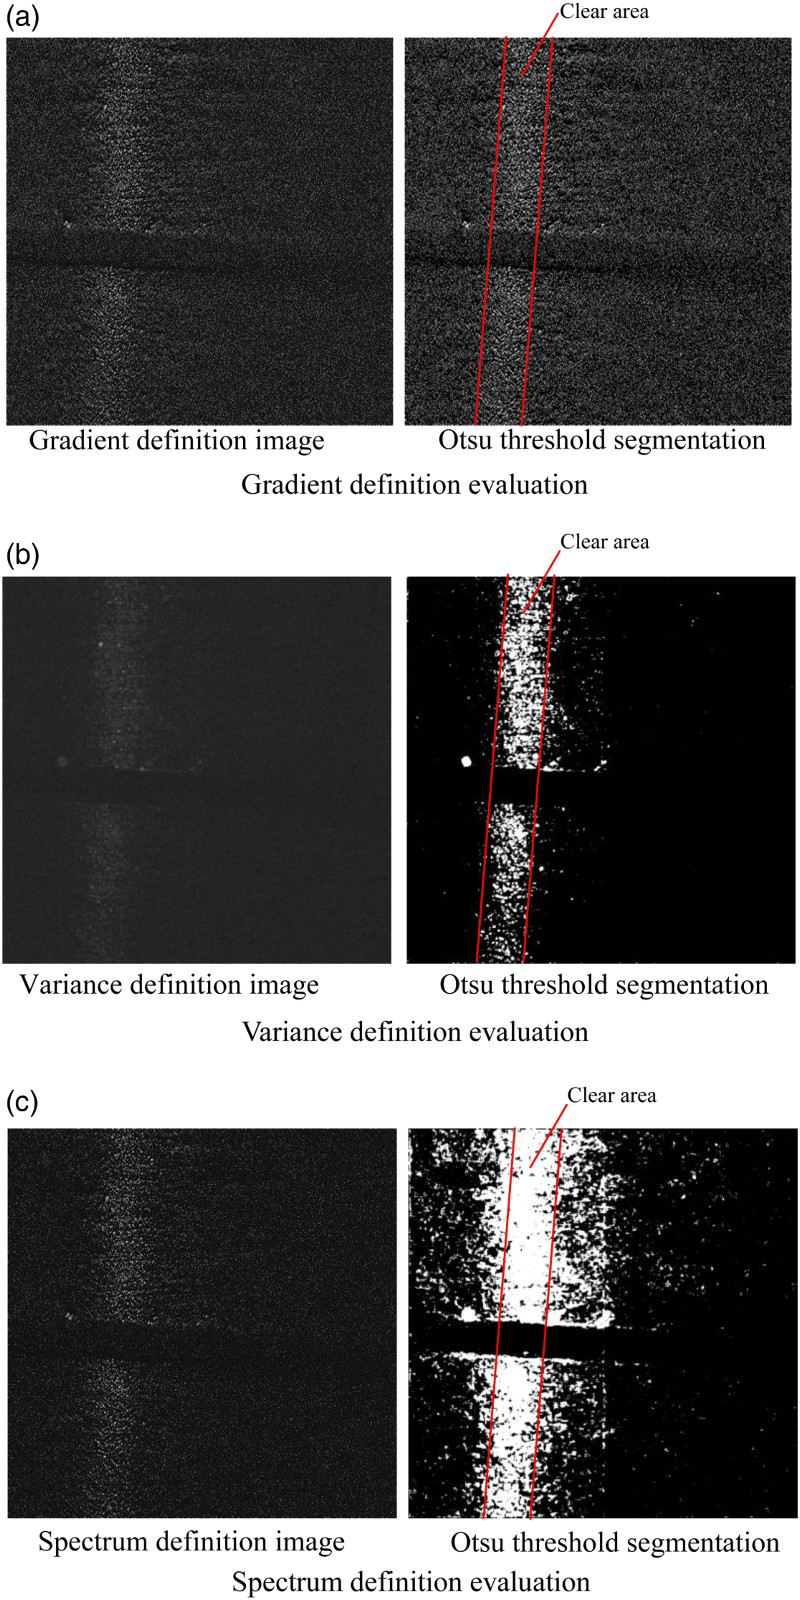
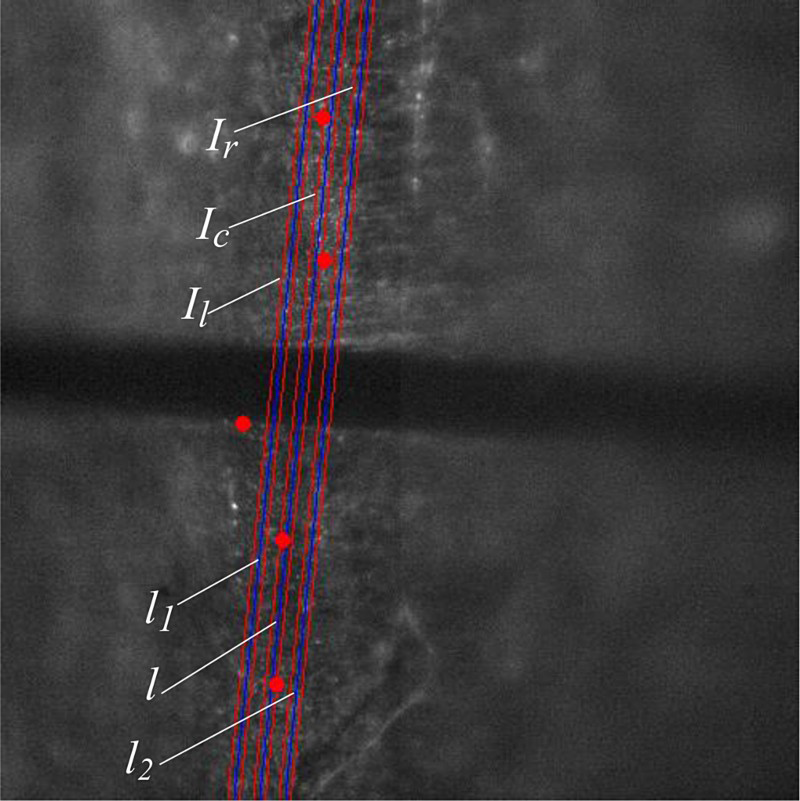
The main purpose of the image-processing algorithm is to extract the clear area, obtain the centreline l and compute the width, centre position, and the normal vector of weld seam. An overview of the weld seam detection algorithm is shown in Fig. 4. According to the seam measurement base on NDOF discussed in the above section, the NDOF images consist of a clear area and a blurry area as a result of the NDOF. Therefore, the clear area of the seam image is first extracted. As is shown in Fig. 2, the banded area between the two blue lines is the clear area. Second, centreline l of the clear area is obtained, which is marked by a red line in Fig. 2. Third, based on the centreline in the second step, the characteristic points of the seam are gained. Thus, the centre position and the width of the seam can be computed. Finally, the approximate normal vector of local surface of the seam can be calculated by planar surface fitting method to points on different centrelines. These centrelines are extracted, respectively, in different clear areas that are very close to each other.
Overview of NDOF-based seam detection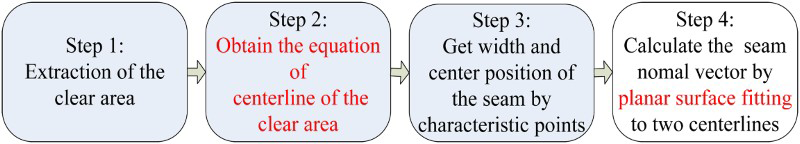
Extraction of the clear area by image definition evaluation method
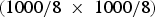
There are many ways of image definition evaluation, such as variance evaluation function, gradient evaluation function, spectrum evaluation function and so on. Which approach to take depends on the accuracy and efficiency requirement of the evaluation.
In this article, the
The comparison of different definition evaluation functions: a gradient definition evaluation, b variance definition evaluation, c spectrum definition evaluation pixels original seam image in Fig. 2 is divided into
 parts after greyscale processing. Each part that has
 pixels is evaluated by different definition equations. However, the evaluation results are not in the range (0,255). It is usually to bring the image into a range that is more familiar or normal to the sense by linear normalisation. After normalised to (0,255), each definition value is taken as the pixel value of every pixel in the corresponding part. After the image has been processed by definition evaluation function, Otsu threshold segmentation method is adopted to proceed further to separate the clear area from the vague area. The values of the high and low threshold can be automatically obtained by using Otsu algorithm, which is widely adopted in seam feature extraction.8, 10 Consequently, a
 pixels greyscale image is obtained when the divided parts are combined. This greyscale image is called definition grey image as shown in Fig. 5. Both the grey value and the definition evaluation value of the clear area are higher than the blurry area in Fig. 5.
The definition evaluation equation, which has good performance in both accuracy and efficiency, is of great importance to the extraction of the clear area. By comparing the different algorithms in Fig. 5, we can see that spectrum function is the best in accuracy, whereas the gradient function is the worst in accuracy. On the contrary, duo to the involvement of Fourier transform operation, the spectrum function is most time-consuming. To achieve fast real-time seam detection, both the accuracy and the complexity of these definition evaluation equation must be taken into account.
A large number of images based on NDOF have been collected and analysed by the above three evaluation functions, respectively. It indicates that there is a better result both in the running time of the algorithm and the accuracy of the definition evaluation when the variance evaluation function is adopted.
Extraction of centreline l of the clear area
As is shown in Fig. 5, the clear area of the seam image is a narrow-banded area that there is no need to analyse the whole image. Therefore, to reduce the amount of computation, five equidistant and horizontal-banded sub-images whose height and width are 64 pixels and M pixels, respectively, are extracted for analysis. Then, the definition of the sub-images is evaluated by variance function. Ostu threshold segmentation is applied to the variance images to further separate the clear area from the blurry area. To obtain the accurate centre points of clear area, points in each sub-image that deviate too far from the centre of the mass are removed. Finally, the centreline is obtained by linear fitting to centre of mass of the five sub-images. The complete processing flow chart of centreline extraction along with the processed seam images is shown in Figs. 6 and 7, respectively.
The flowchart of the centreline extraction The method of extracting centreline from the clear area: a original image, b sampling horizontally, c variance image, d Otsu threshold segmentation, e outlier removal, f linear fitting to centre points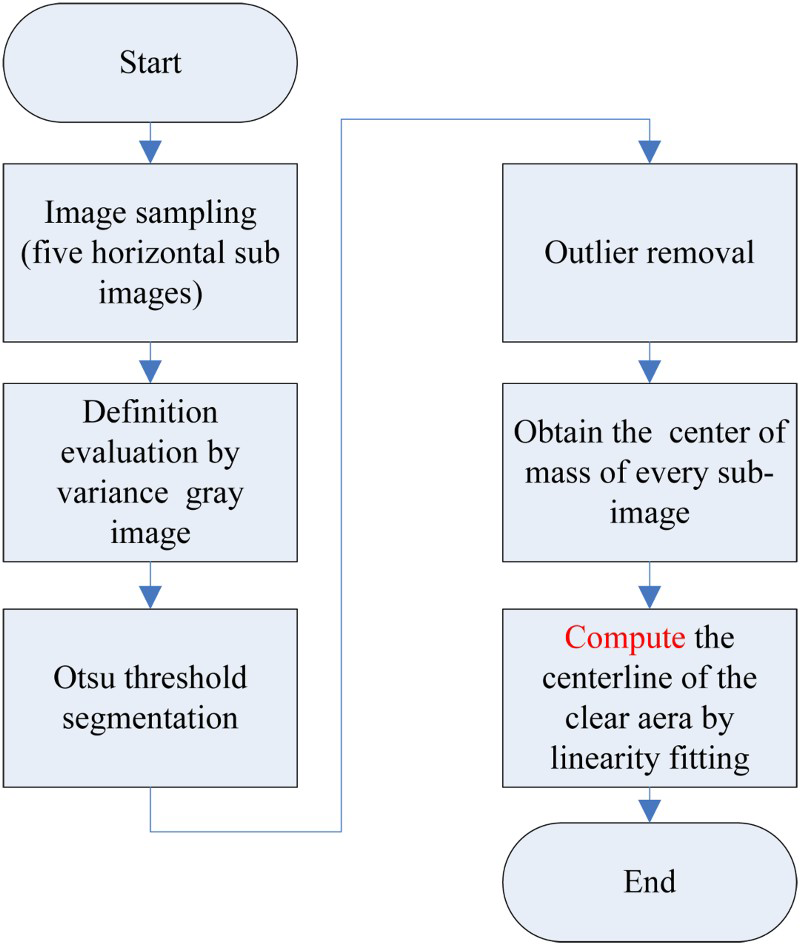
As is shown in Fig. 7
f, the coordinate OUV is defined in the seam image. The coordinates of the five points (
 ) can be obtained by calculating the centre of mass of every sub-image. Line l is the centreline of the clear area. Therefore, the approximate equation of the centreline l of the clear area in image coordinates OUV can be calculated in a linearity fitting to these five centre points by the least squares method. The linear equation of the centreline l is defined in the general form which is
 . However, in actual process, one of the calculated centre points may deviate far away from centreline by the impact of external factors. As shown in Fig. 7
f, the third horizontal-banded sub-image from the top is just the place, where the weld seam is located, where the calculated centre point
. However, in actual process, one of the calculated centre points may deviate far away from centreline by the impact of external factors. As shown in Fig. 7
f, the third horizontal-banded sub-image from the top is just the place, where the weld seam is located, where the calculated centre point
 is inaccurate. Therefore, to reduce the error, point
 should be removed because the distance from point
 to the calculated centreline
 is far too larger than the other four points. Then, the accurate equation of the centreline
 in image coordinates is obtained by the method of linear least square fitting to the remaining four points.
Extraction of the centre position and width of the weld seam
As shown in Fig. 5 b, the grey value of the seam is lower than the other places in the image. According to this characteristic, statistical methods for grey value are adopted to extract the centre and the width of the welding seam in the clear area.
In general, the clear area has about 160 pixels. Then, three-banded sub-images whose width are equally 16 pixels are extracted for analysis as illustrated in Fig. 8. These three banded sub-images are extracted by two steps. First,
Extraction of three banded sub-images The grey value histogram Waveforms of the grey value Calculation of seam width and
and
 are obtained by moving the calculated centreline
 parallel to the left and the right side by 64 pixels, respectively. Second, when each of these three lines is taken as centreline of a banded area, three-banded sub-images with a width of 16 pixels each can be extracted consequently. These three-banded sub-images, which are called
 ,
,
 and
and
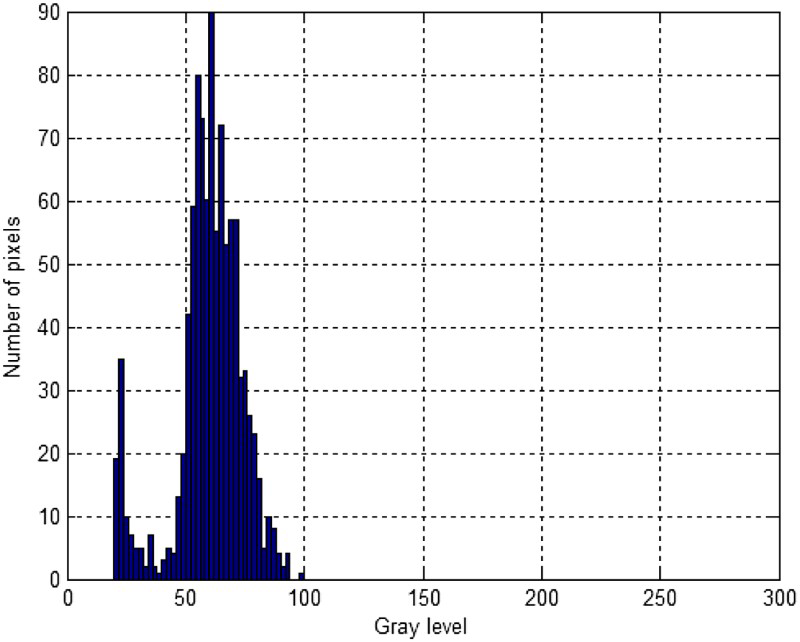
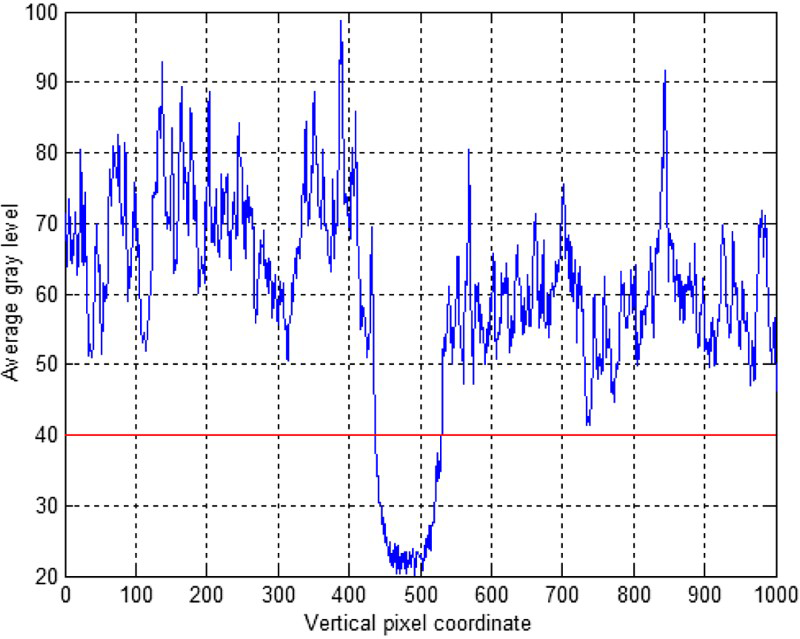
 , respectively, in this article, are shown in Fig. 8. In addition, as the grey value of the seam is lower than the other place in the image, statistical method for grey value histogram is carried out on the three-banded images, respectively, which is shown in Fig. 9. The grey value of most pixels is above 40. According to waveforms of the grey value in Fig. 10, when the threshold is 40, the seam boundary is extracted at a high degree of differentiation in vertical direction. In this manner, as shown in Fig. 11, the boundary points of weld seam in the three-banded images can be obtained.
 ,
,
 and
and
 are the upper boundary points.
 ,
,
 and
and
 are the bottom boundary points. Similarly,
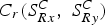
 ,
,
 and
and
 are centre points of the seam in the three-banded images
 ,
,
 and
and
 , respectively. Accordingly, the coordinates of the seam centre is presented as the following expression:
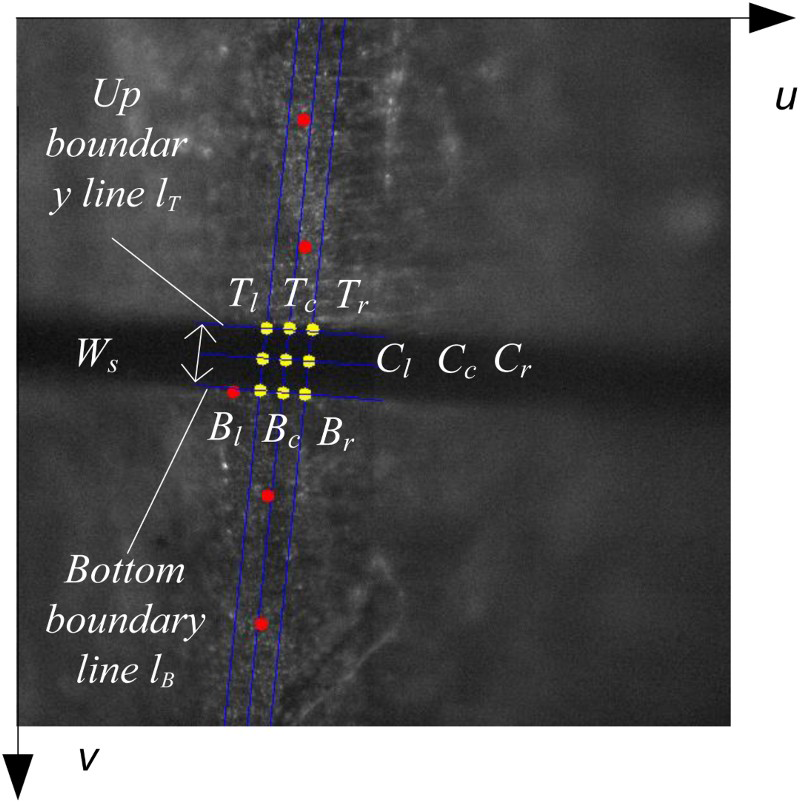
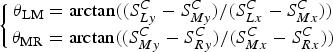
As shown in Fig. 11, let
 denote the angle of inclination of the line passing through points
 and
and
 . Similarly, let
 denote the angle of inclination of the line passing through points
 and
and
 . Therefore, the following expression can be obtained.
The average of
 and
and
 is defined as the angle of inclination of the weld seam, denoted θ, as follows:
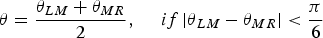
The value of the two inclination angles
 and
and
 should be very close to each other if there is no error in extraction of the beam feature. Hence, a restriction equation
 is added. If this inequation is not satisfied, then there must be something wrong in the feature extraction. Thus, it is used as a fault self-diagnosis inequation.
The seam centreline, the top boundary line
 and the bottom boundary line
 are considered to be parallel to each other. As the inclination angle of the seam centreline is calculated above, the slope of line
 and
and
 is shown as follows:

In addition, the average value of the three points
 ,
,
 and
and
 , which are obtained in the up boundary of the three banded areas, is given as follows:
In this manner, the equation of the up boundary line
 in image coordinate OUV is computed as follows:

Likewise, based on the obtained three points
 ,
,
 and
and
 , the equation of the down boundary line
 in image coordinate is calculated as follows:

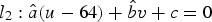
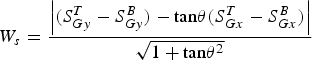
The distance between the two parallel lines
 and
and
 , is the width of weld seam. Let it denote
 in pixel unit, which has the following expression:
Calculation of the normal vector of the weld seam
By taking two different images, the two centrelines of the clear area in the images can be extracted by the above-mentioned measures and denoted as
 and
and
 . A series of points
 and
and
 of line
 and line
 are chosen, respectively, so that a series of corresponding points
 and
and
 in the measuring coordinate system can be calculated by the camera imaging model. As the theory of NDOF implies, the centreline of the clear area is the intersection line of the local surface of the welding seam with the centre plane of the NDOF area Σ. That is, the space points
 and
and
 are in the local surface of the weld seam. If the images taken above are close enough to each other, the local surface of the weld seam can be regarded as a plane. Consequently, the plane can be calculated by planar surface fitting method. The normal vector of this plane is the normal vector of the local surface of the welding seam.
The result of experiment
As shown in Fig. 12
a, the weld seam measurement equipment was installed in a multi-axis Computer Numerical Control (CNC) machine for laser welding. A set of parameters of this vision measurement system are listed in Table 1, under which a desirable seam extraction performance is achieved. Figure 12
b is the result of real-time measurement for welding seam by software, which adopts the theory of measurement based on NDOF. The centreline of the clear area and the centreline and boundary lines of the welding seam were drawn automatically by the software as shown in Fig. 12
b.
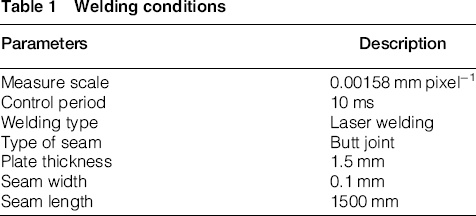
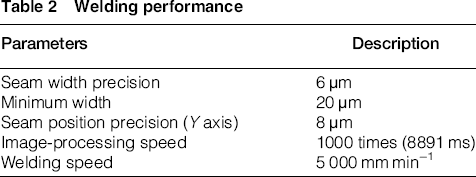
The experiment of the seam measurement: a seam measuring system setup, b result of seam measurement Welding conditions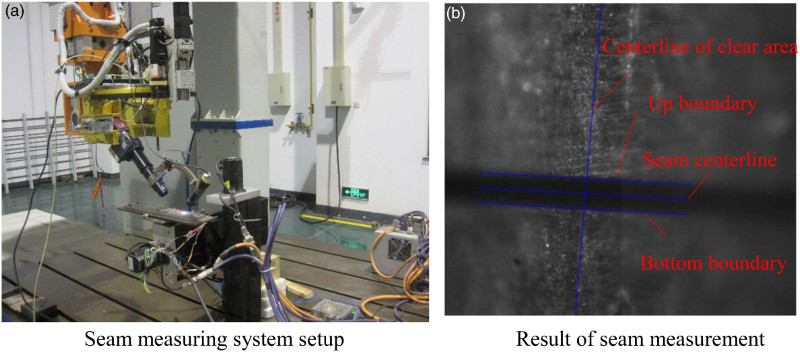
Welding performance
The conclusion
Weld seam extraction for seam with width less than 0.1 mm is a critical task in many vision-based laser welding applications. Experimental results show that the proposed NDOF seam measurement system can meet the demand of precision in terms of high resolution (1.58 μm pixel−1) and high accuracy (0.006 mm) in narrow seam measurement. In addition, the NDOF-based seam measurement algorithm for narrow gap laser welding can precisely measure the centreline, seam width and the normal vector of the seam in real-time with great precision when the measurement system is following the seam trajectory at a speed of 5 m min−1.