
Abstract
Ultrafine-grained (UFG) and a coarse-grained (CG) 304L stainless steels were produced by a combination of cold rolling and annealing. Friction stir welding (FSW) was applied at the same welding conditions to study the effects of the grain size of the base metal on the grain structure of the weld nugget and its recrystallisation mechanism. The results showed that the recrystallisation mechanism changes with the grain size of the base metal. Continuous dynamic recrystallisation (CDRX) was found to be dominant at the FSW of the UFG sample while discontinuous dynamic recrystallisation is the main recrystallisation mechanism in the FSW of the CG sample. Although the weld nugget grain size of the UFG welded sample is slightly higher than that of the CG welded sample, its nanohardness was found to be higher. This behaviour is attributed to the higher dislocation densities of the austenite grains in the UFG welded sample produced through CDRX.
Keywords
Introduction
Friction stir welding (FSW) as a solid-state joining process has attracted a lot of attention during recent years. It is well accepted that dynamic recrystallisation during FSW results in fine and equiaxed grains in the nugget zone.1, 2 The mechanism of dynamic recrystallisation during FSW should be affected by the nature of the material as well as by the welding conditions. Several recrystallisation mechanisms have been previously proposed in aluminium alloys,2-5 including discontinuous dynamic recrystallisation (DDRX) which occurs by nucleation and growth of the new grains, continuous dynamic recrystallisation (CDRX) which involves the formation of low-angle boundary arrays and gradual increase in the boundary misorientation during hot deformation, and geometric dynamic recrystallisation (GDRX) resulting from the impingement of serrated grain boundaries in highly elongated grains during hot deformation. Jata and Semiatin 4 were the first to propose CDRX as the operative mechanism for dynamic recrystallisation during FSW of aluminium alloys. It is important to note that in some cases, the recrystallised grain size in the weld zone is smaller than the original subgrain size. Thus, it is unlikely that the recrystallised grains in the nugget zone could result from rotation of the original elongated subgrains in the base metal. Therefore, alternatively, DDRX should be active in the process. 5 The initial microstructural state of aluminium alloys has considerable effects on their recrystallisation mechanism. For example, as stated by Etter et al., 6 static recrystallisation prior to CDRX was evidenced for initially cold rolled Al alloys, while GDRX occurred in initially annealed counterparts. Therefore, it seems that the recrystallisation mechanism in aluminium alloys is dependent on the initial thermo-mechanically treated state. In the case of FSW of stainless steels, most research efforts have focused on the effect of processing parameters on the resultant microstructure and mechanical properties, with only a few reports on their recrystallisation behaviour. Reynolds et al. 7 was the first to study the weldability of 304 stainless steel using FSW. Their results showed that lower energy input lead to lower nugget temperature and finer grain size. The findings of Sato et al. 8 also confirmed the effectiveness of using low-heat input to produce high-quality welds in FSW of super-austenitic stainless steels. Park et al. 9 found that the stir zone and the thermo-mechanically affected zone in the FSW of 304L stainless steel showed dynamically recrystallised and recovered microstructures, respectively, which are typically observed in the FSW of aluminium alloys. Sato et al. 10 found that static recrystallisation is active after dynamic recrystallisation during the cooling cycle of 304L stainless steel after FSW. Mironov et al. 11 also concluded that the microstructure of the weld nuggets of super-austenitic stainless steel is governed by discontinuous recrystallisation during the cooling cycle. According to the authors' knowledge, no work focusing on the effects of grain size on the mechanism of dynamic recrystallisation during FSW of stainless steels has been published. Therefore, the main objective of the present research is to study the effects of the initial grain size on the recrystallisation mechanism during FSW of AISI 304L, through electron backscattered diffraction (EBSD), TEM, as well as nanoindentation experiments.
Experimental procedure
The starting material was a commercial AISI 304L stainless steel plate with a thickness of 10 mm. The as-received material was subjected to multipass unidirectional rolling up to 80% rolling reduction at –15°C. The cold rolled specimens were annealed in 700°C for 5 h and 900°C for 3 h to obtain ultrafine-grained (UFG) and coarse-grained (CG) austenite with an average grain size of 0.65 μm (UFG) and 12 µm (CG), respectively. FSW was performed on both samples at the same conditions (constant rotational speed of 630 rpm and two different welding speeds of 80 and 160 mm min) to study the effect of grain size on microstructure and recrystallisation mechanisms during FSW. FSW was performed using a vertical milling machine. The welding tool was made of tungsten carbide with a shoulder diameter of 16 mm. A conical pin with upper and lower diameters of 5.5 and 5 mm, respectively, and length of 1.8 mm, was used. The tilt angle was 3° in all FSW experiments. Argon gas shielding was introduced around the tool at a flow rate of 10 L min–1 to prevent excessive oxidation during the welding process. A K-type thermocouple was used to measure the thermal profiles of UFG and CG welded samples during FSW. The thermocouple was placed at the bottom surface of the samples and at the middle of their length to avoid any error in temperature measurement caused by non-stationary heat transfer.
12
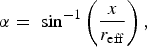
Figure 1 shows a schematic illustration of the FSW weld geometry.
Schematic illustration of FSW weld geometry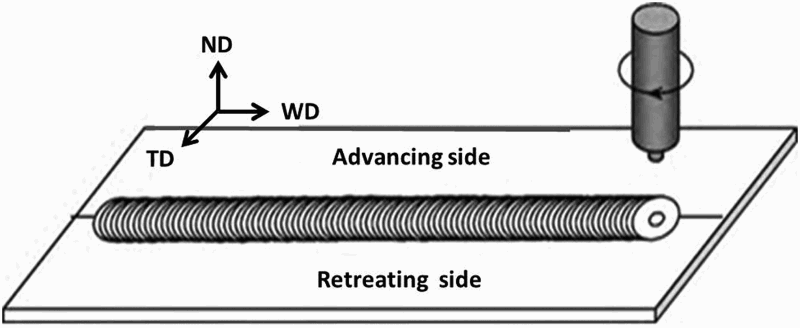
Since the temperature of the advancing side during FSW of 304 stainless steel is always higher than that at the retreating side, 13 microstructural characterisation was performed on the weld centre of all samples to yield similar conditions for comparison. For EBSD examination, samples were mechanically ground and polished using papers down to 4000-grit followed by Al2O3 slurry. Vibration polishing was finally performed to obtain a surface quality suitable for EBSD. A field emission scanning electron microscope (LEO 1530 FE-SEM) attached with an EBSD analyser and transmission electron microscope (FEI Tecnai G2 20 Scanning TEM) were used to characterise the grain structure and texture of the welded samples. Two-beam conditions were used in the TEM analysis to characterise the dislocation structures of the austenite grains. Focused ion beam milling was used to produce TEM foils from the weld centre. Nanoindentation experiments were carried out in the load controlled mode with a maximum load of 10 mN using an Agilent G200 machine equipped a Berkovich tip. Nanoindentation tests were carried out in a 5 × 5 array with four times repetition. The thermodynamic evolution software ThermoCalc was used to calculate the equilibrium phase contents at different temperatures.
Results and discussion
Figure 2 shows the SEM and TEM micrographs of an UFG (Fig. 2
a and 2
b) and a CG sample (Fig. 2
c and 2
d), which exhibit an average grain size of 0.65 and 12 µm, respectively. The dark precipitates in the SEM images of samples are delta ferrite, the amount of which was measured by EBSD to be around 2% in the CG sample and more than 7% in the UFG sample, possibly due to the higher annealing temperature for the CG sample which promoted the dissolution of delta phase in the matrix. In addition, the higher temperature during the annealing of CG sample also resulted in considerably lower dislocation density of the austenite phase.
SEM and TEM micrographs of the a and b UFG base metal and c and d CG base metal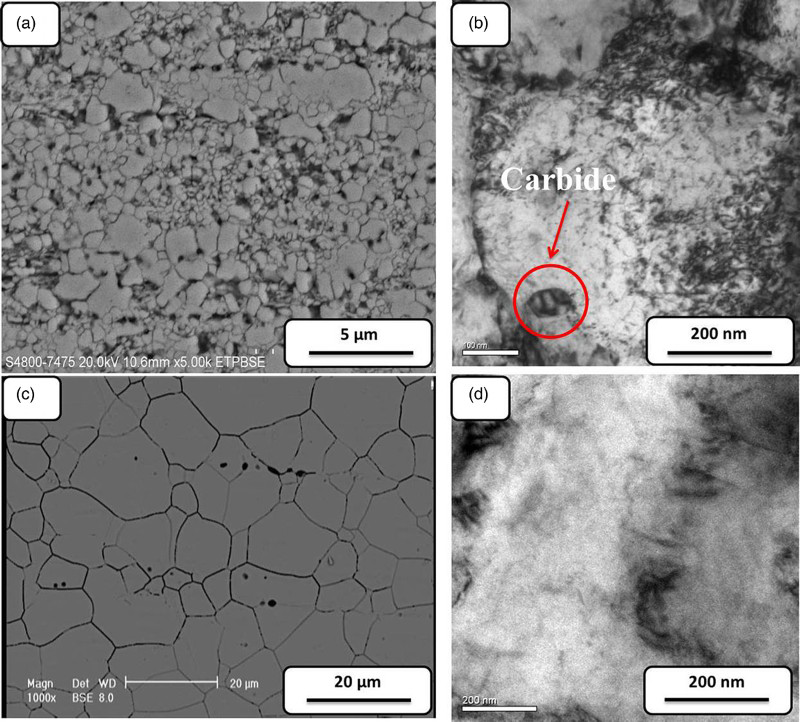
Some nano-sized particles were found on the TEM image of the UFG sample (Fig. 2
b) which are absent in the CG sample. Energy dispersive spectroscopy analysis showed that these particles are chromium-rich containing 72.44% Cr, 19.22% Fe, 1.56% Ni and 6.78% C, in comparison with the austenite matrix which contains 18.79% Cr, 72.22% Fe, 7.94% Ni and 1.35% Mn. The chemical composition of these particles confirms that they are chromium carbides. The ThermoCalc software was used to study the equilibrium condition of chromium carbide precipitation in the investigated alloy, and Fig. 3 shows the calculated equilibrium precipitation data for Cr23C7. As can be seen, the amount of carbide formation is very little in the investigated alloy so that the maximum amount of chromium carbide is around 0.6 wt-% at the temperature of 600°C. This is consistent with the microstructural characterisation where particles were rarely found in the austenite matrix. Increasing the temperature will decrease the amount of chromium carbides in the austenite matrix, and complete dissolution will occur at the temperature of 860°C. The thermodynamic analysis can confirm the existence of chromium carbides in the UFG sample and the lack of them in the CG sample, for which the annealing was done at 900°C. An small amount of chromium carbide particles in the UFG sample does not seem to have any effect on the occurrence of particle-stimulated nucleation during FSW and so the effect of them can be ignored.
Equilibrium chromium carbide precipitation data in the temperature range of 600–900°C obtained by Thermocalc analysis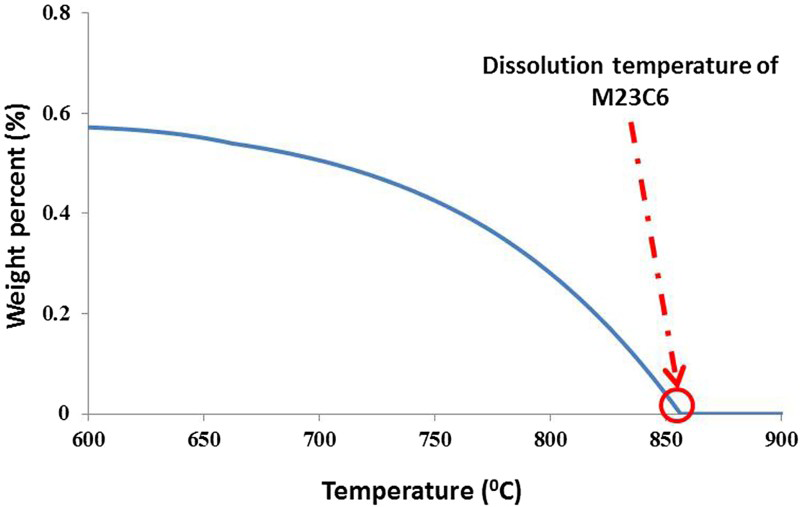
FSW was performed to study the effect of the base metal grain size on the grain structure of the weld nugget and the related recrystallisation mechanism. Figure 4 shows low magnification cross-sectional images of the UFG welded samples with the welding speeds of 80 mm min–1 (Fig. 4
a) and 160 mm min–1 (Fig. 4
b). The micrographs show the formation of a banded area in the advancing side of the weld nugget. The corrosion resistance of the banded area is considerably lower than the other regions of the weld nugget. TEM results (Fig. 4
c) showed that a continuous structure of sigma-phase particles was formed in the grain boundaries inside the banded area. The mechanism of sigma-phase precipitation during FSW of AISI 304L stainless steel was previously described in our previous report.
14
Similar trend was also observed in the CG welded sample.
Low magnification micrographs of the UFG welded sample at the welding speed of 80 mm min–1 a and 160 mm min–1 b along with typical TEM image of the sigma-phase particles inside the banded area c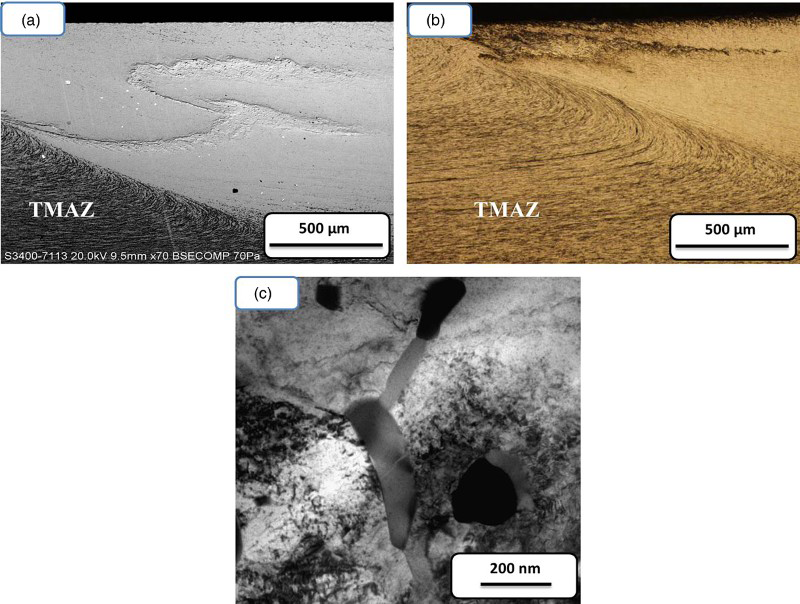
Figure 5
a and 5
b shows the SEM micrographs of the weld centre microstructure of the UFG and CG welded sample, respectively, at the welding speed of 160 mm min–1. The microstructure contains equiaxed fine austenite grains which is the result of dynamic recrystallisation occurred in FSW. The average austenite grain size at the weld nugget centre of the UFG base metal was around 5.5 μm, while that for the CG base metal was about 4.2 μm (Fig. 5
a and 5
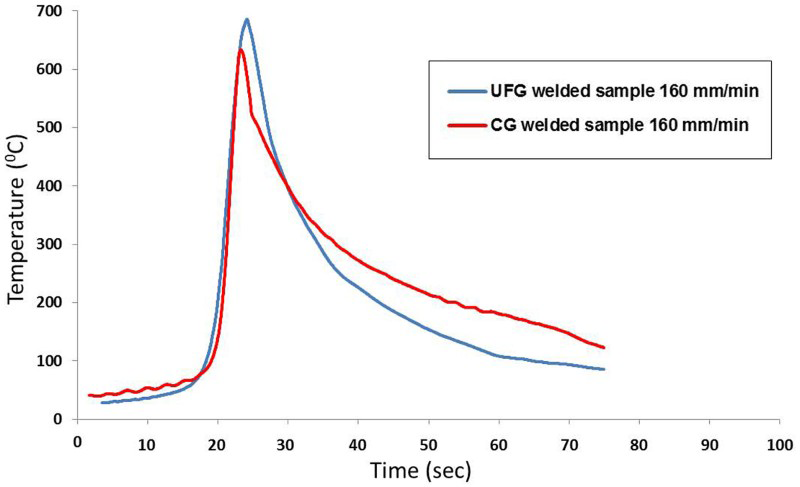
b). The temperature of the weld nugget centre was recorded in order to study the reasons for higher austenite grain size at the nugget centre of the UFG welded sample when compared to the CG welded sample. Figure 6 shows the temperature profile recorded at the rotational speed of 630 rpm and welding speed of 160 mm min–1 for the both UFG and CG welded samples. It should be noted that the thermocouple was placed at the bottom surface of the sample and so the real maximum temperature should be slightly higher than that recorded. It can be seen that the peak temperature of the UFG welded sample is slightly higher than that of the CG welded sample, although not considerably. The higher peak temperature during FSW of the UFG base metal can be expected to cause more grain growth, leading to a slightly higher final austenite grain size when compared to the CG welded sample. Interestingly, the average nanohardness of the UFG welded sample was found to be around 6.4 GPa, while that of the CG welded sample was found to be lower at 5.5 GPa despite its smaller austenite size, indicating that the hardness is not by the grain size in a simple way (Fig. 5
c).
SEM micrographs of the grain structure inside the weld nugget centre of a UFG welded sample and b CG welded sample. c Load–displacement curves during nanoindentation tests of UFG and CG welded samples Thermal profile of UFG and CG welded samples at the welding speed of 160 mm min–1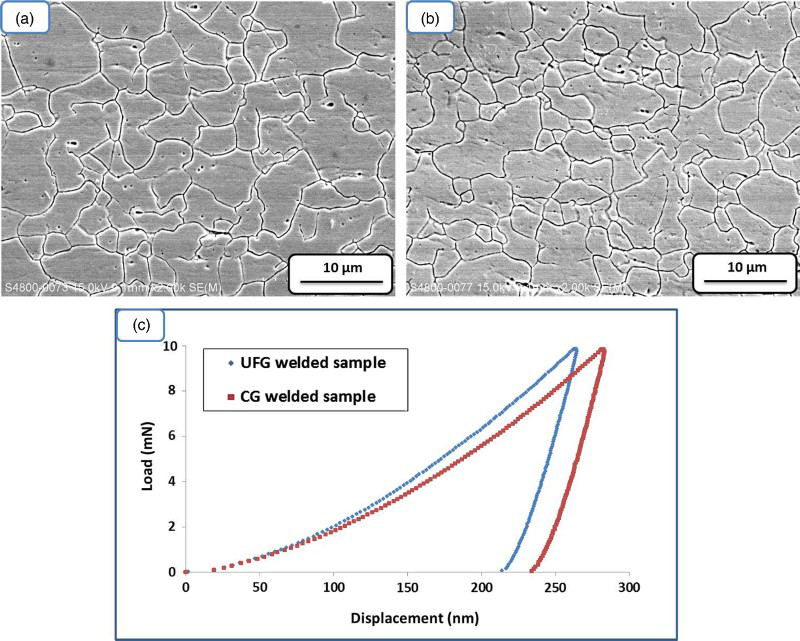
A few amounts of twin boundaries were observed in the austenite grains in the weld centre of the both UFG and CG welded samples. Figure 7 shows typical TEM micrographs of the twins in the weld nugget of UFG welded sample at the welding speed of 160 mm min–1. Since these twins have parallel and straight boundaries, they are likely annealing twins rather than mechanical twins. It has been shown that the plastic deformation during friction stirring can destroy all existing twins in the weld nugget.
15
Therefore, the presence of such annealing twins in the weld centre should be the result of post-dynamic recrystallisation phenomena-like static recrystallisation or grain growth. Since the holding time at higher temperatures in the cooling cycle of FSW at high welding speeds was not very long, these annealing twins were not abundant in the microstructure, and so they should not have a great impact on the mechanical property difference between the UFG and CG welded samples.
TEM micrographs of typical annealing twins observed in the weld nugget of UFG welded sample at the welding speed of 160 mm min–1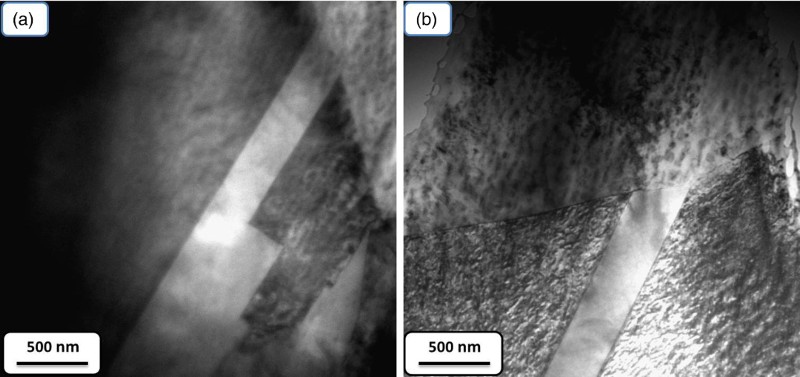
EBSD was performed on the weld nugget centre of both samples in order to understand the observations above. Since the deformation during FSW is mainly shear in nature, the best way to represent the texture development during FSW is to use a coordinate system defined by the shear direction (SD), the shear plane normal (SPN) and the rotation access direction
Schematic representation of the determination method for the angles α and β from the FSW cross-section
16
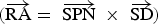 , rather than the normal (WD, TD, ND) framework. According to Fonda and Knipling
16
and Sabooni et al.,
17
at any specific location in the weld, the difference between the acquired texture orientation and the local orientation of the shear surface can be represented by two angles, α and β. The SD deviates from the welding direction as a function of position across the weld by the angle α, which is defined by Fonda and Knipling
16
:
, rather than the normal (WD, TD, ND) framework. According to Fonda and Knipling
16
and Sabooni et al.,
17
at any specific location in the weld, the difference between the acquired texture orientation and the local orientation of the shear surface can be represented by two angles, α and β. The SD deviates from the welding direction as a function of position across the weld by the angle α, which is defined by Fonda and Knipling
16
:
 from vertical or the deviation of
 from the top-view plane of the sample. Because the shape of shear surface can be approximately obtained by rotation of the trace of the weld nugget boundary, β corresponds to the inclination of this boundary. This angle can be measured from the shape of the weld nugget boundary in the transverse cross-section (the ND–TD plane). Figure 8 shows a schematic representation of the method to determine the angles α and β in the FSW welded sample.
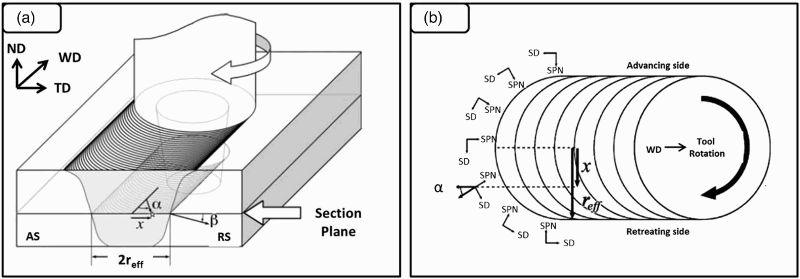
Figure 9
a and 9
b shows the orientation distribution function (ODF) and its sections at Φ2 = 0 and Φ2 = 45° for the UFG and CG welded samples, respectively, at the welding speed of 160 mm min–1. Figure 9
c and 9
d shows the misorientation angle distribution of the two samples. The ideal shear textures of face centered cubic materials along with the rotated cube texture are also shown in Fig. 9
e for comparison purposes.
18
As can be seen the texture of the UFG welded sample is a mixture of A* (A*1/A*2) and B/
ODF and its section at Φ2 = 0 and Φ2 = 45° with misorientation angle distribution in the weld centre for a and c UFG welded sample and b and d CG welded sample at the welding speed of 160 mm min–1 along with the ideal shear texture of FCC materials e Microstructure of the weld centre of the UFG welded sample at the welding speed of 80 mm min–1 showing a large portion of grains having a shear deformation texture Microstructure of the weld centre of the CG welded sample at the welding speed of 80 mm min–1 showing a small portion of grains having shear deformation texture texture which is in the form of shear deformation texture, while the texture of the CG welded sample is in the form of rotated cube. The shear deformation texture was found also at the welding speed of 80 mm min–1 for the UFG welded sample. Figure 10 shows the grain structure in the weld centre of the UFG welded sample at the welding speed of 80 mm min–1. The grains having the shear texture were determined in the structure based on the Euler angles shown in Fig. 9
e and considering a tolerance of 10°. As can be seen, a high fracture of grains show the ideal shear texture of B/
texture which is in the form of shear deformation texture, while the texture of the CG welded sample is in the form of rotated cube. The shear deformation texture was found also at the welding speed of 80 mm min–1 for the UFG welded sample. Figure 10 shows the grain structure in the weld centre of the UFG welded sample at the welding speed of 80 mm min–1. The grains having the shear texture were determined in the structure based on the Euler angles shown in Fig. 9
e and considering a tolerance of 10°. As can be seen, a high fracture of grains show the ideal shear texture of B/
 as well as A*, while such a texture was not observed in the CG welded sample at the welding speed of 80 mm min–1 (Fig. 11). This shows that the texture of the weld nugget is a function of grain size but is not dependent on the welding speed. It is reported that the rotated cube texture is the characteristic of DDRX while shear deformation texture is a characteristic of recovery-based phenomena such as CDRX for austenitic stainless steels.19-21 Therefore, the difference between the texture of the UFG and CG welded samples can indicate a difference between their recrystallisation mechanism. The misorientation angle distribution of the two welded samples can also confirm the above suggestion about the recrystallisation mechanism. In the UFG welded sample more than 30% of the grain boundaries are low angle (2° < θ < 15°) which are characteristics of deformation, while the CG welded sample mostly exhibits high-angle grain boundaries which can be considered as the result of nucleation and growth of new grains which is the characteristic of DDRX.
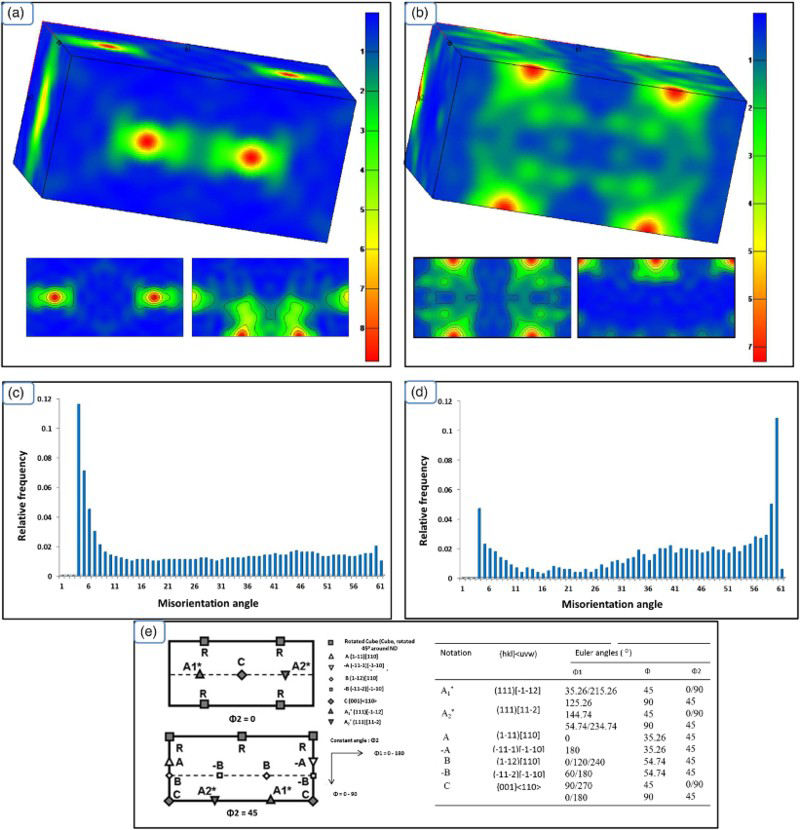
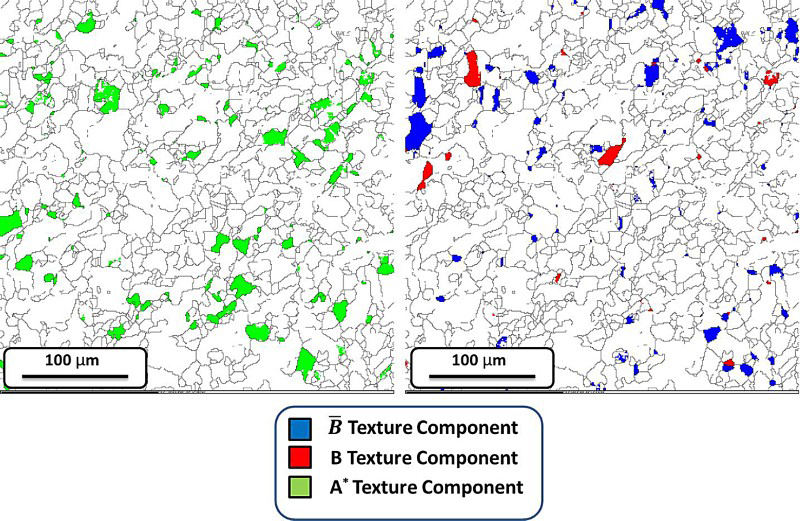
Figure 12
a and 12
b shows the TEM micrographs of the typical dislocation debris inside the weld nugget austenite grains for the UFG and CG welded samples, respectively. It can be seen that the dislocation density in the UFG welded sample was considerably higher than that in the CG welded sample. The large difference in the dislocation density of the austenite phase in the welded samples can confirm the above conclusion that CDRX and DDRX are the dominant mechanisms in the stir zone of UFG and CG welded samples, respectively.
TEM micrographs showing dislocation debris inside austenite grains in a UFG welded sample and b CG welded sample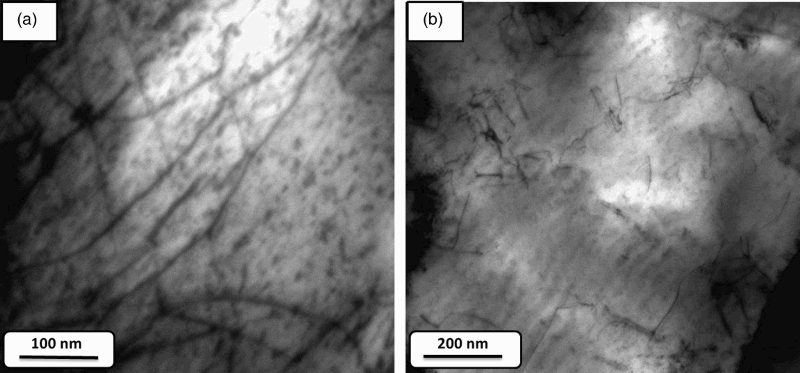
Conclusions
The effect of the base metal grain size on the grain structure and recrystallisation mechanism during FSW of AISI 304L stainless steel was studied. The grain structure of the weld nugget in the UFG welded sample was found to be slightly coarser than the CG welded sample, and yet its nanohardness was also higher. EBSD results showed that the texture of UFG welded sample was in the form of simple shear which is characteristic of CDRX, while that of the CG welded sample was in the form of rotated cube which indicates DDRX. It was found that the weld nugget texture is a function of grain size but is not dependent to the welding speed. The higher nanohardness of the UFG welded sample is attributed to the higher dislocation density of the austenite phase caused by CDRX.