
Abstract
Solid-state bonding between ultralow-carbon steel and pure nickel was conducted by hot pressing with various compressive strain ranging from 5 to 15% and subsequent isothermal holding at 923 K. It was found that the interfacial strength of contact area is accounted for by the evolution of the intrinsic strength of the interface and the amount of plastic energy dissipation at the crack tip during interface fracture. The compression induces severe deformation around the interface and consequently inhibits the plastic energy dissipation during interface fracture. In the first stage of isothermal holding, the residual strain around the interface on the steel side is reduced by recovery process, which concurrently decreases in the yield stress of the area adjacent to the interface. This promotes plastic energy dissipation of the area, leading to a significant increase in interfacial strength in the first stage.
Introduction
Recently, the solid-state bonding process has been widely investigated owing to its superior characteristics over traditional fusion welding processes such as the absence of a hazardous heat-affected zone. The evolution of interfacial strength has been explained by several hypotheses, which involve diffusion bonding [1-3], energy barriers [4], oxide films [5] and recrystallisation. Recently, several experiments on diffusion bonding of the dissimilar metals have been achieved by introducing thin metal interlayers at relatively high temperatures and long annealing time [6, 7]. The results showed that the interdiffusion between layers is necessary for decent interfacial strength. Accordingly, either a high temperature or severe deformation is required to attain sufficient interfacial strength. However, the high-temperature process potentially causes the microstructure degradation of components [8] and the formation of brittle intermetallic compound layer at the interface [6-9]. Consequently, a rapid process at low temperature is more desirable to avoid above detrimental effects.
In our previous research [10], solid-state bonding between interstitial-free (IF) steels was conducted at temperatures ranging from 873 to 923 K. It was found that the evolution of interfacial strength consists of two stages: the first stage, where the increase in interfacial strength is rapid and significant, and the second stage, where the increase is gradual. The rapid evolution of interfacial strength in the first stage seems to be dominated by the mechanism within the contact area, which is severely deformed by hot pressing, with only a small increase in contact area fracture; in other words, the long-range diffusion is not significant during the first stage. From recent studies of diffusion bonding of dissimilar metal [6, 7], high interfacial strength could be achieved with sufficient interdiffusion, which was described as the second stage in our previous study. Still, the mechanism of the evolution of interfacial in the first stage remains poorly understood. A molecular dynamics study revealed that a disordered atomic arrangement is produced by compression and that the disordered atomic layer and incoherency are responsible for the formation of weak interface under an as-compressed condition [10]. Subsequently, this disordered atomic arrangement is rearranged by increasing isothermal holding, resulting in an increase in interfacial strength. A similar atomic rearrangement at the interface was also observed in the surface-activated bonding (SAB) of pure aluminium at low temperatures by Akatsu et al. [11]. Suga [12] also showed that the surface roughness and the deformation play an important role in SAB between copper specimens at low temperatures. Still, less is clarified on the mechanism of evolution of interfacial strength.
After compression, a weak as-compressed interface was formed and the evolution of interfacial strength in the first stage tended to be strongly related to the compressive deformation at the contact area. Therefore, the purpose of this study is to clarify the dominant mechanisms of the evolution of interfacial strength in the first stage of solid-state bonding at low temperatures by focusing on the effects of the amount of compressive strain on the evolution of strength and the microstructure adjacent to the bonding interface in the first stage.
Experimental procedure
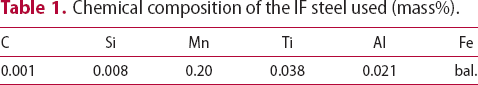
Chemical composition of the IF steel used (mass%).
The surface-prepared IF steel and pure nickel specimens were stacked and hot-pressed together, as shown in Figure 1, in vacuum atmosphere of 10−1 Pa using thermomechanical simulator (Thermacmastor-Z, Fuji Electronic Industrial). After being heated to the bonding temperature of 923 K at a rate of 20 K s−1, the specimens were momentarily compressed by a compressive strain of 5–15%, and then isothermally held without applied pressure for a given holding time, which was followed by cooling at rate of 10 K s−1 to room temperature, as shown in Figure 1. The compressive strain was evaluated by the displacement of the crosshead. The holding time was ranged from 1 to 150 s and the holding time of 1 s was considered to be ‘as-compressed condition’. The bonded specimens were machined to a flat rectangular shape of roughly 12 mm length, 8 mm width and 1.5 mm thickness, and the interfacial strength was measured at room temperature by performing a tensile test perpendicular to the interface with a crosshead speed of 5.56 × 10⁻⁶ m s−1. The macrostructure and microstructure of the bonding interface were examined using a field-emission scanning electron microscope (FE-SEM; JSM7001, JEOL), equipped with an electron backscatter diffraction (EBSD) function. To consider the residual strain at the bonding interface, a clean cross-section of the bonding interface was prepared using an ion cross-section polisher, and kernel average misorientation analysis (KAM) in EBSD was utilised with a 60 nm step size and third-nearest-neighbour data points.
Thermomechanical process used in the experiment.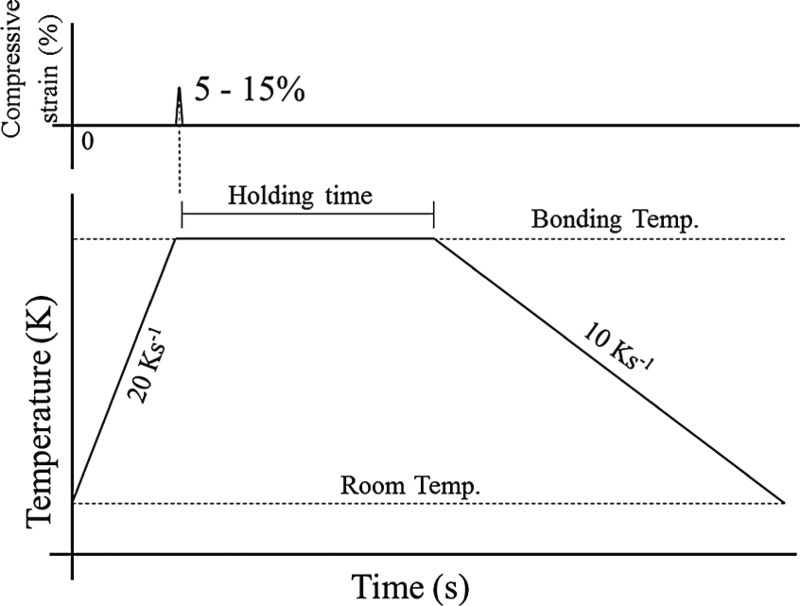
The hardness of the IF steel and pure nickel sides at the bonding interface was measured on the surfaces that were prepared by mechanical polishing, followed by electrical polishing, adjacent to the bonding interface, by nanoindentation with a force of 500 µN and an indentation speed of 100 µN s−1. The measurement was conducted by scanning probe microscopy (SPM-9600, Shimadzu) with a Berkovich tip (three-sided pyramidal diamond tip) and the indentation was cross-checked by comparison with the single-crystal silicon dioxide prescribed by the manufacturer. The indentation impress in both the IF steel and pure nickel sides had a width of approximately 400 nm. Therefore, all indentations were executed with a 5 µm spacing between them to prevent the effects of other indentations.
Results
Evolution of interfacial strength
The strength per contact area was obtained by dividing the interfacial strength by the contact area fraction, measured using the SEM by considering the real contact on the cross-section between the components. Note that the interfacial strength of 5 different samples was measured and averaged to obtain each data point in the relationship. Figure 2 shows the relationship between the isothermal holding and the strength per contact area of specimens with 5, 10 and 15% initial compressive strains. Note that the contact area fraction slightly increases with the initial compressive strain between 5 and 15%. The as-compressed contact area exhibits very limited strength and tends to significantly increase with isothermal holding for specimens for all initial compressive strains. The evolution of the strength per contact area can be divided into two stages. The strength per contact area is significantly improved during the first stage of evolution, in contrast to the second stage, where the evolution of the strength per contact area is clearly slower. Therefore, the two stages were distinguished by different gradients of the evolution of the strength per contact area, which were described as the degrees of the mechanism in a previous study [10]. Under the as-compressed condition, the strength per contact area of a specimen with higher initial compressive strain is lower than that of a specimen with lower initial compressive strain. During the isothermal holding in the first stage, the strength per contact area of a specimen with higher initial compressive strain remains below that of a specimen with lower initial compressive strain, so the necessary isothermal holding for the first stage is longer for a specimen with higher initial compressive strain than for one with lower initial compressive strain. After the first stage, the strength per contact area at which the transition from the first stage to the second stage takes place seems to be unrelated to the initial compressive strain. Also, during the second stage, no difference in the evolution of strength per contact area of the specimens with different initial compressive strains is distinguishable.
Evolution of strength per contact area with isothermal holding of specimens with 5, 10 and 15% initial compressive strains.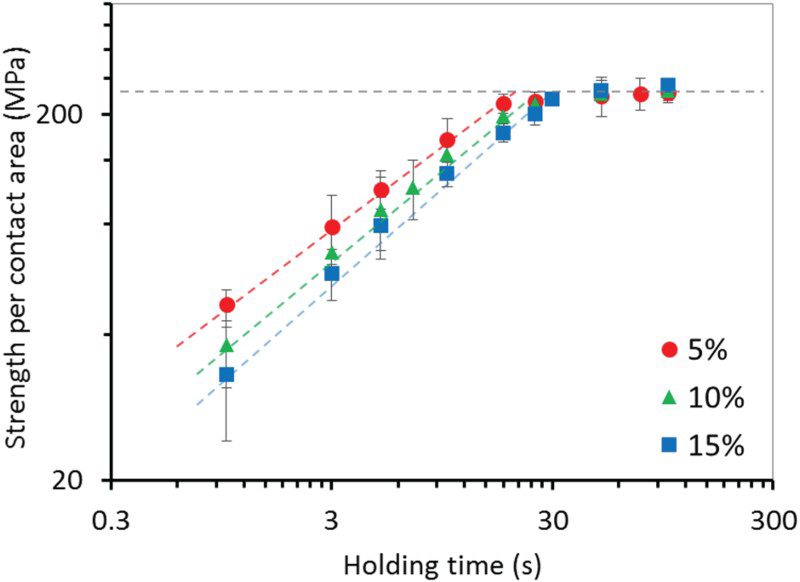
Interface microstructure
Figure 3 shows KAM analysis images obtained around the interface of the specimen with 15% initial compressive strain under the as-compressed condition and during the first stage on the steel and nickel sides. The results clearly show that compression induces severe deformation at grains near the bonding interface on both the steel and nickel sides. On the steel side, the residual strain is heavily concentrated at the area close to the bonding interface under the as-compressed condition, as shown in Figure 3(d). The compression broke down and rotated the ferrite grains adjacent to the bonding interface into small distorted subgrains, and the thickness of the strain-concentrated layer was determined to be approximately 3–4 µm. During the isothermal holding in the first stage, the residual strain adjacent to the bonding interface was continuously reduced by the recovery process at the isothermal holding temperature of 923 K, as illustrated in Figure 3(d–f). The recrystallisation could not be detected on the steel side. In contrast, the severe residual strain on the nickel side in the as-compressed specimen was found away from the bonding interface next to the undistorted grains. However, some small distorted grains remained intact at the bonding interface. Thus, the recovery and recrystallisation might take place instantaneously after the compression on the nickel side at this level of deformation.
KAM analysis images around the interface of specimen with 15% initial compressive strain: (a) as-compressed, (b) during the first stage (18 s) and (c) at the end of the first stage (30 s) on the steel side and (d) as-compressed, (e) during the first stage and (f) at the end of the first stage on the nickel side with third nearest-neighbour atoms and a maximum of 4°.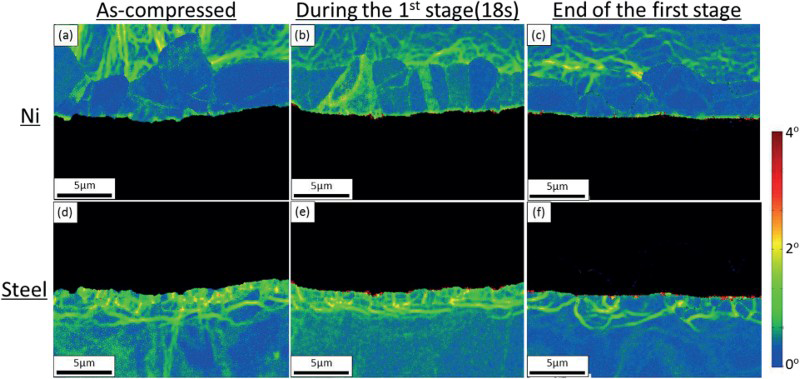
For a comparison of plastic strains of different specimens, KAM values adjacent to the bonding interface of the specimen with 15% initial compressive strain are plotted against the distance from the bonding interface on the steel and nickel sides in Figure 4(a,b), respectively. Note that the average KAM value was calculated by averaging the results over 10 lines analysis of KAM values with constant spacing from the interface. The result reveals that the residual strain adjacent to the bonding interface is intense and tends to decrease with increasing distance from the interface on the steel and nickel sides. In the first stage, the residual strain adjacent to the bonding interface on the steel side was found to decrease with increasing isothermal holding. The thickness of the distorted layer is approximately 3 µm, which is close to the value observed in Figure 3. In contrast to the steel side, the KAM value on the nickel side is relatively small and does not tend to change significantly with isothermal holding.
Relationship between distance from the interface and KAM values of specimen with 15% initial compressive strain: as-compressed (1 s), during the first stage (18 s) and at the end of the first stage (30 s) interface on the (a) steel and (b) nickel sides.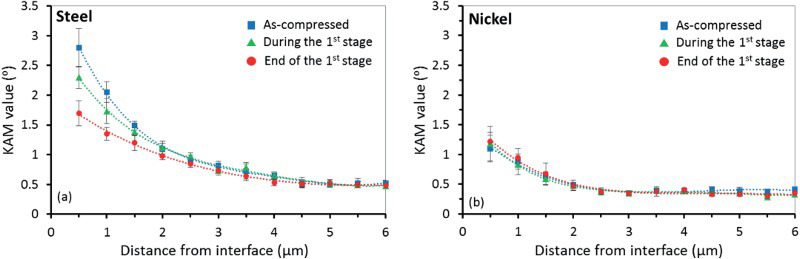
Figure 5 shows the relationship between the isothermal holding and the KAM value at a distance of 0.5 µm from the interface on the steel side with initial compressive strains of 5, 10 and 15%. It was found that higher initial compressive strain induced higher misorientation under the as-compressed condition and the misorientation decreased along with isothermal holding. After isothermal holding of 18 s, which corresponds to the end of the first stage for the specimen with the initial compressive strain of 5%, the misorientation remaining in the specimen with the initial compressive strain of 15% is still considerably high. The isothermal holding necessary to decrease the misorientation of specimens becomes longer with increasing initial compressive strain. The behaviour of the decrease in the misorientation of specimens seems to correspond to the strength evolution behaviour shown in Figure 2. Thus, it is suggested that the distortion adjacent to the interface deteriorates the strength per contact area. Note that the long-range diffusion of the components, as well as the interface reaction, could not be found at the interface, due to low bonding temperature and short holding time in the first stage.
Relationship between distance from the interface and KAM values of specimens with 5, 10 and 15% initial compressive strains on the steel side: (a) as-compressed (1 s), (b) during the first stage (18 s) and (c) at the end of the first stage.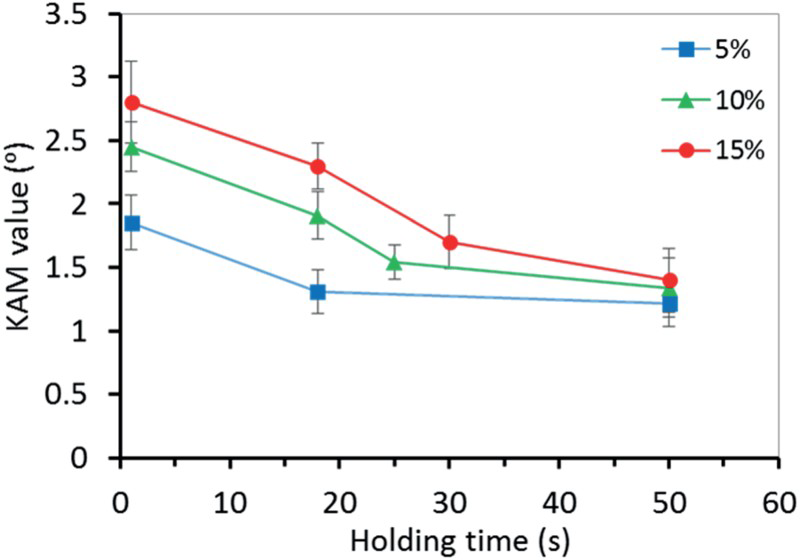
Nanoindentation hardness
Hardness was measured by nanoindentation with a step distance of 0.5 µm from the interface on both the steel and nickel sides at five different locations and each data shown is the average of the five measurements. Figure 6 shows the relationship between the distance from the interface and the hardness for the specimen with the initial compressive strain of 15%. In Figure 6, the hardness tends to decrease with increasing distance from the bonding interface, and an extremely hard layer in the as-compressed specimen is found primarily on the steel side. The layer is approximately 5–6 µm thick, which is slightly larger than the value measured by KAM analysis. This result shows that the hardness on the steel side notably decreases with isothermal holding in the first stage. On the other hand, no notable change in hardness was observed with both distance and isothermal holding on the nickel side. The specimens with 5 and 10% initial compressive strain showed similar trend in the relationship between the distance from the interface and the hardness to the specimen with 15% initial compressive strain.
Relationship between distance from the interface and hardness of specimen with 15% initial compressive strain: as-compressed (1 s), during the first stage (18 s), and at the end of the first stage (30 s).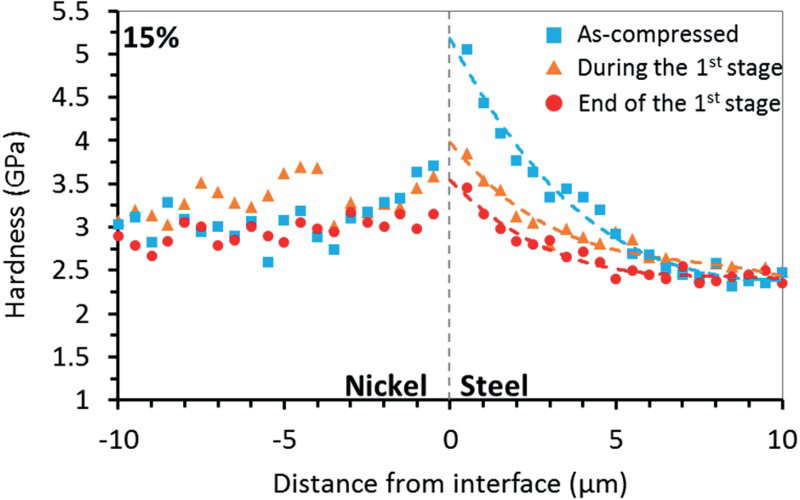
Figure 7 shows the relationship between the isothermal holding and hardness near the interface on the steel side of specimens with 5, 10 and 15% initial compressive strains. Similarly to the evolution of the KAM value, the hardness near the interface on the steel side of the specimen with initial compressive strain of 15% is significantly larger than those of specimens with other initial compressive strains, as shown in Figure 7. Compression was found to plastically deform microstructures close to the interface and subsequently induce greater hardness on the steel side. In Figure 7, the relationship shows rapid decrease in hardness near the interface during the isothermal holding in the first stage for all specimens with different initial compressive strains; however, the isothermal holding required for decrease in hardness becomes longer with increasing initial compressive strain. After isothermal holding of 50 s, which corresponds to the end of the first stage for the specimen with initial compressive strain of 15%, the hardness of all specimens becomes relatively similar with a slightly higher value for specimens with higher initial compressive strain. The decrease in hardness seems to be closely related to the decrease in misorientation during the first stage. Thus, it is concluded that the hardness near the interface negatively affects the interfacial strength in the first stage.
Relationship between distance from the interface and hardness of specimens with 5, 10 and 15% initial compressive strains on the steel side: (a) as-compressed (1 s), (b) during the first stage (18 s) and (c) at the end of the first stage.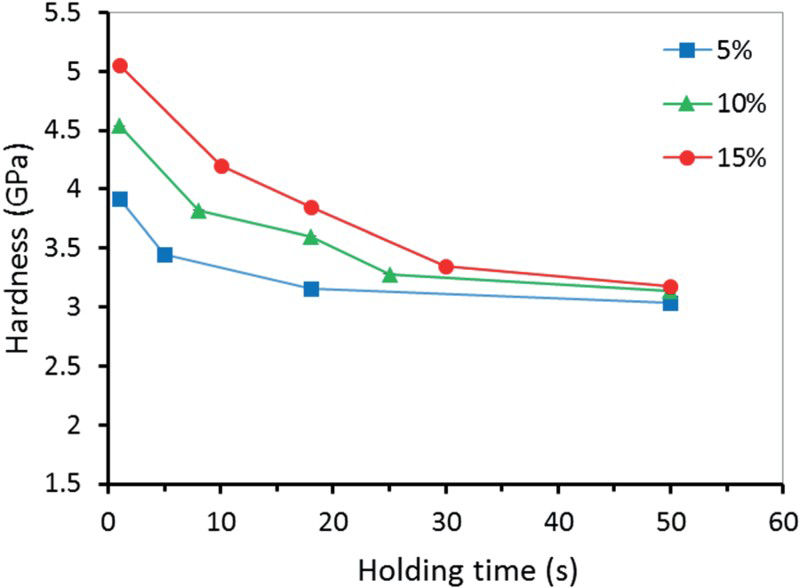
Bonding interface fracture surface
Figure 8 shows the fracture surface, which was tilted 70° around the horizontal axis and observed using the SEM, on the steel side of the specimens with 5 and 15% initial compressive strains during the isothermal holding of the first stage. It was found that fracture occurred at the bonding interface for all specimens. Under the as-compressed condition, as shown in Figure 8(a,d), the compressed area can be seen as horizontal grooves on the fracture surface, which was considered to be the contact area in Figure 2. Smooth fracture surfaces were found in the as-compressed specimens; in other words, the plastic deformation during the fracture of the bonding interface was limited under the as-compressed condition. Nevertheless, the grains at the contact area of the specimen with 5% initial compressive strain showed marginally larger plastic deformation on the fracture surface than those of the specimen with 15% initial compressive strain. After a period of isothermal holding, protrusions of lattices on the fracture surface were found at the contact area in the specimens with both 5 and 15% initial compressive strains. In addition, the deformation during the interface fracture of the lattices at the contact area on the steel side significantly increased with isothermal holding in the first stage. Also, the increase in deformation seemed to arrest crack propagation and enhance the strength per contact area in the first stage. Therefore, both the strength of bonding between two components and the plastic energy dissipation during the interface fracture play essential roles in the evolution of interfacial strength.
SEM images of fracture surface on steel side, tilted 70° around horizontal axis, of specimen with 5% initial compressive strain: (a) as-compressed (1 s), (b) during the first stage (18 s) and (c) at the end of the first stage and specimen with 5% initial compressive strain: (d) as-compressed (1 s), (e) during the first stage (18 s) and (f) the end of the first stage.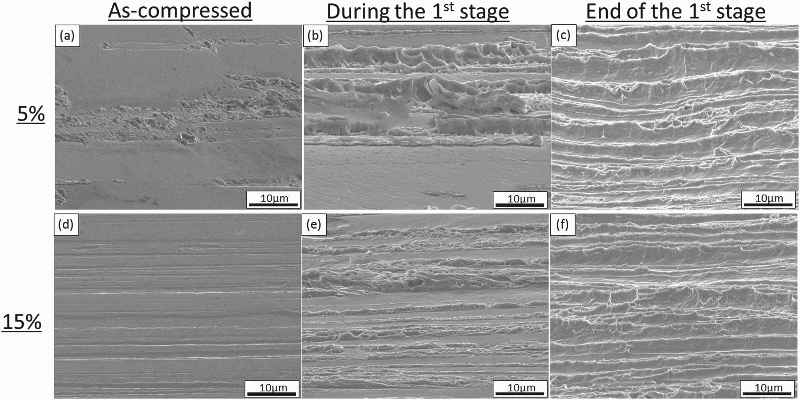
Discussion
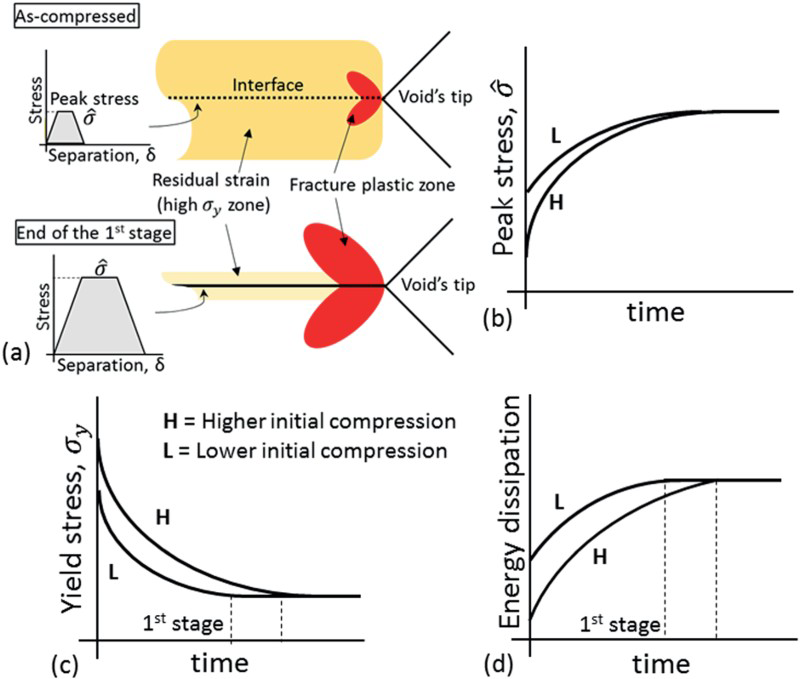
In the overview of interface adhesion and fracture reported by Evans et al. [13], several adhesion parameters, including atomic and continuum levels, were proposed for the weak interface between metals and ceramics. In the present study, we found that two adhesion parameters seem to play important roles in the strength evolution of the contact area and significantly change with the isothermal holding in the first stage; these parameters are peak stress
(a) Schematic illustration of the bonding interface with a deformed area and the fracture plastic zone size during fracture process under the as-compressed condition and after the first stage. (b) Evolution of peak stress of the interface. (c) Evolution of yield stress of components near the interface. (d) Evolution of plastic energy dissipation during interface fracture of specimens with different initial compressive strains in the first stage. and yield stress
 , which are illustrated in Figure 9(a). The peak stress determines the intrinsic strength required to separate the bonded crystalline components from each other at the interface. Higher peak stress implies larger work of interface separation at the atomic level and correlates with the interfacial strength in continuum level. On the other hand, the yield stress of components near the interface is closely related to the plastic energy dissipation at the crack tip during interface fracture. From the embedded process zone model [13], the plastic energy dissipation enhances the interfacial strength in the case of highly ductile metals exhibiting low yield stress and high plastic deformability. Thus, the strength evolution of contact area, which was measured using the uniaxial tensile test, should be affected by both the change in the intrinsic strength of the interface and that in the microstructure of the components at the bonding interface.
In the solid-state bonding of the IF steel and pure nickel in the present study, the residual strain caused by compression on the steel side adjacent to the bonding interface significantly decreases during the first stage. In the study of Mukunthan and Hawbolt [14], it was reported that the recovery process of highly deformed ultralow-carbon steel during isothermal holding at temperatures from 773 to 923 K was rapid in the early stage of isothermal holding and decelerated within a few hundred seconds. Small grains near the interface, which were highly distorted under the as-compressed condition, were found to recover during the first stage, as shown in Figure 3, but the formation of new grains by recrystallisation was not found. The decrease in residual strain leads to decrease in yield strength in the area near the bonding interface, as shown in Figure 9(c).
The simulation in our previous study [10] revealed that the as-compressed interface is extremely weak after the compression owing to the incoherency of lattices and defects between components, indicating the low peak stress of the interface under the as-compressed condition. It was also shown by our simulation that the peak stress increases during isothermal holding, induced by atomic short-range rearrangement at the bonding interface, as shown in Figure 9(b). Lattices at the bonding interface of a specimen with higher initial compressive strain are more disordered than those of specimens with lower initial compressive strain, implying that the peak stress of a specimen with higher initial compressive strain is lower than those of specimens with lower initial compressive strain, as also illustrated in Figure 9(b).
The microstructure near the interface, on the other hand, was heavily deformed by compression, resulting in significant increase in yield stress. The fracture surfaces exhibited in Figure 8 reveal significant increase in plastic deformation during the fracture with increasing isothermal holding, indicating that the strength per contact area was affected by the amount of plastic energy dissipation. In addition, yield stress was found to decrease considerably only in the first stage, as illustrated in Figure 9(c). Consequently, the gradient of the evolution of strength per contact area in the first stage in Figure 2 can be distinguished from that in the second stage. The above results suggest that the strength evolution at the contact area should be determined by the increase in the peak stress of the bonding interface and the ability to plastically deform at the crack tip of components during interface fracture.
Higher compressive strain deteriorates the strength evolution of the contact area in the first stage by increasing the yield stress of the microstructure near the interface and reducing the plastic energy dissipation during interface fracture. At the same isothermal holding in the first stage, the strength of the contact area of a specimen with higher initial compressive strain is lower than that of a specimen with lower initial compressive strain, and thus, the isothermal holding in the first stage should be longer for specimen with higher compressive strain, as illustrated in Figure 9(c,d). Accordingly, it can be concluded that the compressive strain greatly affects the strength evolution of the contact area in specimens.
Conclusions
The effects of compressive strain on the evolution of the microstructure and the strength per contact area of a steel/nickel bonding interface formed by hot pressing and subsequent isothermal holding at a low temperature were studied. The conclusions drawn in the present study are as follows:
The increase in interfacial strength during the first stage seems to be affected by the increase in the intrinsic peak strength of the bonding interface and the amount of plastic energy dissipation induced by interface fracture, which is closely related to the residual strain at the bonding interface. The plastic deformation at the interface induced by the initial compression significantly decreases during the first stage, leading to decrease in the yield stress of the microstructure around the interface and consequent increase in plastic energy dissipation during interface fracture.
Footnotes
Disclosure statement
No potential conflict of interest was reported by the authors.