
Abstract
An ingenious experimental programme by combining artificially thickened oxide layer as marker material and ‘stop-action’ welding were used to study the material flow and defect formation in friction stir welding of aluminium alloys. The results showed that material flow around the pin on the advancing side (AS) was severer than that on the retreating side (RS) and the fastest velocity of material flow in the middle stir zone (SZ) was 43.9 mm s−1. Moreover, the material under the RS shoulder included extruded metal only and the material under the AS shoulder included extruded and rotated metal. Lastly, instantaneous void occurrence and insufficient inflow material were reasons for the preferential formation of void defects in the top SZ on the AS.
Introduction
The increasing demand for light-weight and high-strength sheet metals, such as aluminium and magnesium alloys, in the aerospace, ship manufacturing, and railroad transportation industries have attracted the attention of manufacturers toward friction stir welding (FSW) because of the high mechanical properties of FSW light alloy joints [1-3]. Compared with conventional fusion welding, FSW does not involve melting and solidification of the base materials (BM) that are joined during welding [4-6]. However, void defects (including tunnel defects) sometimes occur in FSW joints if improper parameters are used in the welding process [7, 8].
Recently, there has been a consensus that inappropriate material flow is the main reason for defect formation during FSW [9-11]. Based on different flow-partitioned deformation zones, Zhang et al. [6] and Arbegast [9, 12] have developed some conceptual models of material flow to describe the conditions of void defect formation. Further, Liu and Wu [13] have suggested that a time-delay feature of material flow should be considered as an inducement of tunnel defect formation. However, due to complexity and instantaneity [2, 14, 15], the material flow during FSW is very difficult to observe and describe, and the mechanism of the formation and elimination of void defects in FSW has not been illuminated very well.
According to many related studies, void defects always occurred in the stir zone (SZ) on the advancing side (AS) [7-9, 13, 16-26]. For example, Chen et al. [16] reported that void defects were observed in the top SZ on the AS. This means that the SZ on the AS is potentially the position of defect formation during FSW. However, void defects were also found to appear in the SZ on the retreating side (RS) [27]. It is important to point out that the reason for preferential formation of void defects at the SZ on the AS has not been well understood so far.
It is recognised that there are distinct material flow differences in different positions of the welds [9, 12]. The unusual material flow in the SZ on the AS might be the reason for void defect formation and, thus, accurate description of material flow in this position could provide a better understanding of the void defect formation mechanism at this position.
In recent years, several studies have been conducted with the goal of understanding the material flow in different positions during FSW. Colligan [28] reported that stirred material originated from the upper portion of the pin path and other material in the weld zone was simply extruded around the RS of the pin. Liu et al. [10] reported that the distance between the deformation initiation point and the pin decreased with the increase in the cross-sectional depth. Although some related simulation studies [29, 30] reported that the initially located points on the AS revolved around the pin and eventually most of them returned to the AS, the material flow in the SZ on the AS has received little attention.
The material velocity, reflecting the material flow intensity, during FSW plays an important role in understanding the material flow behaviour [31, 32]. In recent studies, some methods have been used to investigate the material velocity during FSW. Chen et al. [16] used the distance gap between the detached shear layers to calculate the material velocity. However, this method obtained the material velocity at the back of the pin only. In addition, Morisada et al. [31, 33] obtained the velocity of marker material, which was inserted into the welded workpieces at different locations to trace the material flow, using two pairs of X-ray transmission systems. Liu et al. [10] also evaluated velocity based on the deformation of marker material. As these velocities only involved information regarding marker material in workpieces, the material velocity during FSW needed further study.
In this study, a combined method of artificially thickened oxide layer as the marker material [6] and ‘stop-action’ welding [10, 13, 16, 34], was used to investigate the material flow in the SZ on the AS. Meanwhile, the material velocity during FSW was studied and the collective results were used to identify the reason for void defect formation in the SZ on the AS.
Experimental procedure
The materials used in this study were 6.0-mm-thick rolled plates of 2014Al-T6 with nominal composition of Al–4.8Cu–0.6Mg–0.7Mn–0.7Fe–0.9Si (wt-%). Artificially thickened oxide layer, which was obtained using an electric discharge machine on the butt surface of 2014Al-T6, was chosen as marker material. Compared with the natural oxide layer on the aluminium plates, the artificially thickened had a larger thickness, beneficial for tracing after FSW. Compared with the conventional marker materials, the oxide layer is not only thin but also metallurgically bonded with the welded material. Thus, the artificially thickened oxide layers (hereafter called the oxide layer) in different positions of a FSW joint can be used to trace the flow information about the welded material directly.
The plates were butt welded along the rolling direction with a tool tilt angle of 2.8° using a FSW machine (China FSW Center, Beijing, China). A welding tool, as shown in Figure 1, with a concave featureless shoulder 20 mm in diameter and a conical threaded pin 8 mm in root tip diameter, 5.73 mm in length, and 1 mm in thread pitch, which was made of heat-treated tool steel, was used in this study. FSW was conducted at a constant traverse speed of 100 mm min−1 with different tool rotation rates of 400 and 500 rev min−1 and the plunge depth of the tool was 0.2 mm during FSW.
A welding tool used in FSW.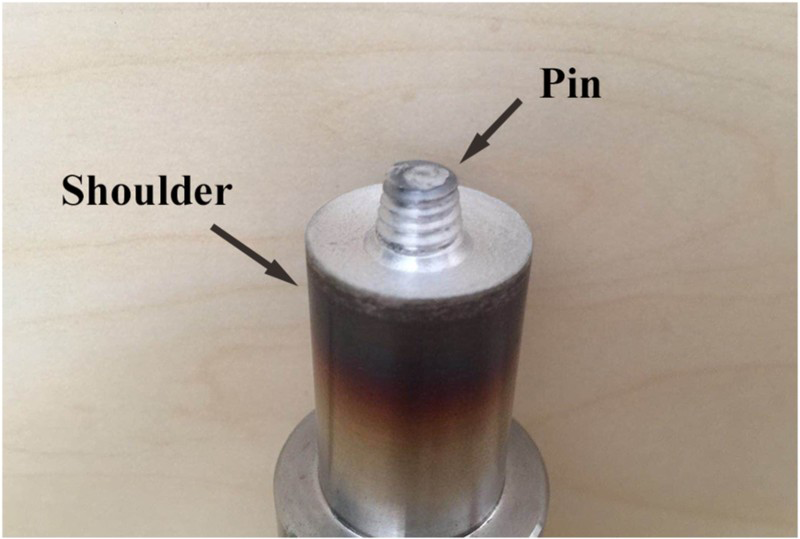
For characterising the three-dimensional position in workpieces, a coordinate system was established, as illustrated in Figure 2(a). The x, y and z directions refer to the welding direction, the perpendicular direction to the welding direction from the RS to the AS, and the normal direction to the plate surface from the top to the bottom. The origin point (point O in Figure 2(a)) was the welding centre on the top surface and pin offsets from y = −4 to +4 mm at an interval of 1 mm were used in FSW processes of 2014Al-T6 under a tool rotation rate of 400 rev min−1 and a traverse speed of 100 mm min−1. Schematic diagrams of the transverse cross-sections (yOz sections) of the ‘offset’ samples with three marked lines at different depths (z = 1.2, 3, and 5.7 mm) are shown in Figure 2(b).
(a) A coordinate system, (b) the transverse cross-sections (yOz sections) of ‘offset’ samples with three marked lines at different depths, (c) ‘stop-action’ welding, and (d) position of the transverse cross-sections in ‘stop-action’ samples.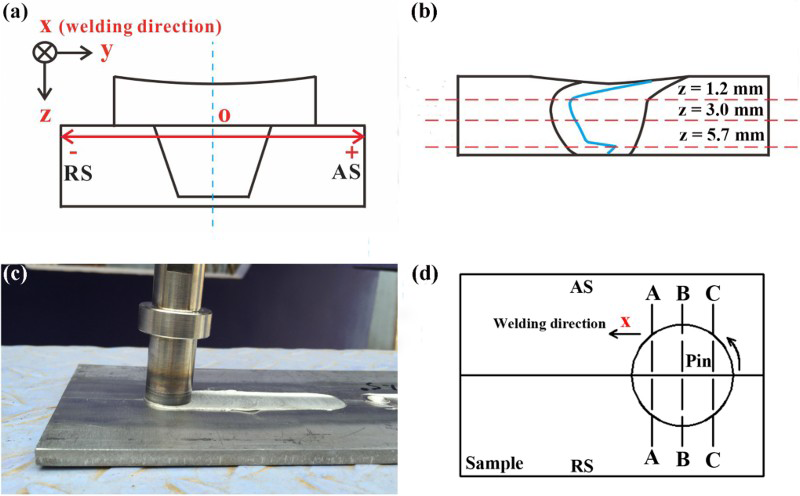
At the end of the welding, the rotating tool was suddenly stopped by a brake device, leaving the tool in the workpiece, and thus utilised to ‘freeze’ the material flow state around the pin (Figure 2(c)), which is the so-called ‘stop-action’ welding. Sometimes, to facilitate the observation, after the rotating tool was suddenly stopped, the tool was withdrawn immediately. The transverse cross-sections of ‘stop-action’ samples at x = 2.5, 0, and −2.5 mm were marked as sections A, B, and C, respectively (Figure 2(d)).
Metallographic observation was performed by optical microscopy (Olympus Corporation HC-300Z/OL). After grinding and polishing, the metallographic samples were etched with two reagents. One was a modified Keller's etching reagent, which included 2 mL HF, 3 mL HCl, 5 mL HNO3, and 190 mL H2O. This etching reagent resulted in a high-quality image of the grain structure. The other reagent was a 2 wt-% NaOH solution, which clearly revealed the oxide layer. Some FSW joints were observed by scanning electron microscopy (SEM, FEI Quanta 600).
Results and discussion
Material flow in different positions
The transverse cross-sectional metallographs of FSW 2014Al-T6 joints, at different offset positions under 400 rev min−1 and 100 mm min−1, showed a dark line (continuous or discontinuous) in the SZ, which was the oxide layer (Figure 3). For the RS offset FSW samples (Figure 3(b,d,f,h)), it was showed that the shapes of the oxide layers at the middle SZ were similar to those of the RS boundary of the SZ. The oxide layers at the top SZ moved to the AS and those at the bottom SZ did not move. The oxide layers for the RS offset FSW samples were continuous lines, which indicated that the material flow in the SZ on the RS was too weak to break the oxide layers [11].
The transverse cross-sectional metallograph of FSW 2014Al-T6 joints at different offset positions under 400 rev min−1 and 100 mm min−1 (etched by NaOH solution).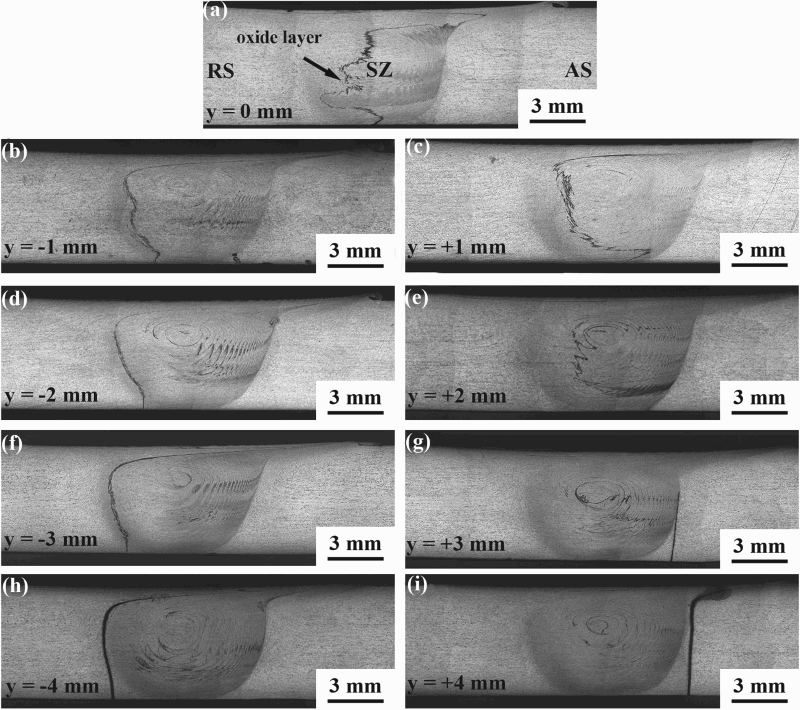
For the AS offset FSW samples, some interesting observations were obtained for the oxide layer (Figure 3(c,e,g,i)). First, the oxide layer at y = +1 mm offset position was a continuous and curved line, which reflected that the material flow in this offset position was not severe. Second, at the top SZ, the oxide layers at y = +2 and +3 mm offset positions appeared to be disconnected, which indicated that material flow in these positions broke off the oxide layers and the materials were fully mixed. Third, the middle and bottom part of oxide layers at y = +4 mm offset position did not move and only the top part of this oxide layer was extruded by the SZ material.
Based on the results in Figure 3, some information on the material flow at different heights for various offset FSW 2014Al-T6 samples was analysed and the resultant statistics regarding oxide layers in initial positions, z = 1.2, 3.0, and 5.7 mm of ‘offset’ samples, are shown in Figure 4(a). The symbols with different colours stand for oxide layers in different offset positions and different shapes stand for oxide layers in different heights. Due to the discontinuous top part of the oxide layers in y = +2 and +3 mm offset samples, information regarding the top part of the oxide layers for these samples was not obtained.
(a) Statistics regarding oxide layers at the initial position, z = 1.2, 3.0, and 5.7 mm of ‘offset’ samples and (b) movement distance of oxide layer at different offsets and height positions.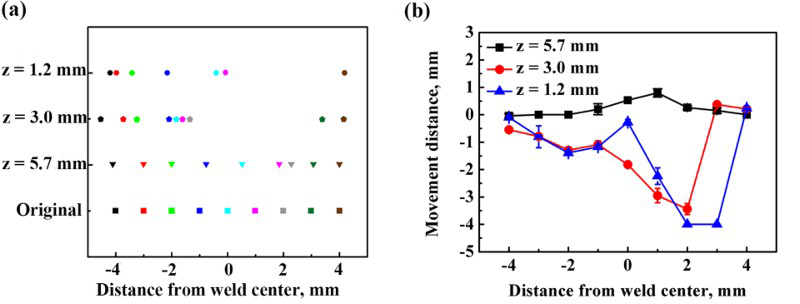
At z = 1.2 mm, only the oxide layer at y = +4 mm offset position moved to the AS, while oxide layers at other offset positions moved to the RS. At z = 3.0 mm, the oxide layer at y = +3 and +4 mm offset positions moved to the AS and those at other offset positions moved to the RS. Meanwhile, the middle part of oxide layers at y = −1, 0, +1, and +2 mm offset positions were in close proximity. Compared with other height positions, the movements of the oxide layers at z = 5.7 mm were relatively small. Because the oxide layers at y = −4, −3, and +4 mm offset positions were far away from the weld centre, these oxide layers did not move, while the oxide layers at other offset positions moved to the AS.
Figure 4(b) shows the movement distances of oxide layers in the y direction at different y and z positions. The oxide layers moved to the AS were marked by positive numbers and the layers moved to the RS were marked by negative numbers. Severe material flow led to the invisible top part of oxide layers at y = +2 and +3 mm offset positions. Thus, the movement distances in the y direction of oxide layers at these positions were defined as −4 mm.
Three important findings are revealed in Figure 4(b). First, the movement distance in the y direction decreased with increased workpiece depth. The oxide layer at z = 5.7 mm exhibited a short movement distance. In comparison, the movement distances of oxide layers at z = 1.2 and 3.0 mm were larger. Second, the oxide layers at z = 5.7 mm moved to the AS. In contrast, most of the oxide layers at z = 1.2 and 3.0 mm moved to the RS. Third, the movement distances of oxide layers in the y direction at the AS offset positions were larger than those at the RS offset positions, which indicated that material flow on the AS was severer than that on the RS. Clearly, the movement distances of oxide layers in the y direction at different heights and offset positions showed that the material flow ability in the top SZ on the AS was the best during FSW.
Figure 5(a–c) shows the oxide layer distributions in the horizontal cross-sections (xOy sections) at z = 1.2, 3, and 5.7 mm for y = 0 mm ‘stop-action’ sample, which were typical oxide layer distributions for the ‘stop-action’ samples. The oxide layer was observed to have rotated with the pin and finally stayed on the AS or the RS. The shapes of oxide layers indicated that the material flow was continuous and laminar [13, 32]. Moreover, there were two kinds of oxide layer distributions at the edges of the SZ. The first one was slight movement of the oxide layer to the AS (Figure 5(d)). The second one was the rotation of a part of the oxide layer with the pin and the extrusion of the other part by the pin (Figure 5(e)).
Oxide layer distributions in the horizontal cross-sections (xOy sections) at different offset positions in ‘stop-action’ samples: (a–c) oxide layer distributions in y = 0 mm offset position at z = 1.2, 3.0, and 5.7 mm, respectively, (d) z = 1.2 mm of y = −4 mm offset position, and (e) z = 3.0 mm of y = +3 mm offset position.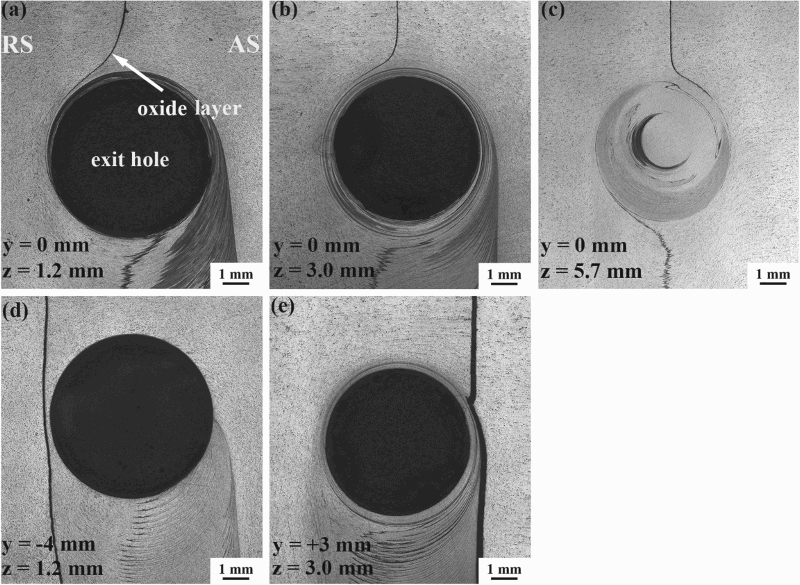
For further analysis, based on the results in Figure 5, schematic diagram of an oxide layer distribution in the horizontal cross-sections during FSW is showed in Figure 6(a). The distance d between the deformation initiation point on the oxide layer and the pin (exit hole) in the x direction indicated the thickness of the deformed material at the initial welding stage. The distance l between the original offset position and the oxide layer at the front end of the pin in the y direction indicated the distance of material flow at the initial stage of welding. Variations in d and l at z = 3.0 mm with different offset positions from y = −2 to +2 mm showed that d at the welding centre (y = 0 mm) was the largest (Figure 6(b)). At the same time, the d values at the RS offset positions were larger than those at the AS offset positions. However, l was observed to increase with the offset position from the RS to the AS.
(a) Schematic diagram of an oxide layer distribution in the horizontal cross-sections, (b) measured values of the d and l at z = 3.0 mm, (c) schematic diagram of a two-oxide layer distribution in the horizontal cross-sections, (d) measured values of s1 and s2 at z = 3.0 mm, and (e) material velocity from RS2 to AS2.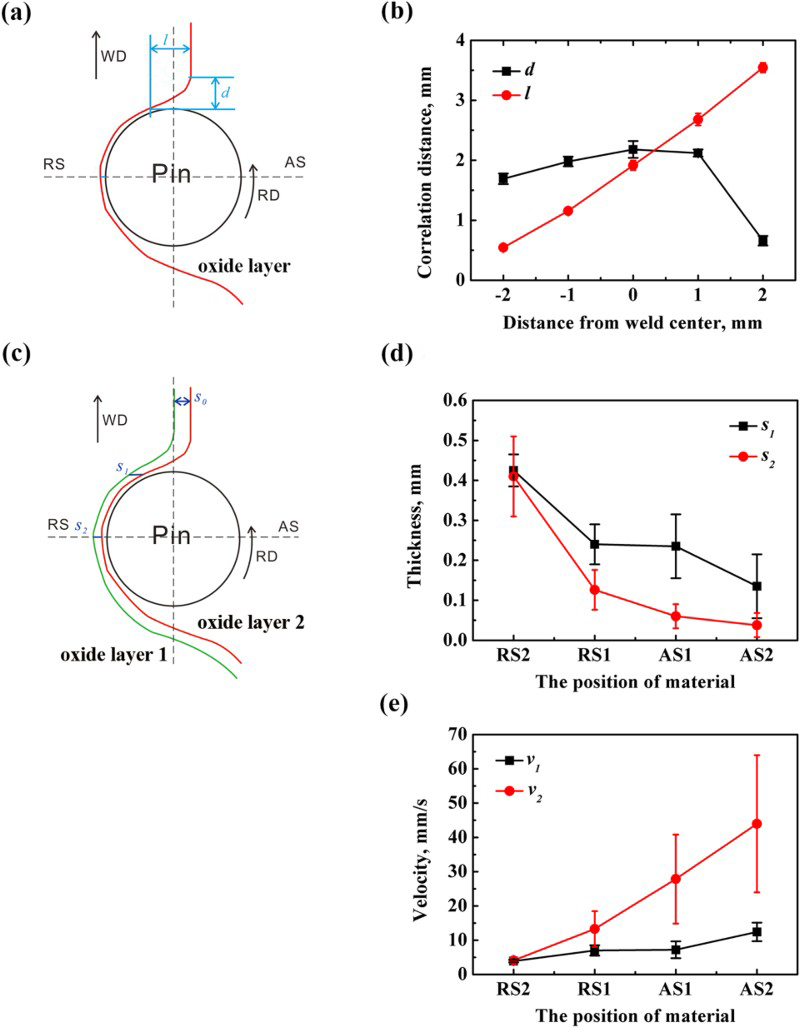
Figure 6(c) shows a schematic diagram of a two-oxide layer distribution in the horizontal cross-sections during FSW. s0 was the distance between adjacent oxide layers at the original offset positions in the y direction. In this study, s0 was 1 mm. Then, s1 was the distance between adjacent oxide layers at the front end of pin in the y direction and s2 the distance between adjacent oxide layers at the welding centre in the y direction. The material at z = 3.0 mm between the oxide layers at y = 0 and +1 mm offset positions was marked AS1 and that between the oxide layers at y = 0 and −1 mm offset position marked RS1; the rest were marked in a same manner. Variations in s1 and s2 at z = 3.0 mm with different materials from RS2 to AS2 showed that s1 and s2 decreased with the material from the RS to the AS (Figure 6(d)). Meanwhile, the s1 and s2 of RS2 were larger than those of the other materials.
Assuming the plastic aluminium alloy as incompressible, the material flow at z = 3.0 mm was regarded as a one-dimensional incompressible fluid flow, which met the requirements of the one-dimensional continuity equation, i.e. the volume of the fluid flowing at any two cross-sections was equal at any instance [13, 29]. The continuity equation of material flow during FSW was given as
 , where v0, v1, and v2 are the material velocity at the initial deformation position, the front end of pin, and the welding centre, respectively. The material velocity at the initial deformation position (v0) was the traverse speed, which was 1.67 mm s−1 in this study.
Variations in v1 and v2 with different materials from RS2 to AS2 revealed some interesting observations regarding changes of velocity (Figure 6(e)). First, v1 and v2 increased from the RS to the AS, which reflected that material velocities on the AS were larger than those on the RS. Second, the gap between v1 and v2 of RS2 was very small and the gap between v1 and v2 of the material increased from the RS to the AS, which indicated that the velocities at RS2, as the material was extruded by the pin, did not change. Third, the maximum velocity of material at z = 3.0 mm was 43.9 mm s−1, which was the v2 of AS2 (Figure 6(e)). In contrast, the velocity of the pin edge at z = 3.0 mm was 136.1 mm s−1, which was larger than that of material during FSW and indicated that there was relative movement between the welding tool and material. The average material velocities during FSW in other studies have been reported as 14–38 mm s−1 [13, 16, 32], which are consistent with the present results.
Void defect formation in the SZ on the AS
The material flow process during FSW is further illuminated by observing the transverse cross-sections of ‘stop-action’ samples under 400 rev min−1 and 100 mm min−1. Material flow details around the pin showed that there were the great differences in the material flow between the AS and the RS during FSW (Figure 7). First, the material under the AS shoulder was more than that under the RS shoulder and the space under the RS shoulder was not filled by material. According to the grain size and morphology (Figure 7(b,c)), the material under the RS shoulder included extruded metal only and the material under the AS shoulder included extruded and rotated metal. Second, a phenomenon involving instantaneous voids was noticed during FSW. A void that was at the triple junction of pin thread, SZ, and thermo-mechanically affected zone (TMAZ) on the AS was observed in sections B and C of ‘stop-action’ samples (Figure 7(d,g)). However, defect-free FSW joints were obtained under these parameters (Figure 3(a)). This indicated that this void at the top SZ on the AS could be filled during subsequent welding process.
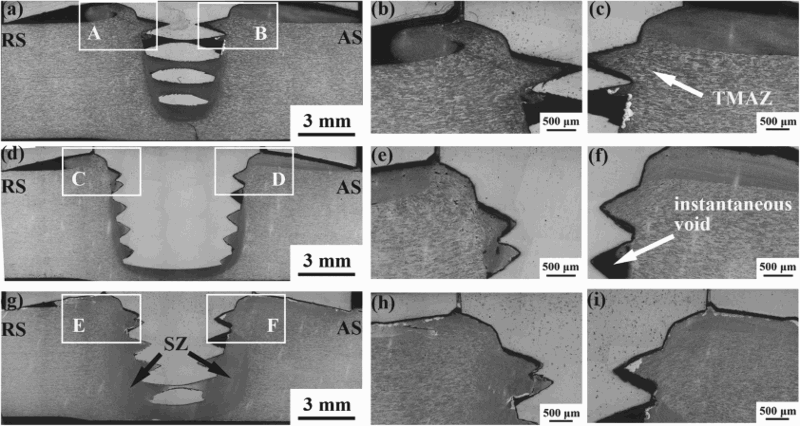
According to deformed grains, the material movement above the instantaneous void showed a strong downward trend (Figure 7(f,i)). Moreover, the results of ‘stop-action’ welding also showed that the material flow ability at the top SZ on the AS was the best, which led to the formation of instantaneous voids in ‘stop-action’ samples. Intuitively, the instantaneous void feature of material flow played a very pivotal role in void defect formation at the top SZ on the AS.
To identify the reason for void defect formation at the top SZ on the AS, 2014Al-T6 was welded under 500 rev min−1 and 100 mm min−1, using a slightly increased rotation rate to promote the material flow during FSW. A strip area ∼1 mm in length was observed on the bilateral junction of the SZ and TMAZ on the AS (Figure 8(a,b)). The strip area was a special microstructural zone with a 30 μm diameter void in the top position, as shown in Figure 8(c). Moreover, the material flow around the strip area was very complex; the morphology of deformed grains above the strip area (Figure 8(b)) was similar to that above the instantaneous void in ‘stop-action’ samples (Figure 7(d,g)). This indicated that the instantaneous void occurred during the welding process and the downward flow trend of the material above the strip area was strong. Meanwhile, the material on the RS did not move into the strip area due to the continuous oxide layer.
Transverse cross-section of FSW joints under 500 rev min−1 and 100 mm min−1: (a) transverse cross-section of FSW joints, (b) position B, and (c) SEM micrographs of position B.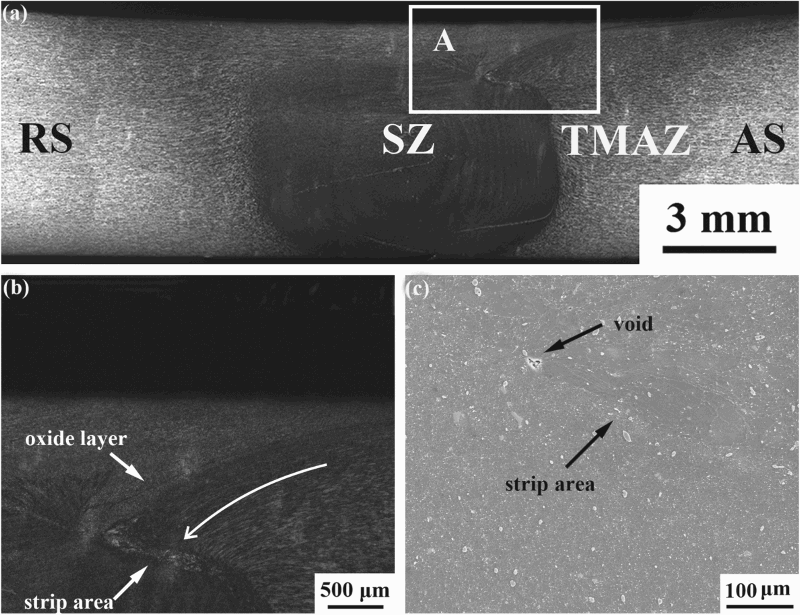
According to the microstructural characteristics of the strip area and the material flow around the strip area, the strip area was considered a transition state of the void defect. On the RS of the strip area, the oxide layer was continuous, so that no RS material flowed into the strip area. The instantaneous void was not filled faultlessly by the material above the strip area only. The strip area was formed to coordinate the deformation and flow of material. Thus, the preferential formation of void defects at the top SZ on the AS was attributed to instantaneous void occurrence and insufficient inflow material.
Material flow under a low rotation rate
It was noted that there was a critical total mass of material (
 ) per cycle for a steady FSW process, moving to the tailing side to avoid the void defects, which was originally defined by Trueba et al. [24]:
 . Further, the outflow material at i position was represented by [9]:

 was defined as the material mass that flowed out of j position and moved into the i position. Thus, the total mass of material that flowed into i position was represented by Equation (3). Generally, a FSW process without defect met the following inequality:

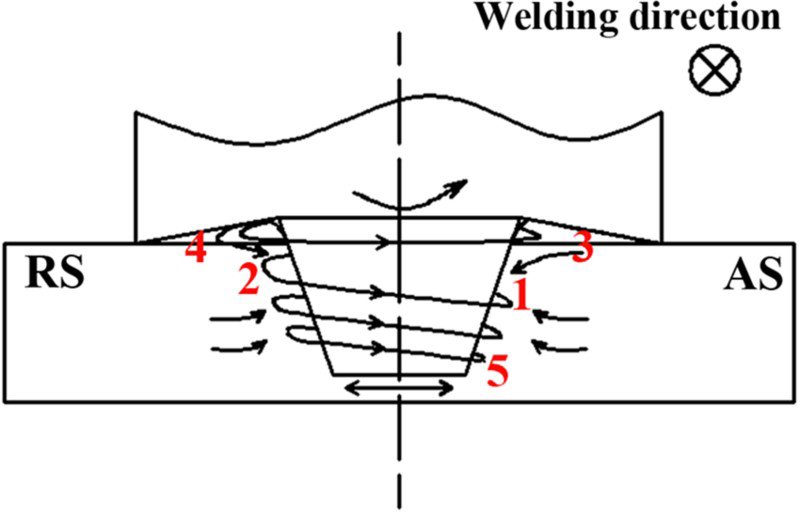
Based on these results in Figure 7 and other related studies [6, 19, 35], the schematic of material flow during FSW under a low rotation rate is shown in Figure 9. For the AS of the SZ top (Figure 9, position 1), the total mass of material that flowed out and moved into position 1 were
The schematic diagram of material flow under a low rotation rate. and
and
 , respectively. Abundant outflow material and less inflow material were the reason for the void defect formation at this position during FSW. With increased rotation rate, the material at the top SZ on the RS (
 ) broke out of the butt surface and moved into position 1 and sufficient inflow material hindered the defect formation in this position.
Conclusions
In summary, a combined method of the artificially thickened oxide layer as the marker material and ‘stop-action’ welding was used to investigate the material flow and the defect formation in FSW of aluminium alloys. The following conclusions are reached:
the flow ability of material around the pin decreased with increased workpiece depth. Meanwhile, the material flow around the pin on the AS was severer than that on the RS and the material flow ability at the top SZ on the AS was the best during FSW; the fastest flow velocity of material in the middle SZ was obtained, which was 43.9 mm s−1. In comparison, the periphery velocity of the pin was larger than that of material flow during FSW. This indicated that there was relative movement between the welding tool and material; the material under the AS shoulder was more than that under the RS shoulder and the space under the RS shoulder was not filled by material. Moreover, the material under the RS shoulder included extruded metal only and the material under the AS shoulder included extruded and rotated metal; the preferential formation of void defects at the top SZ on the AS was determined to result from instantaneous void occurrence and insufficient inflow material.
Footnotes
Disclosure statement
No potential conflict of interest was reported by the authors.