
Abstract
Many models have been developed to explore solidification segregation and dendrite structure in additively manufactured parts. However, these models tend to be computationally expensive and consider only a limited number of alloying elements, compromising their practical application. In this work, a methodology to extend the Scheil model, based on interface metastable equilibrium assumptions, is established to predict the spatial compositional maps due to micro-segregation for a laser-powder bed fusion (L-PBF) build of alloy 718. The compositional maps are contrasted against experimental data measured in a unit dendrite cell by transmission electron microcopy. The validity of Scheil's implicit assumptions under the rapid solidification conditions in L-PBF is further discussed. The extended Scheil model is shown to be computationally efficient and readily applicable to multi-component systems.
Keywords
Introduction
Metal additive manufacturing (AM) is a transformative technology addressing manufacturing challenges in several fields, such as aerospace and biomedical. One of the most applied AM techniques is powder bed fusion with a laser heat source (L-PBF) [1]. L-PBF is based on the scanning of a focused laser beam on a powder layer surface in a pattern that fills the cross section shape of the part being built. Once a layer is complete, a new powder layer is applied over the previous surface and the laser is scanned for the next cross-section. In L-PBF, the dimensions of the molten pool are on the order of 100 µm, and as such, the distance between adjacent tracks and layer thickness are typically around 50 µm. This leads to a very refined surface roughness and high fidelity to designed part shape. The small molten pool rapidly solidifies, resulting in a microstructure that resembles a weld. This microstructure is quite unique, with very refined (∼1 µm) columnar or equiaxed grain structure [2].
Alloy 718 is an Nb bearing, precipitation strengthened Ni-base superalloy [3, 4]. Its high corrosion resistance combined with its high strength at elevated temperatures make it an ideal material for applications involving long exposure to high temperatures, such as aerospace and energy industry components. The need for complex geometry parts in these industries makes L-PBF of alloy 718 a strategic priority [5]. Additionally, alloy 718 is known for its good weldability, resulting from its slow precipitation kinetics, when compared to other Ni superalloys [6]. The uniqueness of the solidification structure from L-PBF requires specific post-processing conditions for homogenization, strengthening aging or stress relief heat treatments. Typically, the heat treatment conditions have been developed based on the nominal composition of the alloy, or on empirical evaluation of materials produced through other conventional methods. However, when applied on L-PBF parts, they can generate undesirable results. For example, Amato et al. [7] observed formation of γ″ in alloy 718 processed using L-PBF after an annealing and hot isostatic pressing treatments, both performed at temperatures above 950°C. However, the γ″ solvus temperature for the nominal composition is close to 900°C. In alloy 718, Nb partitions to the liquid during solidification. As Nb stabilizes δ and γ″ phases, the higher Nb content at interdendritic regions increases solvus temperatures and accelerates precipitation reactions.
In order to accelerate the deployment of additively manufactured parts, tools that can adequately predict solidification microstructures and how they can be post-processed are required. Particularly, understanding solidification and extent of micro-segregation taking place is imperative for determining efficient post build heat treatments.
One possible approach is the use of interface metastable equilibrium (IME) assumptions. Under this approach, the compositions at the solid/liquid interface at a specific temperature can be calculated based on metastable equilibrium phase diagram information, without the need for kinetic calculations. One example of a modelling approach based on such assumptions is the Scheil–Gulliver method [8], which is widely used to predict solidification behaviour and second phase formation in many alloy systems, including Ni superalloys [9]. This approach has a number of advantages. First, it is accessible, being readily available in a number of commercial softwares. Second, it can consider multicomponent formulations and require little data input besides the standard thermodynamic databases, also available commercially. The Scheil–Gulliver method has been used in conjunction with AM in several instances to obtain solidification phase, composition and other property. These include evaluating second phase formation during solidification [10, 11], determining specific heat during solidification [12] or identifying interdendritic solute concentration [13, 14].
However, the simplicity of the Scheil–Gulliver method carries some disadvantages. Specifically, results are independent of solidification conditions, such as cooling rates or thermal gradients. Also, there is no consideration for morphology or spatial scale in its formulation. As discussed in Sames et al. [15], modelling of phase transformations on the liquid and solid state during AM is quite challenging, and phase field models (PFMs) have been increasingly used to capture the complexities of solidification during AM conditions. PFM [16-18] can provide quantitative predictions of microstructure evolution. Specifically, they have been successfully used to study dendritic structure formation, solute segregation and solidification texture during AM [19-22].
However, these methods are computationally expensive to be performed at the large length and timescales required by the AM process. Hence, many PFM studies [20, 21] restrict the simulations to binary alloys while the real alloy system is typically multicomponent. Some studies further assume constant cooling rate and thermal gradient [19, 20] which may not be a reasonable assumption as it is known that different regions of the melt pool experience different cooling rates and thermal gradients [23].
As such, a compelling case for the usage of IME based methods still exists. Given their formulation, they are computationally inexpensive. Although the Scheil–Gulliver method is not dependent on solidification conditions, it can be modified to consider other phenomena, such as solute trapping and incomplete liquid mixing. When these are considered, the actual solidification conditions are taken into account. IME methods still have the disadvantage that they do not deliver morphological information, only composition as a function of fraction of solid. Nonetheless, if the solidification morphology evolution diagram for alloy 718 is considered [24], the typical values for thermal gradient and interface velocity in L-PBF would result in a columnar dendritic structure. Under this condition, the solidification grains observed are formed through epitaxial nucleation and growth, so free nucleation of the matrix phase (e.g. γ) in the liquid pool is not commonly observed. Therefore, by predicting the primary dendrite arm spacing (PDAS) between cells, assuming that radial growth of dendrite cells is isotropic on the plane perpendicular to growth direction, and combining it with results from IME based methods, the segregation profile across cells can be determined.
In this work, we evaluate the use of solid–liquid IME assumptions for predicting as-solidified microstructures in L-PBF of alloy 718. Results from the IME based Scheil method are combined with PDAS calculations to obtain micro-segregation maps, and modelling results are contrasted against measured compositional profiles. The effect of implicit IME and Scheil hypotheses on the final result is also addressed.
Experimental method
Builds
The AM parts analysed were produced as 15 × 15 × 15 mm3 test blocks. The detailed processing conditions are available in reference [4], and some key processing parameters are provided in the following for completeness. Builds were produced in an EOSINT M280 machine. Laser power of 285 W and scanning speed of 960 mm s−1 were used. The substrate was preheated to 80°C, layer height was 40 µm and hatch spacing was 100 µm. The scan direction was rotated by 67° after each layer was finished.
Characterization
The blocks were sectioned parallel to the build direction at their center, and the cross-sectioned samples were ground and polished using colloidal silica by following the standard sample preparation practice for metallography. Scanning Electron Microscopy (SEM) characterization was performed on as-polished samples with an FEI Apreo microscope. Images were obtained with an in-lens detector with a filter for higher energy electrons, optimized for backscattered electron signal. The incident electron energy was 2 keV. Electron Backscattered Diffraction (EBSD) was performed to identify grain orientation. EBSD data was captured with an incident beam energy of 20 keV. By combining the use of EBSD and backscattered electron data, regions suitable for transmission electron microscopy (TEM) were chosen and an FEI Helios focused ion-beam microscope was used to extract thin foils for TEM. Through this process, the foil analysed in this study was determined to have its cellular growth direction parallel to the foil plane. Transmission and scanning transmission electron microscopy (STEM) was done with a FEI TF-20 Tecnai 200 kV TEM at 86 mm camera length. The microscope was equipped with an EDAX Apollo XLT Windowless energy dispersive X-ray detector.
X-ray Energy Dispersive Spectroscopy (XEDS) data was collected as a map with a pixel size of approximately 2 nm. Elements considered for the map were Ni, Cr, Fe, Nb, Mo, Co Al, Ti and Si. To minimize noise, the map was down sampled with a 4 × 4 pixel binning. To convert counts into weight fractions, a larger map was collected over a 5 × 5 µm2 region of the foil. The counts were averaged over the whole map, and scalar factors were determined for each element so that the average number of counts times the scalar factor was equivalent to the nominal composition of the powder. These factors were then applied to obtain compositions at each pixel in the higher magnification map.
CalPhaD assessments
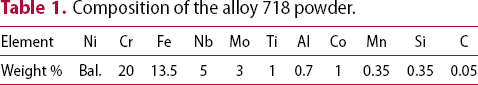
Composition of the alloy 718 powder.
Diffusion calculations were done with the diffusion module within Thermo-Calc®. The model was set up with cylindrical geometry and 100 nodes, with a system size of 0.5 µm, equivalent to the typical cell radius. A γ phase (FCC) nucleus was added to the center of the cylinder. The temperature history of the model started at 1400°C and was cooled down at a cooling rate of 106°C s−1 [4, 23]. The calculation was done with a simplified system containing Ni, Cr, Fe and Nb.
Dendrite arm spacing determination
PDAS was used to determine the length-scale of the compositional map calculation. A classical model for the prediction of PDAS is the Kurz–Fisher model [27]. In their work, an analytical expression was derived for estimating PDAS using the Mullins–Sekerka instability [28] theory on the solid–liquid interface of a binary alloy. This model was extended to multi-component systems and applied to alloy 718 as explained below.
PDAS for the multicomponent system was calculated using the following equations.
 – index of the solute, (e.g. Cr and Fe),
 – diffusivity of solute
 in liquid
 ,
,
 – average concentration of solute
 ,
,
 – Gibbs–Thompson coefficient of solid–liquid interface,
 – non-equilibrium solidification range (estimated from Scheil [9]),
 – thermal gradient and
 – cooling rate. The solute-dependent phase diagram constants
 were calculated using Thermo-Calc® [25] and the procedure is detailed below.
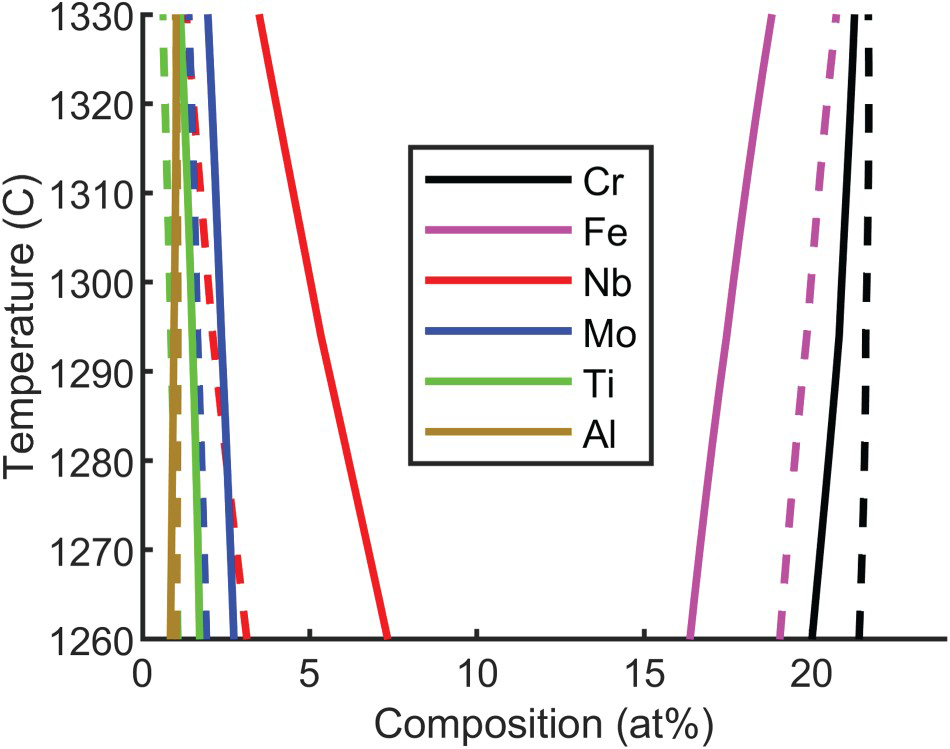
Compositions of matrix (
Equilibrium compositions of the solid γ phase (dashed lines) and liquid L phase (solid lines) in the solidification regime (1260°C–1330°C) for elements Cr, Fe, Nb, Mo, Ti, and Al. ) and liquid (
 ) phases were calculated as function of temperature in the equilibrium solidification regime (1260°C–1330°C) for alloy 718. Only the elements showing a significant partitioning between γ and L were considered for PDAS calculation and are shown in Figure 1. A linear fit was performed on these data (
 ) to obtain the solidus (
 and liquidus slopes
 along with their respective y-intercept (
 and
and
 ) values.
The model was validated using the experimental data reported by Song et al. [29]. Specifically, the predicted PDAS is within the range of the experimentally measured PDAS values (1.0–1.8 µm). Figure 2 shows the calculated PDAS for a set of cooling rates and thermal gradients on the range normally observed during L-PBF of Ni alloys [23].
Calculated PDAS as a function of cooling rate for different thermal gradients typically observed in L-PBF [23].
Determination of compositional maps
IME methods deliver compositional information as a function of fraction of solid. Assuming a dendrite cell isotropically grows radially from its core on the plane perpendicular to the cell growth direction, the fraction of solid at each position of the cell can then be correlated with the distance of such position to the center of the cell. This is done by correlating the fraction of solid with the square of the distance from a point in the cell to its axis. However, this relation is not valid at intercellular regions. To overcome this, it is assumed that cores will be distributed in a hexagonal plane lattice, a spatial arrangement used by Bhadeshia and Svensson for weld metal solidification [30]. Each cell is assumed to grow independently in a cylindrical front (Figure 3). With
(a) Schematic representation of cell distribution as a hexagonal grid. (b) Dimensions of a single dendrite cell and mathematical parameters used in
 as the dendrite arm spacing and
 as the radius in a cylindrical coordinate system centred on the cell core, the fraction of each layer of solid created as the cell grows can be defined as
 .
.
 is fixed when
 and is a function of
 when
when
 . The fraction of solid as a function of cell radius is determined by integrating
 :
:
 calculation. (c) Resulting fraction of solid as a function of distance from the cell core.
The concentration of solute across the cell structure is determined by interpolating the IME model output on the determined solid fraction.
Results
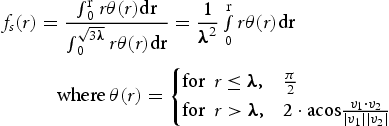
Figure 4 shows the result of a Scheil model run with the composition in Table 1. On the Scheil method, the metastable condition can be imposed by pre-selecting the phases considered in the CalPhaD calculations [31]. In alloy 718, the second phases commonly observed on solidification are Laves and MX carbonitrides, rich in Nb, Ti, N and C [32]. The model was limited to these phases.
Scheil simulation with full composition results. (a) Fraction of solid as a function of temperature. Line colors indicate the different transformation paths. (b) Distribution of solute elements across γ phase as it grows.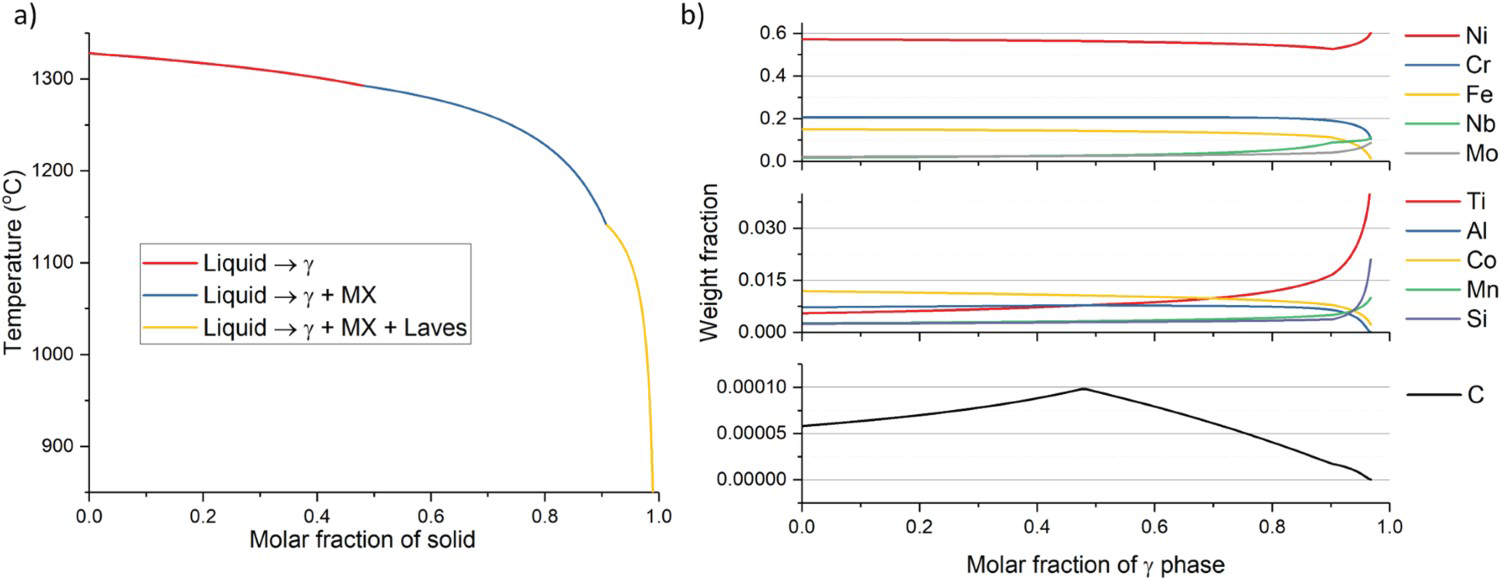
The second phases forming on solidification are close to stoichiometric, and therefore, the amount of these phases present when the material completely solidifies will depend on the composition of the liquid while they are being formed. Song et al. [29] identified an average Laves volume percentage of 2.64% in the samples used in this work. Some variability is present, with a maximum volume percentage of 2.81% and minimum of 1.68%. The Scheil model predicts a Laves content of 2.14%. Although there is a match between the model prediction and the measured phase content, this does not imply that the model is correctly representing solidification. Further validation requires comparing the Scheil model γ phase compositional distribution results with the measurements from built materials.
Figure 5 shows the calculated compositional maps derived from the Scheil model results. Grey level corresponds to the expected composition. The regions at the hexagon vertices correspond to the expected volume fraction of Laves and MX phases, and their averaged compositions.
Solidification structure as calculated using the Scheil model with a hexagonal columnar grid. (a) Fraction of solid map (b) Interpolated weight fraction distribution for Ni, Cr, Nb and Mo on the solidified structure. The circles at the hexagon vertices have a size equivalent to the volume fraction of as-solidified second phases. The grey level indicates the averaged composition of these phases.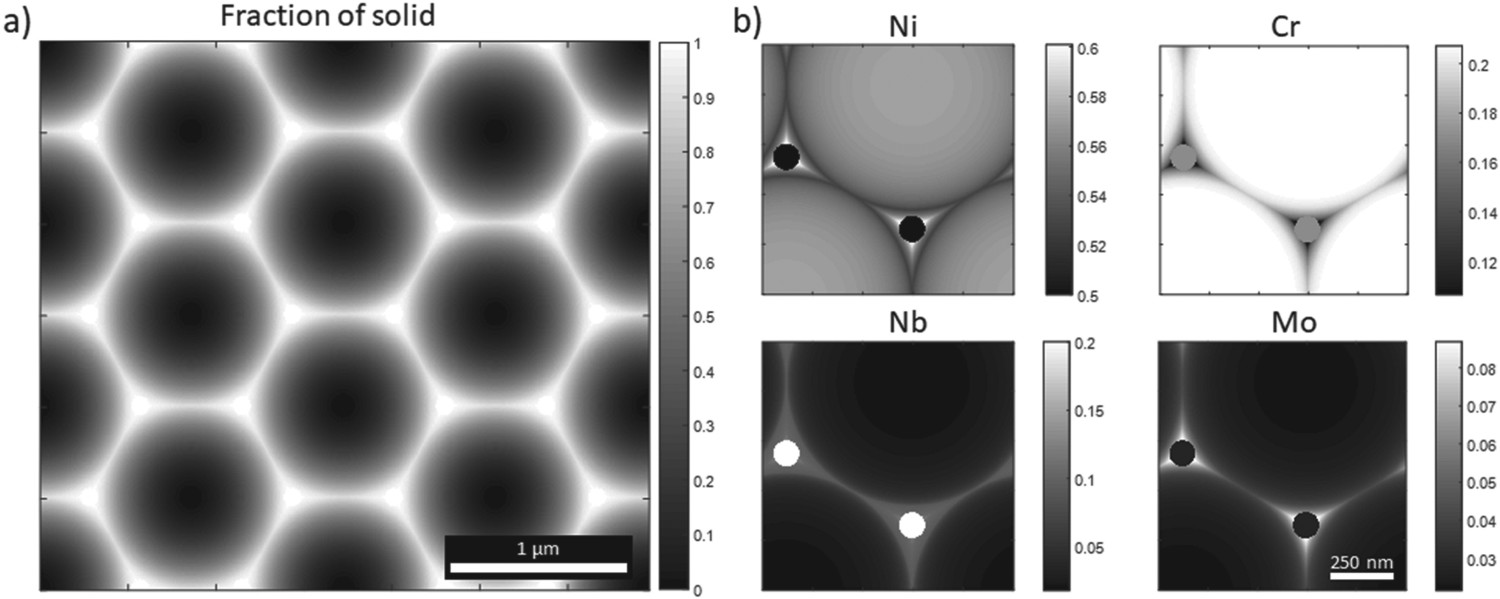
Figure 6 shows the as-solidified alloy 718 AM microstructure imaged using backscattered electrons on the SEM. The orientation of the large grain at the center of Figure 6(a) was determined through EBSD. The coloured cube inset represents the orientation of the austenitic matrix unit cell. The cellular growth direction was at a 45° angle out of the surface. Owing to the imaging condition (backscattered electrons), contrast in these microstructure images is proportional to electron density across the surface, i.e. regions richer in atoms with high atomic number will appear brighter.
As-solidified additively manufactured Alloy 718 (a) Backscattered electron image. The cube shows the crystal orientation regarding the sample surface. Cell growth direction is 45° out of plane in the [100] direction. The rectangle shows the region shown in b. (c) Three-dimensional representation of cellular structure with 45° cross section, equivalent to plane on (a). (d) Nb weight fraction distribution for cross section shown in (c).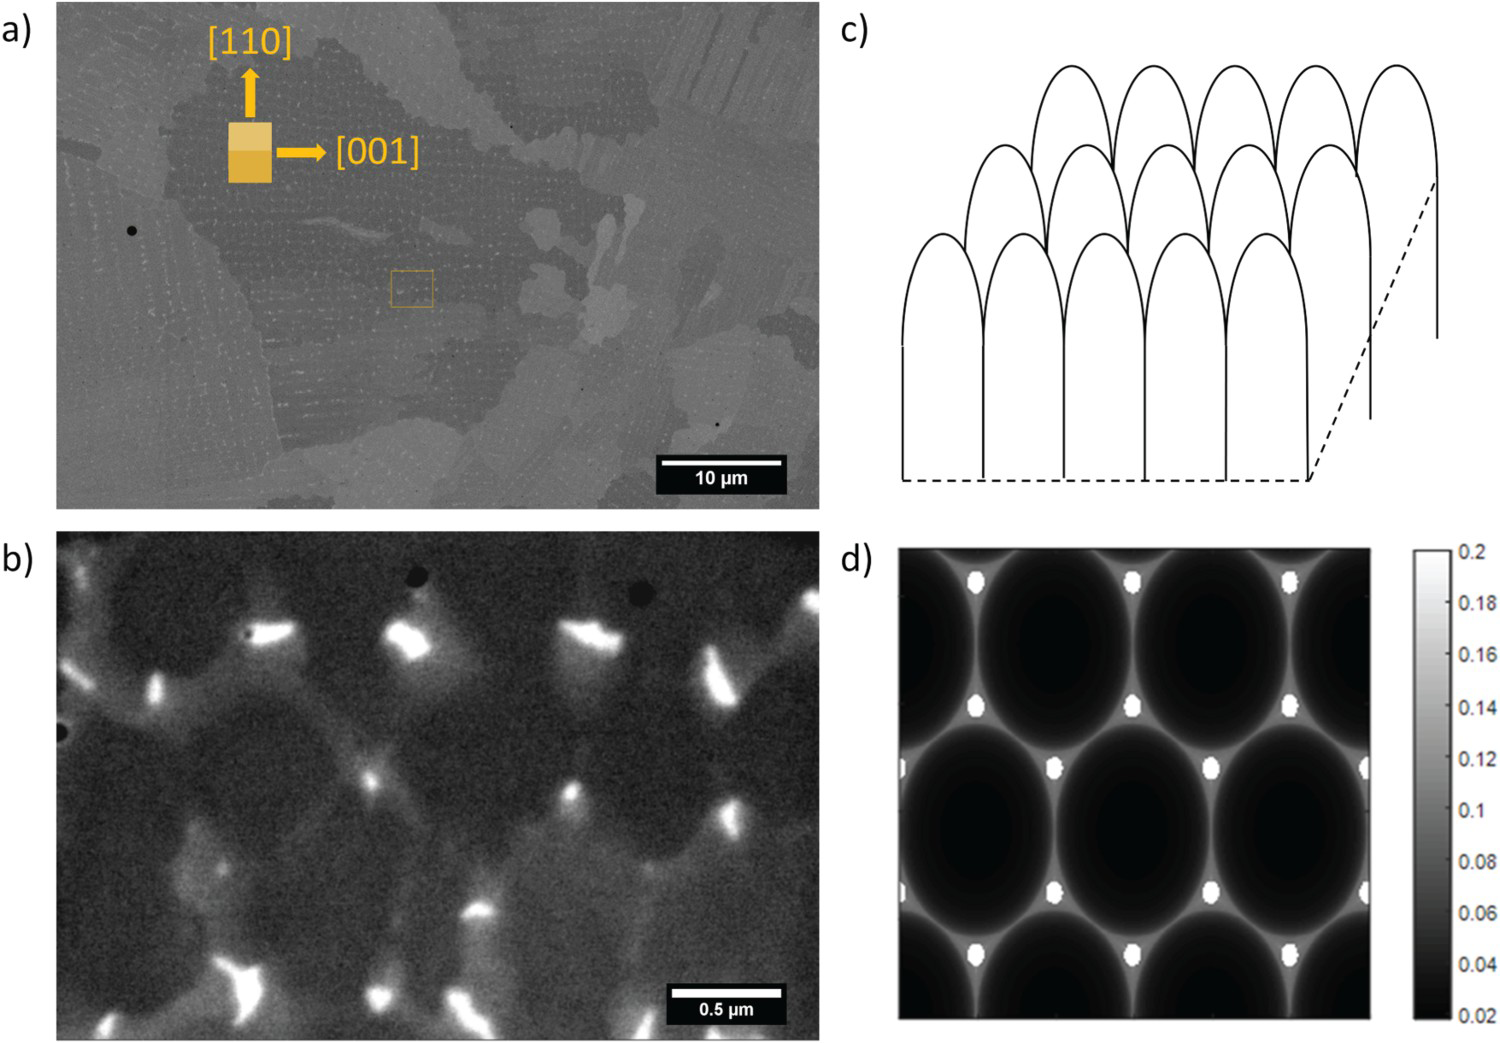
These figures show that the cellular structure does not follow a perfect hexagonal lattice, with each cell having in average five neighbours. Nonetheless, the bright spots, which correspond to Nb-rich regions, follow the expected distribution, being present at the triple boundaries between cells. Additionally, the intercellular regions are rich in high atomic number elements, such as Nb and Mo, as was predicted by the model.
Figure 7(a) shows a TEM image of the foil removed from the built sample. The cellular structure can be seen, with the cell axes parallel to the foil. Cell axes are shown as well as the PDAS. The rectangle region in (a) is further magnified in Figure 7(b). Under the used STEM HAADF imaging condition, the brighter regions in this image are richer in high atomic number elements. A magnified view of the rectangle marked in (b) is shown in Figure 7(c). Both images show that cell edges can be identified through the increased content of high atomic number elements. The rectangle marked in Figure 7(c) indicates a region where an XEDS map was collected. The diagonal of the map had a length of approximately 1 µm. Figure 7(d) shows maps of the collected X-ray intensity for the Kα edges of some of the elements on the alloy. Image brightness is proportional to the number of counts. This image shows that Ni, Cr and Fe are partitioning towards the solid, while Nb, Mo and Ti are partitioning towards the liquid. The intercellular regions are enriched in Ti and Nb. No agglomeration of Ti, Nb, or other measured elements is seen outside of the intercellular region, evidence that no second phases are present at the dendrite core. The larger agglomerates observed at the intercellular region have Nb composition close to that expected for Laves phase. The smaller Ti-rich agglomerates are likely Ti and N rich MX phase. All regions with high Nb and Ti compositions are unlikely to be δ phase, due to the low amount of Ni. Qualitatively, all observations are in accordance with Scheil simulation results.
(a) TEM image of alloy 718 as-built sample foil. Cell growth direction is parallel to foil. Rectangle shows region in b. (b) HAADF STEM image of cellular structure. Rectangle shows region in c. (c) Higher magnification image of the foil. Rectangle shows region for XEDS map. Line shows Figure 9 line scan position. (d) X-ray counts for different elements.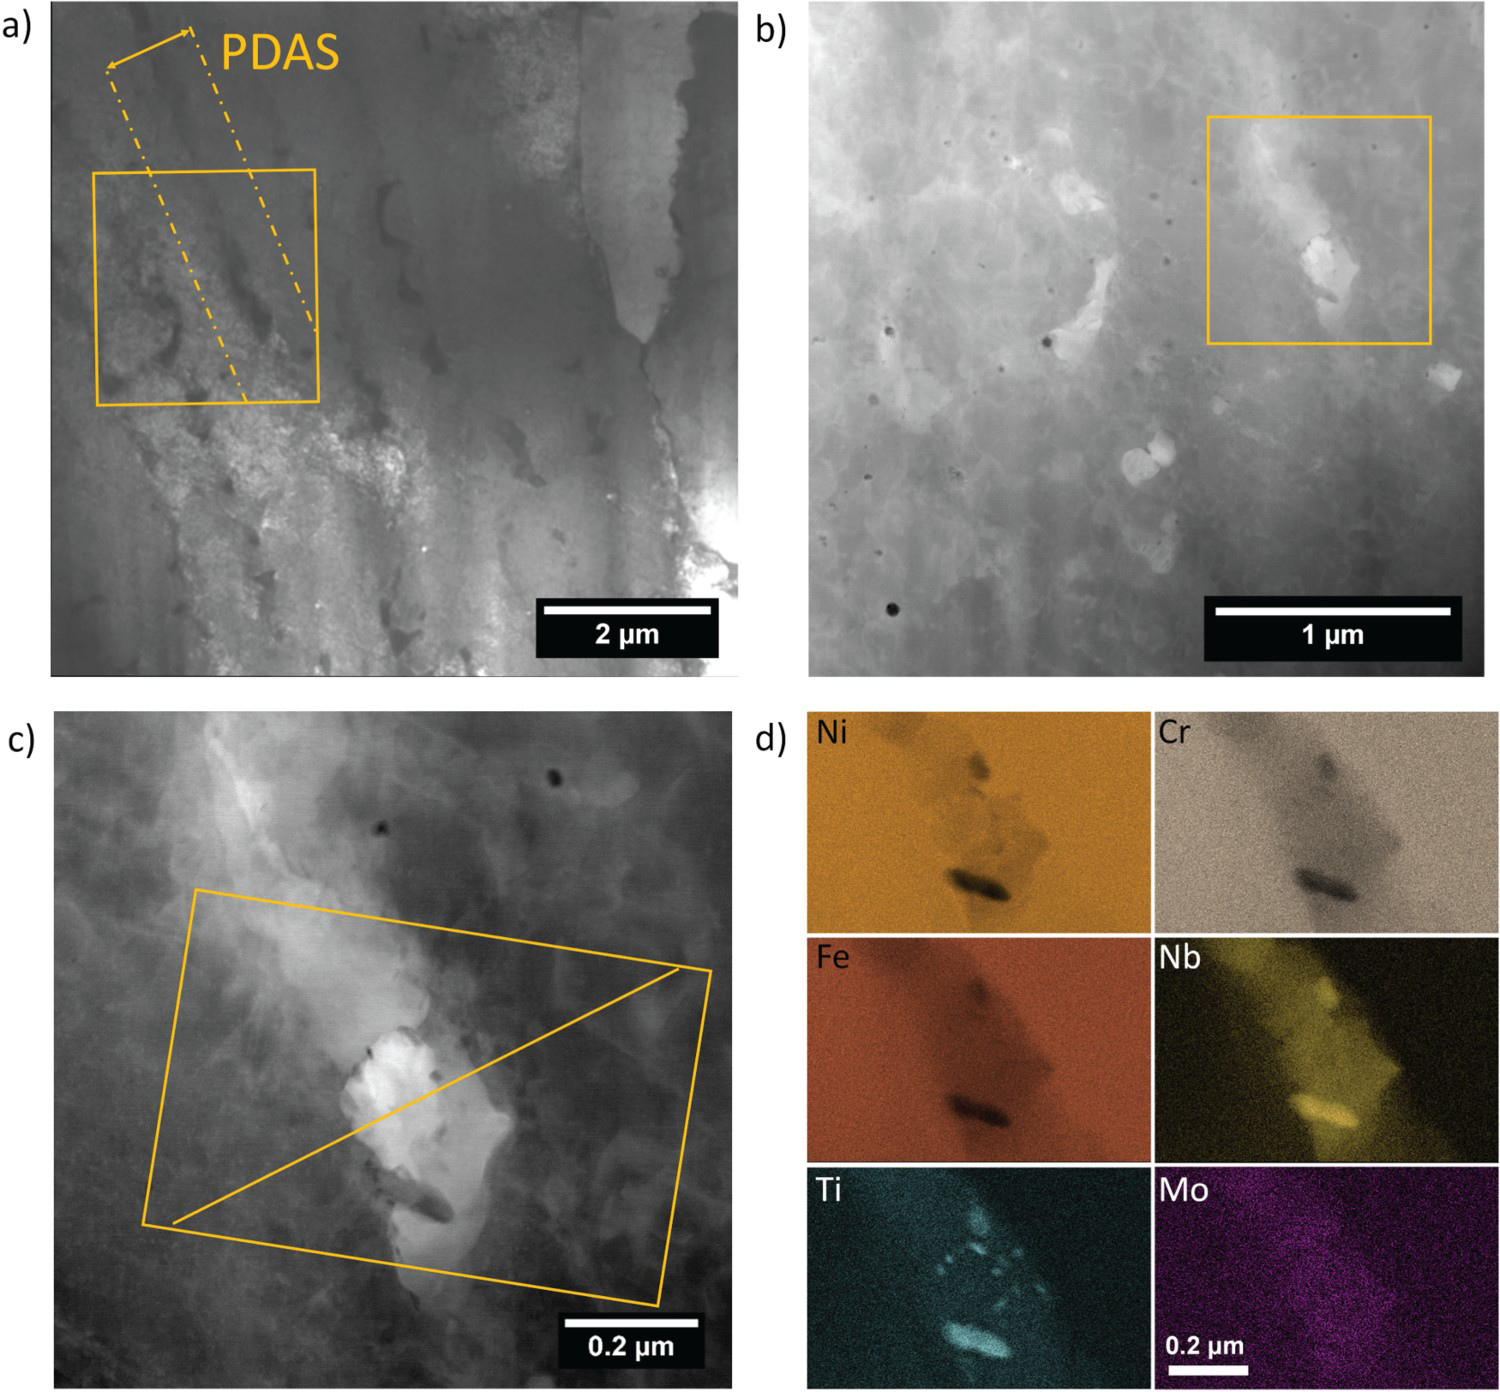
Figure 8 shows a comparison between the modelled compositional profile and the measured compositional map, specifically for Nb. The dimensions and grey level in both images are at the same scale. The Nb mass fraction is shown for some specific points in both maps. The Nb amount at the core and edges of the cells matches. The mass fraction at the larger particle, however, does not. The foil thickness is estimated to be around 100 nm, and given the dimensions at the particle, it is likely that the measured Nb fraction at that region refers to a combination between the matrix and particle.
(a) Nb mass fraction from TEM XEDS map. (b) Modelled Nb mass fraction map. Both maps are on the same spatial and compositional scales. (c) Cross section planes for model and measurement. Markers on the bottom of figures b and lines on Figure c show the integration bands from which curves in Figure 9 were obtained.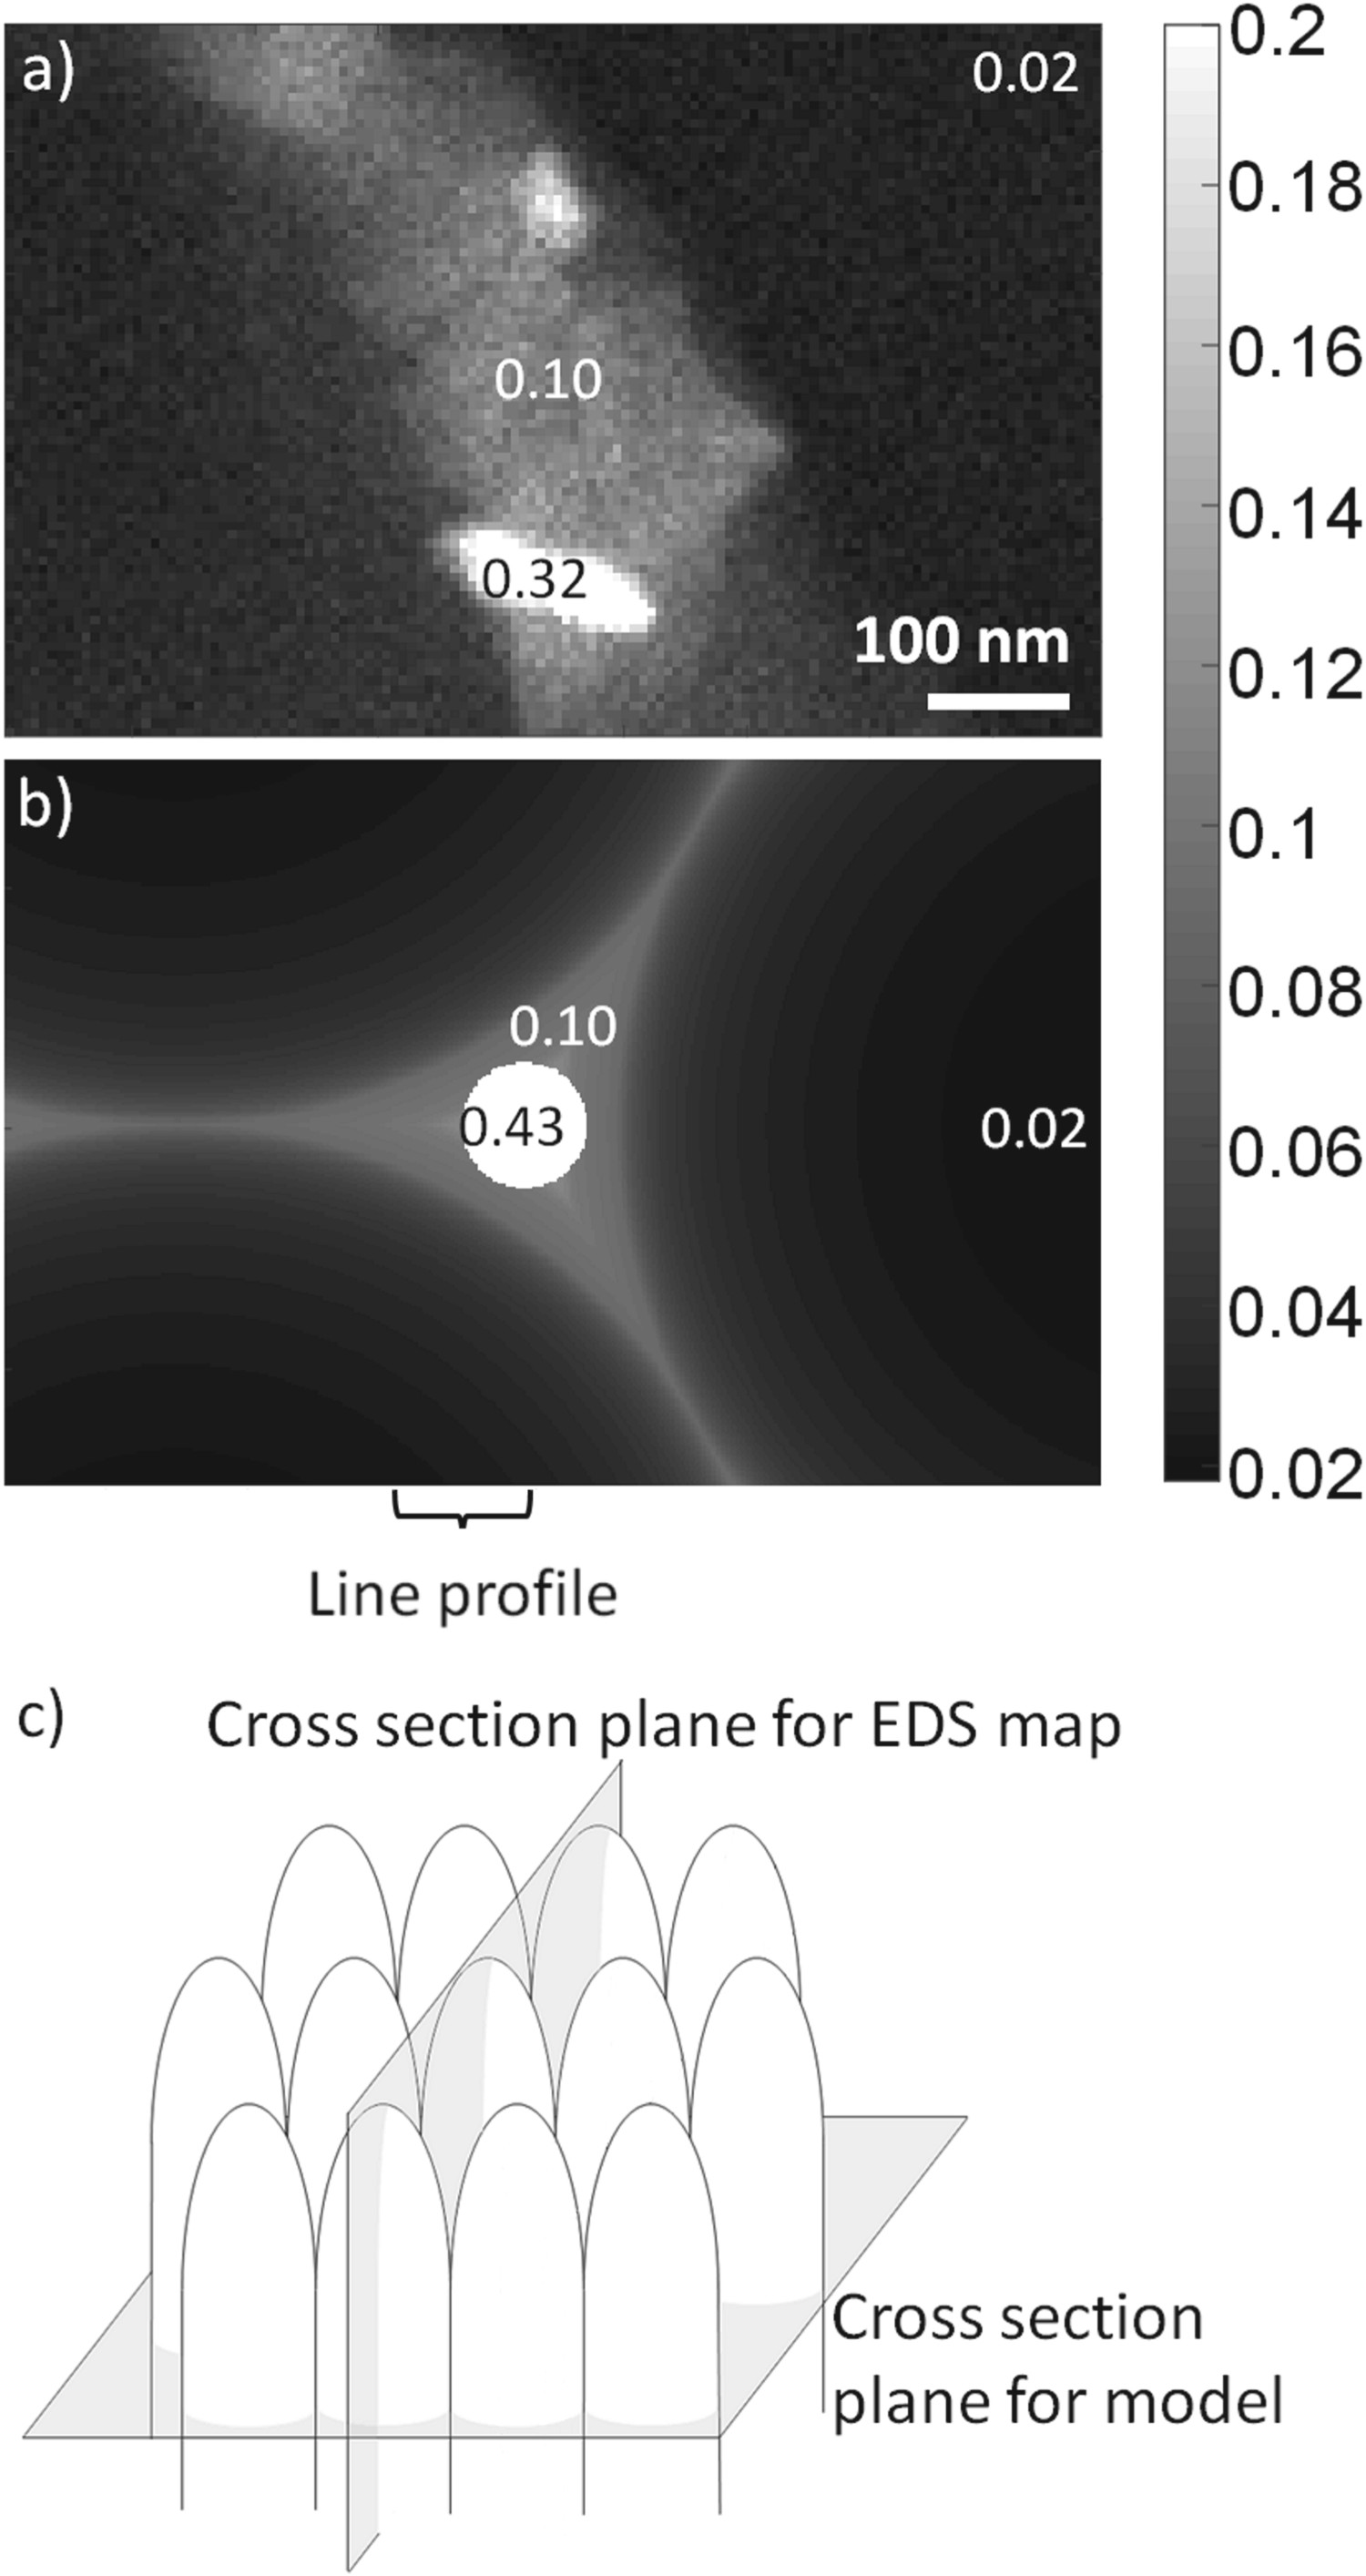
The two cross sections represented in Figure 8(a,b) are perpendicular to each other. To further compare the measured segregation with the model, the composition profile distribution perpendicular to the cell growth direction was retrieved by a line integration of the compositional maps taken across the line shown in Figure 7(c). In order to compare this profile to model results, the plane at which the cellular structure was sectioned must be considered. The foil position was selected so that it would include cell cores and intercellular regions. Given the presence of Nb-depleted cell core regions and Nb-rich intercellular regions with second phases, the foil was determined to be in a plane equivalent to the region marked in Figure 8(b). Considering the foil thickness, the model compositional profile was obtained by averaging the map compositions in a 100 nm band in the horizontal direction as represented in Figure 8(b), as the counts obtained in each pixel of the measured compositional map is an average of the composition across the thickness of the foil. The Nb content at the center of the line profile refers primarily to the composition of Laves phase. It was excluded from the integration since the foil does not show Laves particles along the line profile.
The curves in Figure 9 show that model predictions match observations very closely. Additionally, predictions for the composition of cell core and steepness of the segregation profile are in accordance with measurements. In summary, the Scheil model-based compositional mapping can identify the approximate composition at the cell core, cell edges, and an estimation of how the compositional profile is distributed along the cell radial direction.
Measured and modelled Nb weight fraction profiles across intercellular region.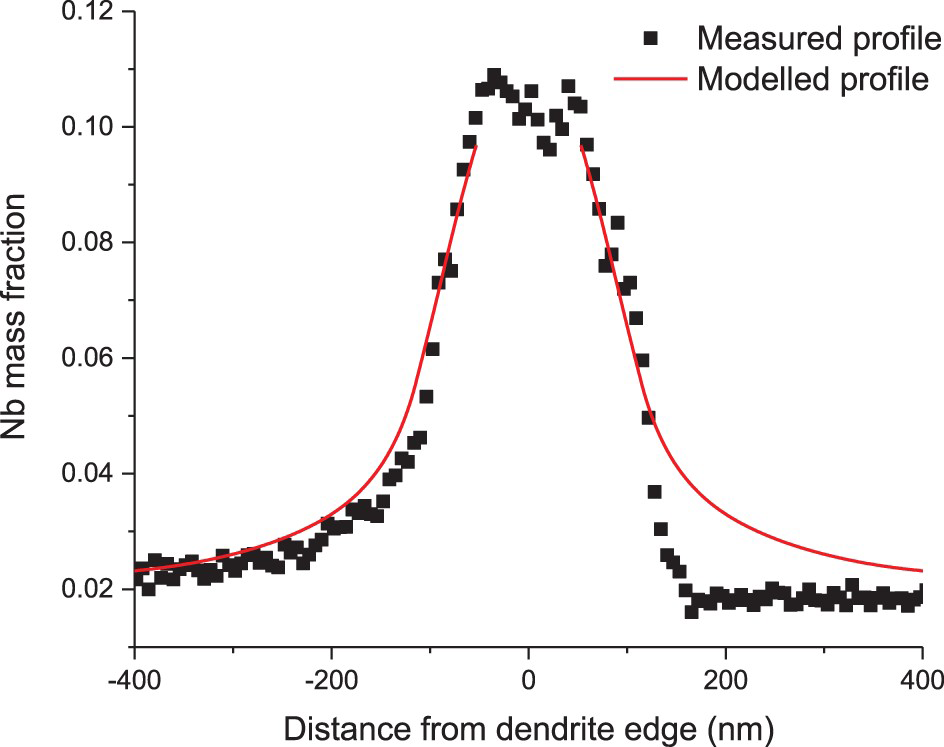
Discussion
Overall, the comparison between the observed micro-segregation profiles and model predictions shows promising results regarding the use of IME methods, and particularly, of the Scheil model, in representing the as solidified microstructure on L-PBF. Qualitatively, the match between measured and predicted second phases shows that the model is capturing the transformation pathways, and SEM analyses show that the morphological distribution of solute atoms is close to the model representation. Quantitatively, the chemical distribution measurements by TEM demonstrate that the predicted segregation profile matches the compositional profile across a cell.
Although the performed measurements support the utilization of the Scheil model, it is still a simplistic implementation of the IME hypothesis, and some discussion is warranted regarding the assumptions it carries. The Scheil model has two main assumptions [33]. The first assumption is that there is no solute redistribution in the solid (other than so-called fast diffusers such as carbon). If there is redistribution, there is a change on the solid interface composition, which changes the chemical potential across both phases, and therefore changes the composition of the newly formed solid layer. The second assumption is that there is complete mixing on the liquid. Similarly, incomplete mixing on the liquid incurs that solute on the liquid close to the interface will either concentrate or dilute compared to the rest of the liquid phase, depending on the partition coefficient. Once again, this would change the conditions for equal chemical potential and the composition of the solid would be changed.
Diffusion in solid and liquid
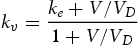
The Scheil hypotheses with regard to diffusion in solid and liquid were investigated through diffusion kinetics simulations using the diffusion module in Thermo-Calc®. The diffusion module also assumes that the solid-liquid interface is at local metastable equilibrium [25]. Nonetheless, it will calculate driving forces across the solid matrix and solve the diffusion equation during solidification. This modelling strategy has been implemented to calculate segregation in L-PBF alloy 625 AM builds [14]. Owing to numerical issues, the diffusion module calculations were limited to a simplified system. Correspondingly, a Scheil simulation with the same characteristics was performed, namely, the same composition was used, and only γ and liquid phases were allowed to form. Figure 10 shows a comparison between the predictions from Scheil and the diffusion module. When compared to the diffusion module results, Scheil predicts a longer solidification temperature range. At the core of the cell, the Scheil model predicts a higher composition of solute with partition coefficient (ke) higher than one, and lower at the cell edge. The opposite happens when ke < 1.
(a) Mole fraction of solid as a function of temperature from Scheil and diffusion model. (b) Cr and Nb mass fraction compositions at the solid side of the interface according to Scheil and the diffusion model.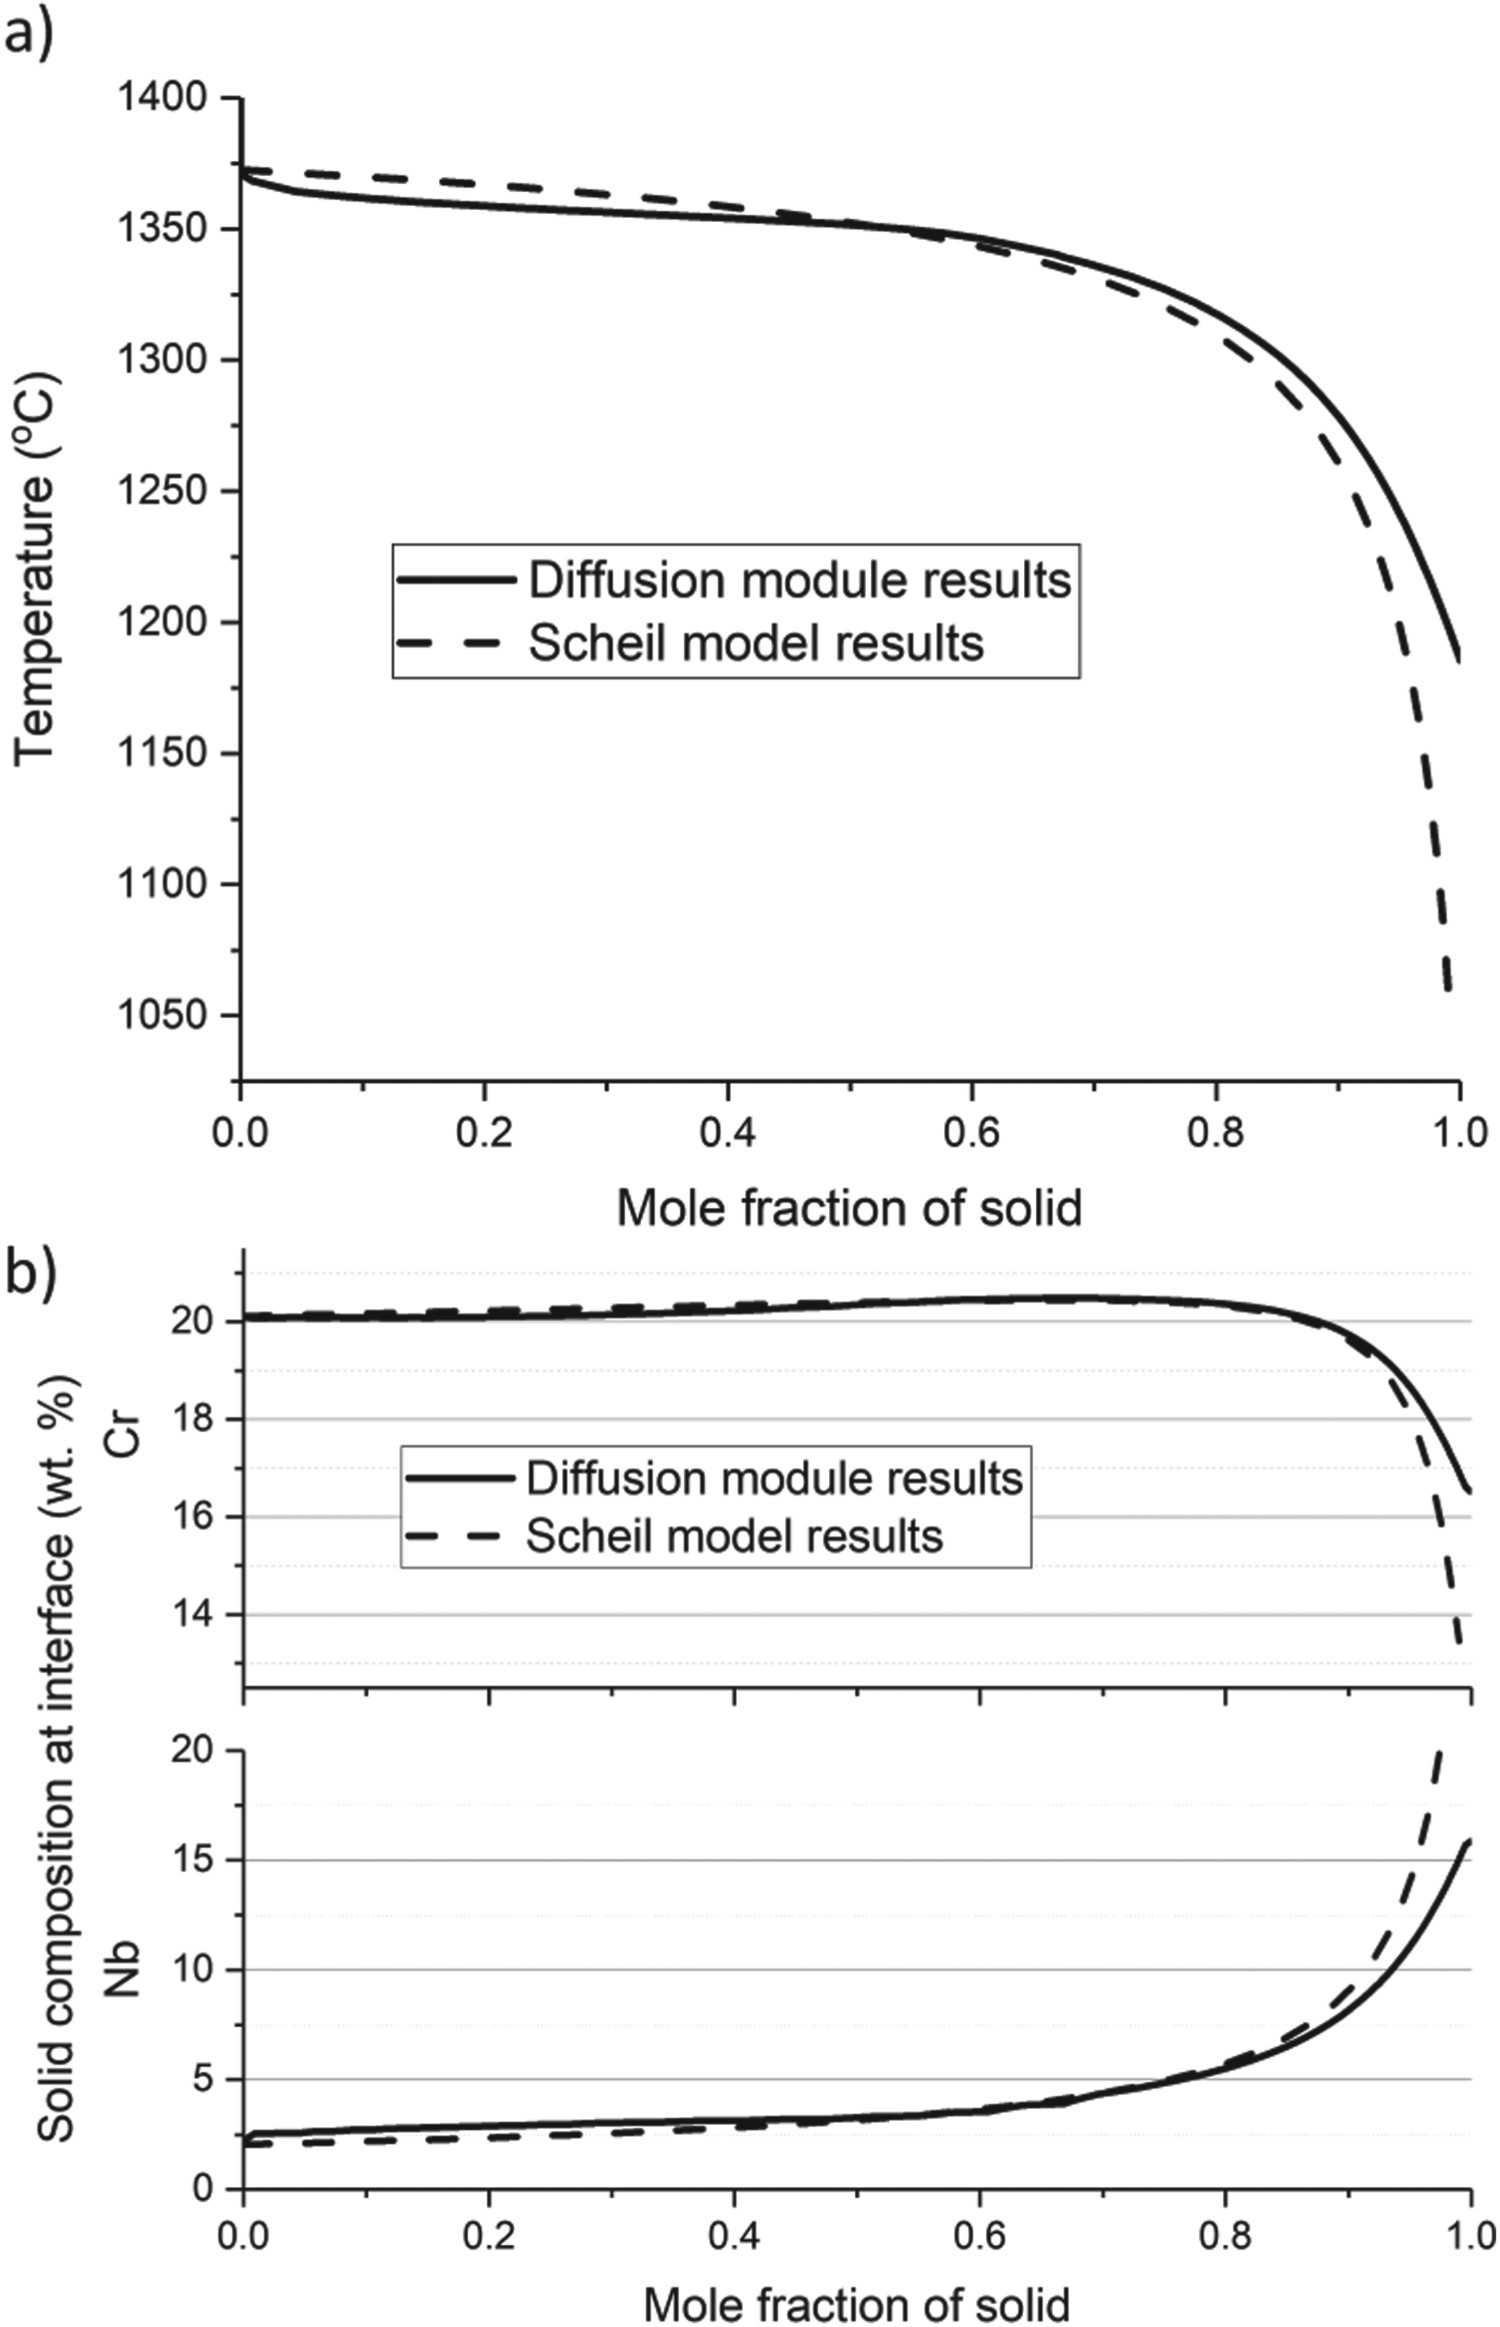
Figure 11 shows the Nb profile at different fractions of solid predicted by both methods. At the beginning of solidification, Nb concentrates at the interface, changing the composition of the forming solid. As solid grows, there is no variation of the composition of the solid phase. These results show that at the core of the cell, the assumption of no diffusion in solid is accurate, while the assumption of complete mixing in the liquid is not. As the fraction of solid grows, the liquid presents complete mixing, but due to the changes in solid solute content at the beginning of solidification, the liquid at the end of solidification has less solute with ke < 1 and more solute with ke > 1.
Compositional distribution of Nb across the solidification model. Data is shown for the diffusion and Scheil models. Curves were collected when solid fraction was 0.25, 0.5, 0.75 and 1.00.
The effect of incomplete mixing on the liquid is not negligible, but still causes minimal changes to the final compositional profile. At the cell core, the diffusion model predicts an Nb composition of 2.54 weight per cent, while the Scheil model predicts 2.11 wt-%. This difference ceases to exist when solid fraction reaches around 0.5. From Figure 2, the Nb composition scatter at the cell core can be used to estimate the variance in the TEM XEDS Nb measurements as ± 0.25%. These models do not fully represent the alloy, as they have a limited composition, but if a similar difference was observed for the complete alloy 718 composition, it would be within the resolution of composition measurements.
Overall, the difference in solute distribution due to incomplete liquid mixing is small. However, this may not be the case for other alloy systems or different process parameters. As the scan speed increases, or when alloy systems in which solute atoms have lower diffusivity on the liquid are considered, this effect will be stronger and may result in different solute distributions. Nevertheless, the effect of solute gradients in the liquid close to the solid–liquid interface can still be taken into account on a Scheil-like model through the method developed by Giovanola and Kurz [34].
Solute trapping
Another implicit assumption on the Scheil model is the IME itself. This condition in the interface may become invalid if the interface solidification speed is fast enough. If the interface moves sufficiently fast, solute atoms cannot partition on the liquid fast enough, and the advancing solid layer becomes supersaturated, a phenomenon known as solute trapping [35].
Solute trapping will be more prominent at the cell tip, where interface speed is faster. If considerable solute trapping takes place, the Nb composition at the cell core would be higher than what is predicted by the Scheil model.
Even so, solute-trapping effects can also be taken into account in a Scheil-like model. The equilibrium partition coefficient (ke) can be changed into kinetic partition coefficient (kv) to account for high-interface velocities. A simple form of kv is the Aziz-trapping function [36]
 is the interface velocity,
 =
=
 /
/
 is the interface diffusion speed,
 is the diffusivity of liquid at the interface and
 is the interatomic spacing in the liquid.
Ghosh [20] has performed phase field simulations to quantify this effect and
 for Nb was calculated to be 0.31 m s−1 in the Ni–Nb system. The scan speed on the part analysed is 0.96 m s−1. The interface speed will depend on the alignment between the cell growth direction and the scan speed. Additionally, it will vary as the cell grows, being the highest possible at the cell tip. If the interface is aligned with the scan direction,
 . For a binary Ni-Nb system with 5 wt-% Nb, the composition of solid according to the Scheil equation would be 3.3 wt-% at a 0.01 solid molar fraction. Considering the Aziz trapping function this would be 4.6 wt-%. However, this value drops quickly if the cells are not aligned with the scan direction or as the cell grows and the angle between the interface and the cell axis drops. The solute content at the intercellular region would still be changed given the difference in solute content at the cell core.
As evidenced by the very good agreement between the quantitative chemical distribution data collected in this work and the Scheil calculations, solute trapping is not likely playing a marked role for the used set of process parameters and studied alloy.
Implementation of IME based methods for L-PBF
Continued and successful implementation of L-PBF AM requires developments in several fields, from streamlined production strategies to tools that allow the optimization of such strategies. Some of the most important tools in this endeavour are models which allow digital prototyping of parts. Successful builds require not only the control of distortions and residual stresses but also control on microstructure. Obtaining an optimized microstructure requires understanding the microstructural history during the process, and also how it can be modified through post-build processing.
As such, a successful build is dependent on the careful selection of all process variables. Many efforts have been directed at the construction of integrated computational materials engineering (ICME) approaches, which would allow the rapid digital prototyping of new parts, and the following design of post-processing schedule. The implementation of IME methods is computationally cheap, and when combined with fast-acting heat transfer models, may yield a versatile tool for solidification microstructural predictions and as input on how to modify and optimize this microstructure after builds. In this sense, IME based methods are a good candidate for integration in ICME approaches. These methods can consider incomplete liquid mixing and solute trapping, without considerable loss of computational efficiency. For the specific material and process parameters used in this work, the Scheil model was shown to be satisfactory for representing the solidification.
Conclusions
The conclusions of this work can be summarized as follows:
Characterization results show that the alloy 718 AM microstructure consisted of refined cellular and cellular dendritic structure with an approximately 1 µm PDAS. The observed spacing matched predictions from Kurz-Fisher model. When combined with the predicted PDAS, the Scheil implementation of the IME condition successfully represented the compositions at the cell core and edge, and especially the micro-segregation profiles along the dendrite radial direction. The Scheil model implies some assumptions on the physics of the solidification process. Specifically, it disregards the solute profile on the liquid or the possibility of solute trapping. If these conditions are considered, modelling indicates that for the analysed material and process parameters, the changes in compositional profile would be still smaller than the scatter observed in the measured composition. Hence, the Scheil based models are effective to predict the micro-segregation profiles capable of considering a large number of alloying elements at low computational cost.
Overall, the methodology established to obtain the solidification micro-segregation chemical distribution has yielded results which adequately describe the L-PBF AM microstructure. In high throughput applications, this methodology can be combined with IME methods to predict chemical distribution on the as-solidified microstructure under varying conditions, enabling alloy design for AM, or microstructure/performance driven printing and post-processing parameter optimization.
Footnotes
Acknowledgements
The authors are grateful to Drs Kevin Wheeler, and Dogan Timucin of NASA's Ames Research Center for valuable discussion. All microscopy data was collected at the Center for Electron Microscopy and Analysis at the Ohio State University. The authors would like to thank Dr Adam Hope from Thermo-Calc® for his support. A.J. Ramirez would like to thank The American Welding Society Foundation for the graduate research fellowship for G. Abreu Faria. Finally, the authors are grateful to GE Additive Education Program for the donation of the Mlab Cusing system where all AM experiments were performed.
Disclosure statement
No potential conflict of interest was reported by the authors.