
Abstract
The distribution of residual stresses (RS) in repairs generated by Friction Hydro-Pillar Processing (FHPP) in AISI H13 was investigated. Three axial force levels, with consequent different deposition rates, were applied to replicate possible repaired conditions. The contour (CM) and X-ray diffraction (XRD) methods were employed for RS analysis in samples that were also evaluated through metallography, microhardness analysis, micro-tensile and Charpy testing. CM produced 2D maps of the RS in the joints, showing symmetrical distributions around the welded rod for all welded conditions. Other common features for all conditions were the maximum level of compressive RS, which was found in the TMAZ of the rod, and the maximum tensile residual stress, which was found near the HAZ of the base block. There was good agreement between the RS measurement techniques. Mechanical tests show similar tensile resistance for all conditions and an apparent increase in toughness at higher force levels.
Keywords
Introduction
AISI H13 steels are one of the most common materials for hot work tools [1-3]. Due to the high costs involved in manufacturing such tools, any repairing technology which can extend their service lifetime is of interest [3, 4]. Welding processes involving fusion are widely employed to repair damaged dies. However, fusion and solidification can result in weld cracks, segregation, porosity, hydrogen absorption, deleterious phases and high tensile residual stress [5, 6]. In this context, Friction Hydro-Pillar Processing (FHPP) is presented as a new possibility of repairing technique, which could potentially be applied to AISI H13 steel dies. An illustration of the process is presented in Figure 1. The FHPP technique consists of filling a hole, which is previously machined in order to remove the damaged region, with the material of a consumable rod. This is done through the rotation of the rod when in contact with the bottom of the hole, and application of an axial force; this generates friction and enough heat to plasticise the rod material, which is then deposited continuously into the hole [6]. At the end of the process, the excess material can be machined off to recreate the surface of the die.
Sequence of events during the FHPP process.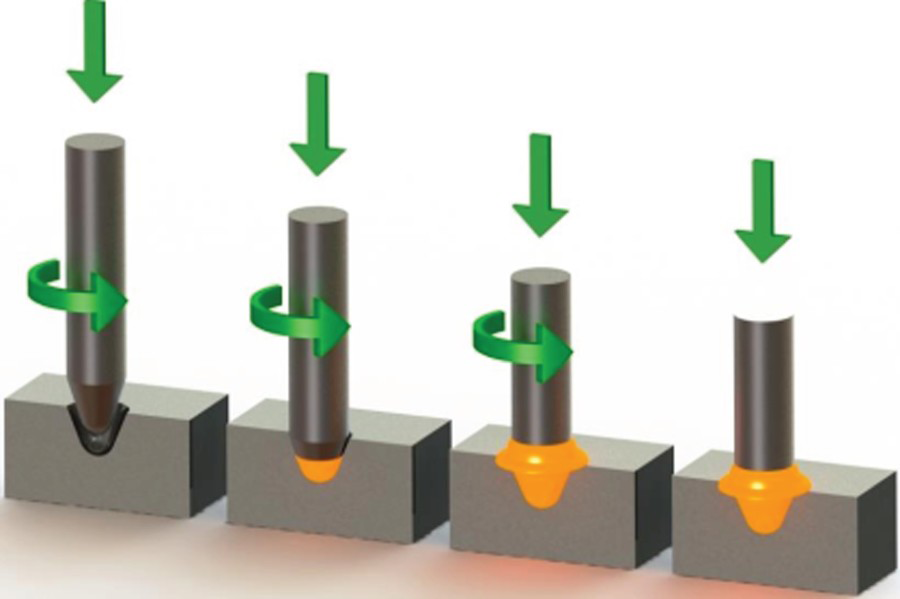
Since no fusion is involved in the process, typical solidification-related problems are avoided, thus offering a convenient and economical way of repairing damaged components. Furthermore, the process is fast and can be completely automated [7-16].
Welding processes are usually associated with high levels of residual stresses (RS) which are caused by thermal gradients and phase transformations. This is a problem because they can combine with the applied loads and cause premature failure [17, 18]. Process parameter optimisation and post-weld heat treatment (PWHT) are usually important in order to ensure lower RS and an adequate microstructure [19]. However, there are only limited studies on the generation of RS in FHPP welds [8, 20], especially in H13 steels.
The contour method (CM) proposed by Prime et al. [23] creates two-dimensional residual stress maps and offers advantages compared to other techniques, especially due to the fact that the entire thickness of the component is analysed [21-24]. The CM has been studied by many authors and their results have been compared with a wide range of residual stress analysis methods in different kinds of weld joints [21, 25-32]. The CM has been successfully applied to measure and map residual stress also in friction stir welds [33-35].
This work involves an investigation into the microstructure and RS generated by the FHPP process in AISI H13 steel. RS were evaluated by CM and validated at surface points by X-ray diffraction (XRD). Mechanical properties were evaluated through micro-tensile testing and Charpy impact testing. The results showed that welds produced with different axial force parameters, and consequently different thermal inputs, led to different microstructural, microhardness and residual stress distributions.
Experimental procedure
Sample preparation
Base blocks were obtained from rectangular AISI H13 forged bars with the following chemical composition: Fe–0.449C–0.857Si–0.269Mn–0.005P–0.001S–5.21Cr–1.25Mo–0.929 V, whereas the rods were obtained from rounded rolled bars with the following chemical composition: Fe–0.393C–0.989Si–0.346Mn–0.014P–0.008S–5.11Cr–1.28Mo–0.755 V. The blocks were machined with dimensions of 100 × 50 × 40 mm and the rods were turned in 28.6 mm diameter. After machining, the rods and base blocks were quenched (austenitising at 1030°C) and double tempered at 610°C for 2 h. A schematic with dimensions of the machined block and rod is presented in Figure 2(a); the surface hardness was 40 and 55 HRC, respectively, a difference with is attributed to their different fabrication processes.
(a) Schematic showing the block and rod dimensions.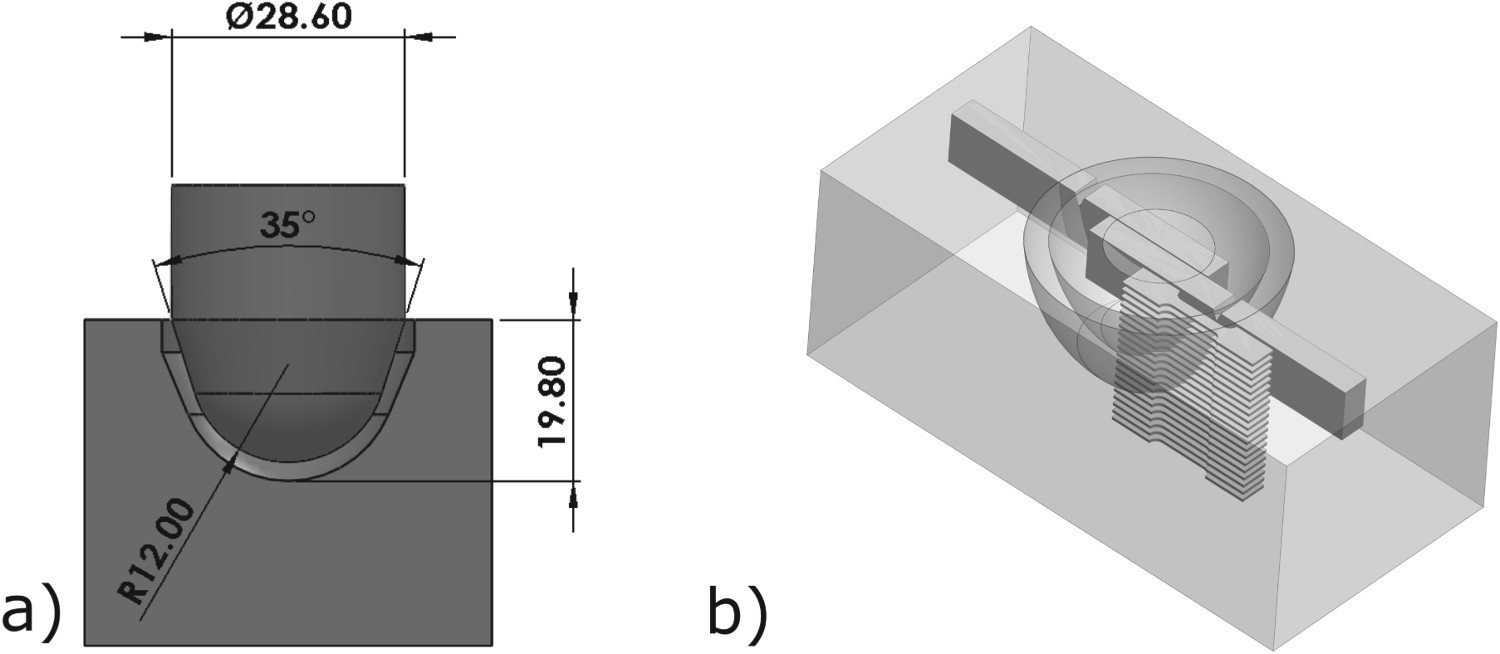
Welding process
Data for the main parameters are acquired during the welding process for control. An example can be seen in Figure 3, where in stage 1 the rotational speed rapidly increases to a pre-set value. In stage 2, the rod is moved toward the base block making contact with the bottom of the hole and an axial force is applied. From this point, the axial downward movement is measured as burn-off. In stage 3, when the predetermined burn-off is reached, the rotational speed is interrupted and is stage 4 the forging force is kept constant to consolidate the joint.
Schematic showing the typical behavior of the main parameters of the FHPP process during a welding cycle.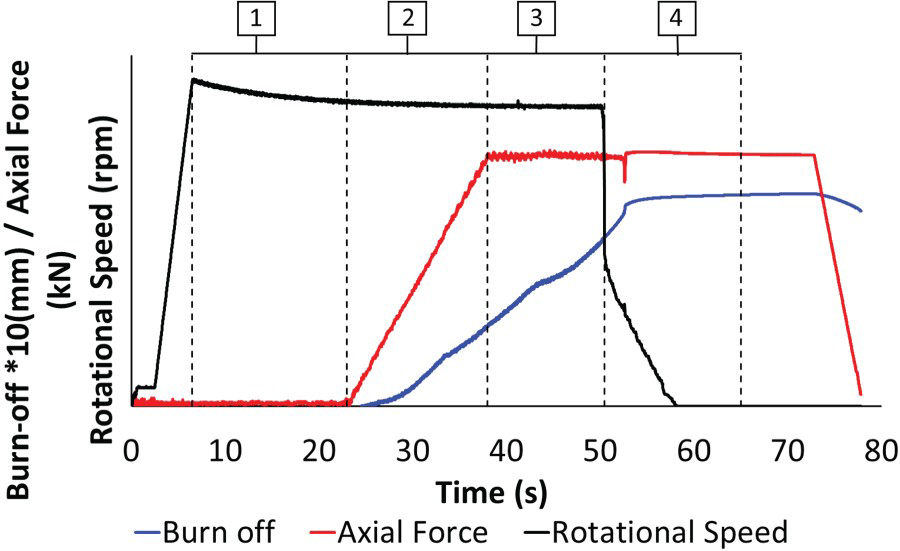
Samples were produced with three different axial forces, 100, 150 and 200 kN (S100, S150 and S200, respectively), whereas the axial force rate was 10 kN s−1, rotational speed was 1450 rev min−1 and burn-off was 10 mm for all samples. Samples were then air cooled to 90°C and subsequently subjected to a PWHT which is commonly used for H13 steels: double tempering at 580°C for 2 h followed by air cooling.
Microstructural and mechanical properties
Conventional metallography was performed in the entire section of the welds in order to observe the base material region (BM), heat affected zone (HAZ), thermomechanically affected zone (TMAZ), and also the interfaces between the hole and the rod. Vickers microhardness was mapped with 500g load in the entire section with a spacing of 0.2 mm horizontally and 2 mm vertically. The mechanical properties were measured by micro-tensile testing of flat samples, and toughness was measured through Charpy impact testing according to the ASTM E 27 Standard, at room temperature, with the notch of the specimens located at the interface between the rod and the base.
Residual stress analysis
Contour method
The procedure developed by Prime [23] was employed for the contour method (CM). Welds were sectioned in half along the surface to be investigated with a wire electrical discharge machining (WEDM) equipment with a 250 µm-diameter brass wire and a cutting speed of 1.5 mm min−1. The samples were firmly clamped to avoid any dislocation during cutting.
After cutting, a 6 mm diameter ruby probe was used to measure displacements on both surfaces using a 3D coordinate measuring machine (CMM). The points were measured on a regular 0.5 mm × 0.5 mm mesh in a temperature-controlled room.
The analysis of the measured data was performed with the aid of a Matlab code which cleaned and filtered the data from noise and subtracted bias components from the dataset.
ABAQUS was employed to perform the 3D finite-element modelling, which handled 210,672 elements of the type C3D8R. The block was modelled with dimensions of 93 mm in length, 30 mm thickness and 25 mm in width (half the width of the original sample) in the undeformed state. The model was considered as a single piece with homogeneous, isotropic and elastic material, with Young's modulus of 210 GPa and Poisson's ratio equal to 0.30. The treated data were applied as a boundary condition on the finite-element nodes of the modelled sectioned surface with the inverse sign. By the principle of superposition, the result obtained is the residual stress normal to the cutting plane.
X-ray diffraction
XRD was employed to measure the residual stress of FHPP welded samples. For this, the protruded rod was removed because the low-depth penetration of X-rays allows only a very superficial analysis and there can be no obstacles to the incident and scattered beams. For this purpose, a WEDM was used to cut a 2 mm-thick surface portion from the top of the block-rod union. As WEDM cut melts the surface, high tensile RS are formed in a thin layer, about 50 µm-deep, which was removed through electropolishing.
Measurements were performed along the sample surface on a 100 mm-long line with 101 equidistant points. A GE Seifert Charon XRD M Research Edition was employed using the sin²ψ method to analyse the α-Fe {2 1 1{ diffraction peaks with a Cr-kα radiation source. The elastic constants were ½ S2 = 5.81 10−6 MPa−1 and −S1 = 1.27 10−6 MPa−1. Each point was scanned with a focus spot of 1 mm in diameter along 13 χ-angles between −60° and +60°.
Results and discussion
Metallurgical and mechanical properties
In terms of the microstructure, the three conditions (S100, S150 and S200) were very similar. Figure 4 shows metallography images for the S100 weld. The microstructural characteristics were divided and defined as: region ‘a’, the base material; region ‘b’, rod HAZ; region ‘c’, transition from rod HAZ to rod TMAZ; regions ‘d’ and ‘e’, rod TMAZ; region ‘f’ hole-rod interface (side); region ‘g’ hole-rod interface (bottom); and region ‘h’, base material HAZ.
Microstructure of selected regions of weld S100. (a) Base material; (b) rod HAZ; (c–e) rod TMAZ; (f) rod-hole side interface; (g) rod-hole inferior interface; (h) base HAZ. 200× magnification.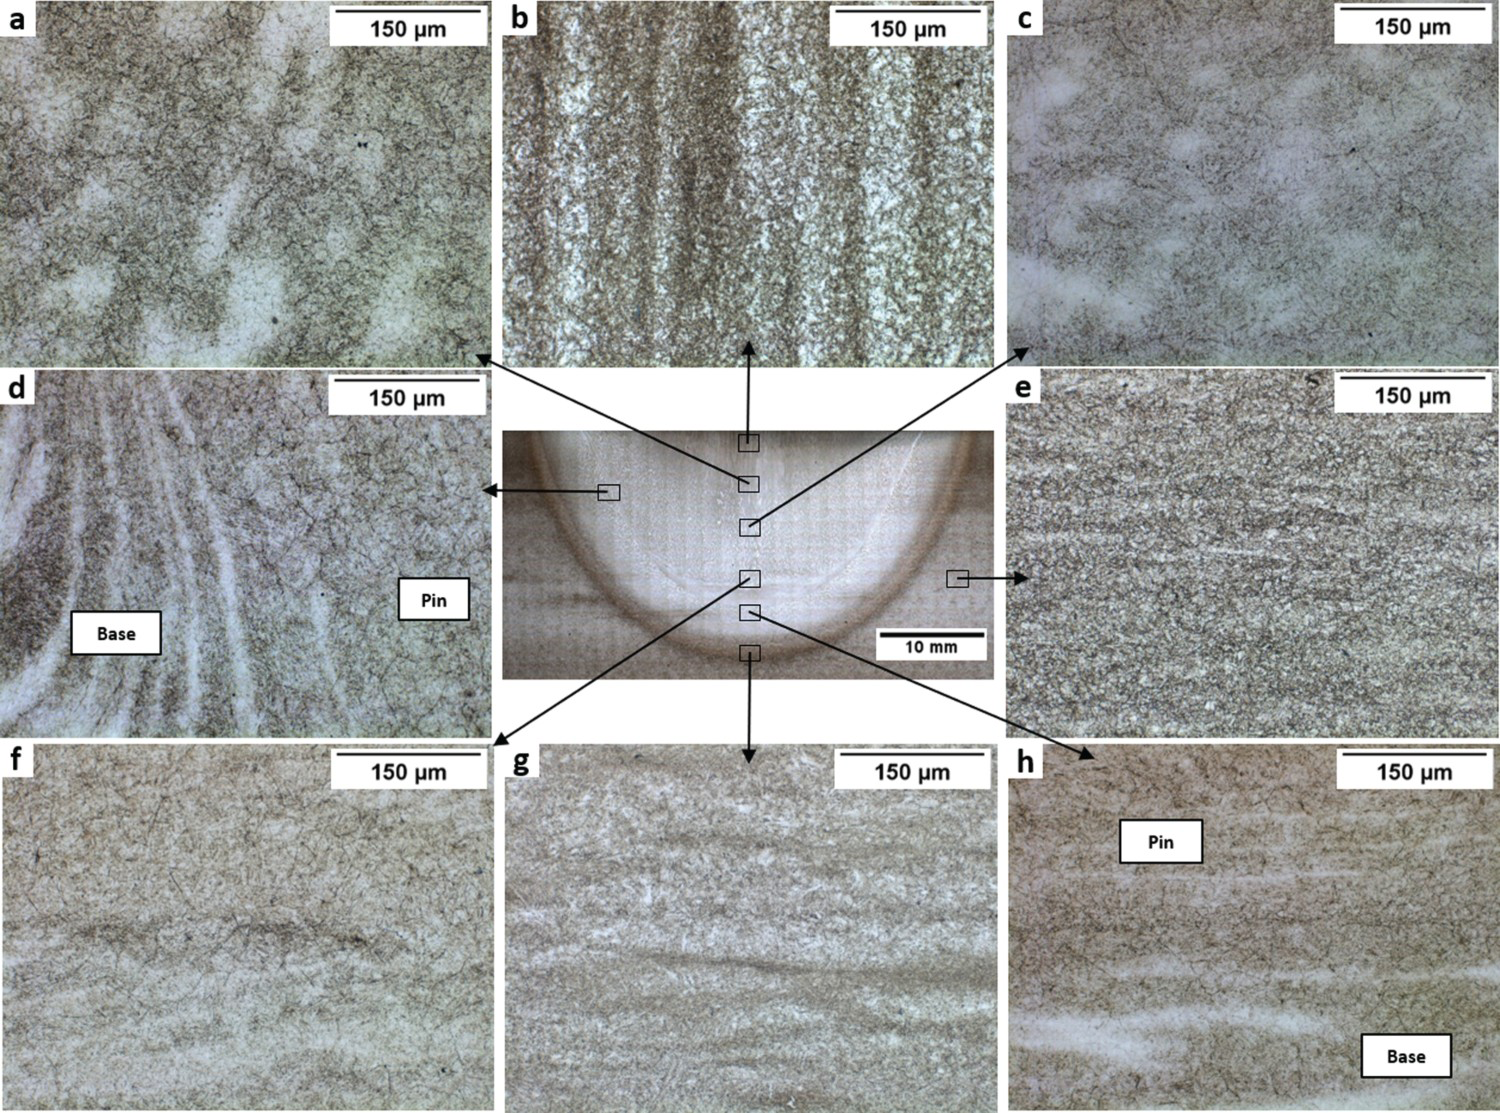
Figure 4(a) shows the microstructure of the unaffected base material consisting mainly of tempered martensite (TM). Figure 4(b) shows the microstructure of the top region of the rod, showing significant banding in the vertical direction, an indication of the intense heat extraction which occurred towards the open end of the rod. Figure 4(c–e) show different areas of the rod TMAZ, where the material has been exposed to high temperatures and plastic deformation. In these regions, the microstructure corresponds to TM and some isolated regions of lower bainite (LB). Figure 4(f,g) correspond to the microstructure of the interface, where the highest levels of plastic deformation and temperature were experienced. These regions showed no defects, characterising a good metallurgical bond between the rod and base material for all welding conditions. Finally, Figure 4(h) shows the base material HAZ, were structural banding in the horizontal position due to heat extraction can be seen. All regions of the welded joints had dispersed carbides in different densities.
Figure 5 presents the microhardness values obtained for each of the welding parameters. As seen in Figure 5(a,b), the rod HAZ hardness values were similar to the base material hardness values for S100 and S150 joints, around 450–550 HV0.5. For sample S200, the values in this region were lower, around 350–500 HV0.5, possibly due to grain growth and/or tensile residual stress. Hardness in the TMAZ regions of all conditions was greater than 550 HV0.5, since the intense plastic deformation and thermal cycle leads to a fine grain microstructure. Hardness values above 650 HV0.5 are observed in some areas of the TMAZ of the rod, especially at the center of the rod near the interface with the block in welds S100 and S200; this could be caused by carbide accumulation in the axis of rotation where rotational velocity is close to zero.
Microhardness map from FHPP for S100, S150 e S200. (Distance between indentation (mm) × Depth (mm) × Microhardness HV0.5).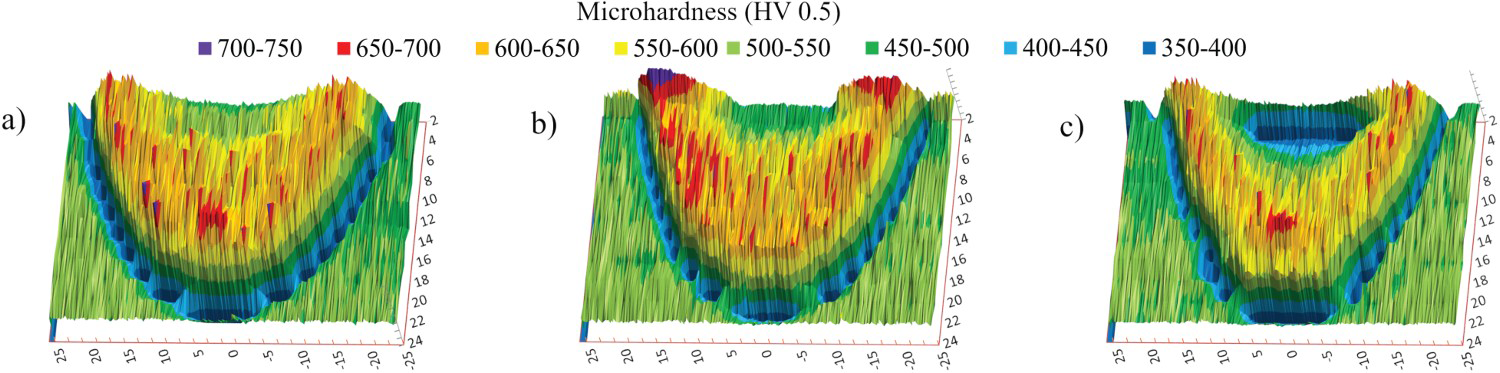
Charpy tests were performed in three samples from each of the three weld conditions as shown in Figure 2(b). The S100 condition samples had a mean of 5.3 J m−2 and standard deviation of 2.31 J m−2, and the S150 condition had a mean of 8.0 J m−2 and a standard deviation of 6.93 J m−2. The S200 condition reached a mean of 11.3 J m−2 and a standard deviation of 5.77 J m−2. For comparison, the guidelines of NADCA#207-2006 specify that Grade A H13 steel should have average impact toughness values between 13.5 and 10 J m−2. Figure 6 shows the results of the micro-tensile tests for samples taken at different depths (as shown in Figure 2(b). All samples which had the pin-block interface within the effective area of the specimen showed lower values compared to those which had mostly block material in the effective area. For samples which had an interface within the effective area, the mean yield strength was found to be 687, 725 and 625 MPa, and standard deviation 30, 56, and 53 MPa, for S100, S150 and S200, respectively. This seems to agree with toughness results which show the higher force condition having a more ductile behaviour than the other conditions. For samples in which the block material was dominant in the effective area of the samples, the mean yield strength was found to be, as expected, very similar: 997, 1037 and 986 MPa, and standard deviation 38, 11, and 30 MPa, for S100, S150 and S200, respectively.
Results of micro-tensile tests for samples extracted at different depths: (a) Ultimate Tensile strength; (b) Yield Strength. The colour scale indicates the regions of the weld which were present in each sample.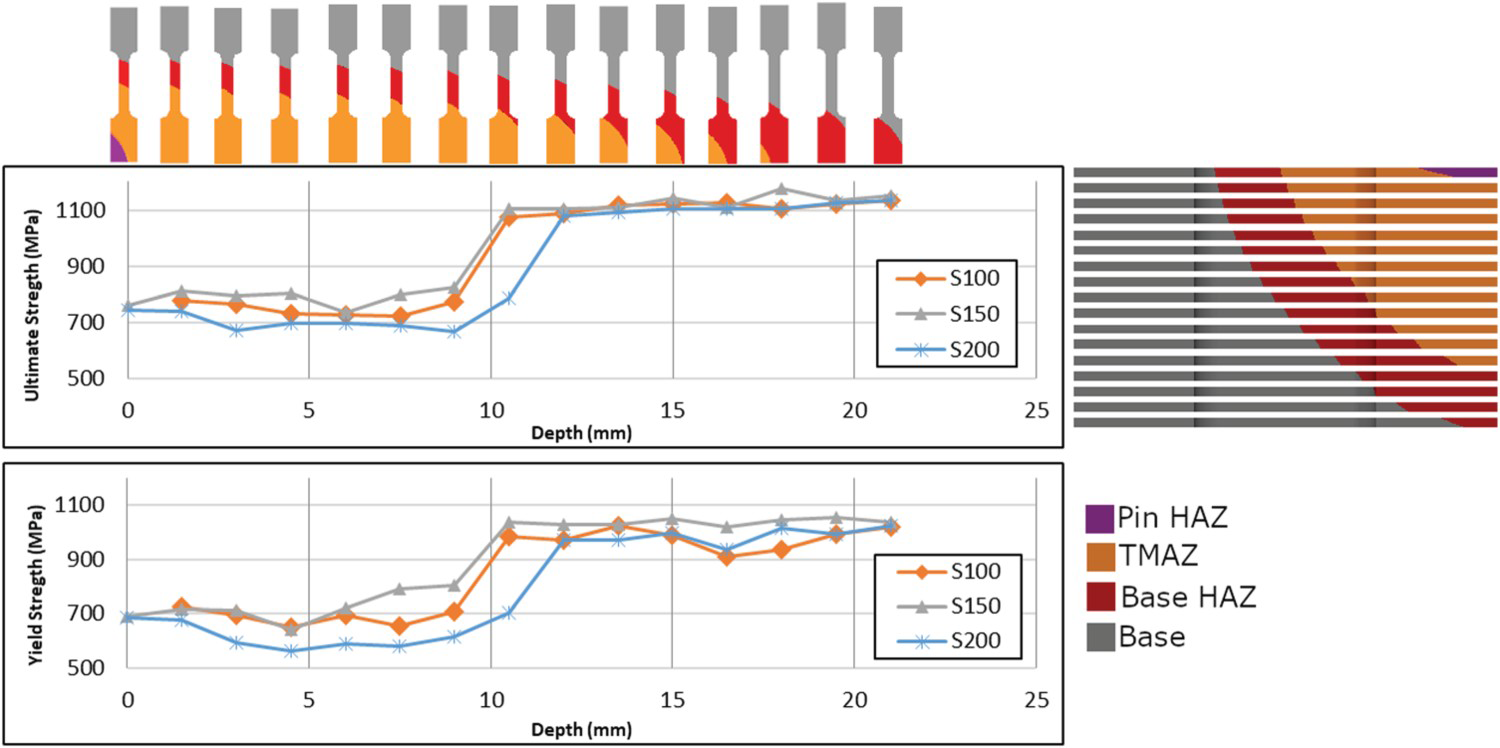
CM results
Figure 7 shows the residual stress maps obtained through the CM for samples S100, S150 and S200. Since the CM requires extrapolating data on the edges of the base block due to measurement restrictions, results near the edges may be exaggerated at some points and therefore should not be considered [34]. In this study, the analysed region below 4.6 mm from the upper surface resulted in 30 mm-thick and 93-mm area.
Residual stress contour maps for samples (a) S100, (b) S150 and (c) S200 joints; (d) shows a comparison between CM residual stress and microhardness values.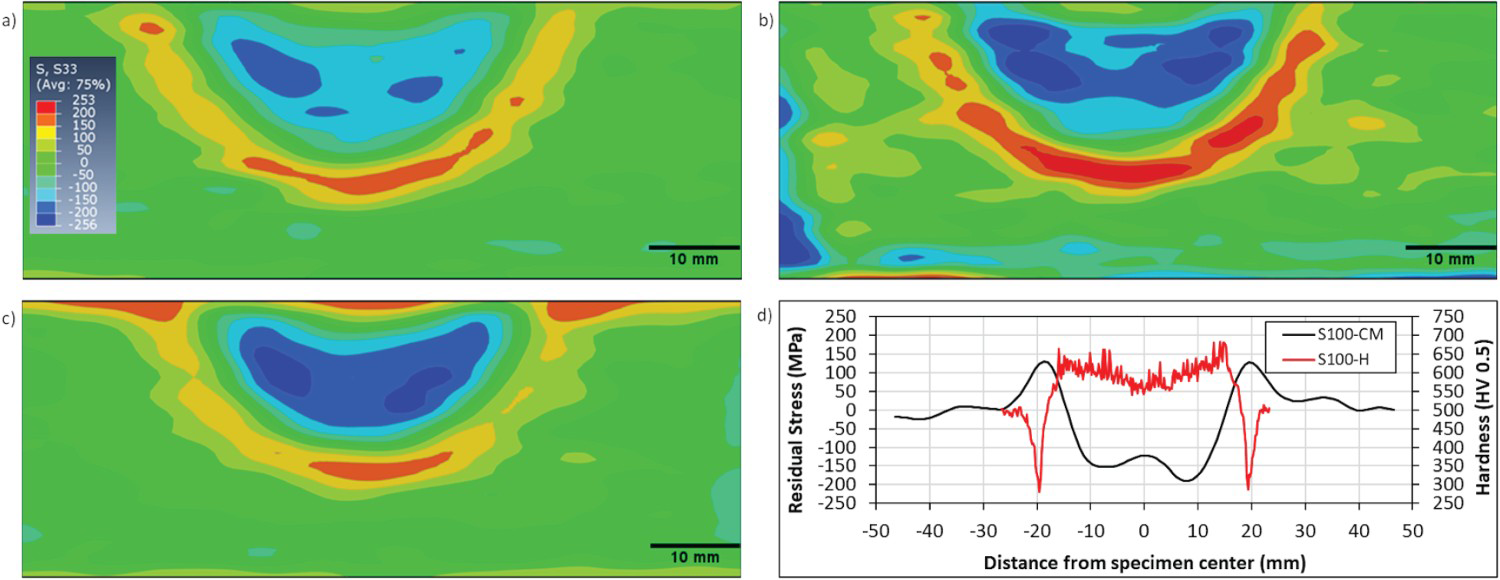
The stress distribution was relatively symmetrical in relation to the rod axis in all cases. In general, all joints showed compressive RS in the rod TMAZ region, and as the welding force increases there is an increase in the magnitude and distribution of the compressive RS. The maximum values of compressive residual stress values were −192, −255 and −223 MPa, for samples S100, S150 and S200, respectively. A gradual decrease in the magnitude of compressive stresses was observed towards the interfaces and eventually the nature of the stresses changes from compressive to tensile, with maximum values of 181, 253 and 195 MPa, for samples S100, S150 and S200, respectively.
Figure 7(d) shows a comparison between the residual stress profile at 8 mm from the surface for sample S100 and the microhardness profile at the same depth; as expected, low microhardness values are related to high tensile RS, whereas high hardness values are related to high compressive RS.
Comparison: CM and XRD
The comparison of residual stress profiles obtained from DRX method on the sample surface with the results of the CM at three specified distances from the surface (1.5, 4.6 and 8 mm) can be seen in Figure 8. As mentioned, because of imperfections related to the CM at the near-surface regions, a direct comparison is not possible. However, there is an agreement in terms of the location and symmetry of the maximum and minimum stresses. Based on the dimensions of the joints observed in metallography, it can be assumed that the maximum compressive stress regions were found approximately in the hole-rod interface region, whereas the maximum tensile peak is found near the base material HAZ region. Values of stress in the base material were close to zero for both techniques. The transition from the nature of tensile to compressive stresses occurred more abruptly in XRD analyses, while in CM analyses this transition occurred is gradual, a difference which is attributed to the smoothing procedures included in the processing of CM data.
Comparison between RS measured by XRD at the surface and CM at y = −1.5, 4.6 and 8 mm from the surface in samples S100, S150 and S200.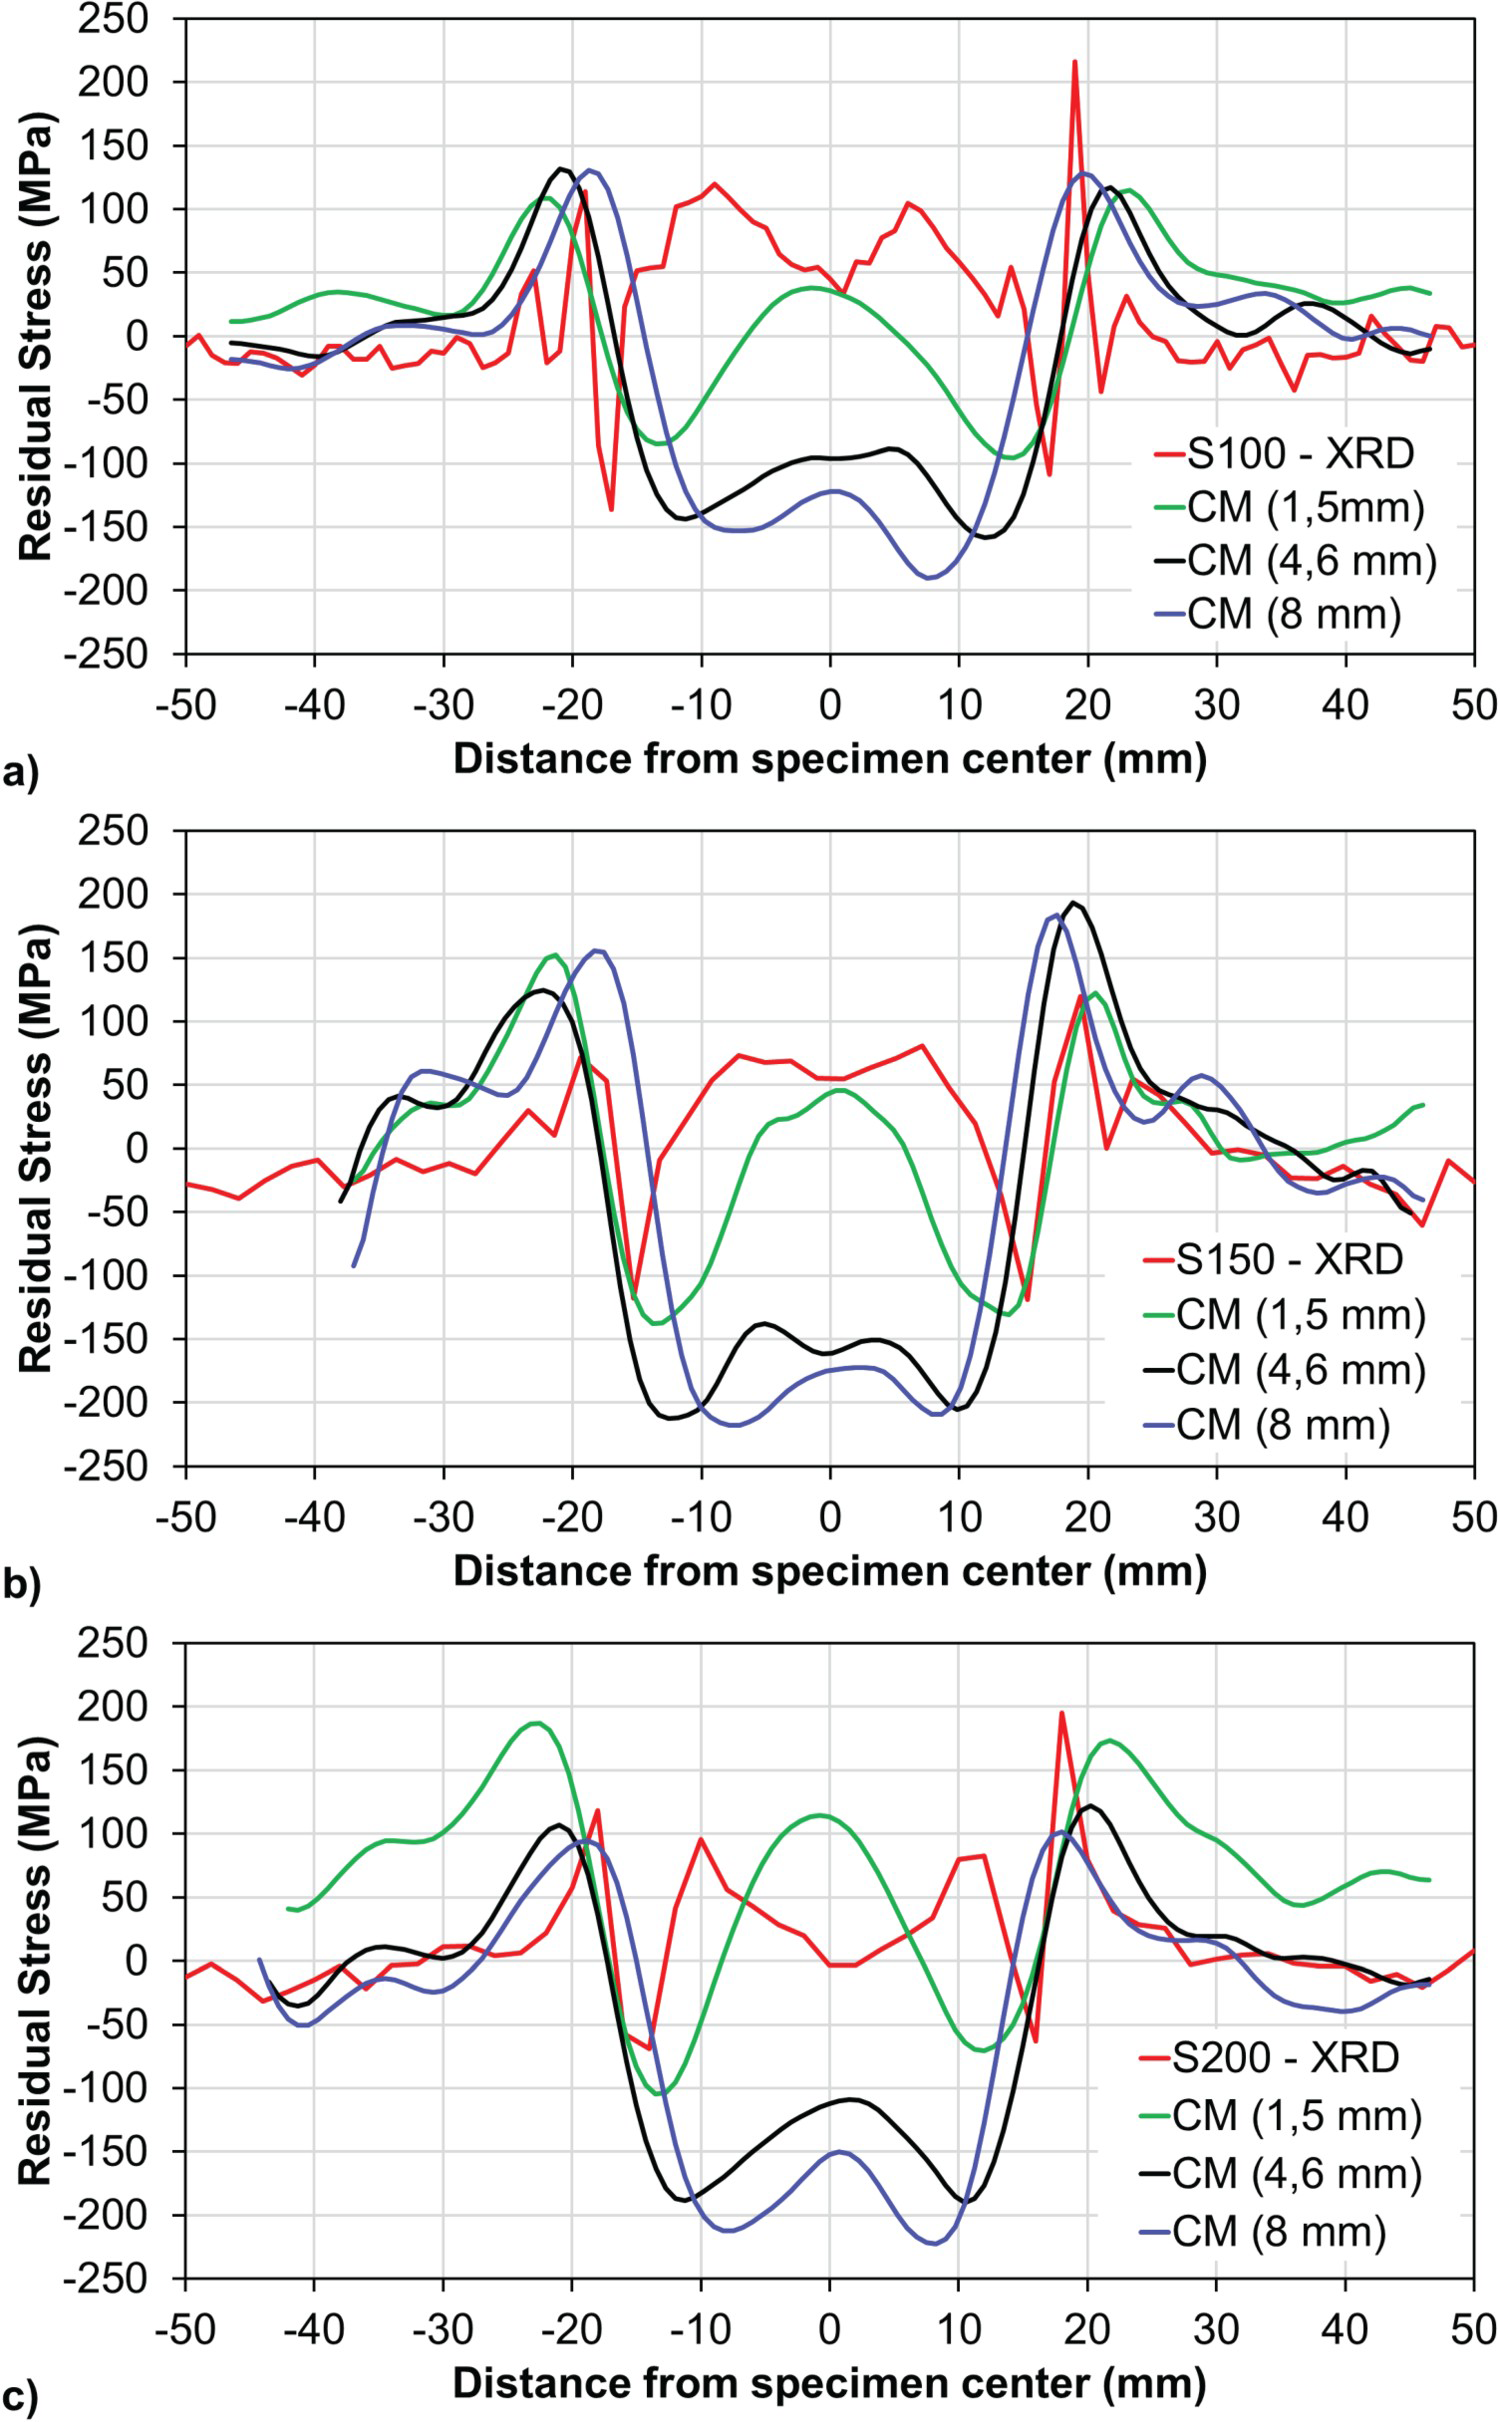
Conclusions
FHPP welding of AISI H13 steel is feasible and leads to defect-free joints in the three conditions tested. The axial force has an influence on the geometry of the weld in terms of HAZ and TMAZ size, but in all cases, the microstructure was similar, mainly composed of TM and carbides in different distributions. The hardness distribution in the joints varied according to the thermal and mechanical effects experienced by each region and are related to the type and magnitude of the residual stress developed throughout the weld. There was a tendency to increase the toughness at the interface between rod and base with an increase in axial force. The weld produced with a force of 200N showed an interesting combination of lower RS and higher toughness and ductility compared to the 150N condition. All samples showed high compressive RS in the TMAZ of the rod and highly tensile RS in the base material HAZ. The XRD method and the CM showed agreement in delimiting the characteristic regions of the FHPP weld and in identifying the peak stress sites. In addition, they demonstrated the complementary nature of both techniques.
Footnotes
Disclosure statement
No potential conflict of interest was reported by the author(s).