
Abstract
Three A387 grade 11/AISI 304 dissimilar welded joint (DWJ) repairs were prepared by manual metal arc (MMA) welding with three different composition welding electrodes: Inconel 112, Inconel 182, and Nickel-141 as a buffer layer, followed by Inconel 182 for the first, second, and third repair joints (RJs), respectively. Selected specimens were thermally aged (TA) to induce carbon migration. The microstructure was studied. Line elemental analysis across the fusion line (FL) was carried out using a scanning electron microscope (SEM)/energy-dispersive spectroscopy (EDS). Hardness and Charpy impact test (CIT) were performed. The impact specimens’ fractured surfaces were analysed using SEM/EDS. Results showed that Nickel-141 has a significant influence on impeding carbon migration. More importantly, a significant increase in the impact properties has been achieved. Depression in the impact results for the conventional procedures (Inconel 112 and Inconel 182) was found to be partially due to the formation of the carbon-enriched zone (CEZ).
Keywords
Introduction
The high-operating temperatures in some industrial applications such as boilers, fossil and nuclear power plants, heaters, and reactors require the selection of materials possessing high creep resistance such as Cr–Mo alloys. The integrity of dissimilar weldments at these high-operating temperatures is challenging due to the migration of carbon from the low Cr content side (usually ferritic steel) to the high Cr content side (usually austenitic steel) leading to the formation of a carbon composition gradient zone [1] across the fusion line (FL). This gradient zone comprises a carbon-depleted zone (CDZ), also called a soft zone, at the ferritic steel side in addition to a carbon-enriched zone (CEZ), also called a hard zone, at the austenitic steel side [2, 3].
Failures have been reported in dissimilar welded joints as a result of the development of the CEZ [4]. Also, it was found that the CEZ causes a cleavage fracture during the propagation of a crack that has been initiated in the coarse-grained heat affected zone (CGHAZ) in DWJ [5]. Moreover, under the high cycle fatigue testing, the CDZ in DWJs was found to have a significant effect on the failure of the joints [6]. As a result, many authors proposed methods to overcome the migration of carbon and consequently mitigate the development of CDZ and CEZ. You et al. [7] reported that Ni-based filler metal is the only way to effectively impede carbon migration in modified 9Cr–1Mo welding. However, one of the most significant solutions to resist carbon migration was introduced, for the first time, by Rathod et al. [8] where Ni–Fe alloy was used as a buffer layer in DWJs.
CDZ and CEZ in DWJs have been widely characterised in terms of microstructure and mechanical properties for DWJs. Zhong et al. [9] investigated the development of the CEZ in SA508/309L/308L/304 DWJ. Also, Mas et al. [10] identified and quantified carbides in the CEZ developed in 18MND5/309L DWJ. Utilising the micro-hardness testing, Rathod et al. [11] investigated the influence of using Ni–Fe alloy (53.01% Ni–43.24% Fe) buffer layer on the mechanical properties of DWJs subjected to thermal aging. Pandey et al. [12] attempted to study the influence of CDZ on the absorbed energy of 2.25Cr–1Mo/lean duplex LDX2101 steel DWJ using Charpy Impact Test (CIT).
In this study, Nickel-141 (89.4% Ni–1.25% Cr) was employed using manual metal arc (MMA) welding, as a buffer layer, at the interface between A387 grade 11 and the subsequent weld metal (WM) (i.e. Inconel 182) in a repaired joint. The role of the high Ni content is to impede carbon migration, while the 1.25% Cr content is to achieve equilibrium to the carbon activity gradient between the ferritic base metal and the austenitic weld metal. Selected specimens have undergone thermal aging. The developed carbon composition gradient in the vicinity of the FL was investigated through microstructural analysis and was compared with that developed using the conventional Ni–Cr-based electrodes (Inconel 112 and Inconel 182) in another two separate repair joints (RJs). The hardness profile across the FL of the three RJs was studied. Also, the impact properties were tested via CIT. In addition, the fractured surface of the CIT specimens was analysed using SEM/EDS in order to investigate the cause of the variation in the impact results.
Materials and methods
Three A387 grade 11/AISI 304 dissimilar RJs were prepared using MMA, such that welding electrodes Inconel 112, Inconel 182, and Nickel-141, as a buffer layer, followed by Inconel 182 were employed for RJ1, RJ2, and RJ3, respectively. The repair groove was located at the FL between A387 grade 11 and the original WM, thus the repair WM was deposited on the A387 grade 11 side as depicted in Figure 1(a). The chemical compositions of the base metal (BM) and welding electrodes are given in Table 1. Details for the welding procedure and heat inputs of both the original weld and the subsequent repair in addition to the repair groove details for RJ1, RJ2, and RJ3 are mentioned in previous work [13].
(a) Repair joints set-up and (b) specimens extraction from repair joints. Chemical composition of base plates and welding electrodes.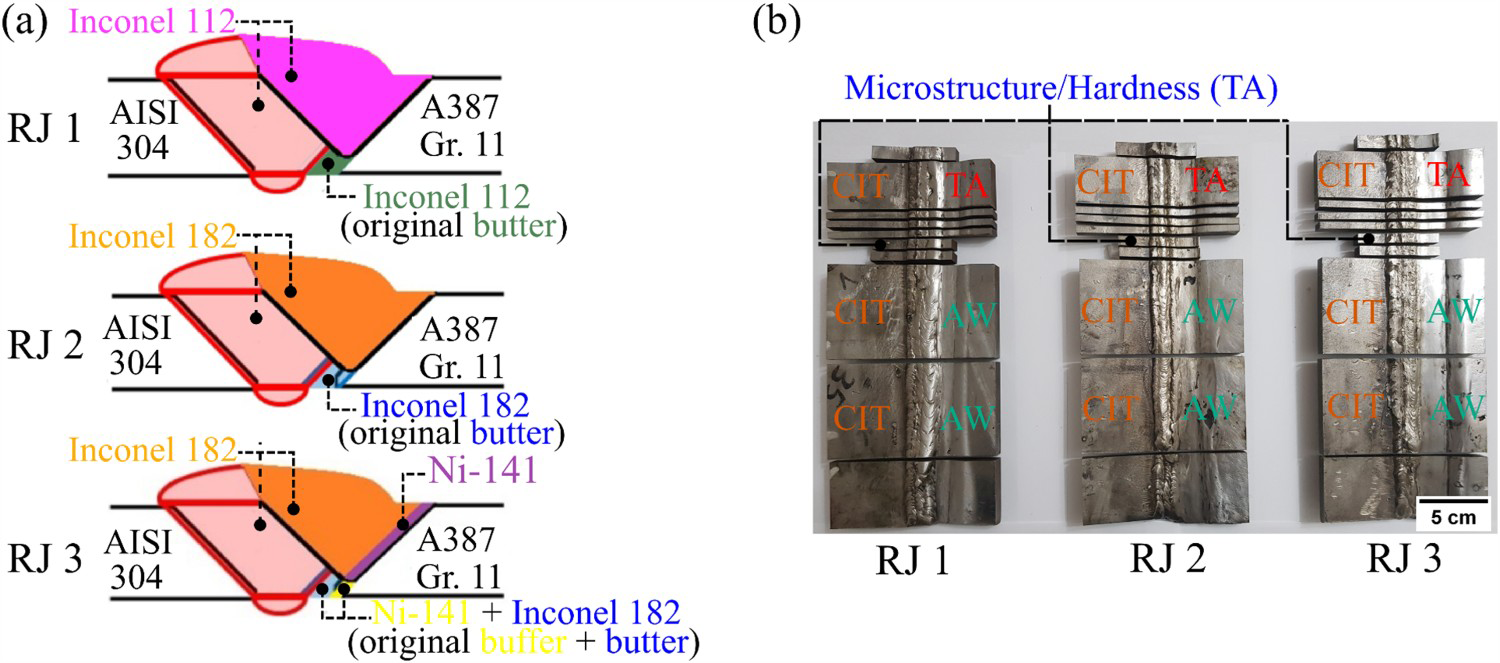
After welding was completed, specimens were extracted from the three RJs by wire cutting and selected specimens were thermally aged (TA) at 450°C for 310 h in Carbolite™ CWF-1200 furnace (see Figure 1(b)).
For microstructural analysis, TA specimens were incrementally ground from 220 grit to 2500 grit, then polished using 0.3 µm alumina suspension to a mirror surface. The microstructure of the A387 grade 11 was observed by etching using Villellàs etchant (5 mL HCl + 1 g picric acid + 100 mL ethanol) for 5 s, the CEZ was revealed via electrochemical etching at 6 V using 10% ammonium persulfate solution for 25 s, while the microstructure of the Ni-based WM (Inconel 112, Inconel 182, and Nickel-141) was observed using a solution of 80% HCl and 20% HNO3 for 40 s (applied by sweeping). A line elemental analysis of 128 µm long was taken across the A387 grade 11/WM FL of the TA specimens using JEOL JSM-IT200 SEM/EDS. The micro-hardness profile for the TA specimens was measured across the A387 grade 11/WM FL using a 50 gf testing load. Also, the lineal intercept procedure as per ASTM E0112-96 was used to measure the average grain size (AGS) via imageJ software.
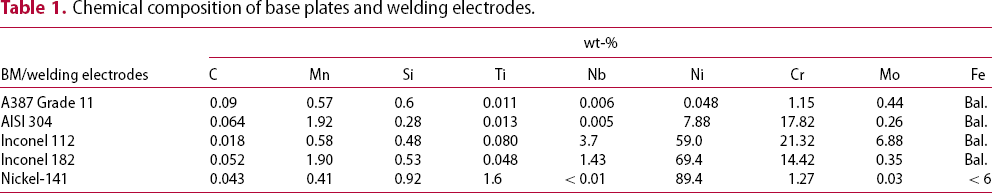
Sub-size specimens of dimensions 55 mm × 10 mm× 7.5 mm were prepared to conduct CIT as per ASTM A370-05. Three groups, each consisting of three specimens, were withdrawn from RJ1, RJ2, and RJ3 in the AW condition. Each group represents a specific location on the weld joint such that, specimens’ notches of the first two groups were located at each of the two heat-affected zones (HAZs) of both A387 grade 11 and AISI 304, and those of the third group were located at the WM. Additional two groups were withdrawn representing both BMs; A387 grade 11 and AISI 304 (see Figure 2(a)). In order to study the influence of the CEZ on the impact results, a single group was withdrawn from each RJ in the TA condition such that the notches were machined intersecting the A387 grade 11/WM FL as depicted in Figure 2(b,c). The notches were prepared via Charpy notch machine (Blacks Charpy, Model: CNB-34). The absorbed energy of each specimen was measured and the average absorbed energy (AAE) of each group was calculated. Also, the fractured surfaces of the TA specimens were analysed using the stereozoom microscope and SEM/EDS.
CIT specimens locations for (a) AW condition and (b) TA condition, (c) notches intersecting FL for TA specimens. All dimensions are in mm.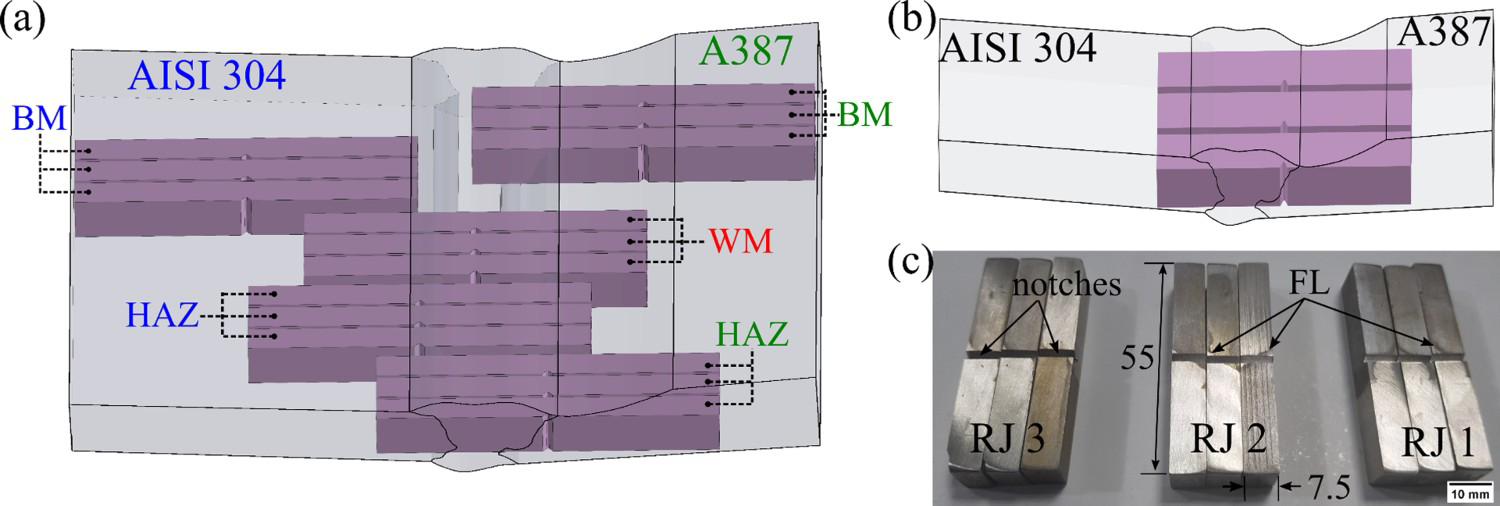
Results and discussion
Microstructure analysis
The typical microstructural gradient of a weld, comprising the CGHAZ, fine-grained HAZ (FGHAZ), inter-critical HAZ (ICHAZ), and the BM, is given schematically in Figure 3(a) along with the respective AGS of each zone for RJ1, RJ2, and RJ3. Figure 3(b–d) shows the microstructure of the CGHAZ, Figure 3(e–g) shows the microstructure of the FGHAZ, while Figure 3(h–j) shows the microstructure of the ICHAZ for RJ1, RJ2, and RJ3, respectively. Both ferrite (light etched) and pearlite (dark etched) phases are observed at these regions. The AGS of these regions differs significantly due to the effect of the different thermal cycles they undergo due to welding with respect to the relative distance of these zones from the heat source.
(a) Weld zones schematic and average grain size (AVG) of each zone for RJ1, RJ2, and RJ3. CGHAZ for (b) RJ1, (c) RJ2, and (d) RJ3. FGHAZ for (e) RJ1, (f) RJ2, and (g) RJ3. ICHAZ for (h) RJ1, (i) RJ2, and (j) RJ3.
Figure 4(a–c) depicts the microstructure of the A387 grade 11/WM FL for RJ1, RJ2, and RJ3, respectively. A carbon denuded-coarsened ferrite region called the CDZ is observed at the HAZ of the A387 grade 11. The CDZ in RJ3 was found to be significantly mitigated compared with that in RJ1 and RJ2, since the maximum width of the CDZ in RJ3 is 38 µm and less uniform compared with that in RJ1 (128 µm and most uniform) and RJ2 (122 µm but less uniform than RJ1). This is evident since the pearlite phase is predominant in RJ3 compared with that of RJ1 and RJ2 as shown in Figure 4(d–f). This can be justified in two points: first, the low carbon activity gradient, which is the driving force for carbon diffusion from the BM to the WM, controlled by the Cr content gradient across the WM/BM. This Cr gradient is lowest across Nickel-141/A387 grade 11 in case of RJ3, compared with that across Inconel 112/A387 grade 11 and Inconel 182/A387 grade 11 in case of RJ1 and RJ2, respectively (see Table 1). Second is related to the fact that the high nickel content tends to alter the solubility of carbon, makes carbides less stable, changes diffusivity, and generally retards carbon migration from ferritic steel [14]. This is the case here, since the nickel content of Nickel-141 in RJ3 is quite greater than that of Inconel 112 and Inconel 182 in RJ1 and RJ2, respectively (see Table 1). In other words, RJ1 showed the largest CDZ width since its WM (i.e. Inconel 112) possessed the highest Cr content while the lowest Ni content. RJ3 showed the narrowest CDZ width since its WM (i.e. Nickel-141) possessed the lowest Cr content, while the highest Ni content.
Carbon-depleted zone (CDZ) for (a) RJ1, (b) RJ2, and (c) RJ3. Higher magnification of CDZ for (d) RJ1, (e) RJ2, and (f) RJ3. Dimensions are in µm.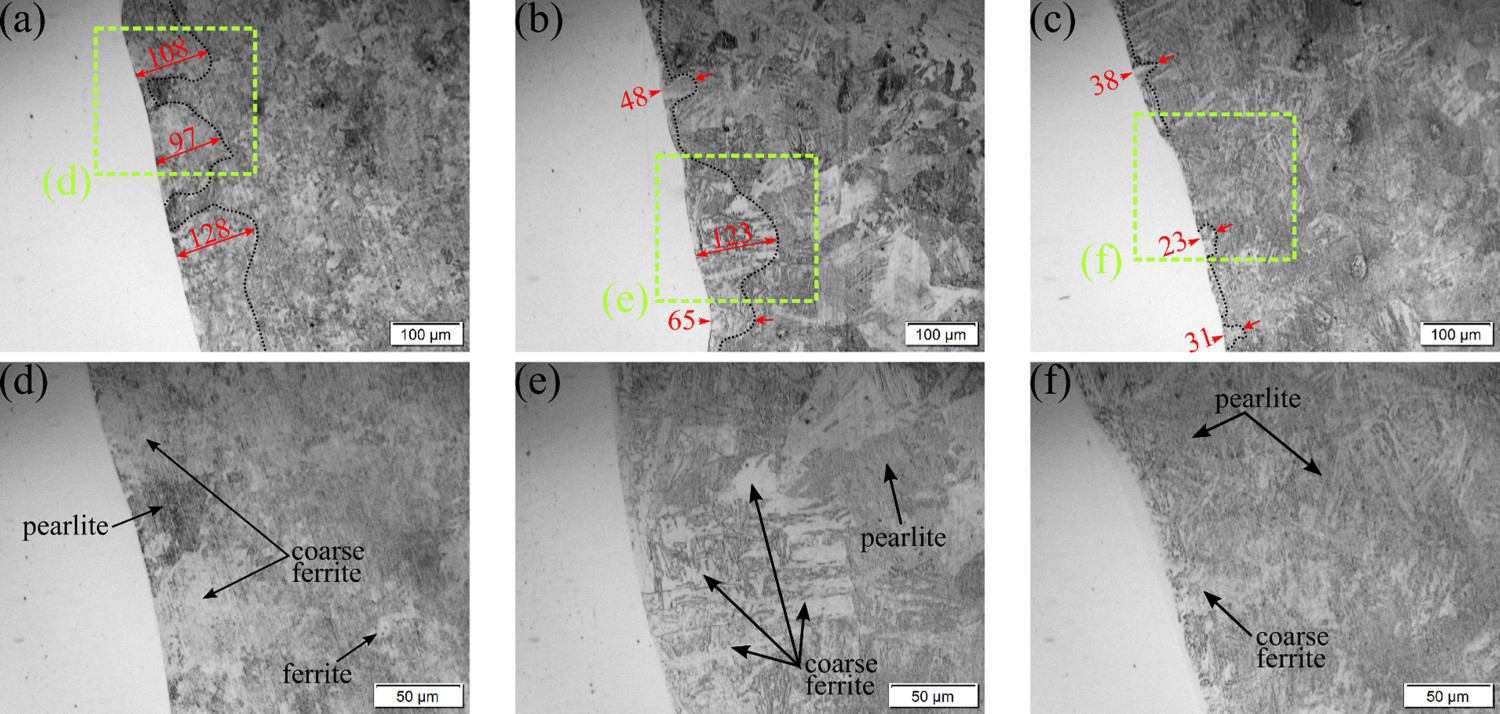
As a result of carbon migration from BM to WM, a CEZ is formed adjacent to the FL on the WM side, as depicted in Figure 5(a–c). The microstructure of the CEZ is formed of ferrite and pearlite, with pearlite being predominant due to the enrichment of carbon as a result of migration, similar findings were confirmed in previous studies [11]. The width of the CEZ was observed to be the largest (15–12 µm) and most uniform in case of RJ1, smaller (17–3 µm), along most of the FL length, and less uniform in RJ2, and minimum (7–2 µm) in the case of RJ3. This variation in the CEZ width is due to the variations in the carbon activity gradient and the WM nickel content within the three RJs, as explained above. Figure 5(d–f) depicts the microstructure of the WM. Both columnar and equiaxed dendrites are observed for Inconel 112 (Figure 4(d)). Inconel 182 exhibits coarse columnar dendrites, solidified grain boundaries (SGBs), and solidified subgrain boundaries (SSGBs). Finally, the distinct fully austenitic coarse dendrites are observed in Nickel-141 (Figure 4(c)) along with the SGBs, SSGBs, and migrated grain boundaries.
Carbon-enriched zone (CEZ) for (a) RJ1, (b) RJ2, and (c) RJ3. Microstructure of WM for (d) RJ1, (e) RJ2, and (f) RJ3. CD, Columnar Dendrites; DC, Dendrite Core; DS, Dendrite Spacings; DA, Dendrite Arms; ED, Equiaxed Dendrites.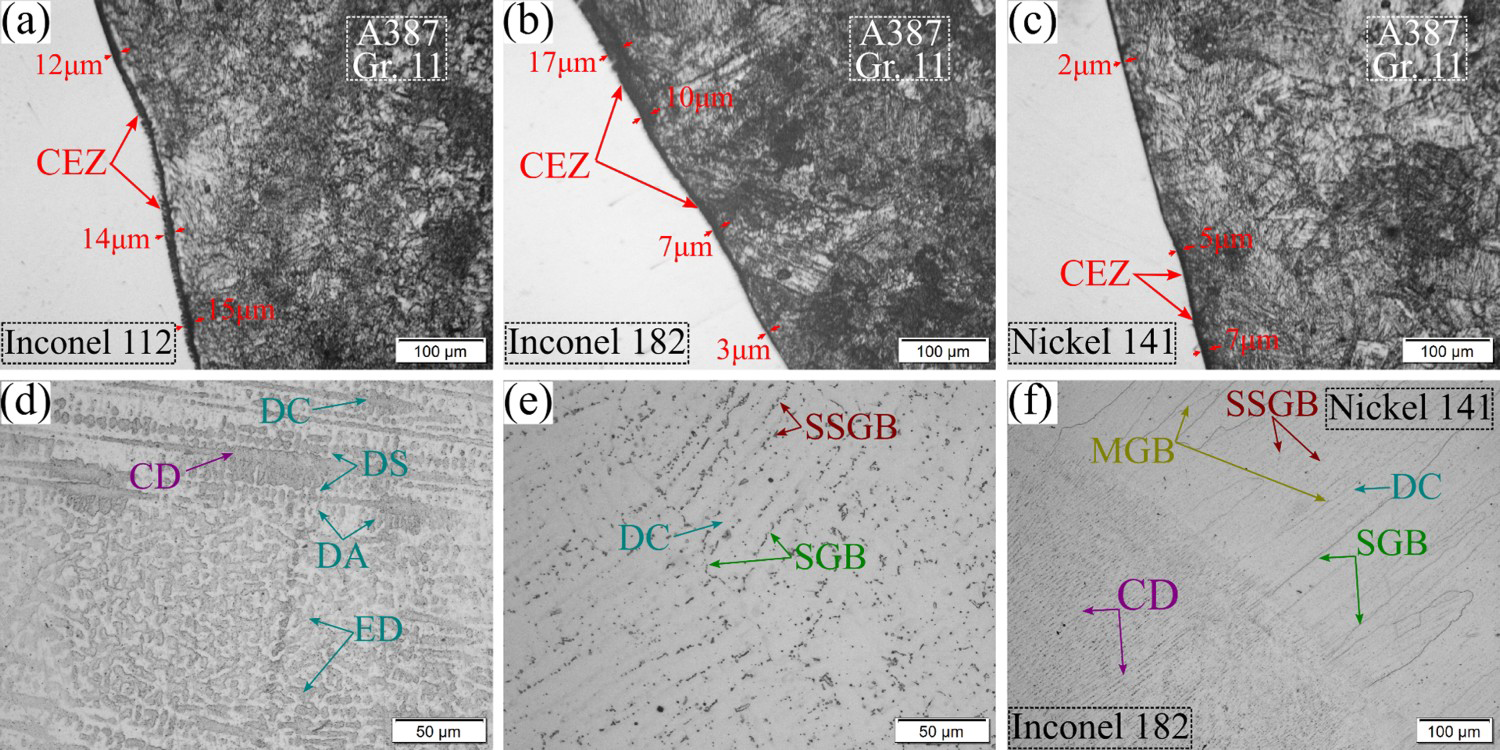
The line elemental analysis shown in Figure 6(a–c) represents variations in the compositions of elements across the FL. Spectrum of elements responsible for changing the carbon activity gradient (i.e. Cr), impeding carbon migration (i.e. Ni), besides Fe, Mn, and Mo are all given. Across the FL, RJ1 and RJ2 show relatively large changes in Fe, Ni, and Cr along with relatively small changes in Mo and Mn. These changes can be observed only for Fe and Ni in the case of RJ3. These changes in the elemental spectrum across the FL is back to the chemical composition of the corresponding metals. However, it is important to note that the flat slope of Cr in RJ3 versus the steep slopes of the same element in the case of RJ1 and RJ2, emphasises that RJ3 possesses the lowest carbon activity gradient across the FL compared with that of RJ1 and RJ2. This, in turn, justifies the capability of Nickel-141 to impede carbon migration and, consequently, overcomes the formation and growth of CDZ/CEZ. Figure 6 also shows the unmixed zone (UMZ) taking place at the WM adjacent to FL in RJ1, RJ2, and RJ3. The size of this zone can be specified either using the line elemental profile or by observing the Type-II boundary which is evident in case of RJ2 (Figure 6(b)). It is worthy to mention that the CEZ in RJ1 and RJ2 (Figure 6(a,b)) lies within the UMZ.
SEM/EDS line analysis across the FL for (a) RJ1, (b) RJ2, and (c) RJ3. Units in the X-axis are in µm. UMZ, unmixed zone.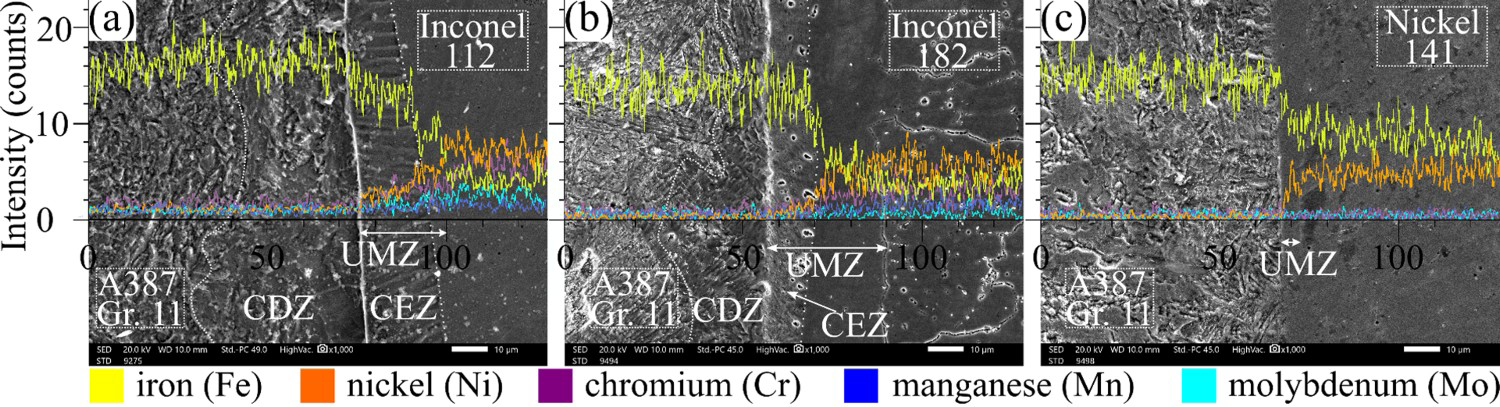
Hardness testing
Figure 7 depicts the hardness profile across the A387 grade 11/WM FL of RJ1, RJ2, and RJ3. A depression in the hardness profile, representing low hardness values, adjacent to the FL at the A387 grade 11 side is evident for RJ1 and RJ2 but is missing in case of RJ3. Another observation is the peak values found adjacent to the FL at the WM side for RJ1, RJ2, and RJ3. These distinct hard and soft zones adjacent to the FL are widest in case of RJ1 and RJ2 due to the formation and growth of the CEZ and CDZ. However, these zones are narrower in case of RJ3 because the formation and growth of CEZ and CDZ was significantly mitigated by employing the Nickel-141 buffer layer.
Hardness profile across the FL for RJ1, RJ2, and RJ3.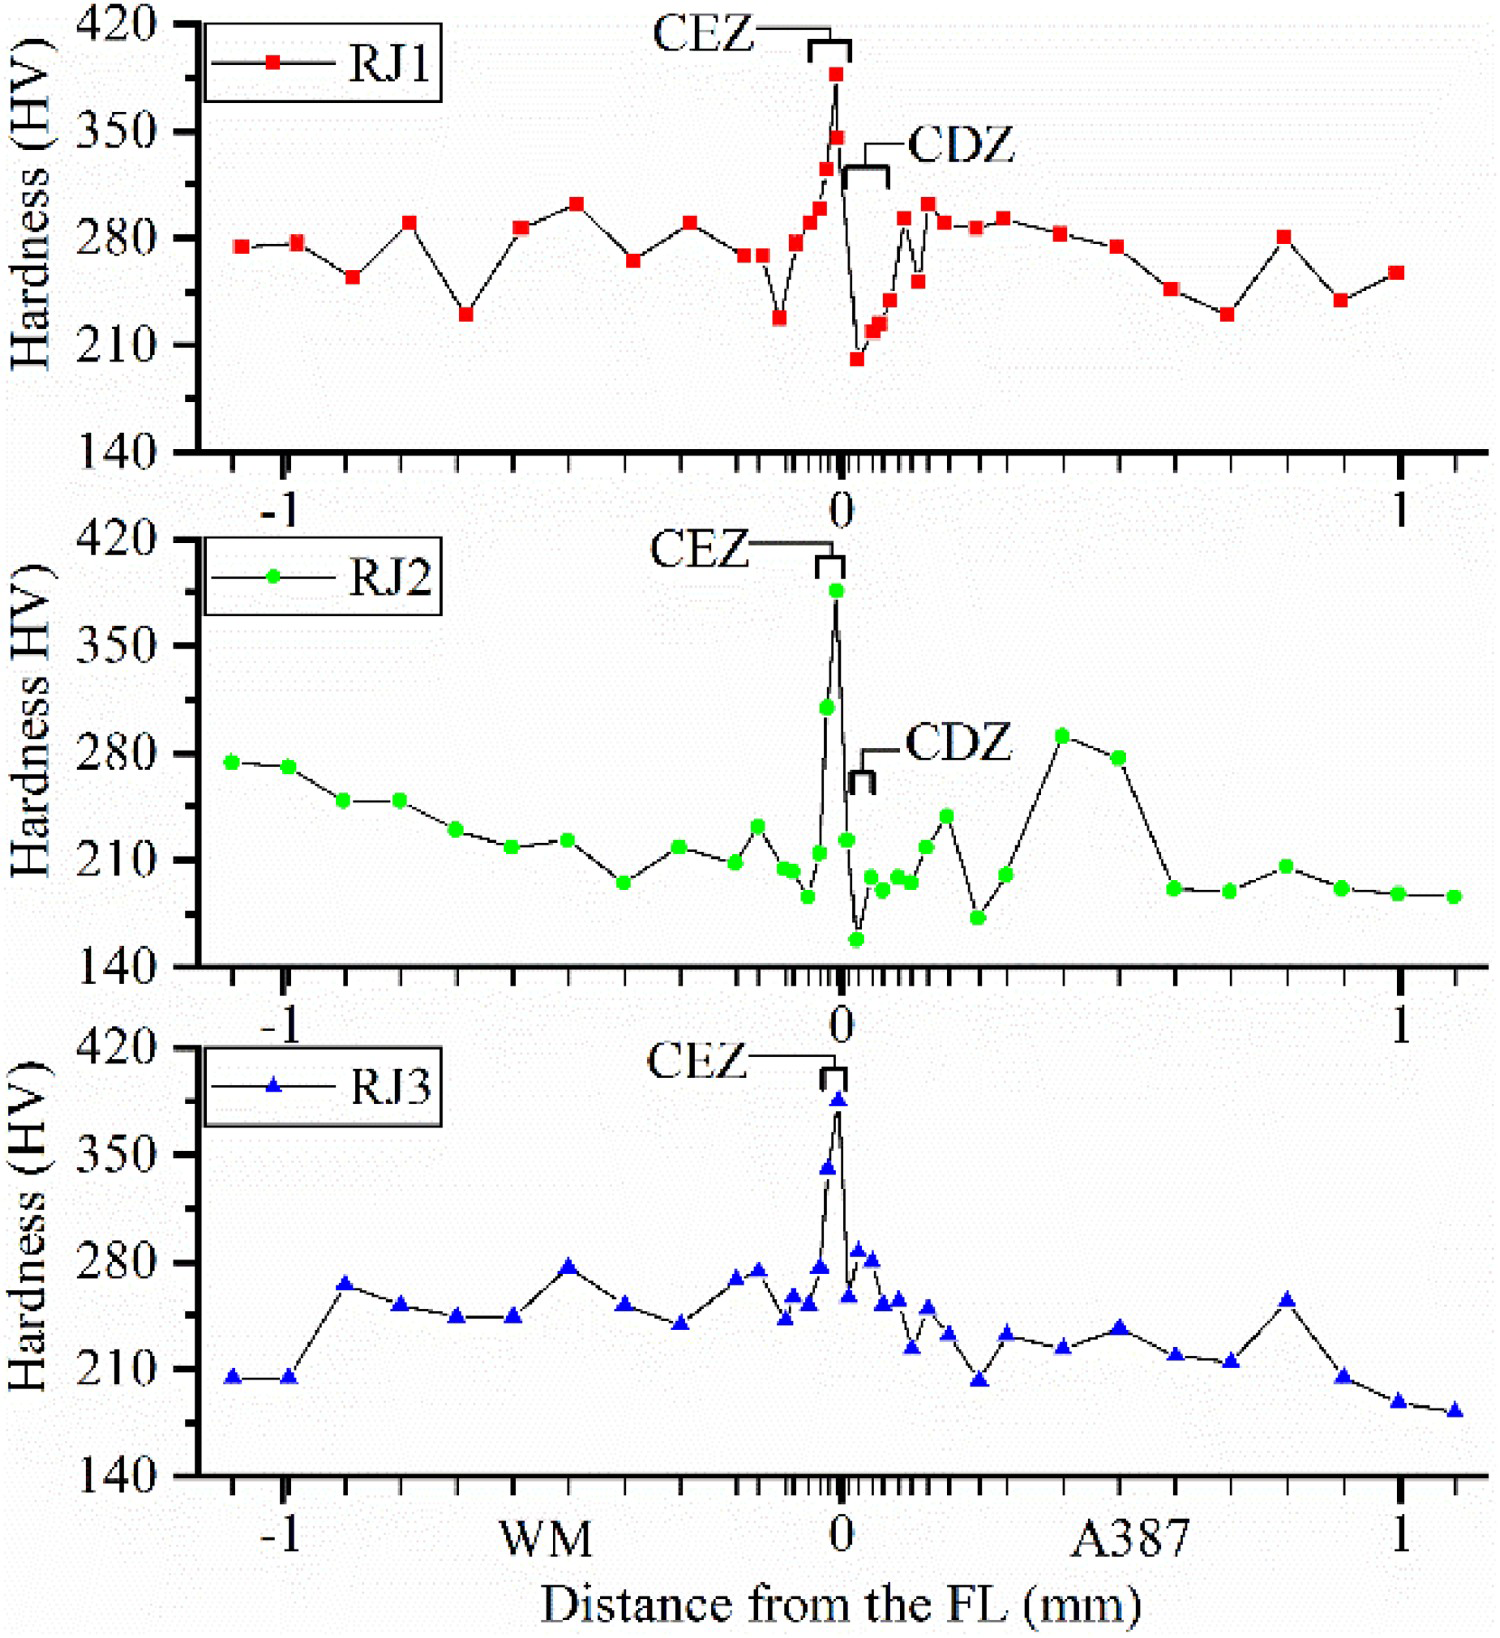
Impact properties
Figure 8 shows the results of the CIT for the specimens in the AW condition depicted in Figure 2(a). It can be observed that the AAE on both HAZs is less than that of the corresponding BMs because the AGS of the CGHAZ is quite larger compared with that of the corresponding BMs (see Figure 3(a)). The AAE at the WM in RJ2 (91 J) and RJ3 (88.5 J) are close in values since the notch was located on WM of the same type (i.e. Inconel 182). While that of RJ1 showed a significant reduction (48J), which may be explained by the presence of secondary-phased particles [15].
Average absorbed energy (AAE) for CIT specimens in AW condition.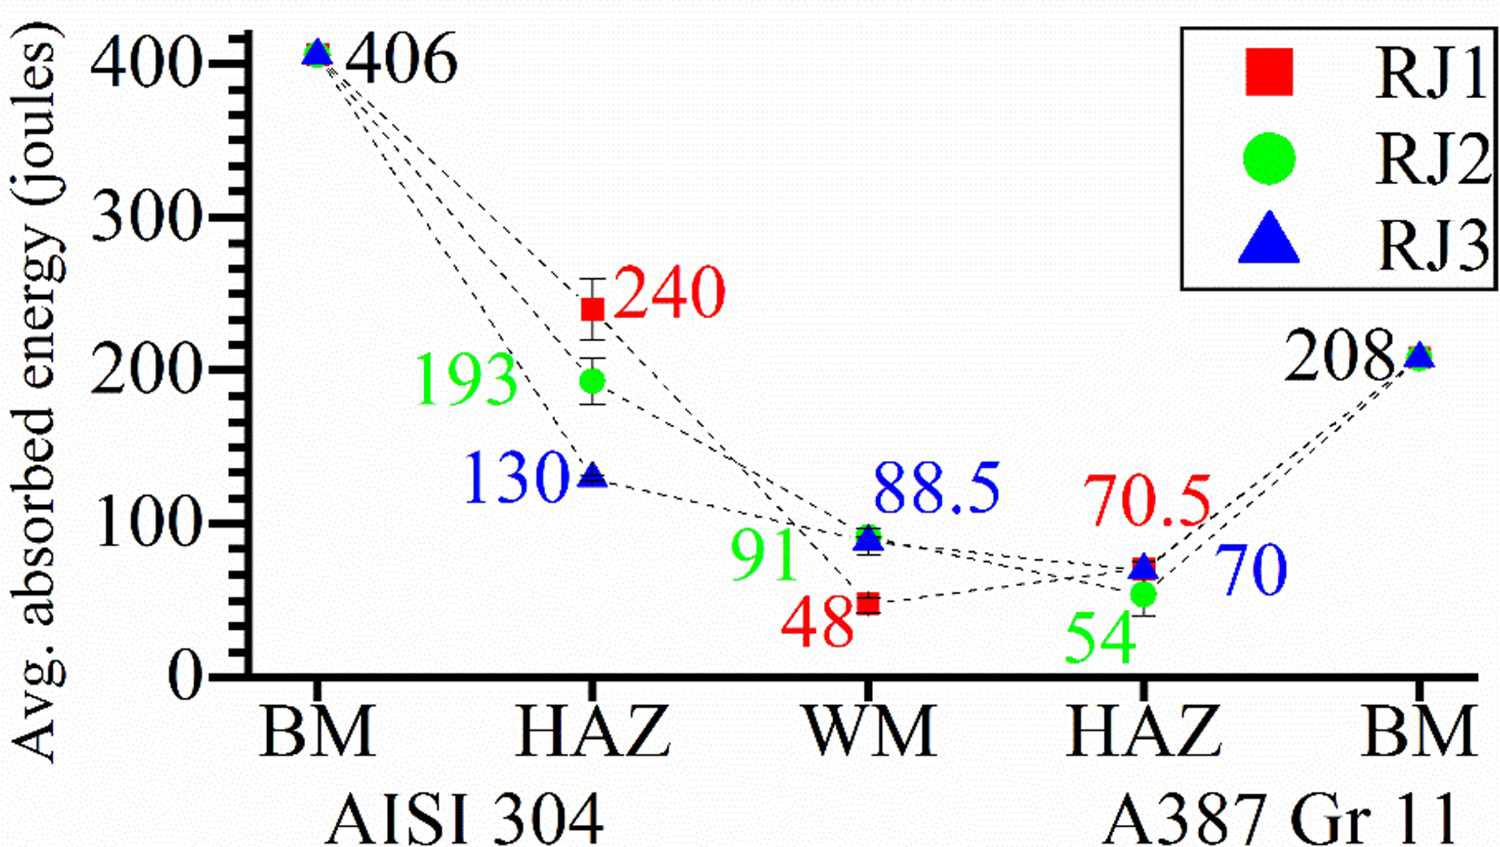
Impact results for the TA specimens taken at the FL as depicted in Figure 2(b,c) are given in Figure 9. The AAE for RJ3 (97 J) is significantly higher by 18.5% than that of RJ1 (79 J) and by 28.8% than that of RJ2 (69 J). The specimens’ fractured surfaces were analysed below to justify these findings.
Average absorbed energy (AAE) for CIT specimens in TA condition at the FL.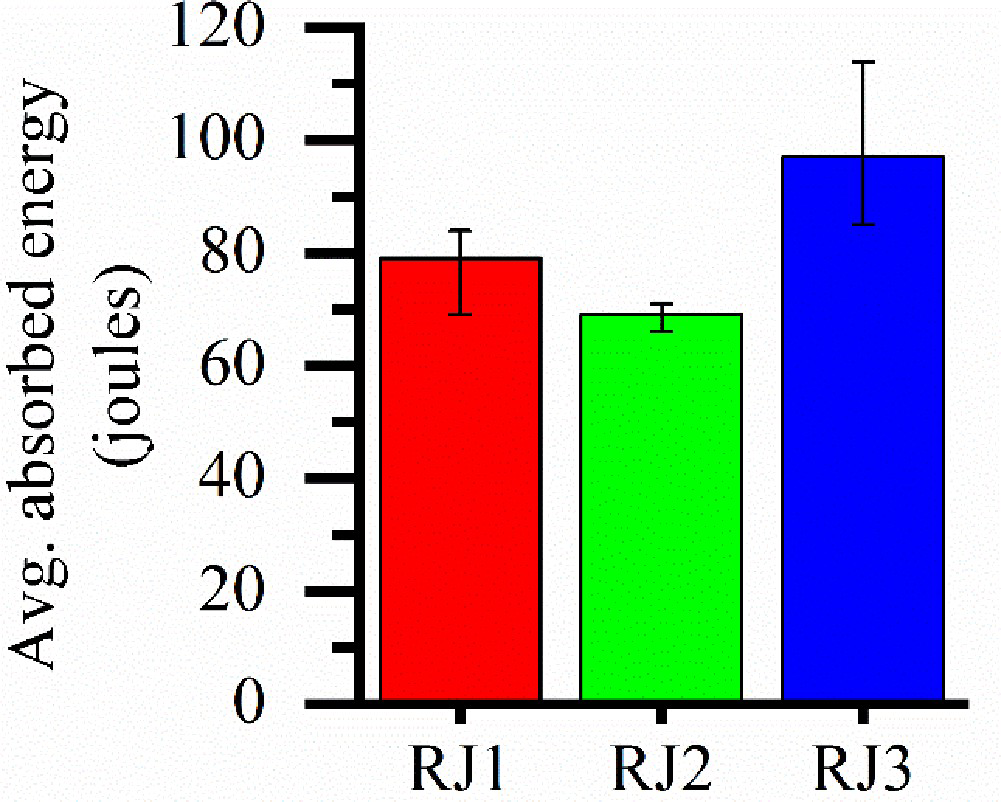
Figure 10(a–c) depicts the fractured surface of the TA impact specimens under the stereozoom microscope. The fractured surfaces are split into two regions: the WM region, representing Inconel 112, Inconel 182, and Nickel-141 + Inconel 182 for RJ1, RJ2, and RJ3, respectively, and the A387 region. Between these two regions is the FL region, which comprises the potential CDZ and the CEZ adjacent to its sides. In addition, the fracture initiation origin of the three specimens can be observed by tracing the river pattern strips. Figure 10(d–f) shows a quasi-cleavage fracture at the WM region for RJ1, RJ2, and RJ3, respectively. Some dimples surround the quasi-cleavage facets in RJ3 can be observed, indicating a more ductile fracture (i.e. higher absorbed energy) than RJ1 and RJ2. Also, the size of the facets in RJ3 is evident to be the smallest, RJ2 is the largest, and RJ1 is in the middle. This emphasises the results in Figure 9 since the absorbed energy correlates inversely with the facet size [16]. Figure 10(g–i) shows cleavage fractures for RJ1, RJ2, and RJ3 in the A387 region, respectively, indicating a brittle fracture mode.
Fractured surface of TA CIT specimens under the stereozoom microscope for (a) RJ1, (b) RJ2, and (c) RJ3. SEM images of fractured surface of TA impact specimens at WM region for (d) RJ1, (e) RJ2, and (f) RJ3 and at A387 region for (g) RJ1, (h) RJ2, and (i) RJ3.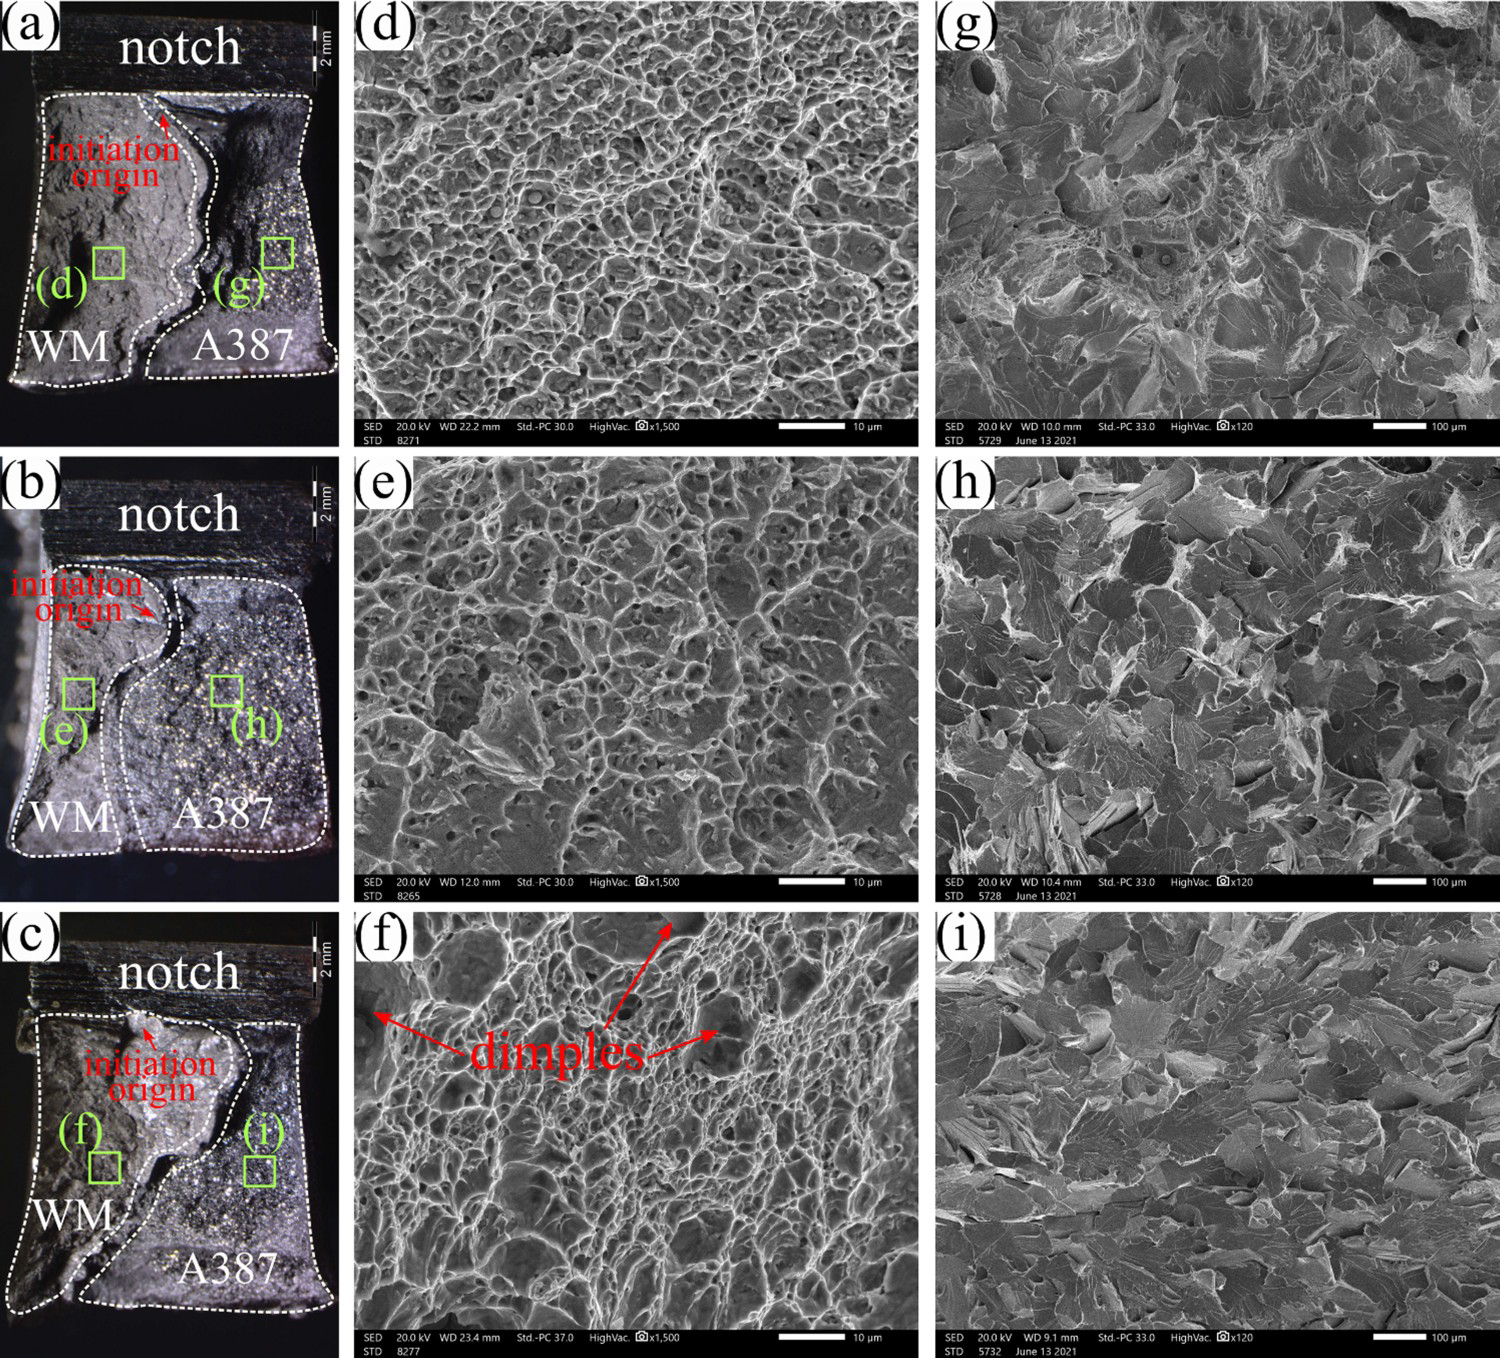
It is obvious that the surface area of the fractured surfaces of the TA specimens depicted in Figure 10(a–c) comprises mainly two zones: the WM and the HAZ. It is important to state that varying the WM/HAZ surface area fraction shall influence the impact results given in Figure 9. This is evident since the impact results in Figure 8, representing several locations on the welded joints, showed a varying absorbed energy with respect to the specimen location withdrawn from each RJ. Although the impact results in Figure 8 are given for specimens in the AW condition, normalising these data to TA condition is still valid since thermal aging shall enhance the impact results of the HAZ due to the tempering effect with no improvement on the WM due to the increase in the fraction of laves phases [11]. Accordingly, it is convenient to state that although the WM of RJ1 showed the lowest absorbed energy (48 J), as depicted in Figure 8, while representing the greatest total surface area fraction of the fractured surface (53%) compared with RJ2 and RJ3 (see Figure 11). RJ1 TA specimen did not show the lowest impact results in Figure 9. Another observation is that RJ2 TA specimen showed the lowest impact results in Figure 9 despite the fact that its WM possessed the greatest absorbed energy as depicted in Figure 8. Indeed, the WM represents only 33% of the total surface area of the fractured surface (Figure 11), but its HAZ showed only a decrease by approximately 14 J compared with RJ1 and RJ3. Based on these observations, further investigation of the fractured surfaces is required to understand the sources of variability in the impact results.
WM/HAZ surface area fraction for fractured surfaces of RJ1, RJ2, and RJ3 TA impact specimens.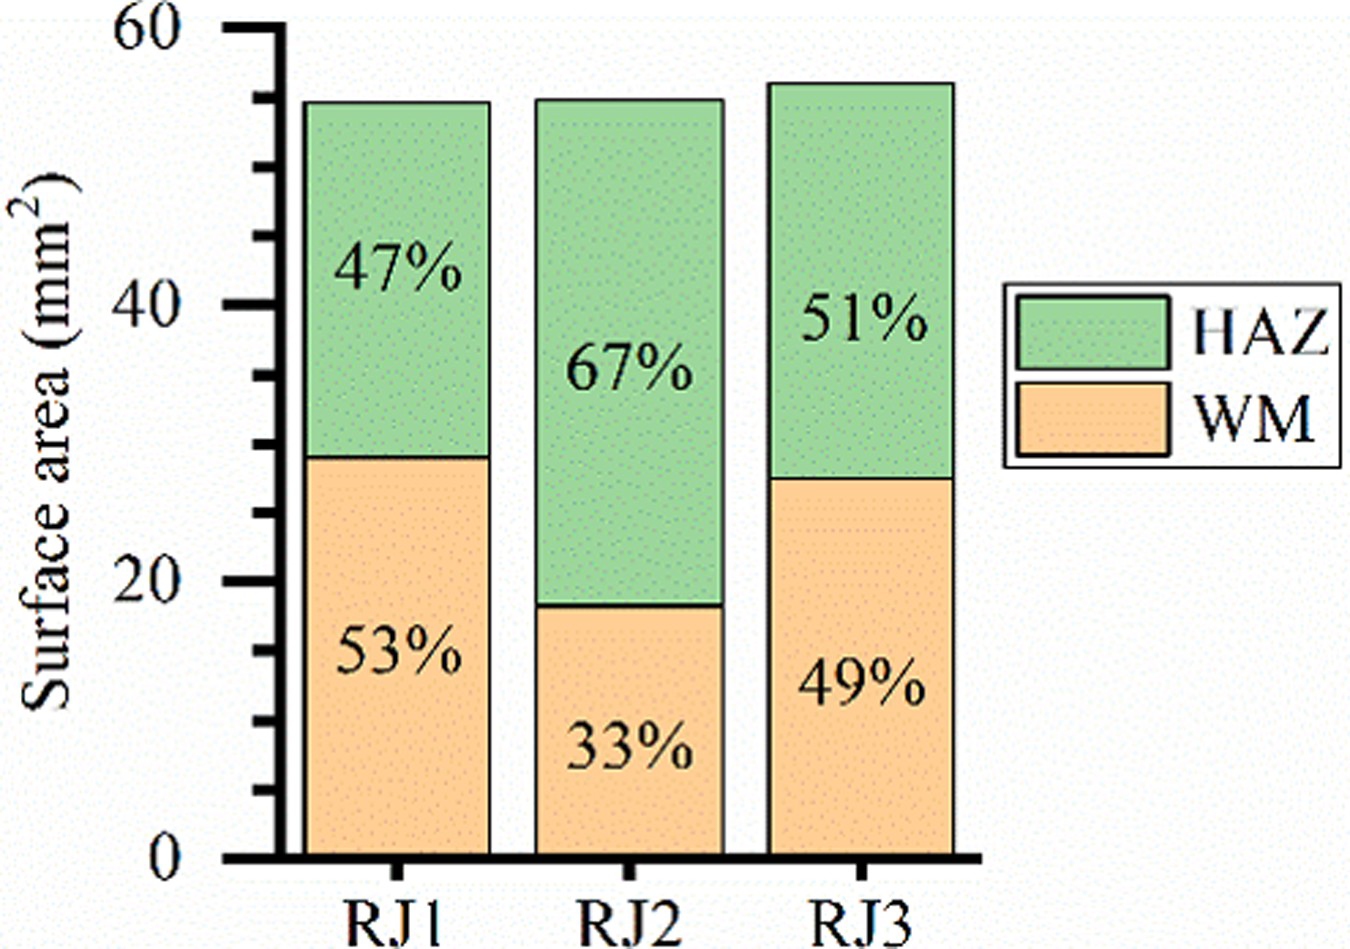
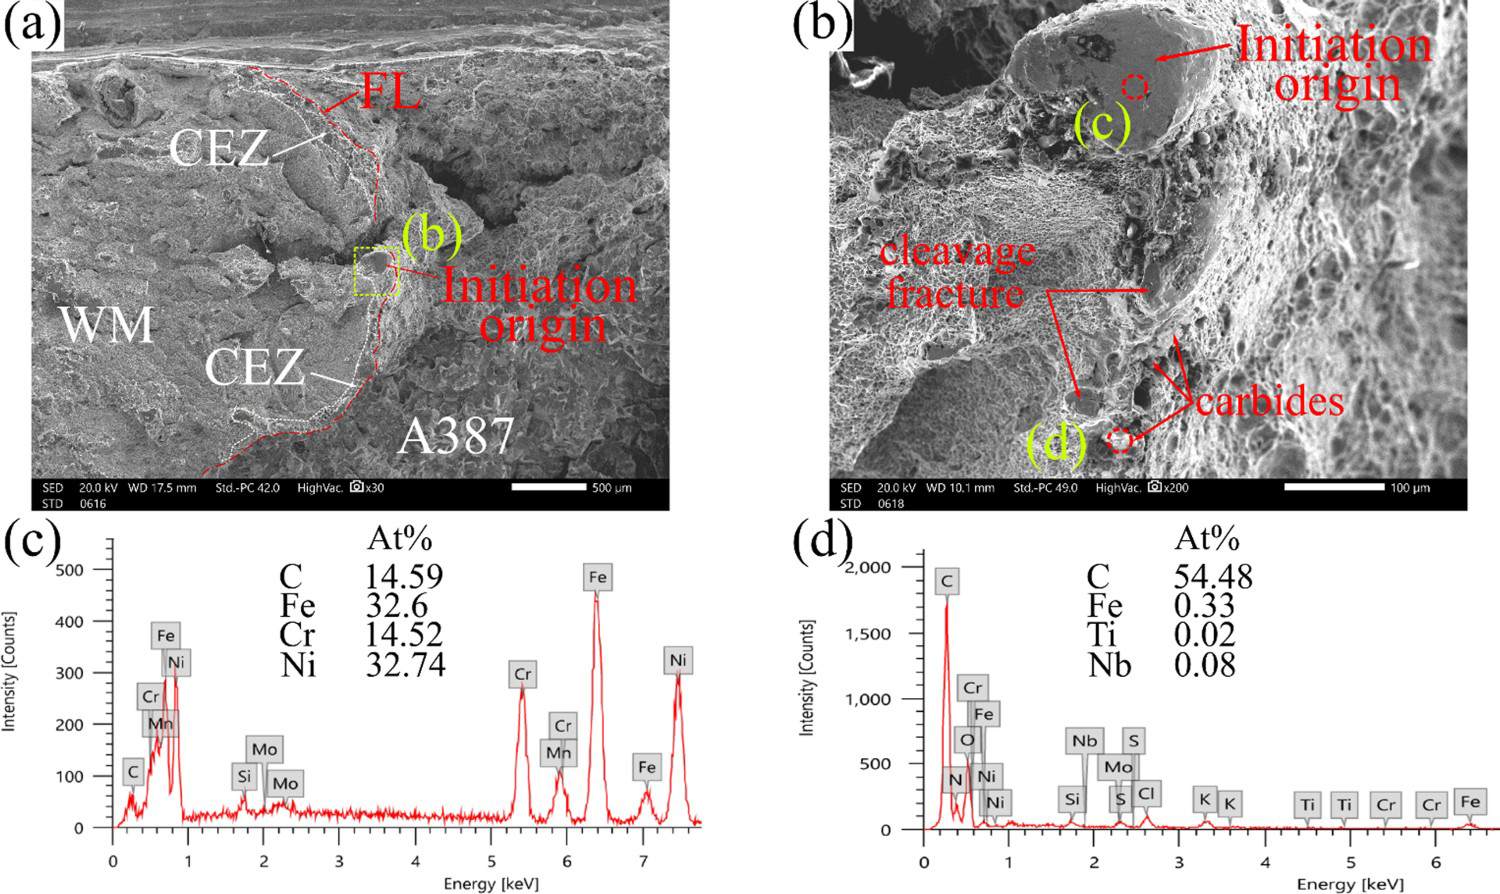
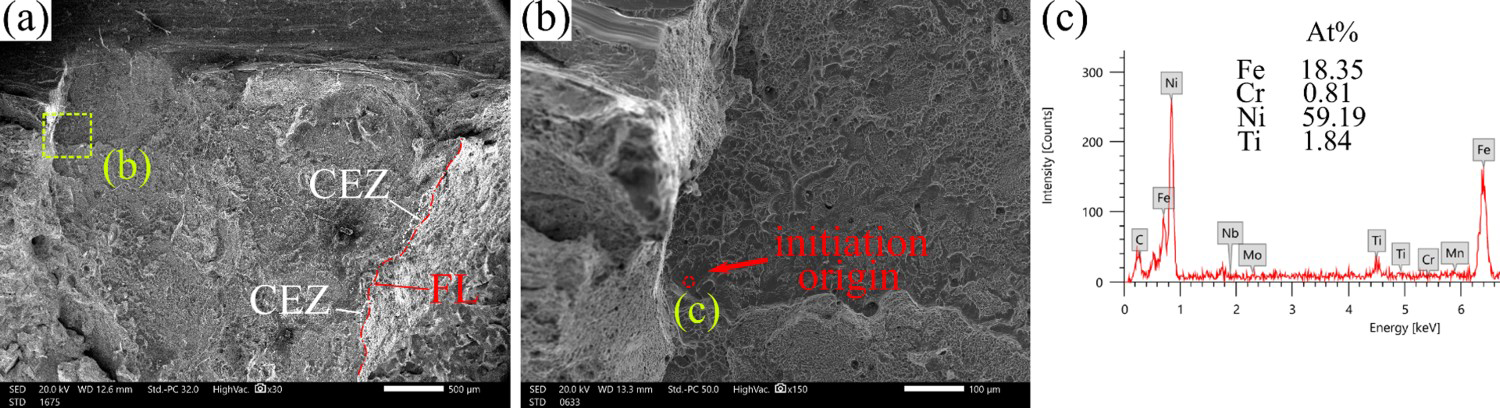
By further investigation of the fractured surfaces, and by tracing the river pattern strips, we can observe that the fracture in RJ1 initiates from a large grain (≈53 µm) located in the vicinity of the FL (see Figures 10(a) and 12(a,b)). This grain showed a cleavage fracture indicating its hard structure. Also, a carbide particle has been spotted at close proximity to the initiation origin. EDS analysis of the fracture initiation origin given in Figure 12(c) confirms its high carbon content and thus its brittle structure. Adjacent to the FL, it can be observed that the CEZ shown in Figure 12(a) comprises a full cleavage fractured grains in addition to carbide particles (see Figure 12(b)). These grains are most probably the grains of high fraction pearlite phase confirmed by the microstructure in Figures 5(a) and 6(a) and hardened WM grains (confirmed by EDS analysis of fracture origin). Carbide particles were confirmed via EDS analysis given in Figure 12(d). Similarly, the fracture of RJ2 impact specimen originates from a large hard grain (≈200 µm) in the vicinity of the FL (see Figures 10(b) and 13(a,b)). Also, grains of high pearlite phase fraction, hardened WM coarse grains, and carbides can be observed in the CEZ given in Figure 13(a,b). Results of EDS analysis confirm the hard structure of the initiation origin (see Figure 13(c)). EDS analysis of the carbides within the CEZ is given in Figure 13(d). On the other hand, the fracture of the RJ3 impact specimen originates from a large grain (≈56 µm) as shown in Figure 14(b). This fracture origin is located at the cleavage initiation site, explaining its cleavage fracture, approximately 350 µm from the notch root (see Figures 10(c) and 14(a,b)). EDS analysis of the fracture origin given in Figure 14(c) confirms that the fracture origin is located at the WM with no evidence of carbides or hard structure.
SEM images of fractured surface of RJ1 TA impact specimen (a) fracture origin and (b) high magnification of the fracture origin and EDS points. EDS analysis for (c) fracture origin and (d) carbide particles. SEM images of fractured surface of RJ2 TA impact specimen showing (a) the fracture origin and (b) high magnification of the fracture origin and EDS points. EDS analysis for (c) fracture origin and (d) carbide particles. SEM images of fractured surface of RJ3 TA impact specimen showing (a) the fracture origin and CEZ, (b) high magnification of fracture origin and EDS point, and (c) EDS analysis for the fracture initiation origin.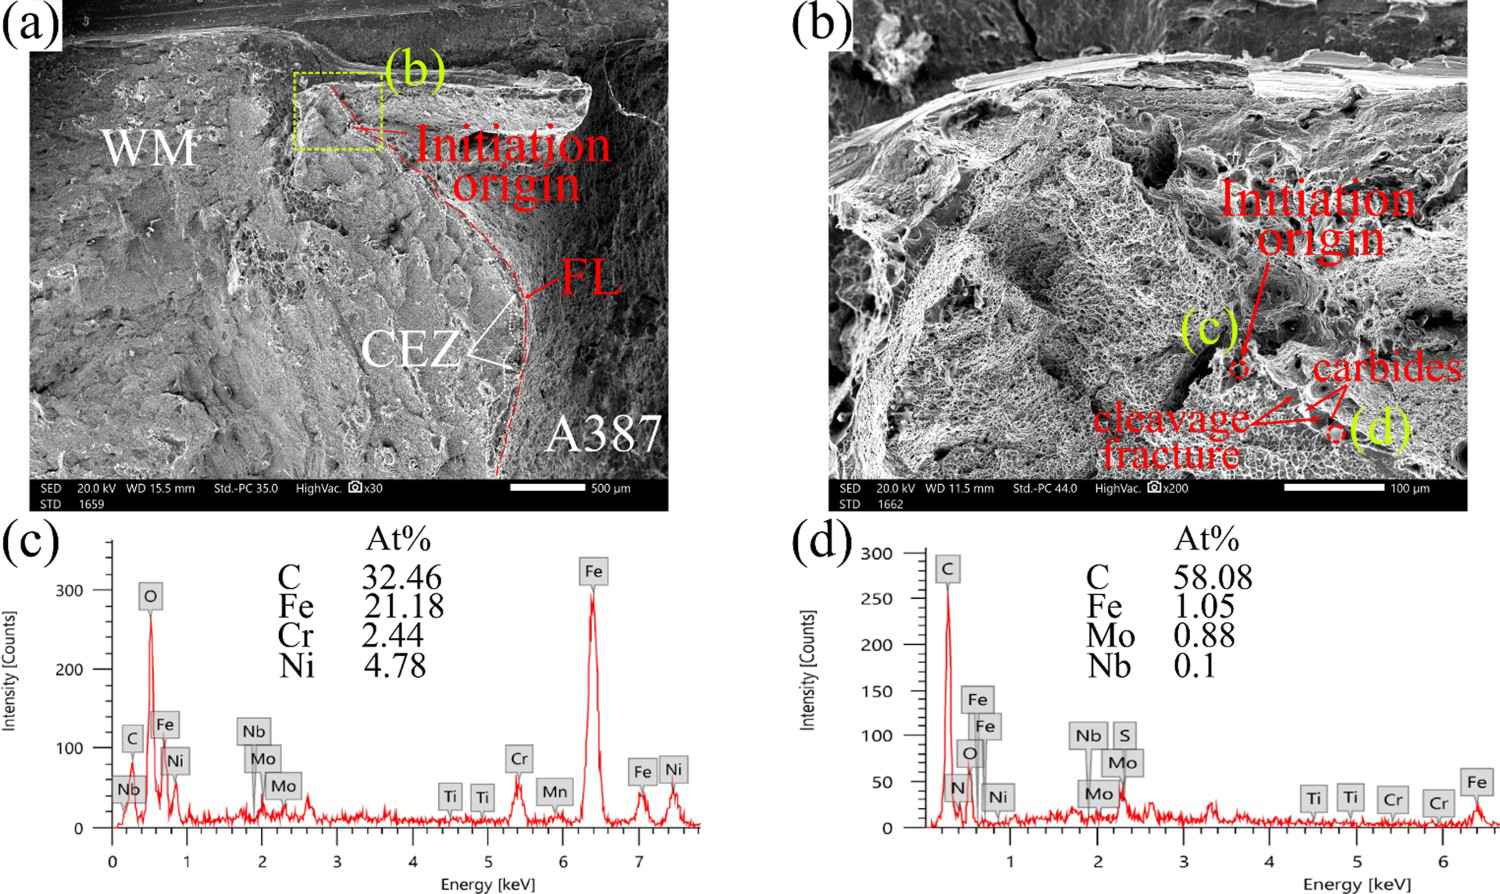
In order to correlate the impact results in Figure 9 with the observations from the fractured surfaces, two of the three criteria for cleavage fracture that were suggested in [17] are discussed below:
εp ≥ εpc for crack nucleation
σyy ≥ σf(f) for propagation of a grain-sized crack
where εp is the plastic strain, εpc is the fracture plastic strain, σyy is the normal tensile stress, and σf(f) is the local cleavage fracture stress for a grain-sized crack which is defined by the formula:
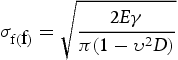
Based on the above, a reasonable justification of the impact results for the TA specimens given in Figure 9 can be obtained. Fracture of RJ1, RJ2, and RJ3 specimens originated at these locations (i.e. coarse grains) because σf(f) is lower at the coarser grain compared with the surrounding relative finer grains. Also, the hard structure of the fracture origins of both RJ1 and RJ2 facilitated fracture since deterioration of εpc due to carbides and hard phases makes crack nucleation easier [18]. RJ2 depicted the lowest impact results (69 J) due to the combined action of both WM coarse grain size, confirmed by microstructure in Figure 5(e) and the fractured surface in Figure 13(a), and the hard structure created by carbon migration in the vicinity of the FL. Similarly, RJ1 depicted low impact results (79 J). These results were higher than that of RJ2 due to fine grain size of the fracture origin (53 µm) and of the WM as confirmed by the microstructure in Figure 5(d) and fractured surface in Figure 12(a). On the other hand, RJ1 impact results were lower than that of RJ3, despite the fine grain structure of WM compared with RJ3 (confirmed by the microstructure in Figure 5(d,f)). This can be justified by the relative absence of hard structure and carbides at the vicinity of the fracture origin of RJ3 as confirmed by Figure 14.
Thus, in addition to the coarse grain structure, the formation of a CEZ, comprising areas of brittle structure, may cause a significant decrease in the impact properties. This is evident in the findings of this study, since fracture of RJ1 and RJ2 (lowest impact results) was originated in the vicinity of the CEZ. This is back to the utilisation of the conventional welding electrodes (Inconel 112 and Inconel 182 employed for RJ1 and RJ2, respectively) that failed to block carbon migration across the FL, leading to the formation of a relatively wide and uniform CEZ. On the other hand, the fracture of the RJ3 specimen originated far from the FL at a location where carbides and brittle structures are relatively absent. This is partially due to the limited CEZ created in RJ3 (see Figure 14(a)), since the employed Nickel-141 significantly succeeded to mitigate carbon migration, limit the growth of the CEZ, and consequently improved the impact properties.
Conclusion
The use of Nickel-141 as a buffer layer successfully lowers the carbon activity gradient, impedes the migration of carbon, and consequently resists the formation and growth of the CDZ and CEZ. The impact properties of RJ3, prepared by Nickel-141 as a buffer layer, were significantly improved, showing an AAE higher by 18.5% than that of RJ1, utilised Inconel 112, and by 28.8% than that of RJ2, utilised Inconel 182. CEZ may partially cause a significant decrease in the impact properties of DWJs. The use of the Nickel-141 buffer layer showed a more desirable micro-hardness profile with narrow hard/soft zones adjacent to the FL compared with Inconel 112 and Inconel 182.
Footnotes
Disclosure statement
No potential conflict of interest was reported by the author(s).