
Abstract
The effect of cooling rate on the solidification behaviour of austenitic stainless steels during high energy density welding and directed energy deposition (DED) has been reviewed. Precedent studies demonstrated the confinement of austenite–ferrite duplex region and the susceptibility of specific alloy compositions on the Schaeffler diagram to alteration of solidification mode at high cooling rates during the high energy density welding. Meanwhile, mitigated cooling conditions have dominated during the DED process. The instances of microstructural fluctuations owing to cooling rate variation have been compiled. The incorporation of DED steels into the implicated Schaeffler diagrams demonstrated reliable predictions at high cooling rates. The printability of austenitic stainless steels during the DED process has been discussed in terms of solidification cracking susceptibility.
Keywords
Introduction
Metal additive manufacturing (MAM) realises intricate microstructure and property engineering [1–12]. According to ISO/ASTM52900-15 [13], MAM has been classified into two categories: (i) directed energy deposition (DED) and (ii) powder bed fusion (PBF). A laser or electron beam coupled with a wire or powder feeding module generates a melt pool in the DED while fusing a powder bed in the PBF selectively. PBF has been reputed for selective laser melting (SLM) and selective laser sintering (SLS) [14]. In contrast, DED has been introduced as laser engineered net shaping (LENS), laser metal deposition (LMD), direct metal deposition (DMD) and laser powder fusion (LPF) [15,16].
A considerable ratio of MAM concerns stainless steels [17–23]. Solidification behaviour has a significant influence on the printability and properties of additively manufactured stainless steels and has frequently been interpreted in terms of the primary solidifying phases, consequent evolutions, and the attendant phase compositions. Saboori et al. [24] reviewed the effect of solidification parameters on the microstructure and mechanical properties of type 316L 1 stainless steels produced by the DED process. More recently, Astafurov and Astafurova [25] reviewed solidification-driven variations in the phase composition of austenitic stainless steels produced by various MAM processes. A common feature of these processes is a high cooling rate and its variation during additive manufacturing, which manipulates solidification behaviour and results in the variation of solidification cells and dendrites size, ferrite content and microsegregation of alloying elements generally. Therefore, additively manufactured stainless steels are accosted by intriguing manipulation of solidification behaviour at high cooling rates and inevitable microstructural inhomogeneities owing to process-induced and inherent cooling rate variations.
Welding literature progressively describes the solidification behaviour of stainless steels at high cooling rates [26–28], the phase composition effects on the properties of weld metals, such as the beneficial effect of delta-ferrite on the hot cracking susceptibility [29–32], and its deleterious effects on the high-temperature microstructure stability, mechanical properties and corrosion susceptibility [33–37]. Considering many similarities between welding and MAM processes, welding literature has already devised a charter path for MAM progress [38,39]. Regarding the solidification behaviour, Smith et al. [40] applied welding models for studying the solidification microstructure of 304L and 316L steels produced by the DED process. Hwa et al. [41] reported similar cooling rate variation effects in the DED and autogenous laser welding of 316L steel. Nevertheless, an integrated review of the cooling rate effects on the solidification behaviour of stainless steels during welding and additive manufacturing has not been reported yet.
The cooling rate of stainless steels during high energy density welding and additive manufacturing has been estimated either by computation [42,43] or experimentally 2 by measuring cellular or dendritic arms spacing in the solidified microstructure [44]. In general, the cooling rate of austenitic stainless steels varies between 10+2 and 10+5 K s−1 during autogenous, high energy density welding and the DED [44–46]. Based on the typical range of cooling rates, this paper reviews the cooling rate effects on the solidification behaviour of austenitic stainless steels during the high energy density autogenous welding and the laser-based DED.
Solidification mode of stainless steels
The solidification of stainless steels has been categorised into four modes according to the type of the primary phases solidifying from the melt:
mode A (primary austenite with no ferrite solidified from the melt) mode AF (primary austenite with ferrite solidified secondarily from the melt) mode FA (primary ferrite with austenite solidified secondarily from the melt) mode F (primary ferrite with no austenite solidified from the melt).
Suutala et al. [47] first categorised the solidification mode of stainless steel GTA weld metals in three types: A (austenite and austenite–ferrite), B (ferrite–austenite) and C (ferrite). Then, classification into four modes (A, AF, FA, F) was introduced [48]. Katayama et al. [49] classified it into five modes (A, AE, E, FE, F), E denoting the eutectic ferrite–austenite solidification. Elmer [50] referred to the five modes as A, AF, E, FA and F. However, the E mode has not been considered lately while four modes (A, AF, FA, F)
3
have been referred to more extensively. Schematics illustrating the microstructure evolution in accordance with these modes have been presented frequently [28,47,51–54]. The solidification process has widely been studied regarding the Fe–Cr–Ni ternary system [55,56], where pseudo-binary vertical sections of the ternary phase diagram at constant Fe predicted solidification mode and subsequent phase transformations reasonably. Figure 1 shows the solidification modes on the vertical section of the Fe–Cr–Ni phase diagram at 70-wt% Fe [57]. Commercial stainless steels often span the peritectic–eutectic triangle on the pseudo-binary diagram, and alloys of low and high Cr-equivalent (Creq)/Ni-equivalent (Nieq) ratios on either side of isoplete solidify with the formation of austenite and ferrite as the primary solidifying phase, respectively. The partition ratio between austenite and melt is about 0.75 for Cr and 0.95 for Ni thus, melt enriched by Cr and marginally by Ni, which favours ferrite formation at the later stage of the AF mode. However, the partition ratios are displaced in the FA mode mutually; thus Ni enrichment of melt stimulates austenite formation in the later stage of solidification [52].
The solidification mode of stainless steels on the pseudo-binary vertical section of the Fe–Cr–Ni phase diagram at 70-wt% Fe, calculated using Thermocalc. Adopted from [57] under the terms and conditions of the Creative Commons Attribution (CC BY) license, courtesy of MDPI.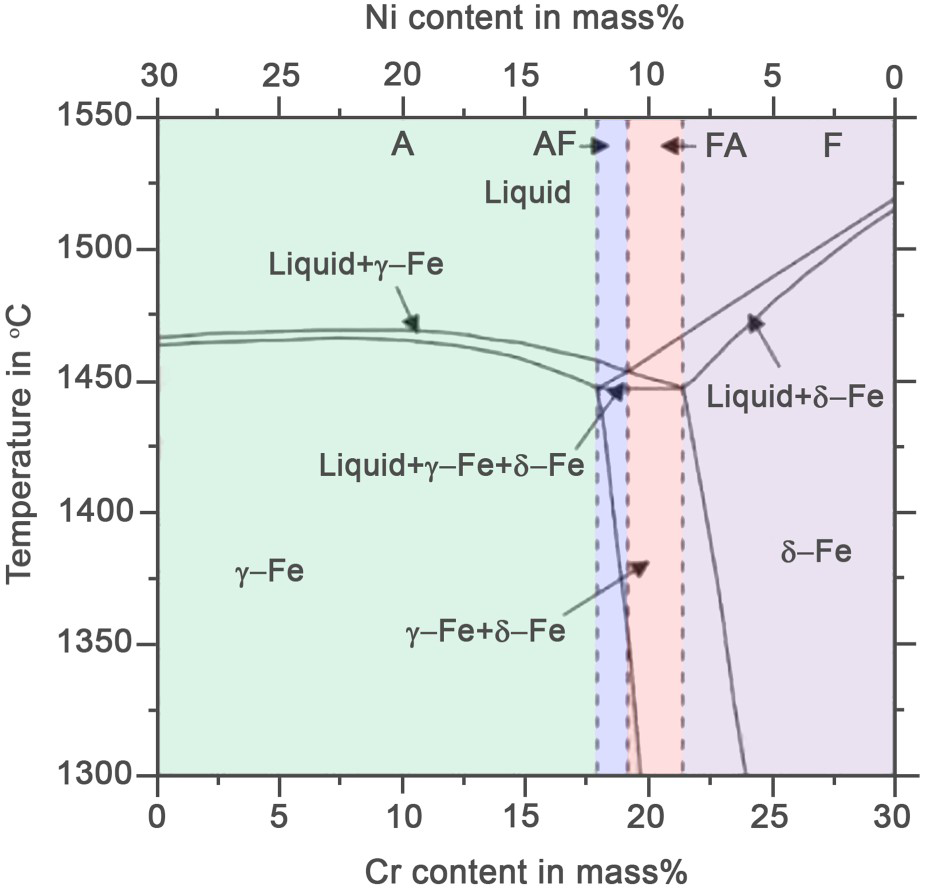
The solidified microstructure of stainless steels encounters subsequent transformation of ferrite into austenite during cooling in the solid state after solidification, depending on the phase composition and cooling condition. Hence, there is no further transformation for fully austenitic microstructure solidified in A mode, but the transformation of ferrite occurs in alloys solidified with AF mode [58–60]. Alloys solidified in FA and F modes contain higher amounts of ferrite thus their transformations occur diversely, which yield microstructures consisting of austenite and distinct types of ferrite, e.g. globular, vermicular, skeletal, lacy, lathy and acicular [61–66]. Transformation of ferrite to Widmanstätten austenite (WA) and massive austenite has also been reported in stainless steel weld metals [67–69].
The solidification mode and microstructure of stainless steel weld metals are conventionally ascertained using the Schaeffler constitution diagram based on Creq and Nieq
4
[70]. Figure 2 shows regions of the different solidification modes and the characteristic microstructures of stainless steels weld metals on the Schaeffler diagram [49]. Other constitution diagrams with modified equations have also been reported [71,72]. According to Suutala et al. [47], the solidification mode and microstructure of stainless steel weld metals can also be ascertained from Creq/Nieq ratio
5
: (i) A/AF mode at Creq/Nieq < 1.48, resulting in austenitic microstructure with ferrite at boundaries, if any, (ii) FA mode at 1.48 < Creq/Nieq < 1.95, resulting in austenite with vermicular and lathy ferrite (LF) residue, (iii) F mode at Creq/Nieq > 1.95, resulting in austenite with lathy structure. The critical ratio for the transition from AF to FA (1.48) increases slightly by increasing the cooling rate during arc welding [48].
Regions of different solidification modes and characteristic microstructures of stainless steels weld metals are presented on the Schaeffler diagram. Solidification mode abbreviations read type A (= mode A): single-phase austenite, type AE (= mode AF): primary austenite with eutectic ferrite–austenite, type FE (= mode FA): primary ferrite with eutectic ferrite–austenite, type F (= mode F): single-phase ferrite. Characteristic microstructure abbreviations (encircled) read FA (fully austenite), IF (intercellular eutectic ferrite), EF (eutectic ferrite), VF (vermicular (skeletal) ferrite), LF, AF (acicular ferrite), WA, FF (fully ferrite). Adopted from [49] with permission from the Welding Research Institute of Osaka University.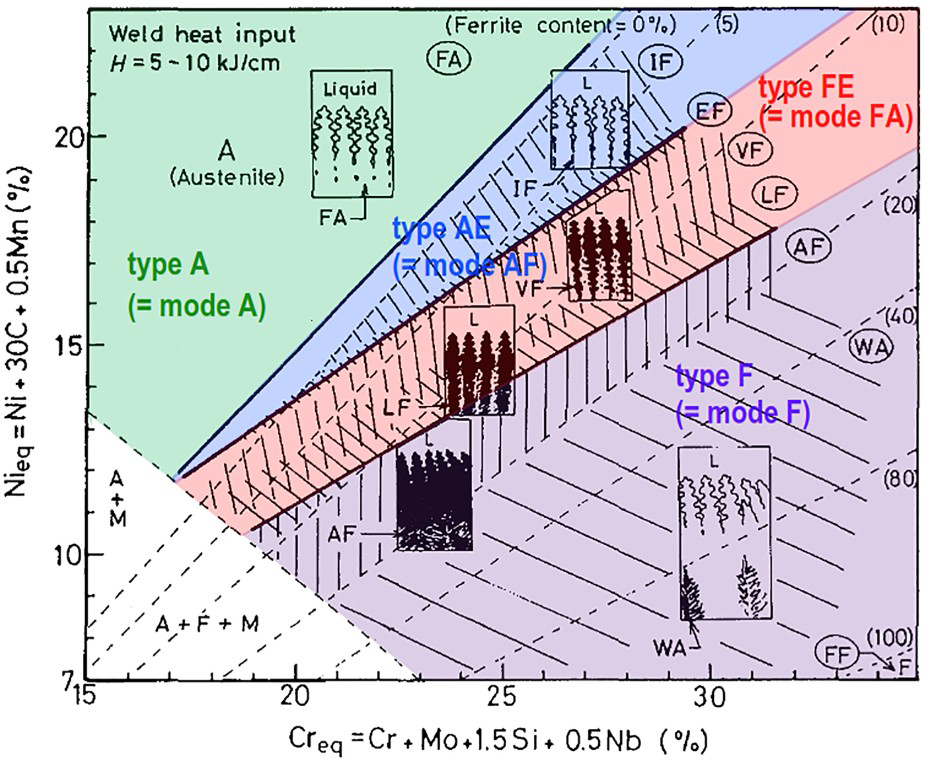
Behaviour of alloy clouds during welding
Katayama and Matsunawa [73] studied the solidification behaviour of more than 30 kinds of Fe–Cr–Ni alloys and commercial stainless steels, e.g. 310S, 304, 316, 347, 321 and 309S, with a variety of equivalencies and the cooling rates during (i) autogenous pulsed laser welding with an energy input of 5–37 J pulse−1 (Nd:YAG: 200 W, 1, 2 and 3.6 ms pulse durations, in air or Ar atmosphere), (ii) autogenous laser welding (continuous wave (CW) CO2: 500–2000 W, 8.33–250 mm s−1) and (iii) autogenous GTA welding (100 A, 12.5 V, 2.5 mm s−1). Pulsed laser welds of 310S steel (Creq = 25.94, Nieq = 22.11, Creq/Nieq = 1.17) presented fully austenitic cellular microstructure with PCAS decreasing by increasing cooling rate. Based on the measured PCAS (0.5–2.2 µm), the cooling rate was estimated to be about 5 × 10⁴–5 × 10⁵ K s−1. Pulsed laser welds of 304 steel (Creq = 18.84, Nieq = 11.14, Creq/Nieq = 1.69) presented fully austenitic cellular microstructure, in contrast to a GTA weld metal which presented 5 vol.-% skeletal ferrite. Ferrite content decreased from 4.0 vol.-% to 0.4 vol.-% by increasing the cooling rate from 3 × 10³ to 5 × 10⁴ K s−1 during CW CO2 laser welding. Figure 3 demonstrates (a) solidification microstructures based on metallography and X-ray diffraction (XRD) and (b) presumed solidification modes at a cooling rate of 2 × 10⁵ K s−1 for pulsed laser-welded alloys. Alloys showing 8 vol.-% ferrite on the Schaeffler diagram became fully austenitic, while alloys of higher than 20–30 vol.-% ferrite became fully ferritic (see red lines). Hence austenite–ferrite (duplex) region with FA and especially AF modes was narrowed. Alteration of FA mode to A/AF mode by increasing cooling rate from 220 to 1550 K s−1 during GTA was demonstrated for an alloy of Creq = 20.6, Nieq = 14.8, Creq/Nieq = 1.39 and so for 304 steel [73].
Fe–Ni–Cr alloys and commercial stainless steels studied by Katayama and Matsunawa are presented on the Schaeffler diagram: (a) identified microstructures and (b) presumed solidification mode at a cooling rate of 2 × 10⁵ K s−1. Fine and coarse dashed lines represent the Schaeffler ferrite contours and solidification mode regions for GTA, respectively. Adopted from [73] with permission from the Laser Institute of America.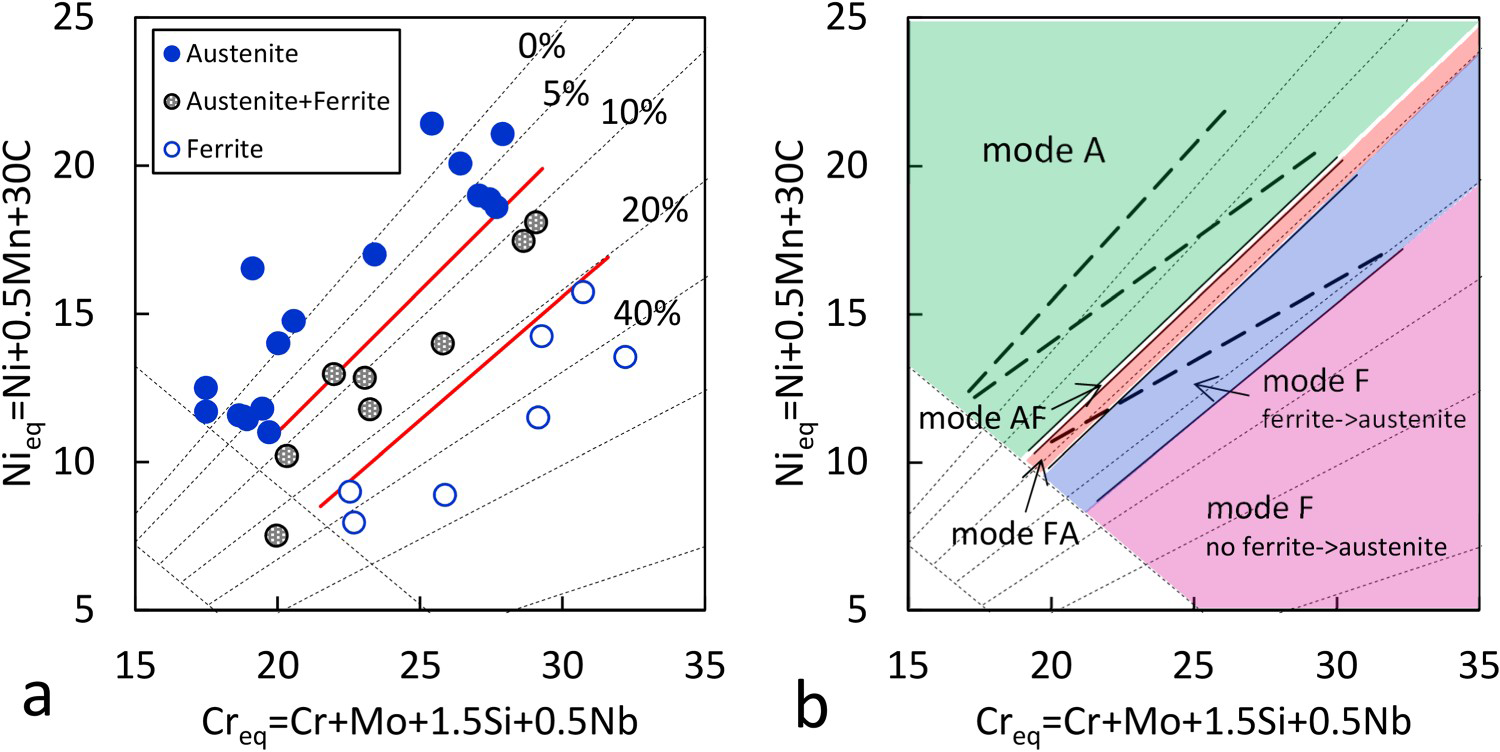
Lippold [74] and Lienet and Lippold [75] reported the solidification behaviour of 35 kinds of commercial stainless steels in the Creq/Nieq range from 1.41 to 2.08, autogenously welded by pulsed laser of 8–17.5 J pulse−1 energy input (Nd:YAG: 80 and 140 W, 8 Hz, 8 ms pulse duration, 1.6 mm s−1, in He gas atmosphere). An average cooling rate of 3 × 10⁵ K s−1 was determined based on the PDAS measurement. Figure 4 shows the solidification mode of the studied steels on the Schaeffler diagram. Steels consisting of less than about 3 vol.-% and more than about 7 vol.-% ferrite on the Schaeffler diagram solidified in A and F modes, respectively. Many of the steels presented mixed modes but in a narrowed region. Based on the Hammar–Svensson (HS) equivalencies
6
, a transition in the solidification mode from AF to FA was found in the Creq/Nieq range from 1.59 to 1.69, which indicates a further increase of the critical Creq/Nieq for AF to FA transition in pulsed laser welding in comparison to the value of 1.55 determined for GTA welding [48].
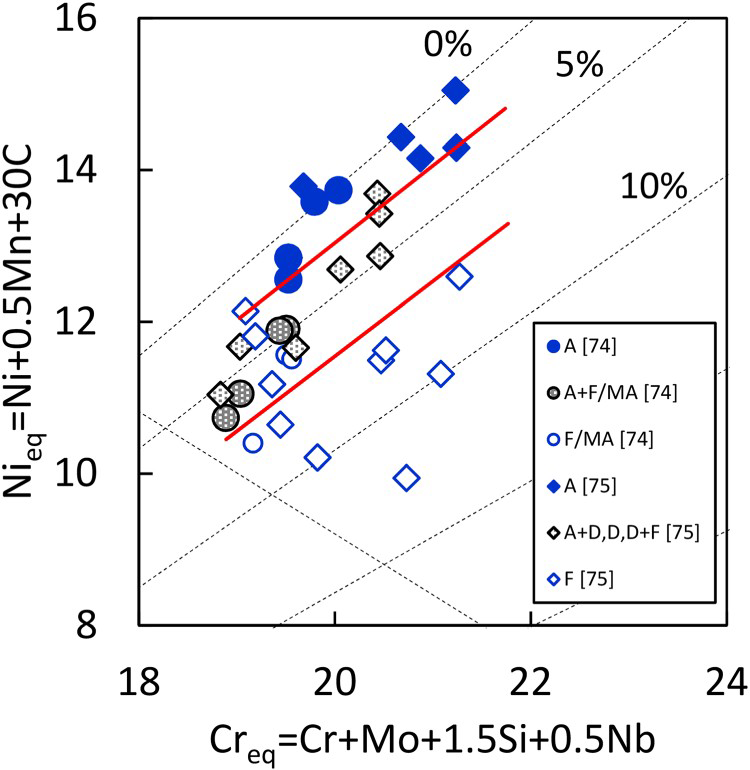
Berjemo et al. [76] applied autogenous laser welding with energy inputs of 75 and 110 J mm−1 (Ytterbium fiber CW: 750 W–10 mm s−1, 2200 W–20 mm s−1) on 17 kinds of stainless steels in the Creq/Nieq range from 1.22 to 1.88 (HS eqs: 1.23–2.04) and Creq + Nieq of about 35% and 45%. Table 1 shows cooling rates determined by the SDAS measurement for 304 steel. The solidification mode of the studied weld metals is shown in Figure 5. Like the aforementioned laser welding, single-phase austenite and single-phase ferrite regions developed at the expense of duplex microstructures.
Solidification mode of commercial stainless steels studied by Berjemo et al. is presented on the Schaeffler diagram. Adopted from tabulated data in [76] with permission from Elsevier. Cooling rates estimated for laser-welded 304 steels based on SDAS measurement. Adopted from [76] with permission from Elsevier.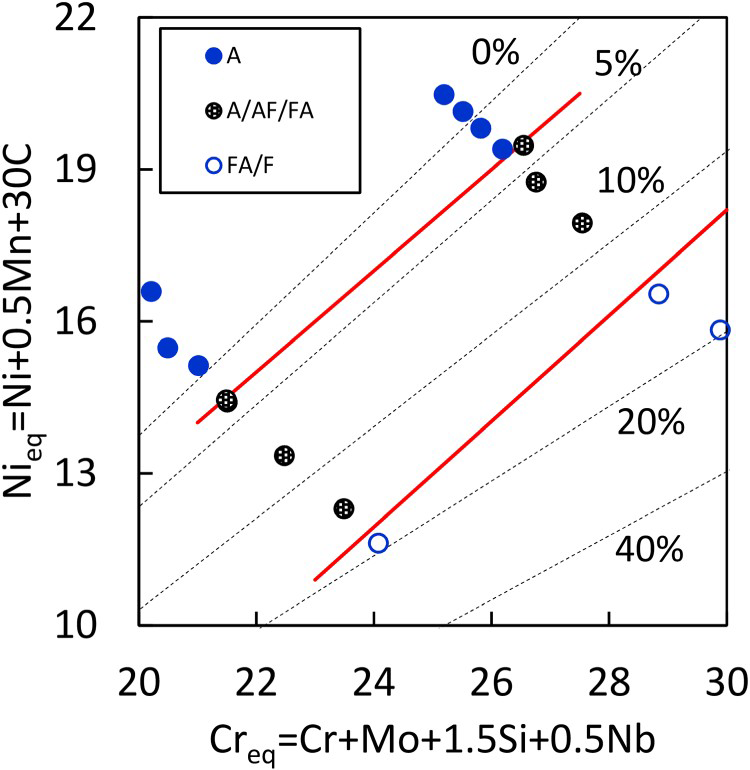
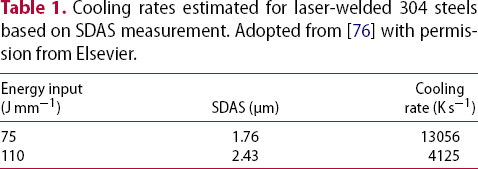
David et al. [77] studied cooling rate variation effects on the microstructure of 15 kinds of commercial stainless steels during autogenous pulsed laser welding with different energy inputs (Nd:YAG: 110–120 W, 190–200 W, 1 ms pulse duration, 2.1–42.3 mm s−1, in Ar atmosphere). Figure 6 shows the studied steels on the Schaeffler diagram. For each type, two heats of different compositions (A and B) within the standard range were studied. In types 304, 308 and 347 steels, ferrite decreased gradually with increasing cooling rate to approach a fully austenitic microstructure at the highest cooling rate. In the type 309 steels, ferrite initially increased then decreased with no transition to a fully austenitic microstructure. In the type 312 steels, ferrite increased with increasing cooling rate to a fully ferritic microstructure at the highest cooling rate. Different heats of 310 steel solidified in A mode whatever the cooling rate, but significant microstructural variations occurred among 316 welds. Implications for Scheffler diagrams were presented at high cooling rates.
Commercial stainless steels studied by David et al. are presented on the Schaeffler diagram. Adopted from [77] with permission from the American Welding Society.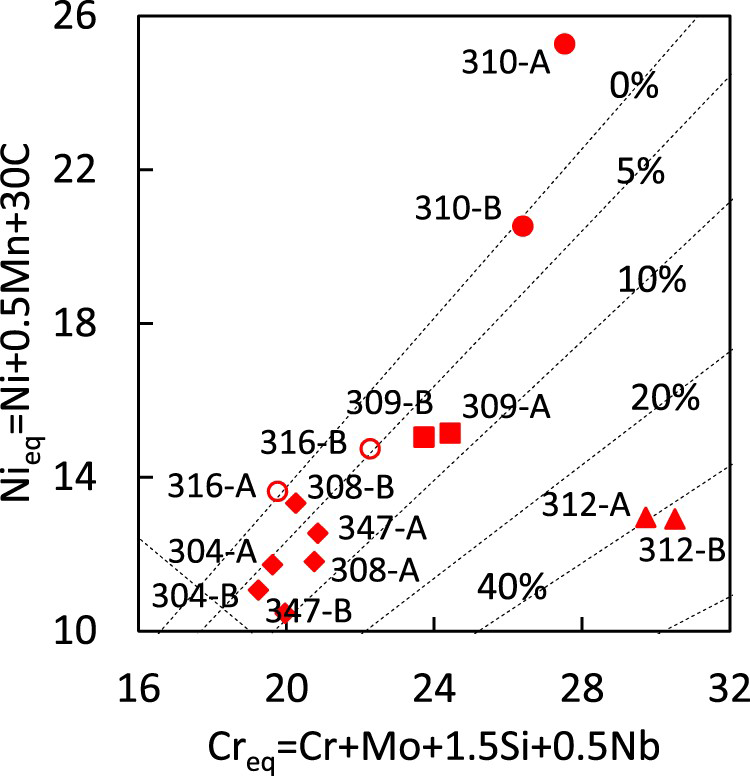
Behaviour of selected commercial stainless steels
Vitek et al. [78] applied autogenous laser welding (CW CO2: 9000 W, 13, at 25 and 63 mm s−1, in He gas atmosphere) on three types of commercial stainless steels (308, 310 and 312). Figure 7 shows the approximate compositions of these steels on a vertical section of the Fe–Cr–Ni phase diagram. The 312 (Creq = 30.83, Nieq = 9.85, Creq/Nieq = 3.13) and 308 (Creq = 21.66, Nieq = 13.21, Creq/Nieq = 1.64) steels solidify with F and FA modes, respectively, but acquire fully austenitic and duplex ferritic–austenitic microstructures according to phase diagram, while presented duplex ferritic–austenitic microstructures with different ferrite contents after conventional arc welding. The 310 steel (Creq = 27.95, Nieq = 25.62, Creq/Nieq = 1.09) solidifies in A mode with fully austenitic microstructure at room temperature according to the phase diagram, which retained a fully austenitic microstructure after conventional arc welding. The cooling rate was assumed to vary with scan speed and the intrinsic cooling condition. Higher scan speed provides a higher cooling rate and vice versa. The melt cools at the highest rate in the root and the lowest rate in the crown. The 312 steel showed a fully ferritic microstructure at the highest cooling rate and a duplex ferritic–austenitic microstructure at the lowest cooling rate. It was concluded that the solidification mode is promoted from FA to F at the highest cooling rate, and the transformation of ferrite to austenite is suppressed subsequently. The solidification mode of 308 steel was altered at the highest cooling rate as rationalised by a fully austenitic microstructure at the highest cooling rate and a duplex austenitic–ferritic microstructure at the lowest cooling rate. Partitioning of Cr and Ni decreased remarkably by increasing the cooling rate, which rendered the partitionless crystallisation of austenite at the highest cooling rate. The 310 steel showed a fully austenitic microstructure at all cooling rates.
The approximate composition of the commercial stainless steels studied by Vitek et al. Adopted from [78] with permission from Springer.
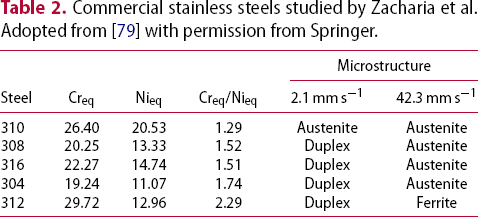
Commercial stainless steels studied by Zacharia et al. Adopted from [79] with permission from Springer.
Molian [80] applied autogenous laser welding (CW CO2: 1200 W, 13, 21.2 mm s−1, in He–Ar gas atmosphere) on a 304 steel. A fully austenitic structure with high dislocation density and negligible microsegregation was found. Zambon and Bonollo [81] reported laser welding (CW CO2:7000 W, 38.3 mm s−1) of 304 (Creq = 19.24, Nieq = 10.82, Creq/Nieq = 1.78) and 316 (Creq = 19.00, Nieq = 12.56, Creq/Nieq = 1.51) steels. Based on the observation of austenite with 1–2 vol.-% ferrite, solidification mode of 304 and 316 steels was, respectively, assumed FA and AF a priori. Akgun and Inal [82] carried out autogenous laser welding (CW CO2: 5000 W, 7 mm s−1, in Ar atmosphere) on 304L steel (Creq = 19.48, Nieq = 9.51, Creq/Nieq = 2.05). A cooling rate in the 104–105 K s−1 range was determined based on the SDAS measurement. XRD identified austenite with ferrite in the range of 4.3–9.9 vol.-%, increasing with increasing the distance from the surface. Cooling rate variation was assumed to alter ferrite content, but the addition of nitrogen to shielding gas was unlikely to do so. Based on microstructure and thermodynamic assessment, the FA mode was rationalised. El-Batahgy [83] conducted autogenous laser welding with energy input in the range of 40–480 J mm−1 (CW CO2, 2000–5000 W, 8.3-50 mm s−1) on 304L(Creq = 18.93, Nieq = 10.1, Creq/Nieq = 1.87), 316L (Creq = 19.35, Nieq = 12.05, Creq/Nieq = 1.61) and 347 (Creq = 18.73, Nieq = 11.80, Creq/Nieq = 1.59) steels. The microstructure of all laser welds was austenite with a few percent of ferrite, resulting from primary ferrite mode presumably.
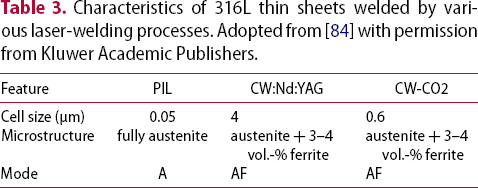
Characteristics of 316L thin sheets welded by various laser-welding processes. Adopted from [84] with permission from Kluwer Academic Publishers.
McPherson et al. [85] reported microstructure of 316LN steel (Creq = 20.99, Nieq = 12.52, Creq/Nieq =1.68), autogenously laser welded (Nd:YAG: 7.6 mm, 3500 W, 10 mm s−1, in He atmosphere). A mixture of cellular austenite with ferrite and austenite with LF was identified, in addition to the nonequilibrium Cr2N phase formed owing to a high cooling rate. Celen et al. [86] applied pulsed laser welding (Nd:YAG: 769–200 W, 5.8–7.7 mm s−1) on thin sheets of 304 steel (Creq = 21.13, Nieq = 15.40, Creq/Nieq = 1.37), and reported fully austenitic microstructure. Kell et al. [87] applied electron backscattering diffraction (EBSD) to study the microstructure of 316L sheets, autogenously laser welded (Coherent CO2: 125–1000 W, 0.017–0.1 mm s−1, under compressed air flow). AF solidification mode was assumed a priori. EBSD revealed a fully austenitic microstructure and a single crystallographic orientation of a cell colony. Energy-dispersive spectroscopy (EDS) indicated Cr, Mo, Mn, S and P microsegregation at cell boundaries but Ni, O and Si were homogeneously distributed. However, ferrite was identified when a uniformly distributed, square beam was applied. Late studies on dissimilar alloys and high-power lasers applied for welding the thick plates, beyond the scope of this paper, are no longer considered.
Behaviour of Fe–Cr–Ni model alloys
Elmer et al. [88] studied the cooling rate effects on the solidification mode of seven high-purity Fe–Cr–Ni alloys, autogenously welded by electron beam (2000 W, 6.3–5000 mm s−1). Figure 8 shows the approximate compositions of their alloys in a vertical section of the Fe–Cr–Ni phase diagram. A high cooling rate stimulated A mode in the hypereutectic alloys (1–3) with Creq/Nieq in the range from 1.15 to 1.51, and F mode in the hypoeutectic alloys (5–7) with Creq/Nieq in the range from 1.84 to 2.18. Solidification of the nearly eutectic alloy (4) with a Creq/Nieq = 1.60 evolved from FA mode to AF mode by increasing the cooling rate. The development of solidification mode from competitive epitaxial growths of austenite and ferrite at the melt periphery has been explained. The hypereutectic alloy (1) with a Creq/Nieq = 1.15 solidified with the epitaxial growth of austenite at both low and high cooling rates, hence realising A mode always. Solidification of the hypoeutectic alloy (7) with Creq/Nieq = 2.18 initiated with the epitaxial growth of both ferrite and austenite at the melt periphery, but ferrite dominated immediately. The nearly eutectic alloy (4) provided a duplex (ferrite–austenite) microstructure at the melt periphery, and solidification initiated with the epitaxial growth of both austenite and ferrite. However, the preliminary AF cells evolved into the FA cells within a few tens of micrometers at the lower cooling rate while the AF cells dominated through at a higher cooling rate. Consistent with those transitions, Inoue et al. [89] reported that the preliminary epitaxial growth of austenite is followed by ferrite nucleation owing to Cr enrichment in the melt hereinafter, ferrite continues to grow as a primary solidifying phase. A reverse FA to AF transition occurred by accelerated growth of austenite continuously.
The approximate composition of the alloys studied by Elmer et al. with Creq/Nieq ratios of 1.15 (1), 1.39 (2), 1.51 (3), 1.60 (4), 1.84 (5), 2.01 (6) and 2.18 (7). Adopted from [88] with permission from Springer.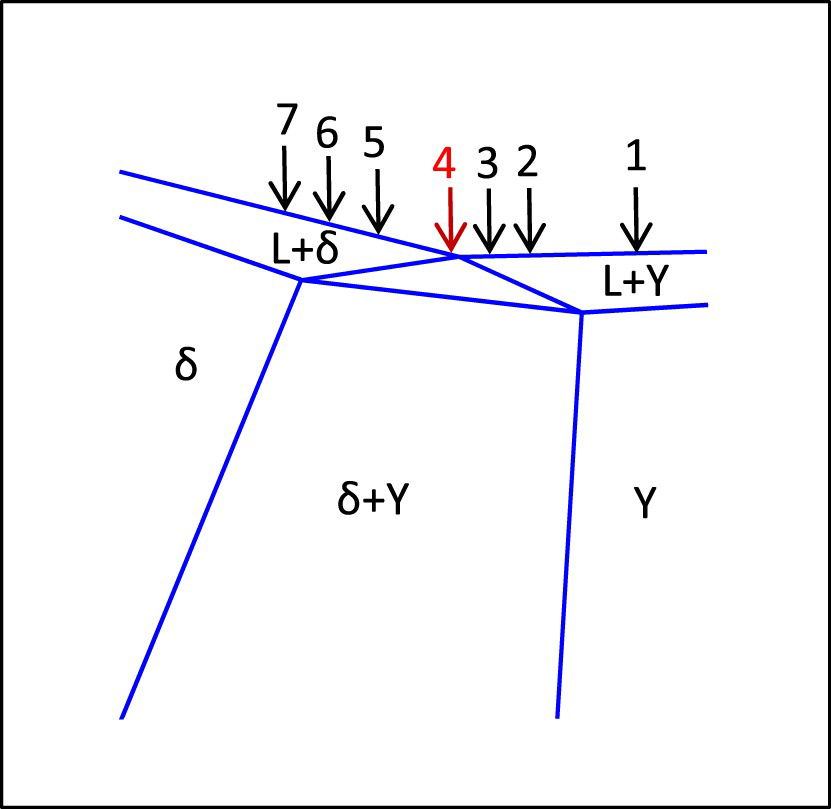
Brooks et al. [90] reported cooling rate effects on the solidification mode and microsegregation of alloying elements in the autogenous high energy density (laser and electron beams) weld overlays on GTA weld metal of three Fe–Cr–Ni alloys. Figure 9 represents the solidification modes and microstructures of the laser weld overlays and GTA weld metals. Both laser and electron beams and the different scan speeds produced similar microstructures. All studied alloys solidified in FA mode during GTA welding, consisting of austenite and skeletal ferrite. A high cooling rate altered the solidification mode for an alloy of Creq/Nieq
7
= 1.51 from FA mode to A mode in the high energy density weld (HEDW) metals, representing a cellular austenitic structure with strong Cr segregation at cell boundaries. There was no alteration of FA mode for an alloy of Creq/Nieq = 1.68, but refined skeletal ferrite was retained at the cell cores with strong Cr and Ni microsegregation. However, solidification mode promoted to F mode in an alloy of Creq/Nieq = 1.85, consisting of a relatively homogeneous austenitic microstructure which was assumed to result from the massive transformation of ferrite to austenite in the solid state.
Microstructure and solidification mode of the GTA and HEDW overlays: (a) Fe–21.1Cr–14.2Ni alloy (Creq/Nieq = 1.51); (b) Fe–21.9Cr–13.0Ni alloy (Creq/Nieq = 1.68); (c) Fe–22.8Cr–11.9Ni alloy (Creq/Nieq = 1.85). Si = 0.01; C = 0.006–0.016; N = 0.001–0.004. Reproduced from [90] with permission from Springer.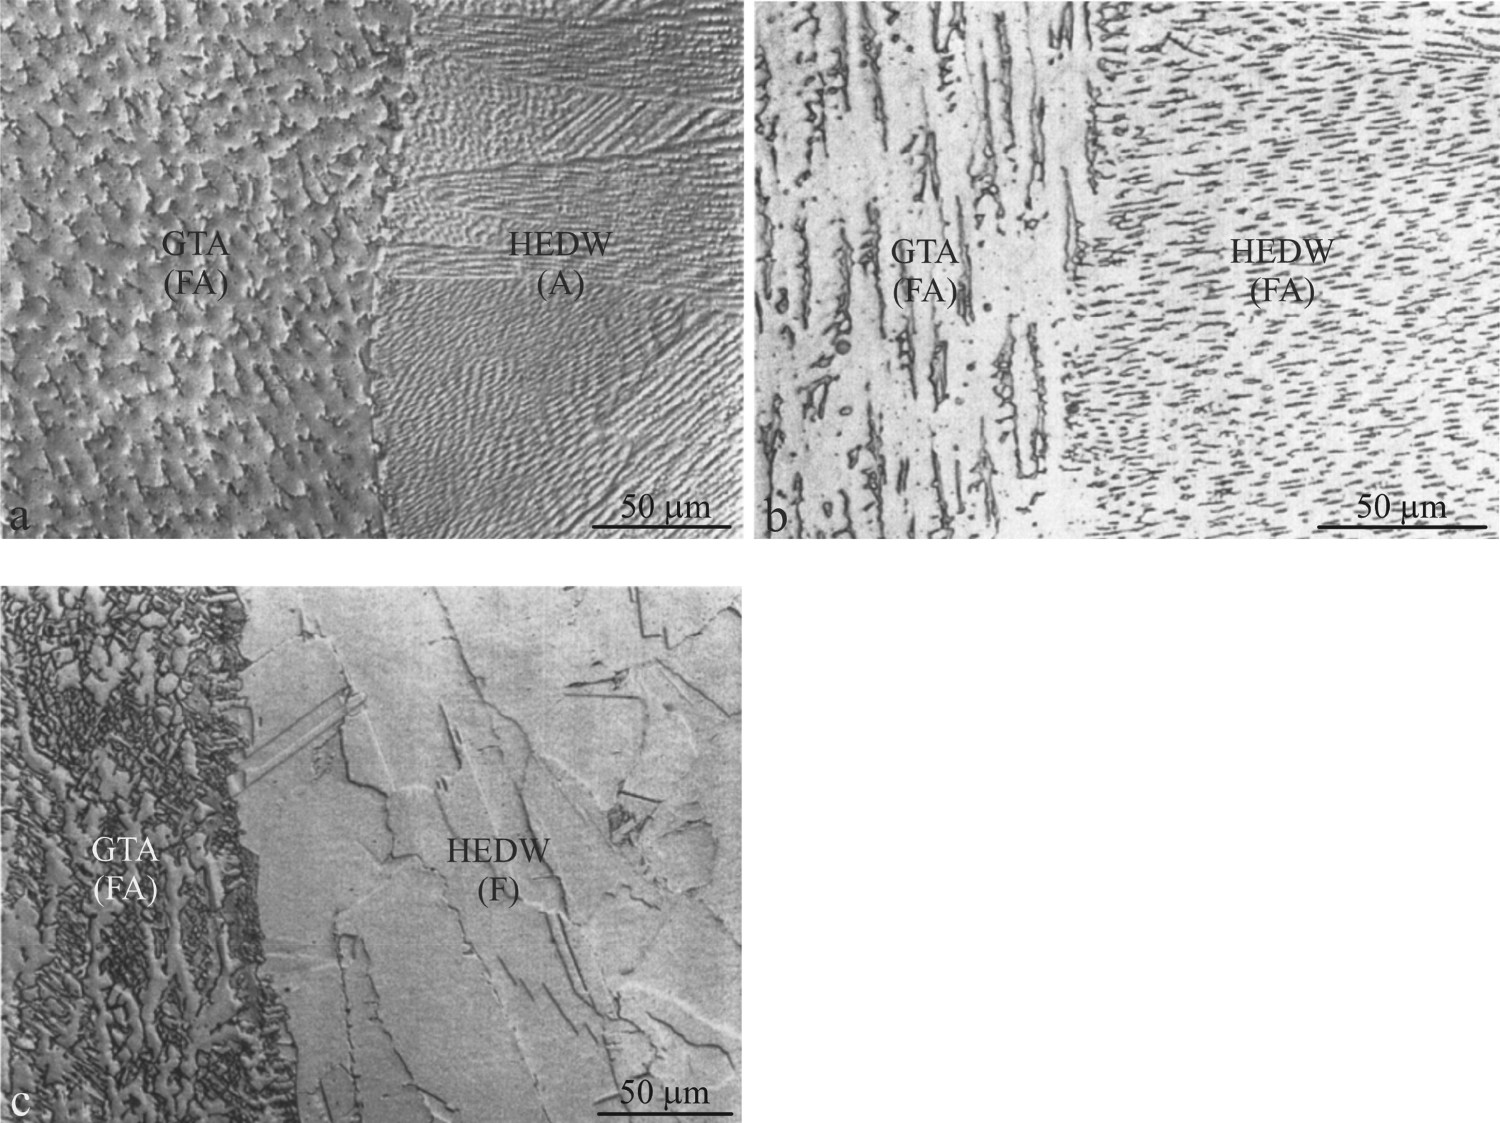
Selection of solidification mode
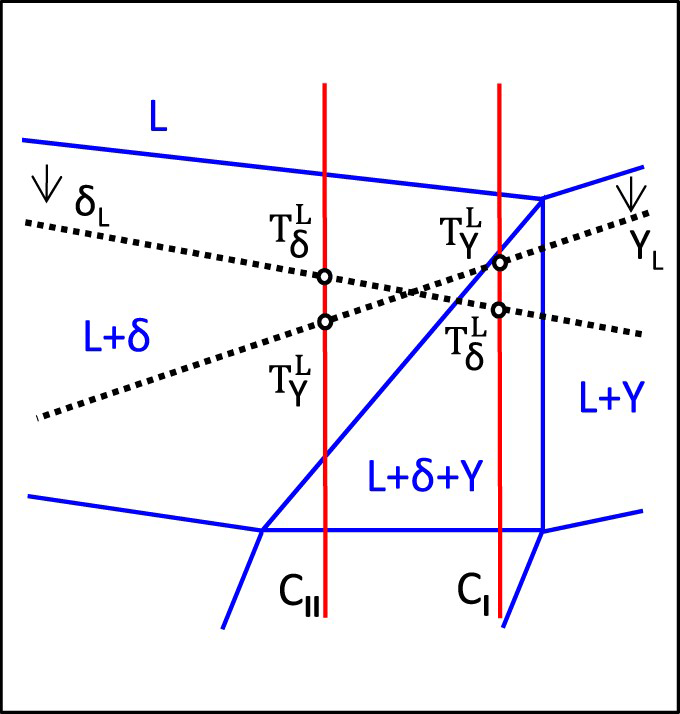
Siefert and David [28] categorised three models for modification of stainless steel weld metals solidification at high cooling rates, being quoted by theme: (i) partitionless crystallisation from undercooled melt associated with the kinetic predominance of austenite; (ii) dendrite tip undercooling down to the extended austenite liquidus temperature at rapid solidification and (iii) massive transformation of primary ferrite to austenite in the solid state during cooling after solidification. Vitek et al. [78] first proposed that a high undercooling realises partitionless crystallisation of both ferrite and austenite, based on comparable T0 temperatures of austenite and ferrite in near-eutectic stainless steels with FA mode. Then, austenite predominates kinetically in the subsequent growth stage. A similar argument was proposed by Akgun and Inal [82], which applies a thermodynamic model to calculate T0 temperatures and indicates thermodynamic stability of ferrite over austenite in a 304L steel solidifying with FA mode. Consistent with the second model, Brooks et al. [90] attributed austenite predominance to dendrite tip undercooling, comparing ferrite liquidus temperature with extended austenite liquidus temperature for an undercooled near-eutectic alloy solidifying with FA mode. Taking the melt undercooling into account, Figure 10 shows further explanation. A near-eutectic alloy (CI) solidifies with FA mode under near-equilibrium condition, whereas sufficient undercooling at the dendrite tip realises austenite crystallisation before ferrite, based on the undercooled liquidus (dotted lines). This realises the alteration of solidification mode from FA to AF mode. In contrast, alloy CII solidifies with ferrite as the primarily solidifying phase at the same condition.
The competitive formation of austenite and ferrite has experimentally been studied in the levitated and chill-cast Fe–Cr–Ni alloy droplets solidified at high cooling rates. Based on ferrite prevalence in the smaller and more rapidly cooled particles, preferred homogeneous nucleation of ferrite at high undercooling was assumed for alloys that solidify with austenite as the primary phase under near-equilibrium conditions [92,93]. This fact was confirmed by the recalescence phenomenon [52,94,95] and thermodynamic assessments subsequently [96–99]. Mizukami et al. [100] measured melt undercooling at the surface of 304 steel droplets (Creq/Nieq = 1.81) chill-cast at various cooling rates. The maximum initial undercooling increased with increasing the cooling rate. The steel solidified with primary ferrite mode under near-equilibrium conditions. At a high cooling rate, however, solidification initiated with the formation of cellular austenite at the surface and evolved to dendritic ferrite at the interior subsequently. The phase selection was rationalised by computing dendrite tip temperature for each phase, assuming the steady-state dendritic growth into the undercooled melt. With a great number of nucleation sites and a criterion that the one observed has a higher tip temperature, a kinetical predominance of austenite at a high cooling rate was rationalised. Similarly, Lippold [74] justified that a high solidification rate inherent to weld metal decreases dendrite tip radius and tip temperature, thus altering undercooling at the dendrite tip based on the dendrite growth theory. The dendrite tip temperature of ferrite decreases more rapidly than austenite with an increasing solidification rate. Assuming that the preferred primary phase will be that with a higher dendrite tip temperature as a phase selection criterion, predominance of austenite over ferrite above a critical solidification (cooling) rate was interpreted. The value of the critical solidification (cooling) rate for transition to primary austenite increases with increasing Creq/Nieq ratio.
The dendrite tip temperature has been computed as an interface response function according to dendrite growth theory [101]. This function has been applied for the construction of solidification microstructure selection maps in laser welds generally [102], and specifically for the prediction of the transition from ferrite to austenite in stainless steels laser welds, as well as for the construction of their solidification microstructure selection maps at various solidification (cooling) rates [103–105]. An increase in the solidification rate is shown to promote the transition to primary austenite at a higher Creq/Nieq ratio.
Solidification mode of stainless steels produced by the DED
Table 4 summarises the solidification mode and resultant microstructure of some austenitic stainless steels produced by the DED process under different conditions [40,106–122]. In these studies, a precise determination of microstructure constituents, e.g. austenite, ferrite and second-phase precipitates, has been well appreciated. However, solidification mode has been chiefly ascertained based on the alloy composition on the Schaeffler diagrams a priori. In a few studies, the solidification mode has been adequately recognised based on the characteristic concentration profiles of Cr and Ni across cells. For instance, Figure 11 represents the concentration profiles of Cr and Ni in the solidified microstructure of two DED stainless steel blocks: (a) 316L steel solidified in AF mode and (b) 304L steel solidified in FA mode. There has been no ferrite at cell boundaries by random. Therefore, these profiles instead indicate A and F modes. Concentration profiles of Ni and Cr change abruptly when the microanalyzer beam captures a retained ferrite particle at the boundary. Characteristic microsegregation profiles of Cr and Ni for unambiguous recognition of the different solidification modes have already been deserved in welding literature [123]. For the circumstances of no discernible concentration profiles, one may apply a criterion recommended by Iamboliev et al. [124] for the identification of FA mode from AF mode. In pulsed laser spot welds of 304L steel solidified in FA mode, many epitaxial grains formed on a single partially melted grain at the melt periphery with some austenite < 001 > directions varying along cell boundaries, in contrast to 310S steel solidified in AF mode.
Cr and Ni concentration profiles across solidification cells with no ferrite at the cell boundaries located at the Cr maxima: (a) 316L steel consistent to AF mode and (b) 304L steel consistent to FA mode. Reproduced from [40] with permission from Springer. Solidification mode and microstructure of selected DED stainless steels
a
. Solidification mode has been taken into account in these selected studies. Stainless steel substrate at ambient temperature and Ar inert gas atmosphere have been used, unless otherwise specified. Constitution diagrams and equivalencies, e.g. Schaeffler, DeLong, WRC1992, have been applied for predicting solidification mode a priori. Characteristic concentration profiles have been applied (Figure 11), which enables the unambiguous determination of solidification mode.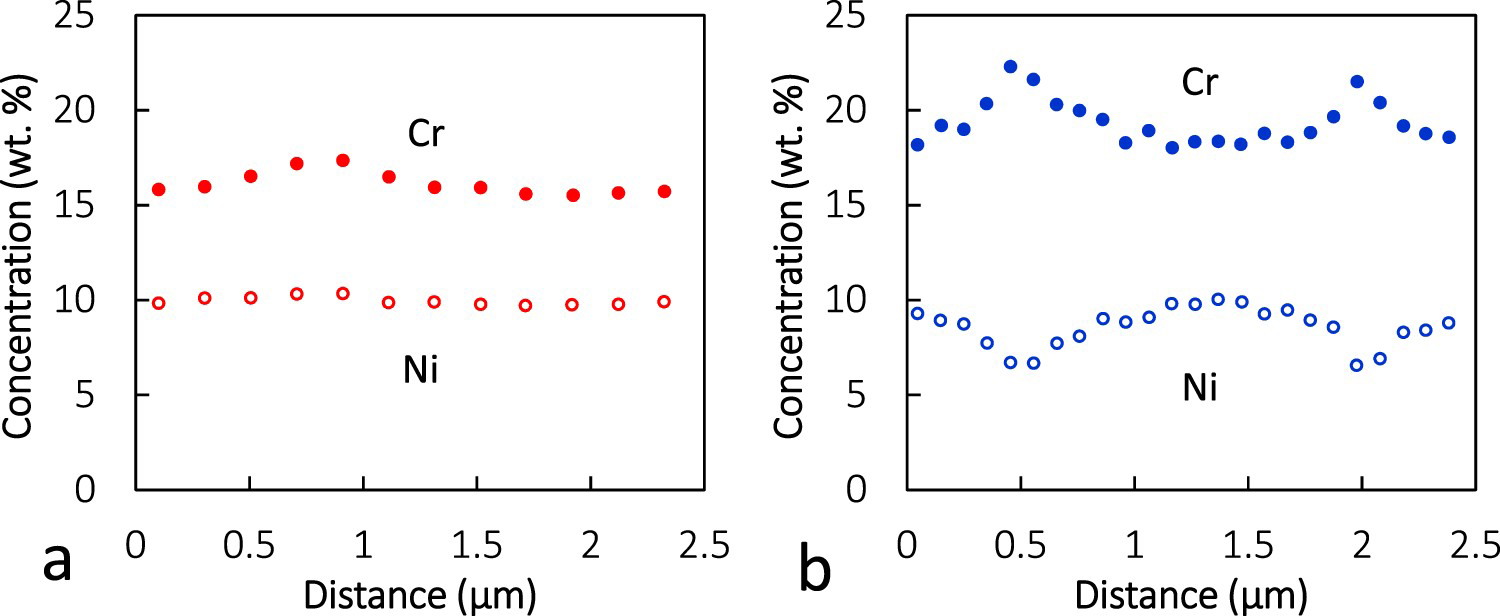

Brooks et al. [91] pioneered the first comparison of the solidification behaviour of the DED builds with autogenous laser welds for 304L steels. According to the approximate compositions presented on the pseudo-binary phase diagram (Figure 12), both alloys solidify with ferrite as the primary phase under near-equilibrium conditions. However, alloy #2 (Creq/Nieq = 1.53) solidified with austenite as the primary phase without residual ferrite during laser welding. Alloy #3 (Creq/Nieq = 1.78) represented refined austenite grains without residual ferrite in the laser welds but likely solidified with F mode and then transformed to massive austenite in the solid state. The solidification microstructures of DED blocks of both alloys were more complicated than laser welding counterparts by varying amounts of residual ferrite. A DED block of alloy #2 consisted of residual ferrite with vermicular and acicular morphologies along with cell cores, resulting from FA mode and subsequent transformation in the solid state. Scanning transmission electron microscopy (STEM)-EDS analysis was consistent with FA mode. In a somewhat mixed mode, grains consisting of vermicular ferrite likely solidified in a peritectic reaction with austenite growing from the melt. In contrast, grains consisting of acicular ferrite likely solidified as ferrite completely. Subsequent diffusional transformation of ferrite in the solid state was completed somewhere. Meanwhile, the microstructure of shell builds was similar to blocks, and scan speed had a negligible effect on the microstructure.
The approximate composition of the 304L DED steels studied by Brooks et al. Reproduced from [91] with permission from the Materials Research Society.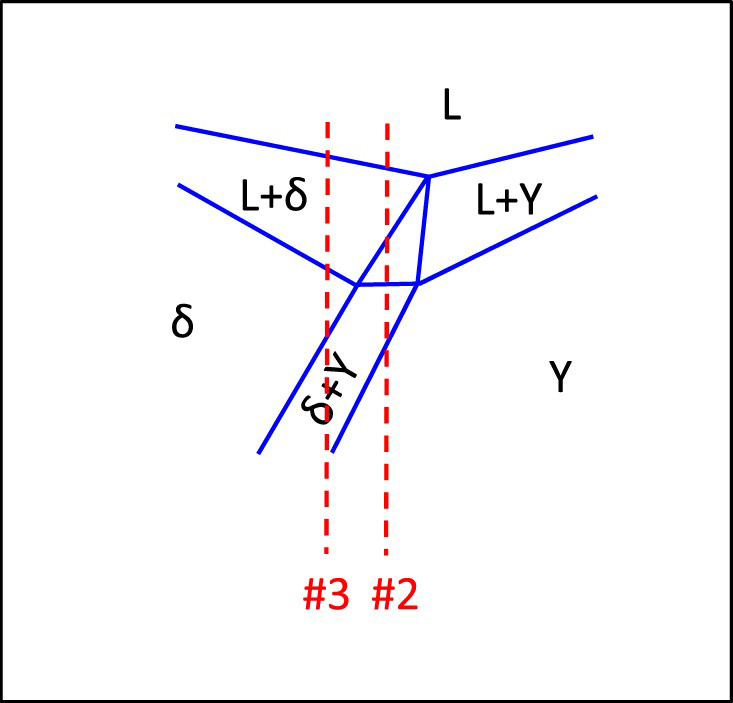
A DED block of alloy #3 solidified in the FA mode but represented residual ferrite inhomogeneously. Based on the microsegregation intensity and phase composition, both diffusional and massive transformation of primary ferrite was assumed in the solid state. The lack of microsegregation was attributed to a massive partitionless transformation, whereas compositional differences between the residual ferrite and austenite indicated long-range diffusional transformation. In conclusion, the DED was not as contentious as laser welding in altering solidification mode but gave more complicated solidification microstructures.
Wang et al. [122] reported the predominance of FA mode based on the skeletal ferrite in the DED walls of a 304L steel with a Creq/Nieq ratio of 1.81. These walls were built at melting powers of 2300 and 4000 W. Grain size and grain shape were sensitive to cooling rate in terms of the melting power and the distance from the substrate, with larger and equiaxed grains at the high power and at the top. However, comparable ferrite numbers (0.9) were found for both conditions. Melia et al. [121] also reported the predominance of FA mode for 304L DED builds of a comparable Creq/Nieq (1.80), printed at powers of 380 and 3800 W. Residual ferrite increased slightly from 1.5 to 2.0 vol.-% at high power. Wavelength-dispersive spectroscopy (WDS) indicated microsegregation of Cr to ferrite, Ni to austenite and P at the austenite–ferrite interface. A lower cooling rate increased microsegregation at the higher melting power.
Systematic studies on the type 316L DED builds recognised austenite as the primary solidifying phase (A and AF modes) [106–119,125–136]. A series of builds represented austenitic microstructures with none or negligible amounts of ferrite [109,112,115,117, 118,130–133]. However, it was not clear how much ferrite solidified secondarily and subsequently transformed to austenite during cooling. A reference to a similar argument in welding literature aims at better understanding. Inoue et al. [59] distinguished A and AF modes for two stainless steels weld metals solidified with quenching under tin melt at cooling rates greater than 104 K s−1. No alteration of solidification microstructure, except for grain boundary migration, and no enhancement of alloying elements redistribution was found in the A mode. However, spherical or elongated ferrite particles, solidified in succession to the primary austenite cells in the AF mode, only slightly transformed into austenite during very rapid cooling, with a bit change in shape. Therefore, one may propose the partial transformation of secondarily solidifying ferrite during subsequent cooling in the solid state for the DED blocks upon cooling at relatively slower rates. Barika et al. [109] have recently reported an elegant multiscale study on the microstructural features of a 316L (Creq/Nieq = 1.58) DED block with no retained ferrite. STEM-EDS maps indicated cell boundary enrichment by Cr, Ni and Mo, consistent to the primary austenite solidification mode. Furthermore, considerable amounts of nanometer-sized inclusions such as Cr–Mo-enriched precipitates and Si oxides were identified in the microstructure.
Another series of 316L DED blocks have shown considerable amounts of residual ferrite in the cellular austenitic microstructure, which indicates the predominance of AF mode more clearly [107,108,110,134–139]. An earlier study reported ferrite retention at about 3–10 vol.-% owing to the microsegregation of Cr and Mo at cell boundaries [134]. The microstructure was sensitive to the cooling rate, changing with the specimen thickness in the build direction. Yadollahi et al. [135] revealed about 9 vol.-% ferrite by EBSD in the middle of a DED block with no ferrite at the bottom. These results clarify various amounts of ferrite in AF mode depending on the cooling rate. Recent studies also provide insight into the effect of process-driven cooling rate effects on the microstructure [107,108]. For instance, different scanning patterns resulted in different ferrite contents, where ferrite was retained in a sample produced by 90° rotation per layer in contrast to another produced by 60° rotation. The authors assumed that different cooling rates produced different ferrite contents. Manvatkar et al. [128] computed the decrease in the cooling rate with increasing build thickness and demonstrated good agreement between the computed cooling rate and the PCAS variation. Zheng et al. [136] also estimated the cooling rate variation with increasing build thickness by measuring PCAS.
Moreover, manipulated solidification behaviour of stainless steels has also been reported in modulated DED processes such as high-power laser melting with an electromagnetic stirring module, where mixed AF + FA modes have been identified [113,114].
DED steels on the implicated Schaeffler diagrams
David et al. [77] and Nakao et al. [44] have shown that a high cooling rate implicates the conventional Schaeffler diagram, which is nevertheless used to ascertain the solidification mode and microstructures of weld metals and DED builds based on the Creq and Nieq. Both papers reported the so-called implicated Schaeffler diagrams constructed for autogenous laser welds of stainless steels, but cooling rates were estimated by computational and experimental PCAS measurement differently. Despite differences in the magnitudes of the proposed cooling rates, the same trend could be found in both studies. Since stainless steels solidify at high cooling rates during the DED process, it should be more reasonable to ascertain the solidification mode and microstructure from those implicated Schaeffler diagrams, which take the cooling rate effects into account. Figure 13 boards some DED stainless steels on the implicated Schaeffler diagrams constructed at three different cooling rates, ca. 1.9 × 10³, 6.0 × 10³ and 3.9 × 10⁴ K s−1 [44]. Hopefully, the implicated Schaeffler diagram provided for a cooling rate of 6 × 10³ K s−1 predicted the solidification behaviour of DED stainless steels more reasonably. However, one may apply each of these implicated diagrams depending on the approximate cooling rate of specific energy input, build thickness, etc.
DED stainless steels incorporated to the implicated Schaeffler diagrams constructed for high cooling rates: (a) 1.9 × 10³ K s−1, (b) 6.0 × 10³ K s−1 with reported ferrite percents given inside parenthesis and (c) 3.9 × 10⁴ K s−1. The implicating Schaeffler diagrams were adopted from [44] with permission from the Japan Welding Society.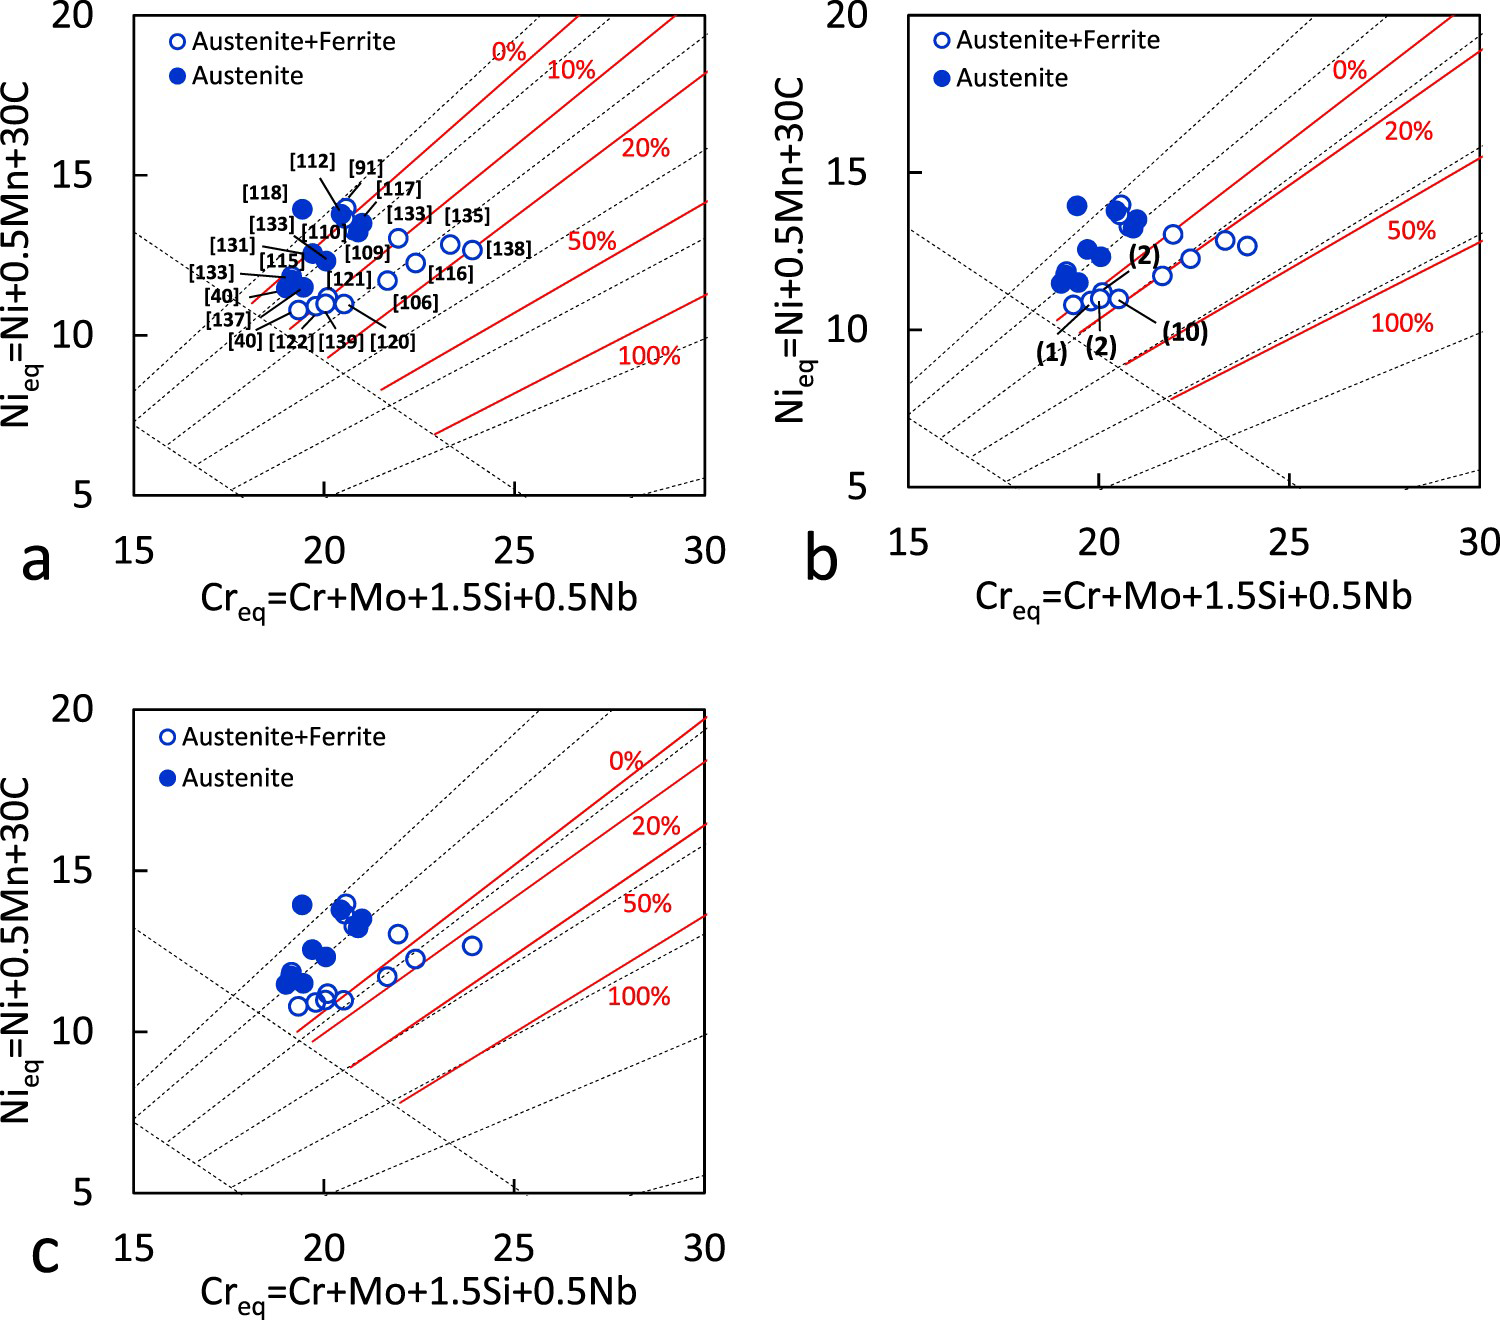
Printability of DED stainless steels
Mukherjee et al. [140] introduced the term printability as a measure of the relative ease of metallic alloy additive manufacturing. Printability of 316L steel using different MAM processes has been compared in terms of susceptibilities for residual stress, distortion, compositional change and lack of fusion defects [141]. Comparably, the term weldability interprets welding behaviour and weld metal performance in service. As a measure of weldability, hot cracking of stainless steels has widely been discussed in welding literature [29–32,49,51,58,142–150]. Hot cracking has also been reported in the high energy density welds [49,73,74,78] and the DED builds of stainless steels [151–154].
The American Welding Society (AWS) describes hot cracking as any type of cracking at temperatures near the completion of solidification [155]. One type of hot cracking is solidification cracking which occurs owing to the retention of liquid film at grain boundaries in the later stage of fusion zone solidification. Microsegregation of some alloying and harmful impurity elements such as P and S decreases the melting point of the aftermost melt thus augmenting hot cracking. Stainless steels hot cracking susceptibility is ascertained from weldability diagrams, which demarcate crack and no-crack regions on a plot of total impurities content (P + S) versus Creq/Nieq ratio. Conventional alloys with low S + P contents (cf. < 0.02-wt%) resist adequately against hot cracking during arc welding apart from Creq/Nieq ratio. However, a higher impurity content promotes cracking susceptibility when Creq/Nieq ratio decreases below a threshold. The threshold corresponds to the critical Creq/Nieq ratio for the transition of solidification mode from AF to FA. It varies with cooling rate at about 1.49–1.55 in arc welding [48] and 1.59–1.68 in pulsed laser welding [74,75]. Indeed, hot cracking occurs in primary austenite mode but steels solidifying in primary ferrite mode with 5–10 vol.-% residual ferrite are practically passive to hot cracking. Yu et al. [152] adapted contemporary weldability diagrams for predicting hot cracking susceptibility of 316L blocks produced by the DED process. In general, predictions were unsatisfactory. A high-Si alloy suffered hot cracking apart from low P + S and solidification in FA mode. The effect of high nitrogen was timely interpreted to promote hot cracking in the DED steels. The nitrogen atmosphere, stimulating primary austenite solidification, promotes hot cracking susceptibility of the DED stainless steels as weld metals [154,156,157].
Nonetheless, there are instances of extraordinary resistance against hot cracking during high energy density welding [80,84,86] as many DED stainless steels solidify with primary austenite mode safely. Instances of negligible microsegregations have also been reported [78,80,124]. Therefore, it is thought that a high cooling rate decreases microsegregations at solidifying grain boundaries. According to [158,159], increasing of solidification rate stimulates solute trapping and renders partitionless solidification at most.
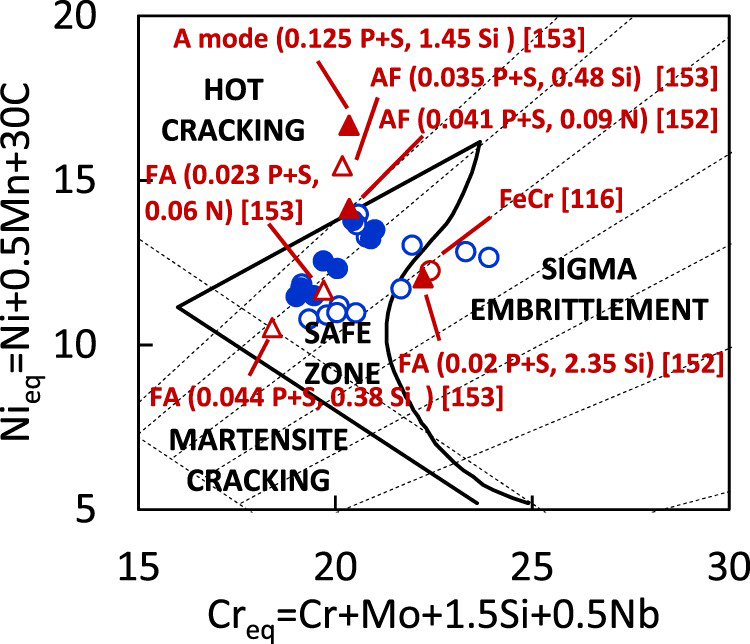
In addition to hot cracking, the formation of the deleterious sigma phase during the aging of ferrite in duplex stainless steels and martensite cracking in low alloy steels promote failure susceptibility. Suutala et al. [63] delimited these structure-sensitive properties on the Schaeffler diagram by representing the middle part of the Bystram diagram [160], modified by reference to the cooling rate stimulated, hot cracking susceptibility. Figure 14 sets the DED stainless steels to the modified Bystram diagram. The formation of the FeCr (sigma) phase in a DED steel is anticipated. Those steels solidifying with A and AF modes show hot cracking at high P + S (cf. > 0.04 wt-%) and high N content, while those solidifying with FA mode have been more resistant. There has not been any report of martensite cracking in the DED stainless steels yet. Many of the accredited DED stainless steels are inside the triangular SAFE ZONE, wherein alloy compositions and process conditions have practically been justified for the safe microstructure evolution.
Conclusions
Stainless steels with Creq/Nieq ratios in the range of 1.5–1.7 which solidify with the primary ferrite mode under near-equilibrium conditions are much vulnerable to intriguing alteration of solidification mode to primary austenite at high cooling rates. Consequently, acute microstructure heterogeneities are realised. However, those steels that solidify with the primary austenite mode in the near-equilibrium conditions retain the same mode at high cooling rates. However, the amount of residual ferrite varies by cooling rate variation considerably. Mitigated conditions result in arms spacing, phase composition and solute redistribution variations. Process-induced and inherent cooling rate variations during high energy density welding and the DED process manipulate the microstructure of stainless steels intriguingly. Although cooling rate effects in the DED are less stringent than welding, substantial cooling rate variation effects on the arms spacing and ferrite content along the build direction have been reported. An implicated Schaeffler diagram, constructed for stainless steel laser welds at a cooling rate of 6.0 × 10³ K s−1, predicted the solidification microstructure of the DED stainless steels much better than the original constitution diagram which is, nevertheless, used conventionally. Available structure-sensitive properties of the DED stainless steels, such as solidification cracking susceptibility, enunciated the optimistic printability on the modified Bystram diagram.
Footnotes
Disclosure statement
No potential conflict of interest was reported by the authors.
1
All stainless steel compositions comply with the American Iron and Steel Institute (AISI) designation system throughout this paper.
2
Empirical relations such as d = 80(Ṫ)−0.33 have been obtained in stainless steels gas tungsten arc (GTA) and tungsten inert gas (TIG) weld metals between measured dendritic arms spacing (d) and experimental cooling rates (Ṫ) from temperature measurement by thermocouple. Owing to difficulties with temperature measurement in tiny melt pools of high energy density welding and MAM, the empirical relation is often extrapolated at high cooling rates. Both primary dendritic arms spacing (PDAS) and secondary dendritic arms spacing (SDAS) have been applied for dendritic microstructures with different constants, and primary cellular arms spacing (PCAS) has been implemented for cellular microstructures.
3
These modes are applied in this paper, but the term primary austenite is applied to emphasize the solidification mode with austenite as the primarily solidifying phase (the leading one) irrespective of any secondarily solidifying ferrite whenever A and AF modes are not to be discerned essentially. Similarly, the term primary ferrite will be sued with no discernment between FA and F modes to emphasize primarily solidifying ferrite irrespective of any secondarily solidifying austenite. Noteworthy, those terms have occasionally been used for A and F modes in the literature. For a schematic corresponding to the present terminology see [51].
4
Schaeffler equivalencies: Creq = Cr+Mo+1.5Si+0.5Nb and Nieq = Ni+0.5Mn+30C, in wt-%. Unless otherwise specified, the Schaeffler equivalencies apply hereafter.
5
Creq = Cr+Mo+1.5Si+0.5Nb+2Ti and Nieq = Ni+0.5Mn+30C+30(N-0.06), in wt-%.
6
Creq = Cr+1.37Mo+1.5Si+2Nb+3Ti and Nieq = Ni+0.31Mn+22C+14.2N+Cu, in wt-%.
7
Creq = Cr+Mo+1.5Si+0.5Nb; Nieq = Ni+0.5Mn+30C+30N, in wt-% (DeLong equivalencies)