
Abstract
Cerium (Ce) was effectively transitioned into the high-Mn austenitic steel weld metal under submerged arc welding by adding cerium dioxide and calcium silicon reducing agents into flux. The evolution behaviours of the composition, number density and size of inclusions in weld metal with different Ce contents were systematically investigated by thermodynamic calculation and experiments. The results show that the number density of inclusions increased and average size decreased with the increase of Ce content from 0 to 0.087 wt-%. Meanwhile, and the percentage of inclusions number with size less than 0.80 μm increased from 79.28% to 91.43%. The evolutionary process of inclusions was Al2O3 → Al11O18Ce → CeAlO3 → Ce2O3 → Ce2O2S with the increase of Ce content in the present weld metal. In particular, Ce-O-S-Al inclusion was extracted by in-situ sample preparation method, which proved its internal structure and evolution process. The complete formation model of Ce-Al-O-S system was also established.
Keywords
Introduction
Recently, novel cryogenic high-Mn austenitic steels have been developed with their excellent cryogenic toughness and remarkable economic advantages for replacing traditional 9% nickel cryogenic steels, austenitic stainless steels and invar alloys for the manufacture of liquefied natural gas (LNG) tanks [1,2]. The high-Mn cryogenic steel in the fabrication of LNG tanks should be connected by welding, and submerged arc welding is one of the most widely used welding methods in high-Mn cryogenic steel [3]. There are strict requirements for the toughness of the weld metal to ensure the safe operation and service life of the LNG tanks under the cryogenic working environment [4,5].
The high-Mn cryogenic steel weld metal contains a large amount of Mn element to control the stacking fault energy and maintain austenite structure at room temperature. Also, the submerged arc welding flux contains Al2O3 to act as a slag former. The formation of MnS and Al2O3 inclusions are generally unavoidable for the welding process in high-Mn steel [6,7]. Such coarse inclusions generally tend to act as the crack initiation due to their high hardness, causing fractures and deteriorating the impact toughness of the weld metal [8–10]. Thus, many studies are devoted to controlling the composition, number and size of inclusions to optimise the mechanical properties [11–13]. Rare earth (RE) elements have a high affinity with oxygen and sulphur, which have been widely used to purify molten steel, modify inclusions and improve the mechanical performance in the steelmaking process [14–16]. Cerium (Ce) is the highest abundance of rare earth elements, so it has attracted much attention. Most researchers found that inclusions were modified along the route of Al2O3 → CeAlO3 → Ce2O2S when the Ce content increased in the steel [17–19]. For the welding process, it has been reported [20,21] that RE elements addition can reduce the area density and size of inclusions and form the RE-containing complex inclusion in ferritic weld metal. However, to the authors’ knowledge, there are few reports on the influence of rare earth elements on inclusions in high-Mn austenitic weld metal, especially on the evolution and formation mechanism of rare earth inclusions have not been systematically studied. Meanwhile, thermodynamics of inclusions evolution in weld metal is also rarely involved.
Moreover, the formation of single RE-oxide and RE-oxysulphide inclusions are generally considered more beneficial, which can substantially reduce the size of inclusion and nucleation of microcracks by coarse inclusions [22,23]. The formation of such inclusions requires a higher content of RE elements [24]. The conventional addition of RE alloy and RE oxides into the flux will cause serious burning loss of RE elements and low content of RE elements transferred into the weld metal [25,26]. This may result in the underutilisation of added RE and incomplete modification of the inclusions by the addition of RE. Thus, it is essential to explore an effective method to increase the content of RE dissolved in high-Mn steel weld metal.
In the present study, using the submerged arc welding process, CeO2 was added to the original flux, and a certain proportion of calcium silicon reducing agent was added for the reduction transition. Specific attention was paid to the transition mechanism of Ce element in weld metal. The interaction between Ce and O, S, Al was studied by thermodynamic calculation system. Then a detailed study was made on the composition, number density, size and exact chemical formula of inclusions by scanning electron microscope and transmission electron microscope observation. We focused on the evolution of Ce-containing inclusions, aiming to optimise the distribution of inclusions and lay the foundation for the development of cryogenic high-Mn austenitic steel weld consumables.
Experimental methods
Experimental procedure
The flux used is the submerged arc welding (SAW) agglomerated flux (SJ-F10) of high-Mn steel weld metal (WM) for LNG tanks. Flux and analytical reagent grade chemicals of CeO2 (purity > 99.9 wt-%) were dried at 300°C for 3 h before welding to remove moisture. To make a more efficient transition of Ce into the weld metal, the reducing agent calcium silicon (Ca-Si) alloys powder (35 wt-% Ca-55 wt-% Si-10 wt-% Fe) was added. Based on the related reaction (as shown in reaction (1, 3, 4) of section 3.1) of CeO2 and Ca-Si under high temperature in SAW, assuming exactly complete reaction, the mass ratio of CeO2 and Ca-Si equals their total molar mass (M) ratio, which is about 5:1 (2M(CeO2):M(Ca-Si) = 5:1). Considering that the used Ca-Si alloys contain some Fe, thus, we determined the mass ratio of CeO2 and Ca-Si alloys was 4:1. Subsequently, four groups of fluxes with different CeO2 + Ca-Si alloys addition were obtained by adding 0, 2, 4 and 8 wt-% (total mass of flux) of CeO2 + Ca-Si alloys to the flux, labelled as F0, F2, F4 and F8, respectively. This was followed by thorough mixing for 30 min in a three-dimensional (3-D) mixing machine. The final chemical compositions of the four groups of fluxes after mixing is listed in Table S1.
High-Mn (25 wt-% Mn) steel for LNG tanks with a thickness of 20 mm was used as the base metal (BM). BM was ground with an angle grinder to remove any impurities before welding. Four-pass bead-on-plate SAW was adopted by a single-wire welding machine (ZDE7-1200HD, Chengdu Huayuan Electric Equipment Co., China). The temperature between welding layers was controlled at 150–200°C. The diameter of the solid wire was 3.2 mm. The welding speed was set as 50 cm min−1, welding voltage of 31 V, welding current of 423 A and heat input of 15.74 kJ cm−1 were employed.
Analysis methods
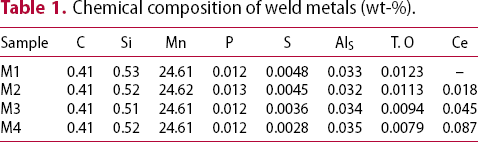
WM samples were cut along the cross-section perpendicular to the welding direction. The samples for inclusions observation and elemental analysis were prepared from 2 mm below the surface on the last layer, as shown in Figure 1, as this position is the most representative one [27]. Total O and N contents of WMs were determined with an O-N analyzer (TC500, LECO, U.S.A.). The C and S contents were determined by a C-S analyzer (CS600, LECO, U.S.A.), and the other element contents were determined by an inductively coupled plasma optical emission spectroscopy (ICP-OES, 725ES, Agilent Technologies Inc. U.S.A.).
Schematic diagram of sampling location in weld metal.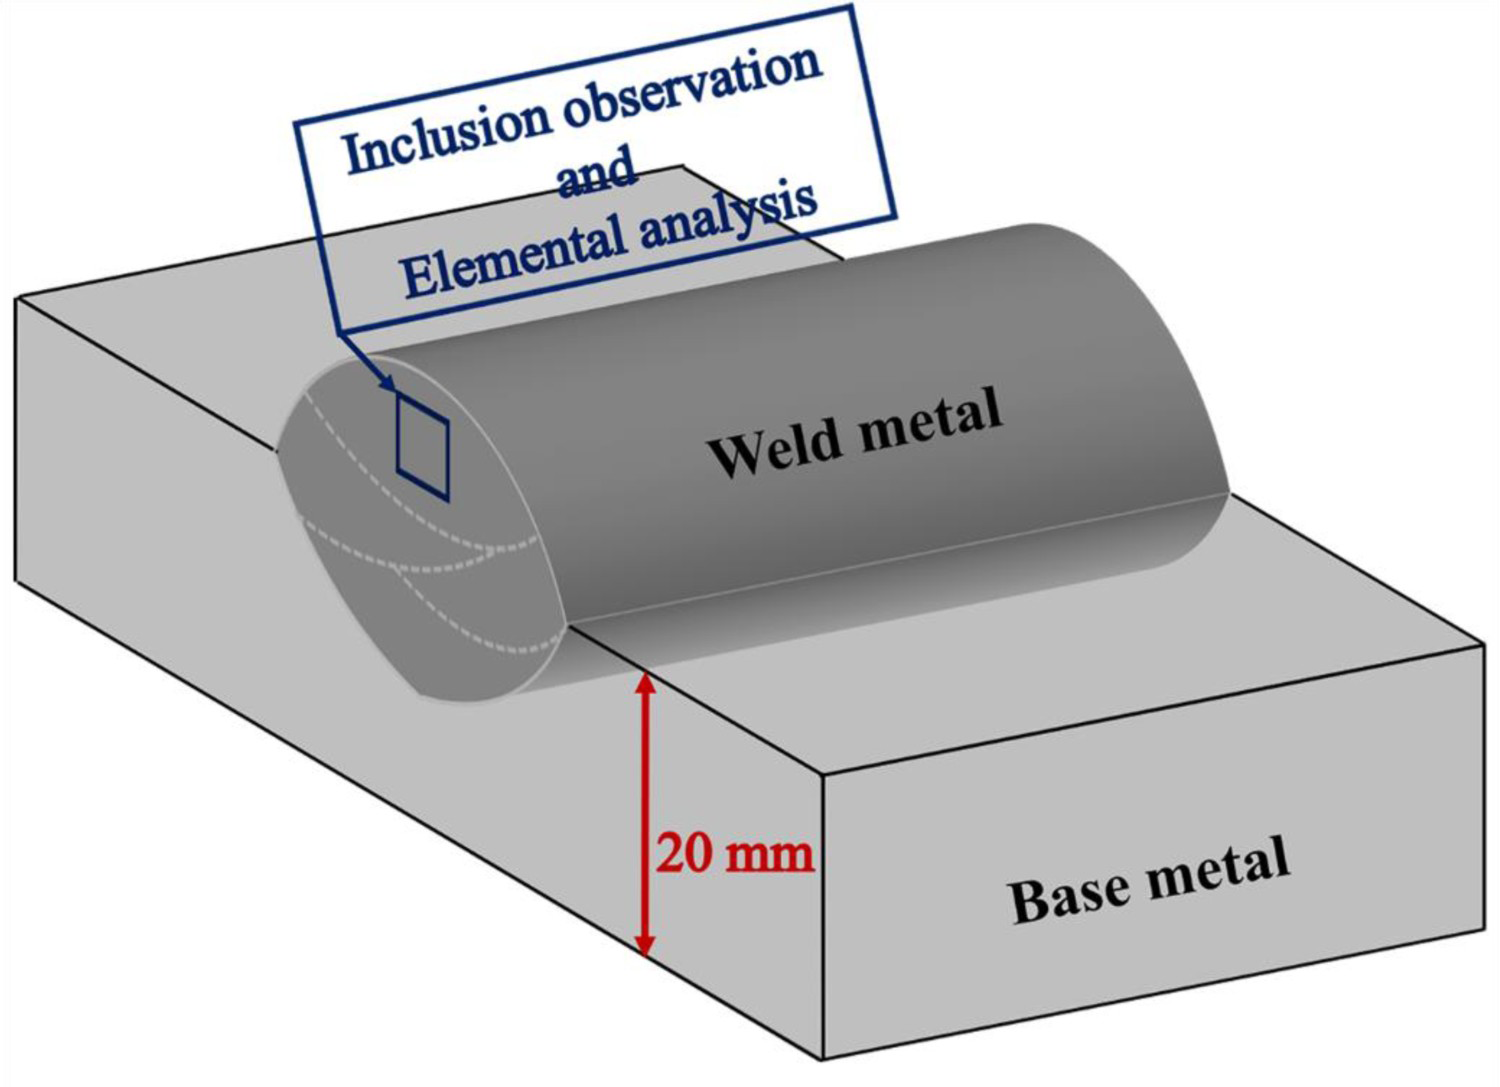
The morphology and corresponding chemical compositions of typical inclusions were determined by scanning electron microscope (SEM, Nova 400 Nano, FEI Co., U.S.A.) and energy dispersive spectrometer (EDS, Le350 PentaFETx-3, Oxford Instruments Co., UK) at 20 kV acceleration voltage. The number quantity and size of inclusions were examined at 2000 times magnification, and at least 100 fields of view were randomly selected. Meanwhile, approximately 500 inclusions in each WM samples were statistically analysed. Moreover, a target inclusion was cut using a focused ion beam scanning electron microscope (FIB-SEM, Strata 400S, FEI Co, U.S.A.), and the selected area electron diffraction (SAED) patterns of inclusions were obtained by transmission electron microscope (TEM, Talos F200S, FEI Co, U.S.A.).
Transfer behaviour of Ce and chemical compositions in weld metal
Under high temperatures in SAW, the following reactions may occur.


Chemical composition of weld metals (wt-%).
During the welding metallurgy process, the [Ce] has a strong affinity with [O] and [S] elements, and the following reactions (5) will occur.

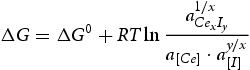

 and
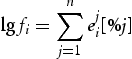
and  are the mass fraction of the element i and j in welding pool, and
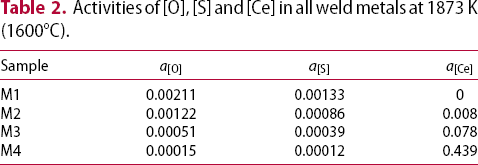
  is the interaction coefficient. The reaction equations and related thermodynamic data of CeO2, Ce2O3, Ce2O2S, CeS, Ce2S3 and Ce3S4 are shown in Table S2. The values of interaction coefficients used are shown in Table S3. The activity coefficients of Ce, O and S at 1600°C were calculated by Equation (8). The calculated results of the activities of [O], [S] and [Ce] in all weld metals at 1600°C are listed in Table 2.
Activities of [O], [S] and [Ce] in all weld metals at 1873 K (1600°C).
Combined with the Gibbs free energy data in Table S2, the relation function between a[O], a[S], and a[Ce] was obtained. The a[O]-a[S]-a[Ce] system three-dimensional (3-D) diagram at 1600°C was plotted using Matlab 2018a software, and a[O], a[S] and a[Ce] were set as the x-axis, y-axis and z-axis, respectively, as shown in Figure 2. Under the equilibrium conditions of constant temperatures, the activity product of Equations (9) and (10) in Table S2 are clearly a function of x and z, Equation (11) is a relational function of x, y and z, and the functions include y and z for Equations (12), (13) and (14). Apparently, the space above the surface represents the saturated region of Ce-containing inclusions formed. On the contrary, the space below the surface is the solid solution of Ce, O, and S in the weld metal, and the surface represents inclusions precipitated in the equilibrium state. Wang et al. [24] analysed the inclusions formation sequence of a[O]-a[S]-a[La] system in steel by this method. Adabavazeh et al. [31] studied the effect of Ce, O and S contents on the stability of inclusions in steel by thermodynamic calculation. These reports prove that the results of the present work are feasible.
3-D stability diagram of a[O]-a[S]-a[Ce] system in weld metal at 1873 K (1600°C).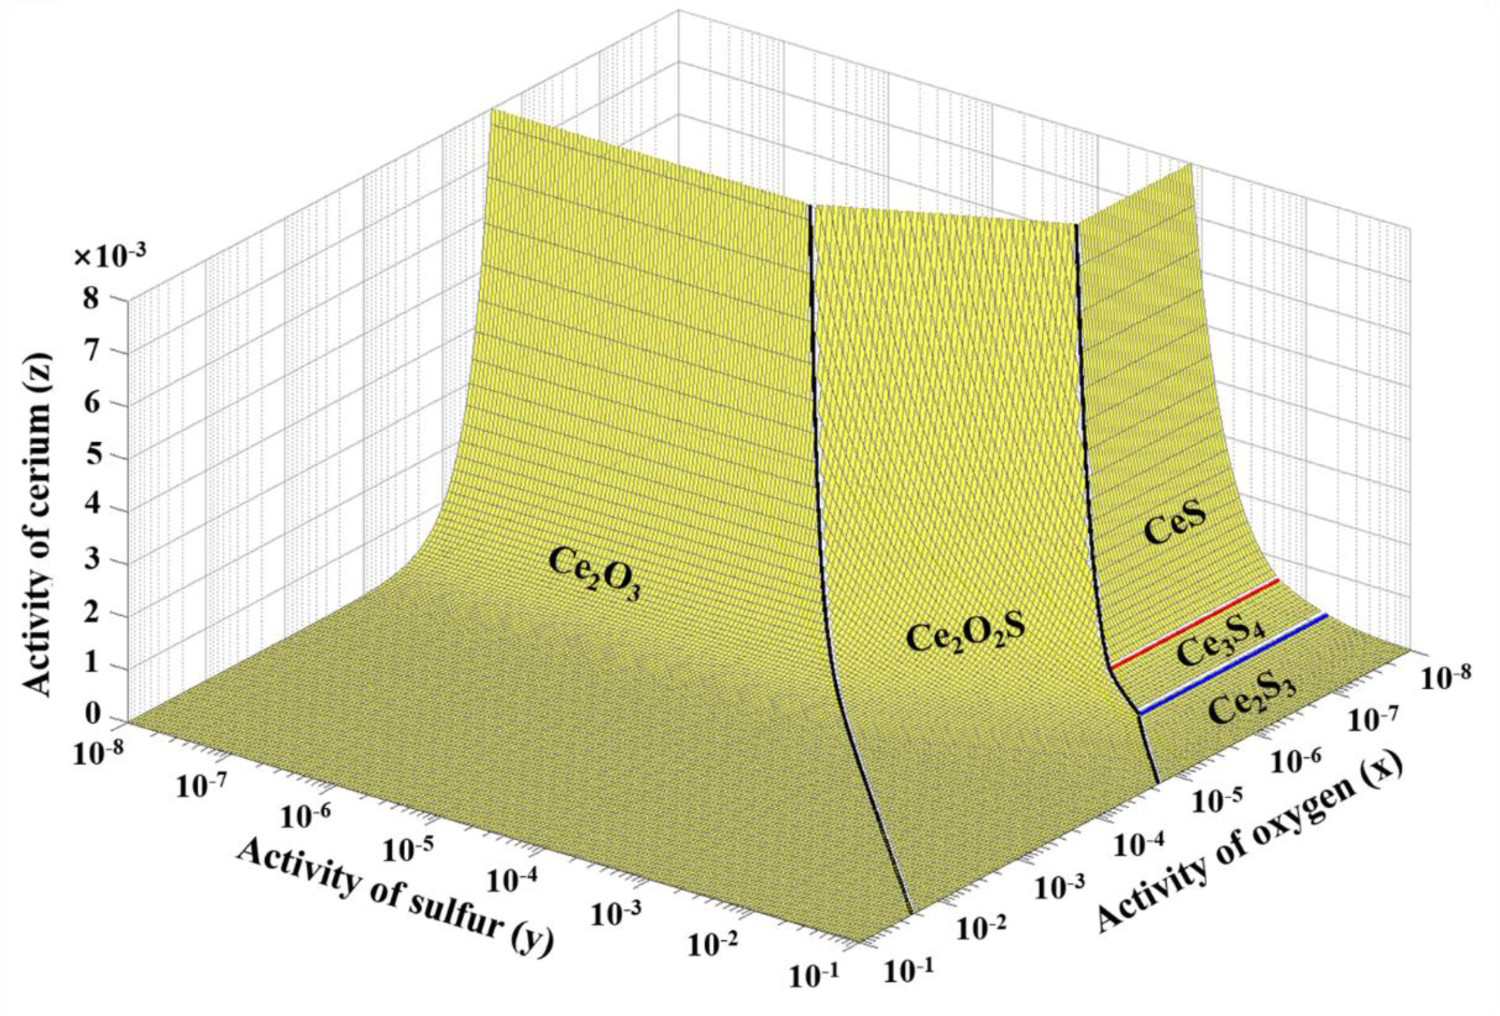
To more clearly understand the evolution process of inclusions, the activity contour map of the a[O]-a[S]-a[Ce] 3-D diagram was plotted on the x-y plane, as shown in Figure S1. The reaction sequence between Ce, O and S depends on their initial content and weld metal composition. Activities of Ce were calculated to be 0.008, 0.078 and 0.439 for M2, M3 and M4 weld metals, respectively, and located in the space above the surface in Figure 2, indicating that the Ce-containing inclusions can be formed. Meanwhile, according to the calculated activity values of O and S listed in Table 2, all Ce-containing weld metals (M2, M3 and M4) were plotted in Figure S1. This mean that in the Ce-O-S system, Ce2O3 forms first for all Ce-containing weld metals at 1873 K in this work. Then Ce2O2S begins to form as a[O] drops to about a[S]/7. Waudby [32] suggested that RE2O3 was generated when S content was less than 10 times O content, which was similar results to the present work. Subsequently, Ce started to react with S, and RE sulphides formed depending on the activities of Ce, S and O. For RE sulphides, the formation of Ce3S4 and Ce2S3 is difficult due to the requirement of high a[S], which was calculated to be 0.0075. Activities of S were calculated to be 0.00086, 0.00039 and 0.00012 for Ce-containing weld metals, respectively, which are all far less than 0.0075. Therefore, CeS is the only RE sulphide that may exist in the present work.
In addition to reacting with dissolved O and S, dissolved Ce also reacted with dissolved Al in the welding pool. To understand the reaction products and reaction process of Ce, Al and O. The stability diagram of Ce-Al-O system was calculated by the Factsage 7.3 software at 1873 K (Databases: FToxide and FTmisc, Phase Diagram module) based on the chemical composition of M1 weld metal. The result is shown in Figure S2, where [%Al] and [%Ce] stand for the mass percentage of Al and Ce content, respectively. It indicates that the inclusions could change in the order of ‘Al2O3 → Al11O18Ce → CeAlO3 → Ce2O3’ with increasing the content of Ce. The Ce2O3 represents the stable inclusion phase in the present Ce-Al-O system phase diagram.
In M1 weld metal without Ce, the typical inclusions were identified as single Al2O3 inclusion and Al-Mn-Si-O + MnS complex inclusion with higher Al content (Figure S3a and b), and it also existed Al2O3 + MnS complex inclusion by SEM line scanning results as shown in Figure S3c. In M2 weld metal with 0.018 wt-% Ce, the composition of inclusions was changed to Al2O3 core wrapped by Ce-Al-O inclusion as shown in Figure S4a, and consisting of MnS and Ce-Al-O complex inclusion in Figure S4b. It should be noted that the Ce content is different for the two Ce-Al-O inclusion by EDS analysis. Combined with the Ce-Al-O stability diagram in Figure S2, the low-Ce Ce-Al-O and Ce-rich Ce-Al-O inclusion can be identified as Al11O18Ce (Figure S4a) and CeAlO3 (Figure S4b), respectively. Similar Ce-Al-O inclusion was also observed in the previous study [33,34]. Besides, individual CeAlO3 inclusion is also found in Figure S4c. As Ce content increased to 0.045 wt-%, the Ce-S-O + Ce-Al-O complex inclusion was observed in M3 weld metal (Figure S5a). It also contained a large amount of individual Ce-O-S and Ce-O inclusion (Figure S5b and c). Combined with the thermodynamic calculation in section 3.2, the exact chemical formulas of Ce-O-S and Ce-O inclusions proved to be Ce2O2S and Ce2O3. Only plenty of individual Ce2O3 (Figure S6a) and Ce2O2S (Figure S6b and c) inclusions were detected in M4 weld metal with 0.087 wt-% Ce. Most inclusions were nearly spherical in all weld metal.
Figure 3 showed the changes in the number density, mean size and size distribution of inclusions in weld metal with different Ce content. With the Ce content increased from 0 to 0.087 wt-%, it can be seen from Figure 3(a) that the number density of inclusion increased obviously, and the mean size decreased with the increase of Ce content in this work. The size distribution of inclusions in weld metal with different Ce contents is shown in Figure 3(b). It indicates that inclusions are mainly distributed in the range of less than 0.80 μm in all weld metals. The number percentage of less than 0.80 μm inclusions in M1 weld metal was 79.28%, while the percentage of less than 0.80 μm inclusions in M2, M3 and M4 weld metals increased to 82.02%, 89.45% and 91.43%, respectively. From the above results, it can be seen that there will be an optimal Ce content in high-Mn steels weld metal, which helps to produce the fine and dispersive RE inclusions.
(a) Number density, average size and (b) size distribution of inclusions in weld metal with different Ce contents.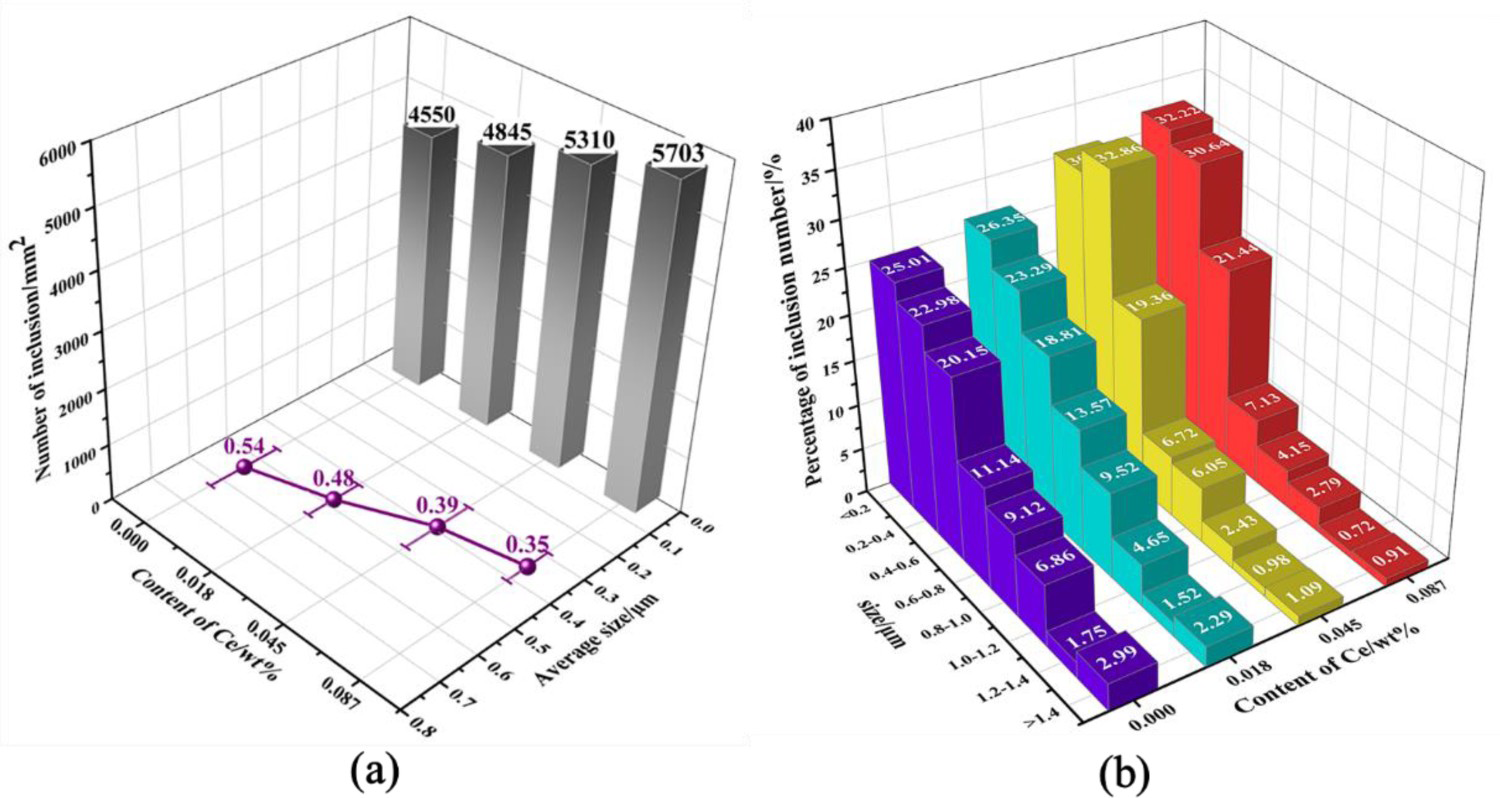
To achieve visual identification of the inclusion types in each weld metal with different Ce content, the distribution of various inclusion types was counted, and the result is plotted in Figure S7. Al2O3 inclusion was the dominant inclusion in M1weld metal without Ce. As Ce content increased to 0.018 wt-%, the main inclusions proved to be CeAlO3. The main inclusions of Ce2O3 and Ce2O2S appear when 0.045 wt-% Ce is added. As Ce content increased to 0.087 wt-%, all inclusions were completely modified to Ce2O3 and Ce2O2S. Figure 4 shows 3D morphologies and spectra of typical inclusions in each weld metal, indicating that the typical inclusions were changed from Al2O3 → CeAlO3 → Ce2O3 and Ce2O2S with the increase of Ce content.
3D morphologies and spectra of typical inclusions in (a) M1, (b) M2, (c) M3 and (d) M4 weld metals.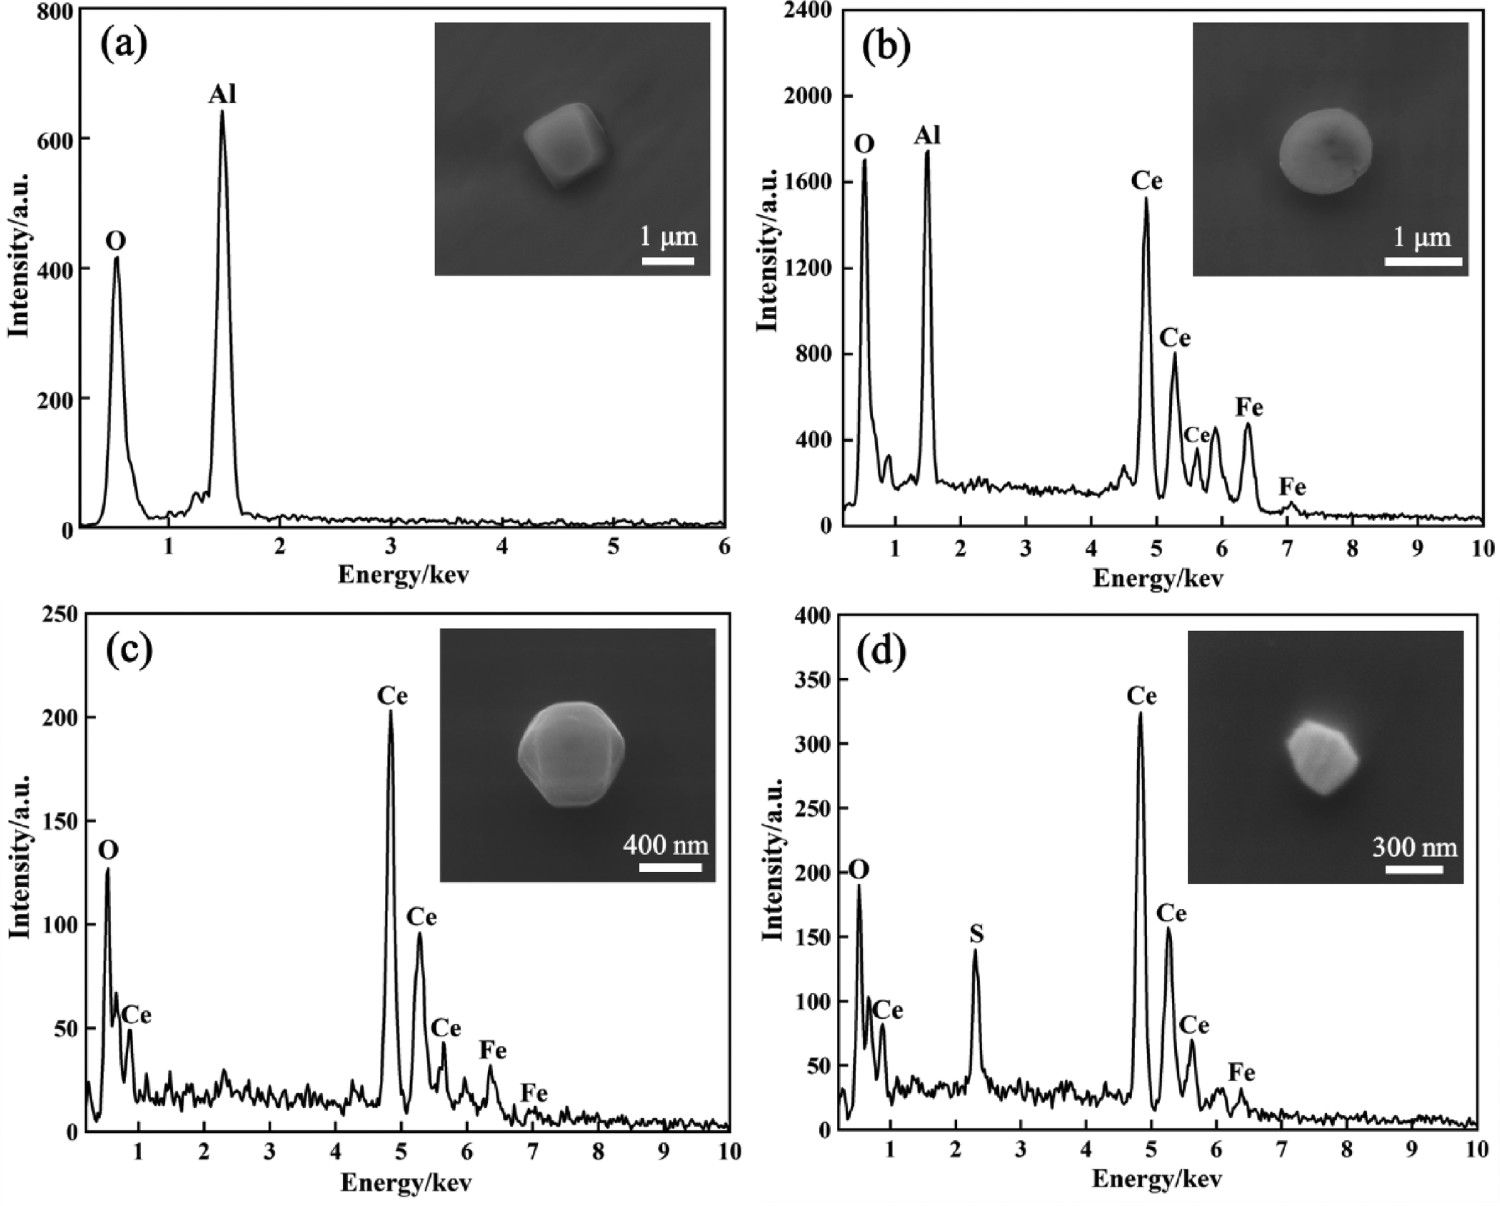
The typical inclusion in M2 and M3 weld metal was analysed by EDS mapping to indicate the evolution process, as shown in Figure 5. As can be seen from Figure 5(a), the Ce concentration is higher on the outer surface and lower in the inner part of inclusion, which a ring shape Ce-rich band formed around the inclusion, the distribution zone of Al and O atoms was completely overlapped in the whole inclusion. Based on the aforementioned thermodynamic calculation (Figure S2) and inclusion type analysis (Figure S4a), it could be described as Al2O3 inclusions surrounded by an outer Al11O18Ce layer. It is considered that the inclusion was modified along the route of Al2O3 → Al11O18Ce. In the EDS mapping result of M3 weld metal, it is found that the Ce atoms are uniformly distributed and Al atoms are distributed in the inner region for the whole inclusion. Meanwhile, there is a high S content region on the outer surface. It suggests that the complex inclusions have a CeAlO3 core with a Ce2O2S outside, as shown in Figure 5(b). It shows that the variation of inclusions composition is CeAlO3 → Ce2O2S. The evolution process of inclusions was also demonstrated by SEM line scanning results in Figure S8. Along the direction of the arrow, the intensity of Al atoms gradually decreases, and the intensity of Ce and S atoms gradually increases. Combined thermodynamic calculation, the modification sequence of inclusions is Al11O18Ce → CeAlO3 → Ce2O2S.
SEM micrograph and elemental mappings of transferring inclusions in (a) M2 and (b) M3 weld metal.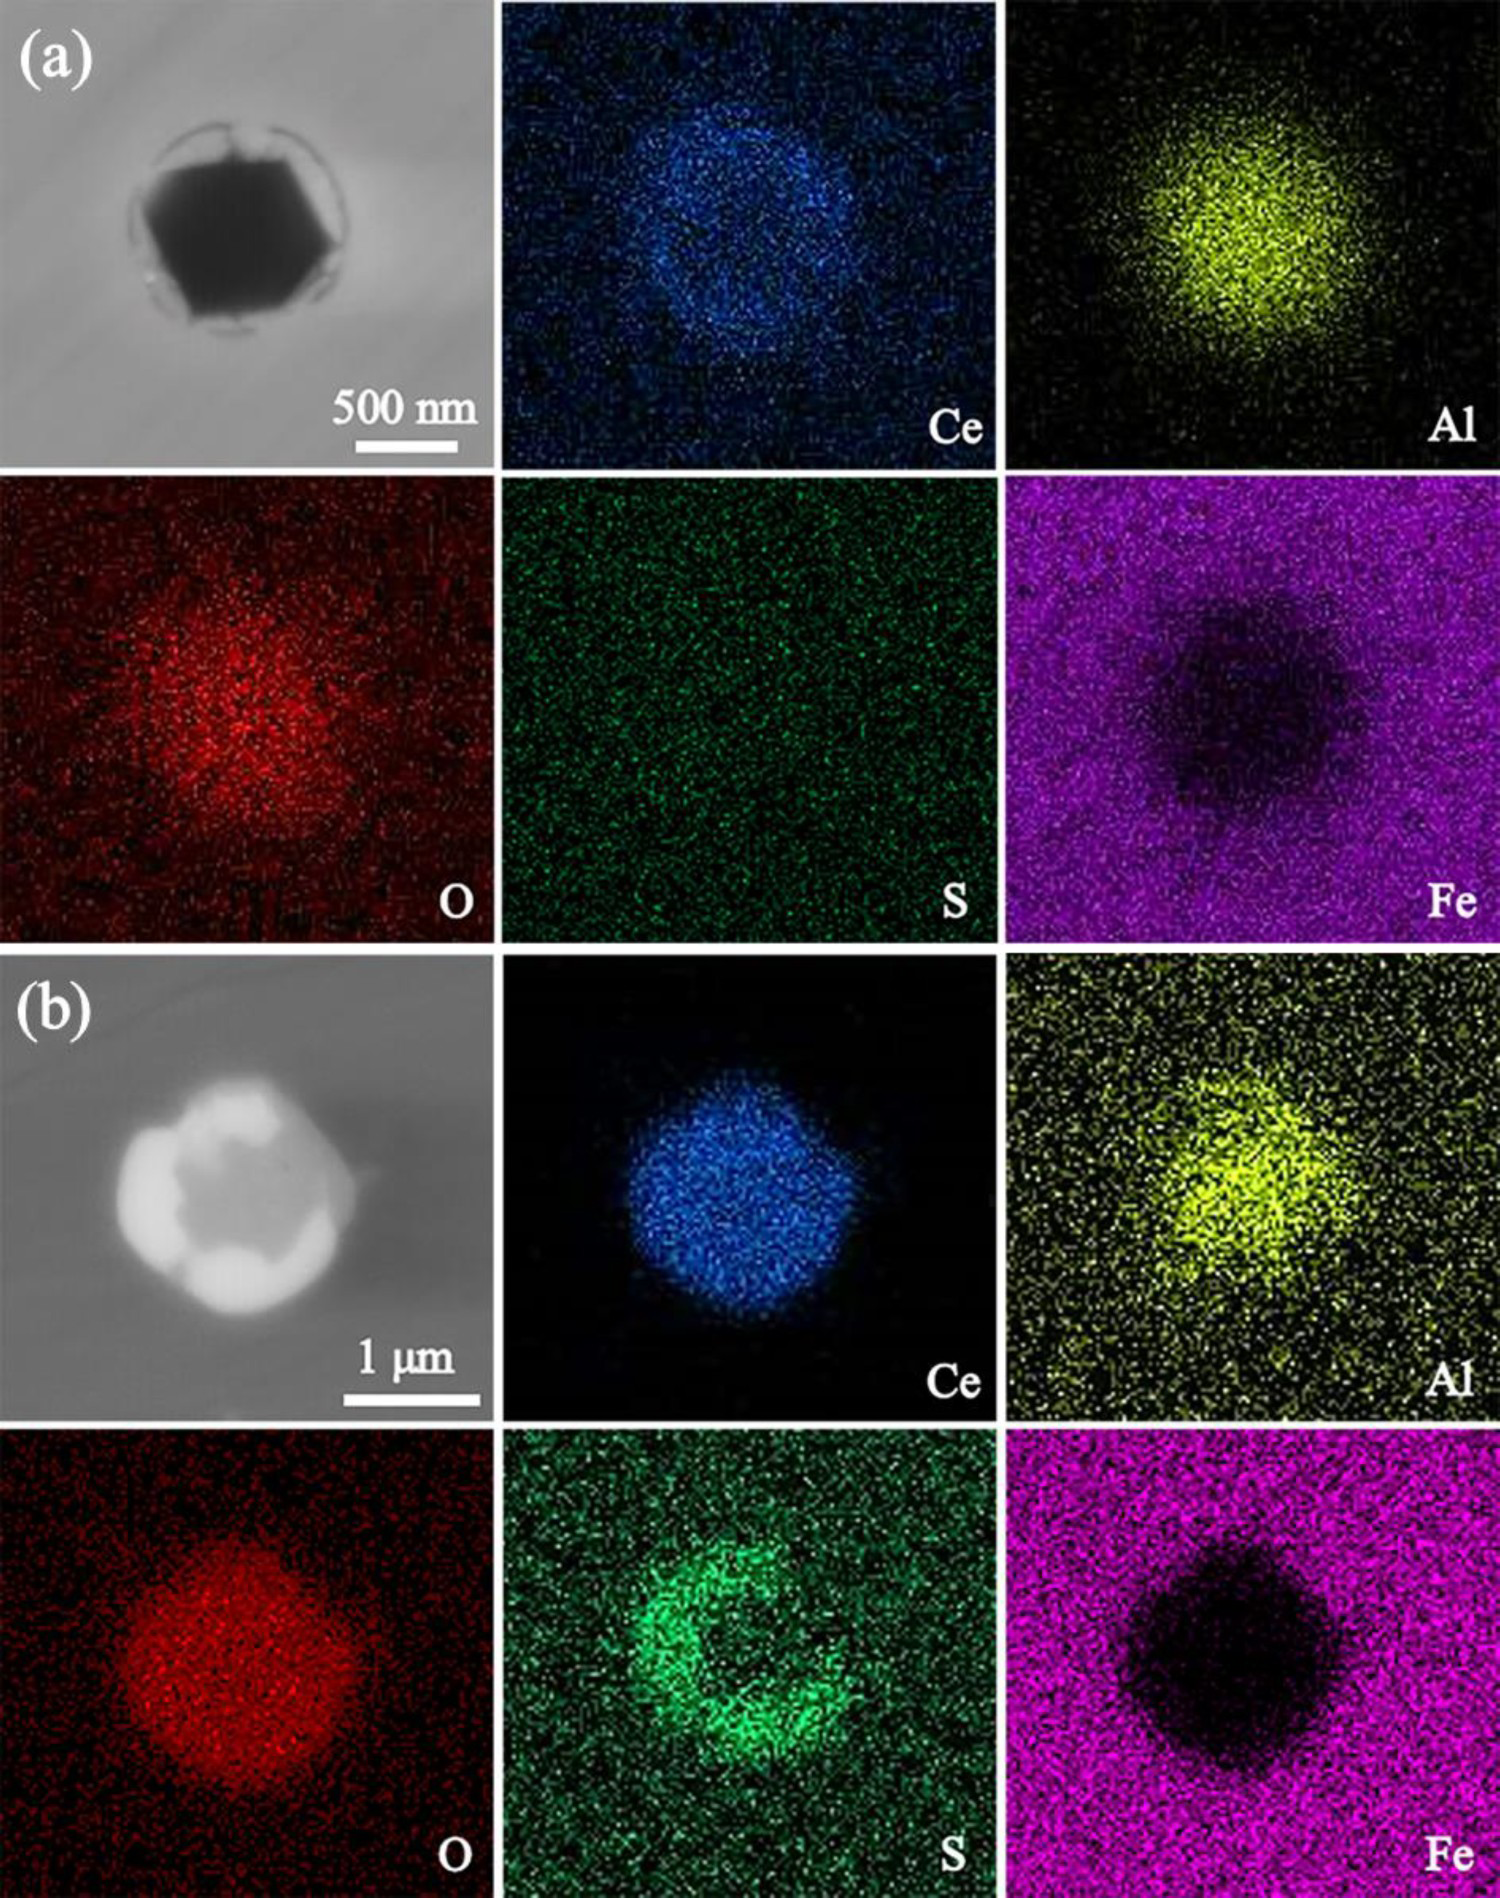
To further determine the exact chemical formula, internal structure and evolution process of Ce-O-S-Al inclusion, the details of the Ce-O-S-Al inclusions were investigated by using TEM in M3 weld metal as shown in Figure 6. Figure 6(a) shows the extracted part of the inclusion, and the corresponding EDX mapping results in Figure 6(b) through f shows three different areas, i.e. Ce-Al-O, Ce-O and Ce-O-S, marked as g, h and i. Through the above elemental investigation, the crystal structure was characterized by electron diffraction techniques of TEM. Figure 6(g) through (i) shows the selected area electron diffraction (SAED) patterns obtained from area g through i. By comparing the lattice parameters of SAED patterns with the values in the PDF database, the core of Ce-Al-O in area g is proved to be CeAlO3, the middle layer of Ce-O in area h is Ce2O3 and the outermost layer of Ce-O-S in area i is confirmed to be Ce2O2S. It can therefore concluded that the Ce-O-S-Al inclusion is being changed from CeAlO3 → Ce2O3 → Ce2O2S.
(a) TEM bright-field image of a lamella cut out through Ce-containing compound inclusion in M3 weld metal. Related TEM-EDX maps of (b) Ce, (c) O, (d) Al, (e) S and (f) Fe. The corresponding electron diffraction patterns of (g) the CeAlO3 inclusion in area g, (h) the Ce2O3 inclusion in area h and (i) the Ce2O2S inclusion in area i.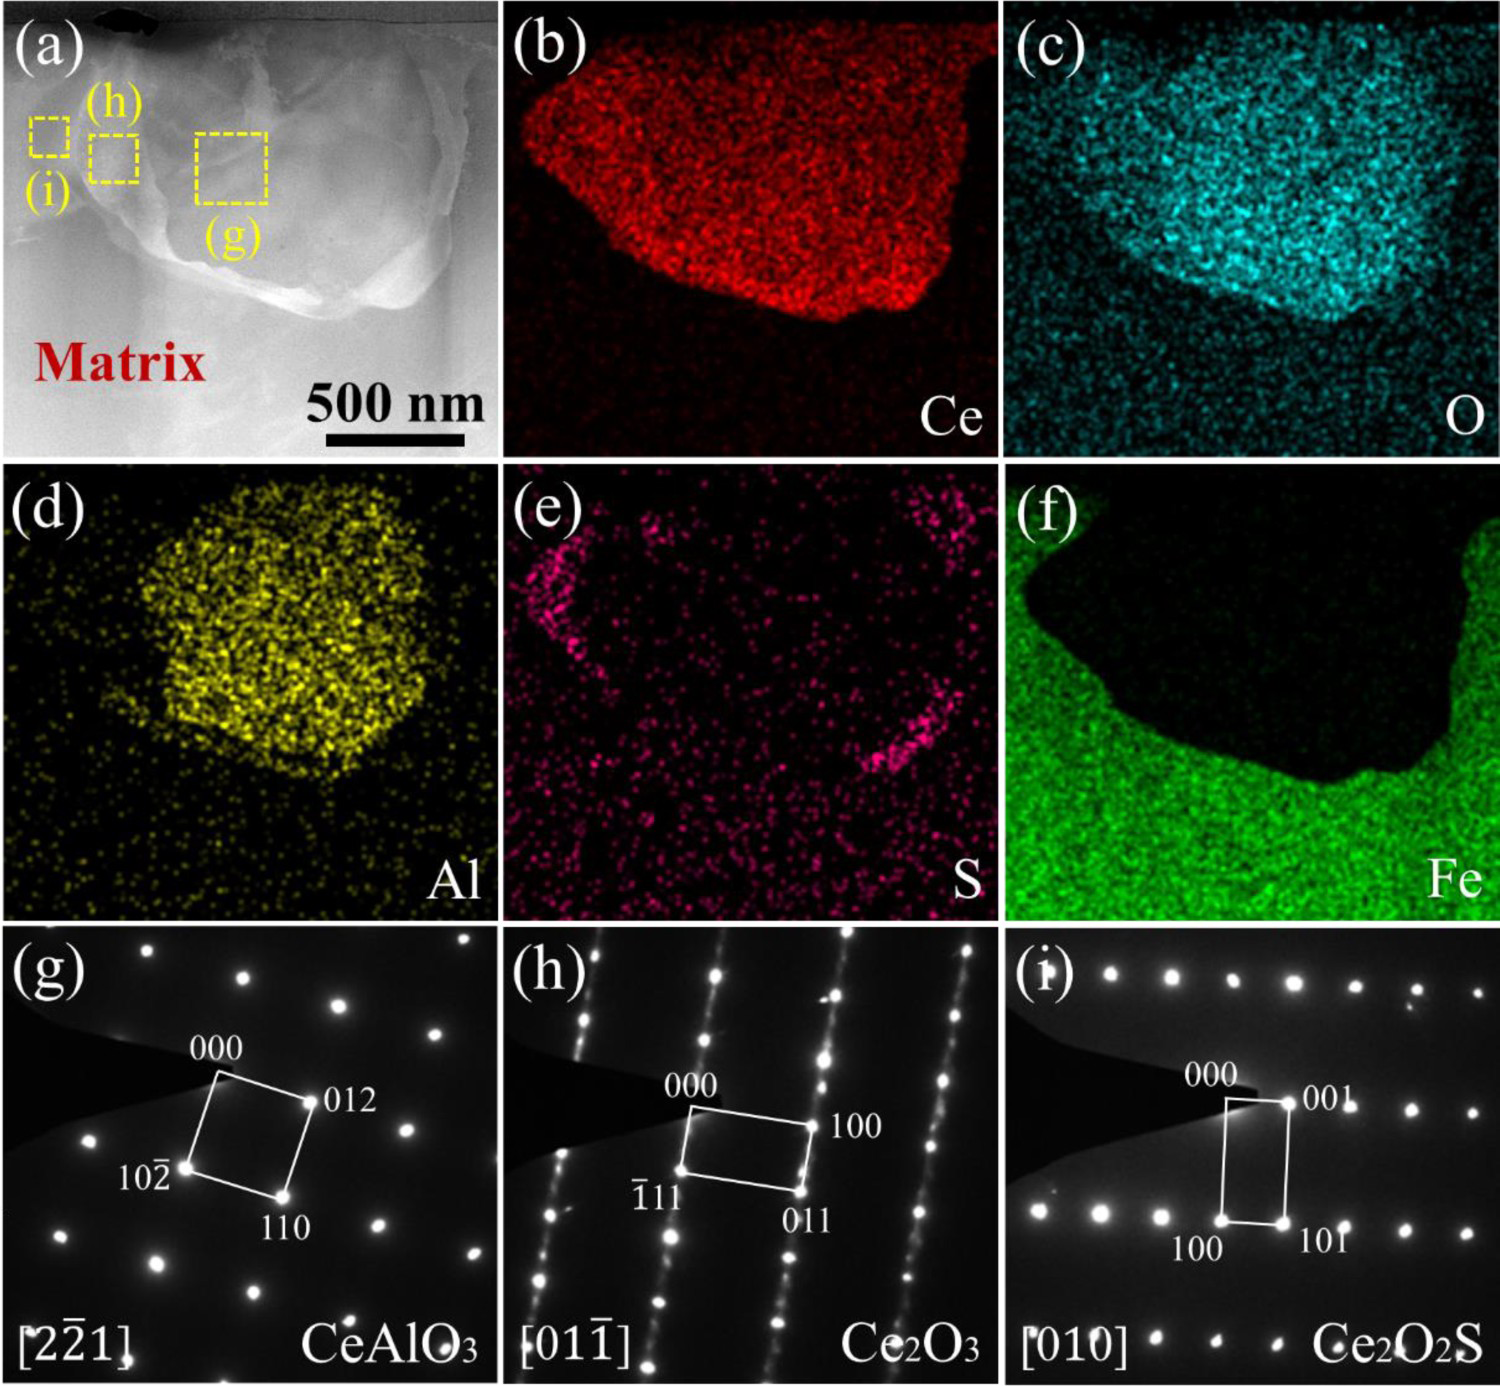
Based on the above experimental results and thermodynamic calculations, the evolution process of inclusions was clearly described in Figure S9. First, when Ce enters the welding pool, it reacts preferentially with the Al2O3 inclusion already formed, [Al] would be reduced from Al2O3 inclusions and formed Al11O8Ce by equation (A). As the reaction proceeds, Ce further reacts with Al11O8Ce to form CeAlO3, as shown in equation (B). With the increase of Ce content or the [O] and [S] contents in the welding pool decrease, two types of inclusions may be formed. Ce2O3 will be generated if there is an excess [O] reacting with CeAlO3 (equation (C)), and Ce2O2S will be generated if there is an excess [S] reacting with CeAlO3 (equation (D)). When CeAlO3 is used up, the excess [Ce] continues to react with [O] and [S] in the welding pool, forming Ce2O3 and Ce2O2S as the final product, marked with equation (E, F).
In this paper, the role of Ca-Si alloys is to act as a reducing agent to reduce Ce into the weld metal, providing an effective method to attain a stable and controlled transition of Ce into the high-Mn austenitic steel weld metal. The formation mechanism of inclusions for the Ce-Al-O-S system in high-Mn cryogenic steel weld metal and the evolution process with the Ce content increasing were investigated. According to the thermodynamic calculation and experimental results, the following conclusions were obtained:
Under high heat input of submerged arc welding, CeO2 can be decomposed to Ce2O3, which was further decomposed or reduced to Ce with the addition of Ca-Si alloys and transferred into the weld metal. The number density of inclusions increased and the mean size decreased in weld metals with the increase of Ce content from 0 to 0.087 wt-%. Meanwhile, the size distribution range of inclusions was mainly less than 0.80 μm in all weld metals, and the percentage of inclusions number with size less than 0.80 μm increased from 79.28% to 91.43%. It proved that adding Ce to modify Al-containing inclusions was practically available by adding CeO2 and Ca-Si alloy into welding flux. With the increase of Ce content from 0 to 0.087 wt-%, the inclusion was changed along the route of Al2O3 → Al11O18Ce → CeAlO3 → Ce2O3 → Ce2O2S in the present weld metal, which is consistent with thermodynamic analysis. The internal structure and chemical formula of Ce-O-S-Al inclusion were confirmed. Meanwhile, the formation model of Ce-Al-O-S system was also established. The generated CeAlO3 inclusions may react further in two ways: if the excess [O] reacts with CeAlO3 to form Ce2O3, and the excess [S] reacts with CeAlO3 to form Ce2O2S.
Footnotes
Acknowledgement
We would like to thank Dr Zhen Wang at the Analytical and Testing Center of Wuhan University of Science and Technology for the help on SEM analysis.
Disclosure statement
No potential conflict of interest was reported by the authors.