
Abstract
The powder diameter affects the heat generation and further influences the quality of weldments when the MZA powder is used as laser-absorbents to carry out laser transmission welding (LTW). It is difficult to measure the temperature due to its extremely short duration. A mathematical model considering the multiple reflections of metal powder is established to predict heat generation. The mathematical model is verified and then used to describe the influence of line energy density and powder diameter on the temperature profile of the LTW process. The results demonstrate that the temperature from experiments and simulation are consistent. Therefore, the established model is suitable to predict the heat generation of metal powder laser-absorbents in the LTW process.
Keywords
Introduction
Joining thermoplastics has abroad applications, e.g. in aircraft, automotive, and electronics industries, where weld products require high mechanical strength or lightweight [1,2]. Laser transmission welding (LTW) has been proven as an innovative joining technology with the advantage of high efficiency, low residual stress, and a high degree of automation [3]. The fundamental of LTW is that the laser beam is absorbed when it passes through the upper thermoplastics, and the heat generates in the lower thermoplastics [4]. The generated heat spreads around and promotes the melting of both upper and lower thermoplastics [5,6]. A cohesive joining forms between plastics after solidification [7,8]. In this process, the heat generation caused by laser and materials interaction is crucial for high-quality welding [9].
The method of thermal imaging monitoring and simulation has been investigated by numerous researchers to get an accurate temperature in the joint. For example, Martan et al. [10] established a new measurement system with a medium-wave/short-wave IR camera for infrared radiation investigation in the process of LTW. However, the temperature measured by these methods is lower than the actual temperature. This is because the emitted heat radiation for the given temperature during welding has a spectral emittance in the mid-wavelength infrared region [11]. The absorption of transparent thermoplastic restricts the heat radiation from the interface to the surroundings, and the tested surface temperature is lower than the actual temperature in the joint [10]. As published by Goyal et al. [12], the temperature tested directly by the thermal imaging camera is below 85°C, the melting of thermoplastics cannot occur at this time. A similar phenomenon existed according to Mayboudi et al. [13].
Simulation is an appealing method to analyse the temperature distribution during laser welding. Van Elsen et al. [14] described the solution of the heat conduction equation for the application of the heat source model in the process of laser material processing. To investigate the effects of process parameters on the LTW of PA 6, Prabhakaran et al. [15] solved the one-dimensional unsteady-state heat conduction problem by numerical simulation. Chen et al. [9] established a hybrid heat source model for predicting the temperature distribution during LTW of fiberglass-doped PP and ABS. The challenge mainly arises from the complex surroundings. Especially, most of the heat input is modelled based on the laser beam energy distribution and the interaction between laser materials has not been considered [4].
Recently, the metal powder is selected as a novel and eco-friendly laser-absorbent to carry out LTW of thermoplastics [12,16,17]. The change in metal powder diameter affects the multiple reflections during laser-material interaction and further determines the temperature level which is essential for good welding. Unfortunately, there are limited studies about the formation of heat generation by metal powder.
Herein, an integrated hybrid methodology is applied to investigate the temperature profile of LTW when MZA powder is used as the laser-absorbents. Firstly, a mathematical model is established to describe the heat generation during laser-MZA powder interaction. Secondly, we remove the upper thermoplastic for recording heat infrared radiation caused by laser-MZA powder interaction. The experimentally measured temperature is compared with the numerically computed temperature to verify the correctness of the established mathematical model. Finally, the verified mathematical model is used to investigate the temperature profile of the LTW process by numerical simulation, and the welding experiments are carried out based on the numerically computed results.
Materials and method
Materials preparation
The physical properties of PASF and PC.
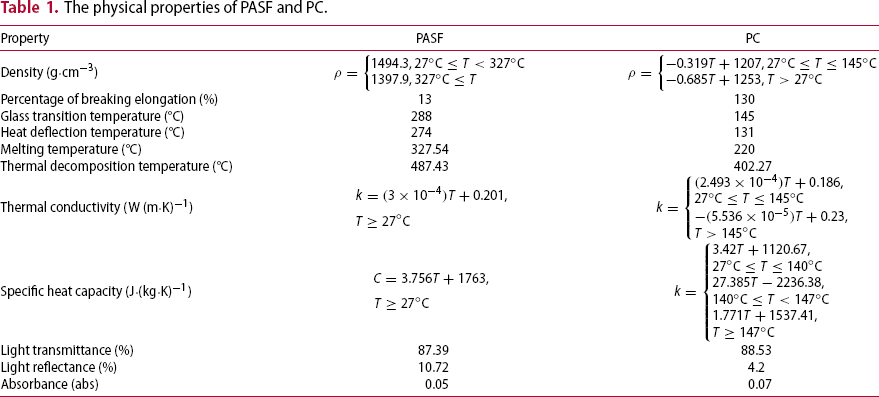
The magnesium zinc alloy (MZA) powder (99%) with spherical particles was provided by Changsha Tianjiu Metal Materials company, China. The MZA powder was embedded into the PC as the laser-absorbents. Based on the average powder diameter, the MZA powder was divided into three groups,10 µm, 30 µm, and 48 µm. The MZA powder was ball milled for 3 h in the QM-3SP4 planetary to avoid reunion.
The establishment and verification of the mathematical model
Interaction between laser and metal powder
As reported by Fischer et al. [18], the optical penetration depths of powders are deeper than that of bulks. In the process of laser-metal powder interaction, absorption occurs when a laser strikes powder layers. The trace following method is used to investigate the effect of multiple refractions of laser-MZA powder interaction by the optical simulation software TracePro73. As shown in Figure S2, complex interaction occurs when a normal incident laser irradiation onto the powder layer. The enlarged figure sketches the process of light transmission in the metal powder layer: a portion of light may be reflected, and another portion of light may be absorbed or diffused and transmitted. In this process, the diameter of metal powder has a significant influence on laser absorptivity [19].
Equation (1) provides an approach to calculate the laser absorption of metal powder laser-absorbents [20].

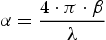
The laser transmitted into the interior of the metal powder decays exponentially with distance. Comparing with the plane wave equation and Beer–Lambert law [21], it can be concluded that the absorption coefficient (α) reflects the attenuation of light intensity, and it is proportional to the imaginary part of the refractive index. The imaginary part of the refractive index is commonly called the optical extinction coefficient (β). The relationship between the absorption coefficient (α) and the optical extinction coefficient can be expressed as:
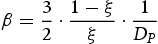
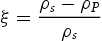
 and
and  are the density of the lumpy solid and the metal powder, respectively. It is normally assumed that the porosity varies from ξ = 0.4 ∼ 0.6 for the powder state to ξ = 0 for the solid state [23].
The established mathematical model
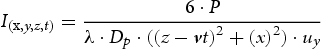
The energy distribution of the laser is close to the Flat-top laser beam, which is uniform. Xu et al. [24] and Ayoola et al. [25] claimed the average power density could be used to calculate the energy generation and distribution, so the intensity gradient Ir of volume laser heat source is expressed as Equation (5) [26]:

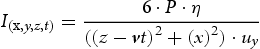
In the welding process, Dong et al. [23] defined the laser trace as a function of the laser velocity and welding time in the Cartesian coordinate system. The volume laser heat source can be rewritten as Equation (6), which includes the combined effect of wavelength (λ) and powder diameter (Dp)

Where k0 is a fitting parameter. The value of k0 with 0.6 is determined by the numerically simulated and experimentally measured temperatures.
Equation (6) can be rewritten as follows:
Validation of the mathematical model
Figure 1(a) shows the experimental schematic diagram for measuring LTW temperature, which is composed of EB-DDLM 100A diode laser with the continuous wave, infrared thermal camera (MAG32, MAGNITYT) with a spectral range of 7.5 µm –14 µm, CNC machine, control system. The technical parameters of the diode laser are provided in Table S1. The infrared thermal camera has a 384 × 288 uncooled focal plane array detector. The thermal sensitivity given by the conductor is 2°C at room temperature. The ThermaScope-v3.1.1.2 software is used to process the obtained IR images. The diode laser and CNC machine are integrated with a computer control system to achieve real-time control. The infrared thermal camera is fixed at the left of the laser head. To reduce the calculation of numerical simulation, only half of the physical model is concerned. Figure 1(b) shows a simplified physical model with a length of 10 mm, width of 6 mm, and thickness of 2 mm. Figure 1(c) shows the adaptive mesh.
The experimental schematic diagram for the measurement of temperature (a), the simplification and size of the established physical model (b), and the adaptive mesh of the simplified physical model (c).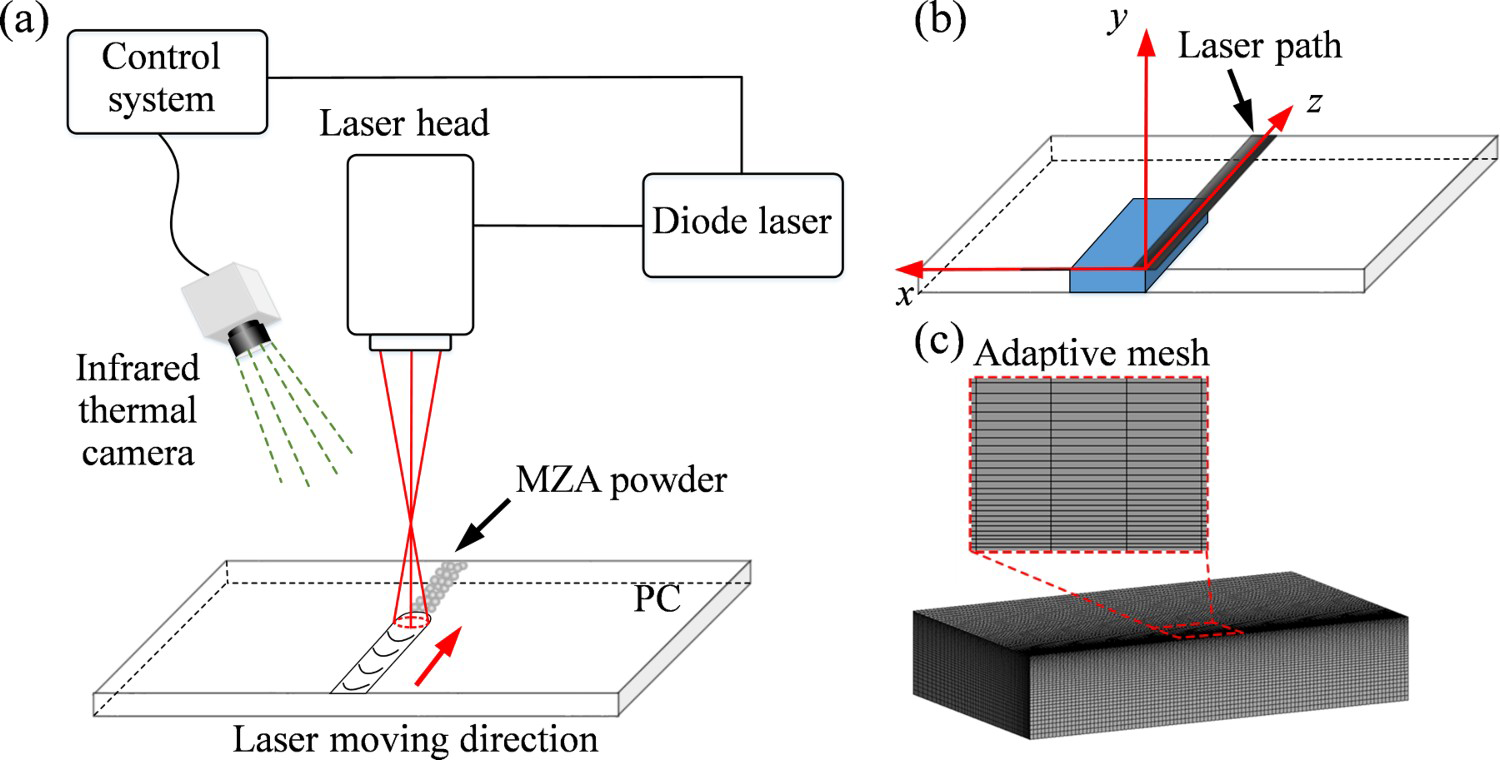
In the process of laser-MZA powder interaction, the applied line energy density is 1.33 J/mm, 1.57 J/mm, 2 J/mm, 2.33 J/mm, and 2.67 J/mm, which is defined as the ratio of laser power to welding speed [29,30], and the spot diameter is 3 mm.
The thermal modelling of LTW
The thermal modelling of LTW is based on the first law of thermodynamics, and the process is provided in the supporting information. The non-steady-state temperature field is calculated through ANSYS software. As for the established physical model, the contact area has a finer mesh with a size of 0.1 mm, while the remainder has a rough mesh with a size of 0.5 mm. This division facilitates the reduction of computational effort based on guaranteed accuracy. The heat source is applied to the first layers of elements with the thickness (uy), because that the fact that load command (BFE) can only be applied to elements, not to surface in APDL [14].
The welding experiments
The welding experiments were carried out based on the simulated results. A pneumatic clamping device with a force of 0.6 MPa was used to ensure perfect contact between the PASF and PC. The PASF/PC weldments were cut and polished to determine the size of the joint by optical microscope (XTL-165-VT, Phenix, China).
Results and discussion
Calibration of emissivity
The infrared thermal camera measures temperature by recording the infrared radiation emitted from an object [12]. The camera captures and stores the thermal data as digital images, which are used to calculate the temperature of the object. The temperature is a function of emissivity, so the calibrating emissivity of MZA powder is crucial to predict temperature precisely [31]. Figure S1 shows the schematic of the step for the calibrating emissivity of MZA powder. When the temperature of the thermocouple is stable, adjust the emissivity coefficient of the infrared thermometer to ensure that the measured temperature is consistent with the thermostat temperature. To avoid the influence of the response time of the equipment, record the emissivity after each adjustment for 5 min. Figure 2(a) presents the IR image of the collected temperature distribution. Figure 2(b) presents the emissivity value when the measured temperature matched well with the thermoset temperature. Since the welding temperature is higher than 200°C, so we choose the emissivity as 0.44 for further measurement.
The IR image of collected temperature distribution (a) and the tested emissivity of MZA powder at different thermostat temperatures (b).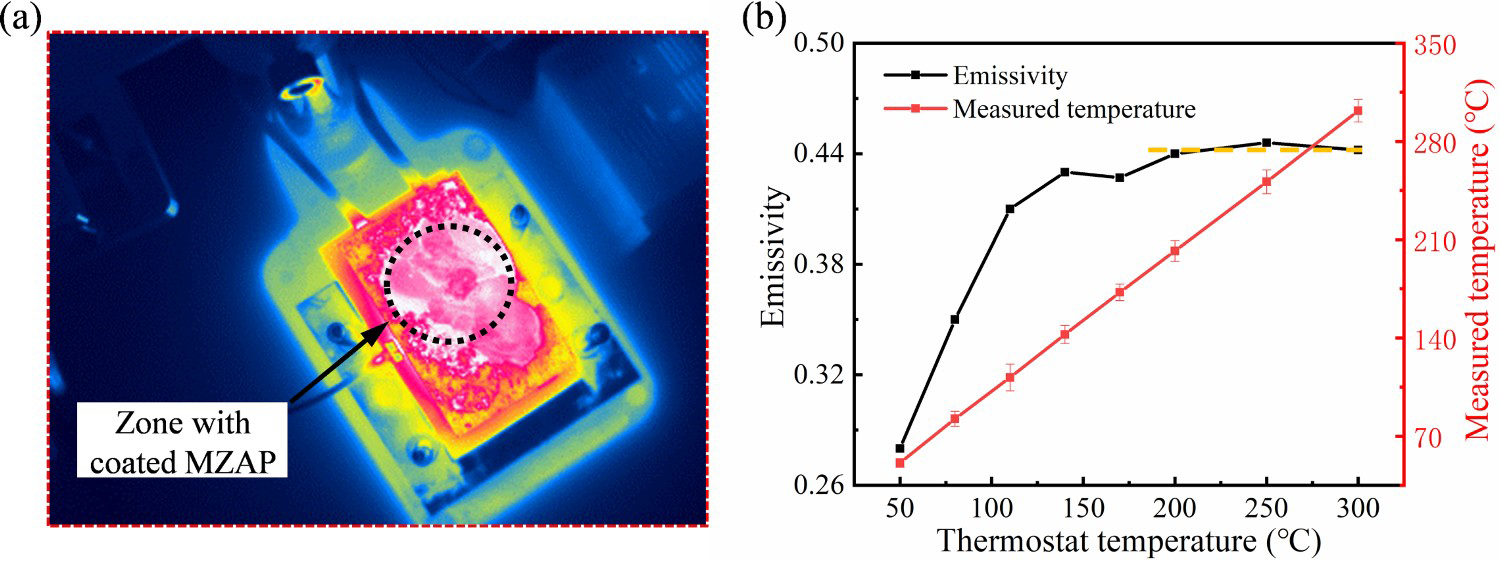
The verification of the established mathematical model
The temperature profiles parallel and perpendicular to the laser moving direction are recorded in the process of laser-MZA powder. For the parallel direction, three different locations (Point 1, Point 2, and Point 3) are selected and marked with red, blue, and orange dots in Figure 3(a). The choice of these location nodes is based on the start, middle, and end time of the welding process. For perpendicular direction, the middle area is selected and marked as the red dotted lines. In the laser-MZA powder interaction process, the applied laser power is 14 W, the scanning speed is 6 mm/s, and the MZA powder diameter is 10 µm. The numerically computed and experimentally measured results are displayed in Figure 3(b) and (c), respectively. It is clear that the laser-irradiated zone has a significant max temperature, and the high-temperature zone moves with the laser beam according to the results in Figure 3(b). Ai et al. [32] also have a similar finding. The numerically computed max temperature is 345.45°C, which is 4.7°C lower than the experimentally measured temperature. In total, the numerically computed results are in consistent with the experimentally measured results in Figure 3(c).
The schematic diagram of location nodes and direction of temperature curves (a), the numerically computed (b), and experimentally measured (c) temperature distribution contours at location nodes. The numerically computed (d) and experimentally measured (e) curves of temperature vs. time, which are parallel to the laser moving direction. The numerically computed (f) and experimentally measured (g) curves of temperature vs. time, which are perpendicular to the laser moving direction.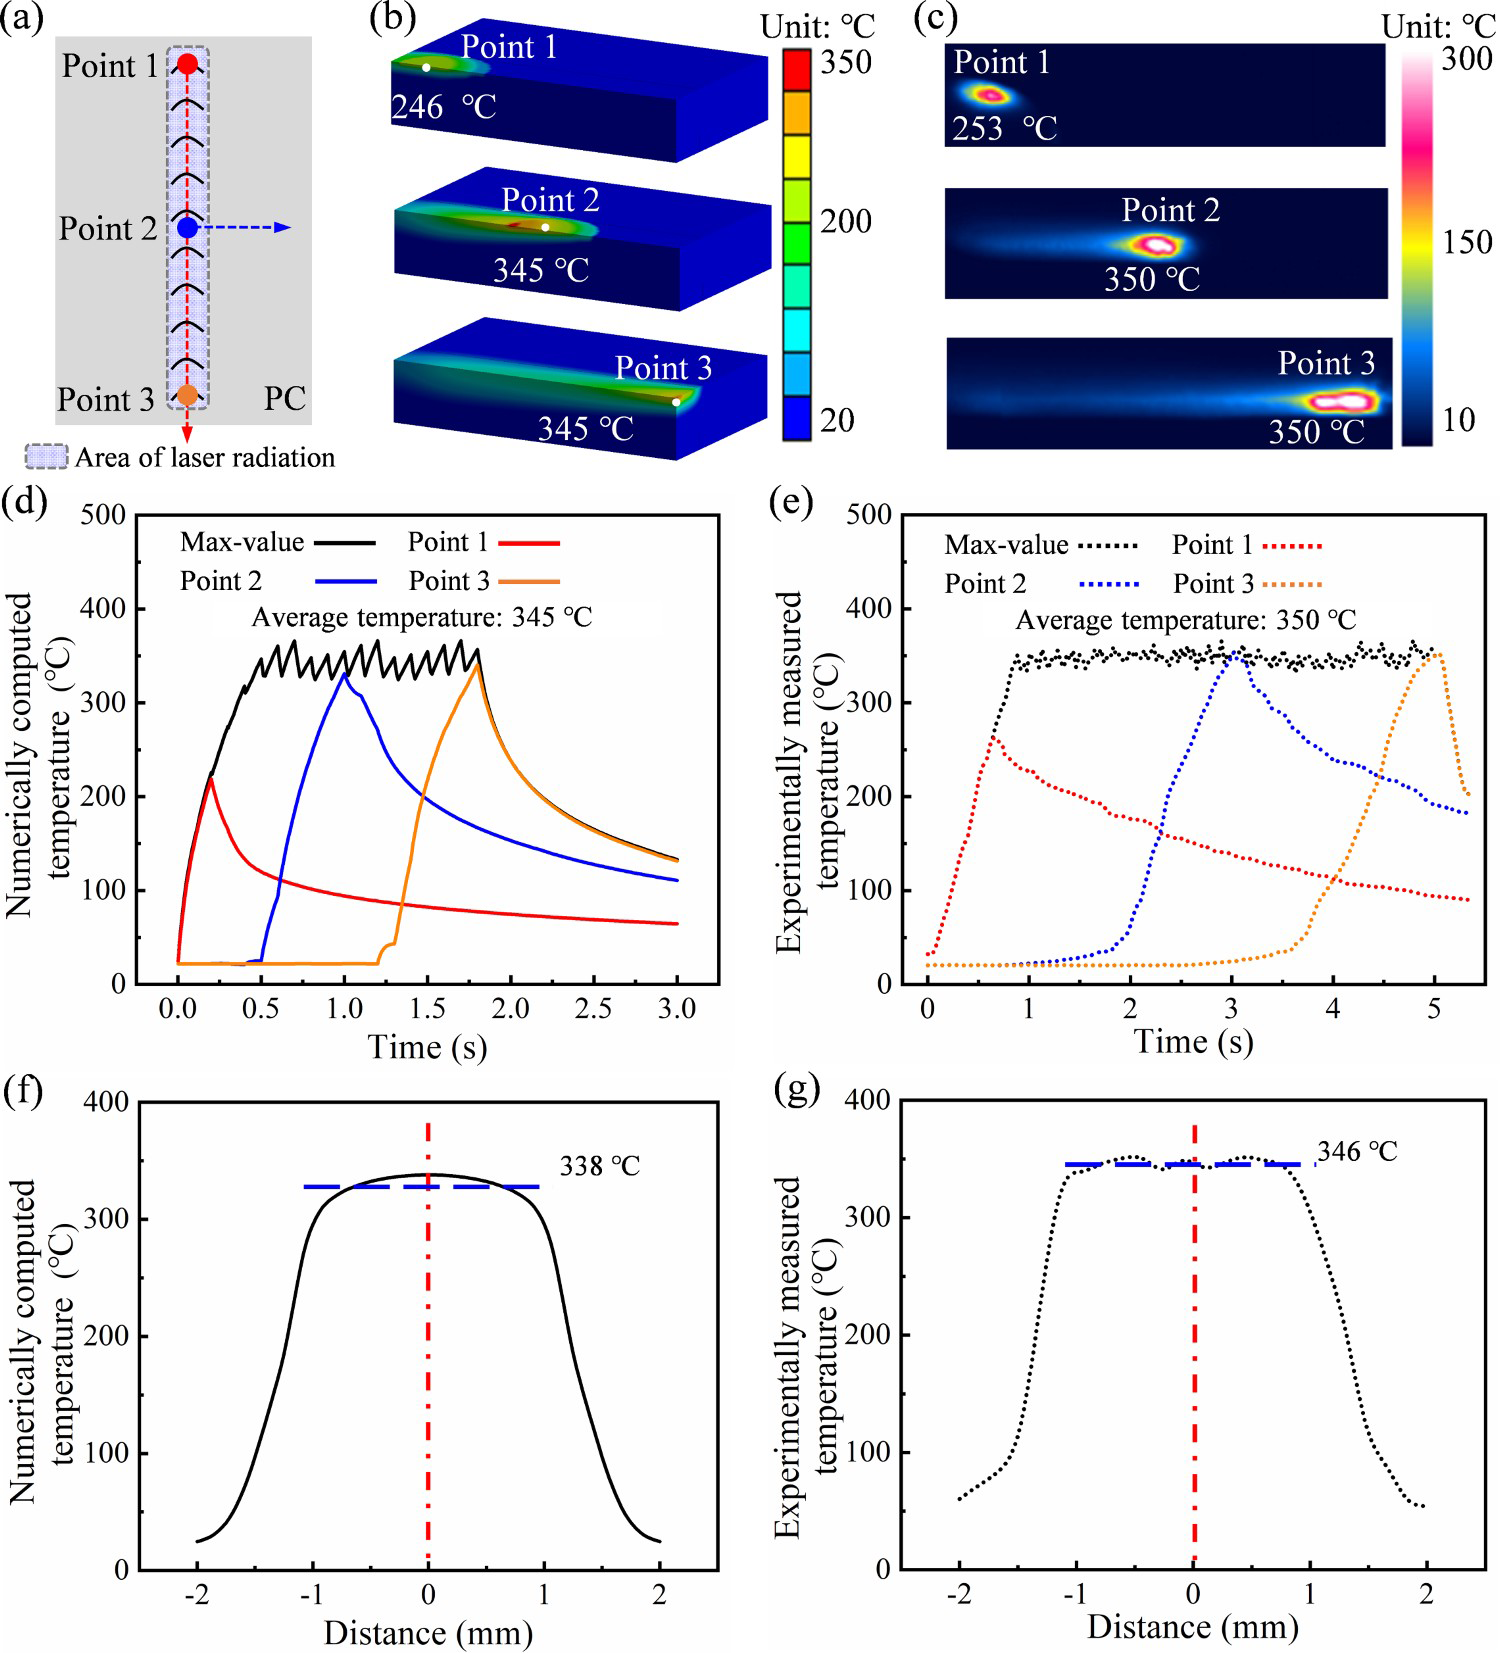
To verify the accuracy of the established mathematical model, Figure 3(d, e) presents the numerically computed and experimentally measured curves of temperature vs. time, respectively. The direction of temperature distribution is parallel to the laser moving radiation and marked as red dotted lines with an arrow. The curves include the max-value of temperature and the temperature variation on three selected points. In Figure 3(d), the numerically computed curves of temperature vs. time indicate that the average temperature of 345.45°C is achieved firstly at the time of 0.48 s, and then there is a fluctuation. When the time is 1.67 s, the laser moves to the end of the parts, and there is a rapid drop in temperature. Figure 3(e) presents experimentally measured results that the max temperature is 350°C at the time of 1 s. Compared with the numerically simulated results, there is a time delay of 0.52 s which is due to the time threshold of laser-MZA powder interaction. As for the selected location nodes, the curves of temperature vs. time are depicted with different types of coloured lines. Both numerically computed and experimentally measured results indicate that the cooling process is significantly slower than the heating process, which is caused by the low thermal conductivity of PASF and PC. Similar phenomena have been reported by Wang et al. [33].
Figure 3(f, g) presents the curves of temperature vs. time in the direction (marked as blue dotted lines with an arrow) perpendicular to the laser moving direction when the laser moves to Point 2. In total, it is clear the experimentally measured temperature is a little higher than the numerically computed temperature. The shape of numerically computed temperature distribution curves is consistent with the experimentally measured results. The red centre line represents the centre of the laser beam. The numerically computed temperature curves have symmetrical distribution, but there is a slight deviation from the experimentally measured temperature curves. This is caused by the fact that the energy distribution of the shaped top-hat beam is not uniform.
As for the MZA powder with different diameters, Figure 4(a) presents the numerically computed and experimentally measured average temperature with a constant laser line energy of 2.33 J/mm. The average temperature has a decreasing tendency with increasing the MZA powder diameter. According to Zhang et al. [19], this is due to the increased MZA powder diameter leading to a decrease in laser absorptivity. The results of mathematical statistics on average temperature indicate that the deviation between numerically computed and experimentally measured temperatures is about 5.2%. The high consistency of temperature further proves the established mathematical model can be used to describe the temperature generation during the interaction between the laser and MZA powder. As for the MZA powder with a diameter of 30 µm and 48 µm, the curves of temperature vs. time are displayed in the supplemental document of Figure S3 and Figure S4.
The comparison of average temperature by numerically computing and experimentally measuring as a function of MZA powder diameter (a) and laser line energy (b).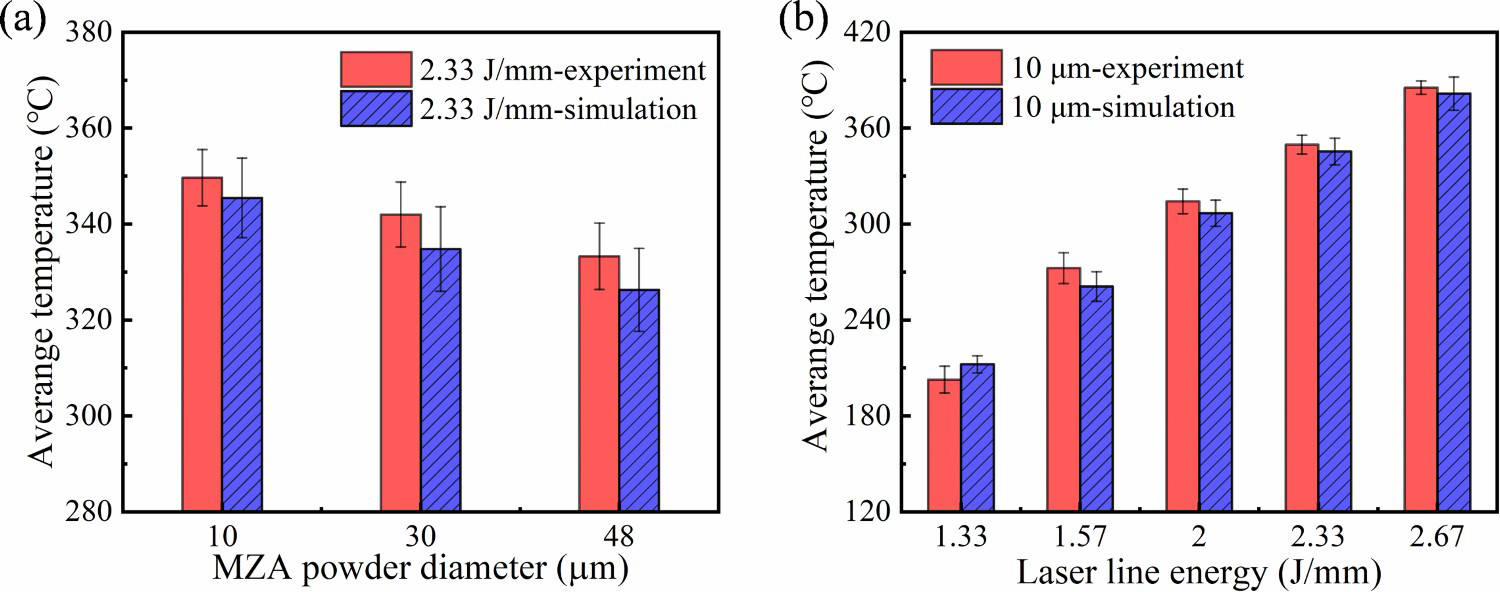
To further prove the established mathematical model is suitable for different process parameters, the numerically computed and experimentally measured temperatures are compared when the line energy density increases from 1.33 J/mm to 2.67 J/mm. Figure 4(b) presents that the temperature has an increasing tendency with the laser line energy increasing and the deviation of numerically computed and experimentally measured average temperature is less than 3.5%.
The temperature distribution of LTW process
The verified mathematical model is used to investigate the temperature distribution of LTW. The simulation is performed with a line energy density of 5 J/mm and the MZA powder diameter of 48 µm. The numerically computed temperature curve in Figure 5(a) indicates that the max temperature is 353.6°C when the time is 0.5 s. After that, the temperature fluctuates around the average value of 348.9 °C. Even though the welding is over when the time is 1.67 s, the temperature curve indicates that the max temperature of 360.41°C achieves at the time of 1.8 s. As published by Long et al. [34], this is because the lower thermal conductivities lead to hysteresis in the process of temperature transfer. The temperature still has a certain inertia to rise after the laser is applied. After the laser completes its path, the temperature rapidly decreases to 142.3°C at the time of 2.7 s. This temperature is lower than the glass transition temperature of PC at 145°C. The joint is completely frozen, and a stable joint forms.
The curve of temperature vs. time obtained by simulation (a), and the comparison of joint morphology from experiments and simulation (b).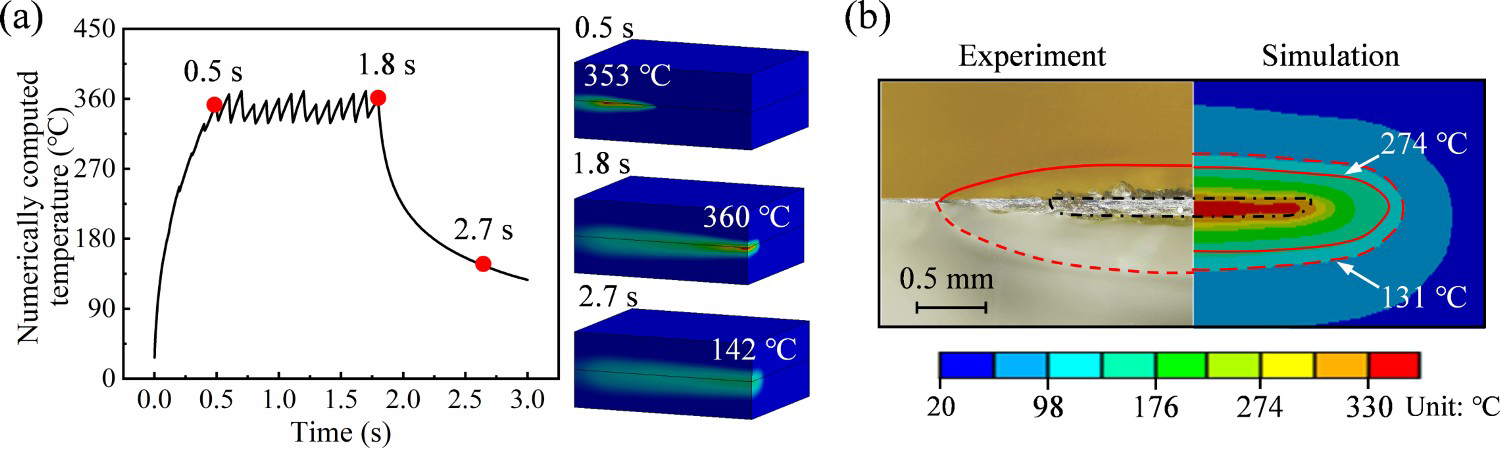
Furthermore, Figure 5(b) presents the joint morphology from experimentally measured and numerically computed. There is a conclusion that: (1) The core zone exhibits the highest temperature, up to 330°C, which contributes to the laser-MZA powder interaction. The result is consistent with the studies of Casalino et al. [35]. (2) The solid line with red in the numerically computed joint overlaps the boundary of an experimental joint in the PASF layer, and the numerically computed results show the boundary temperature is 274°C. (3) The dotted line with red in the numerically computed joint overlaps the boundary of an experimental joint in the PC layer, and the numerically computed results show the boundary temperature is 131°C. Those prove that the established mathematical model can be used to calculate the heat generation of LTW when the MZA powder is used as laser-absorbents.
As published by Ali et al. [36], perfect fusion welding requires that the temperature is above the glass transition temperature and that materials are in the molten state. It is necessary to acquire the temperature in the welding, which helps to determine appropriate processing parameters. As for the MZA powder with a diameter of 10 µm, 30 µm, and 48 µm, the average of numerically computed temperature with the increasing line energy density is shown in Figure 6(a). When the line energy density is between 4 J/mm and 5.33 J/mm, the temperature is between 284°C and 379°C, which is higher than the glass transition temperature of both PASF and PC. There is a prediction that good welding can be achieved under these processing parameters, so the LTW experiments are performed.
The numerically computed LTW temperature at different powder diameters and line energies (a), the depth of HAZ (b), and the width of HAZ (c) as a function of MZA powder diameter.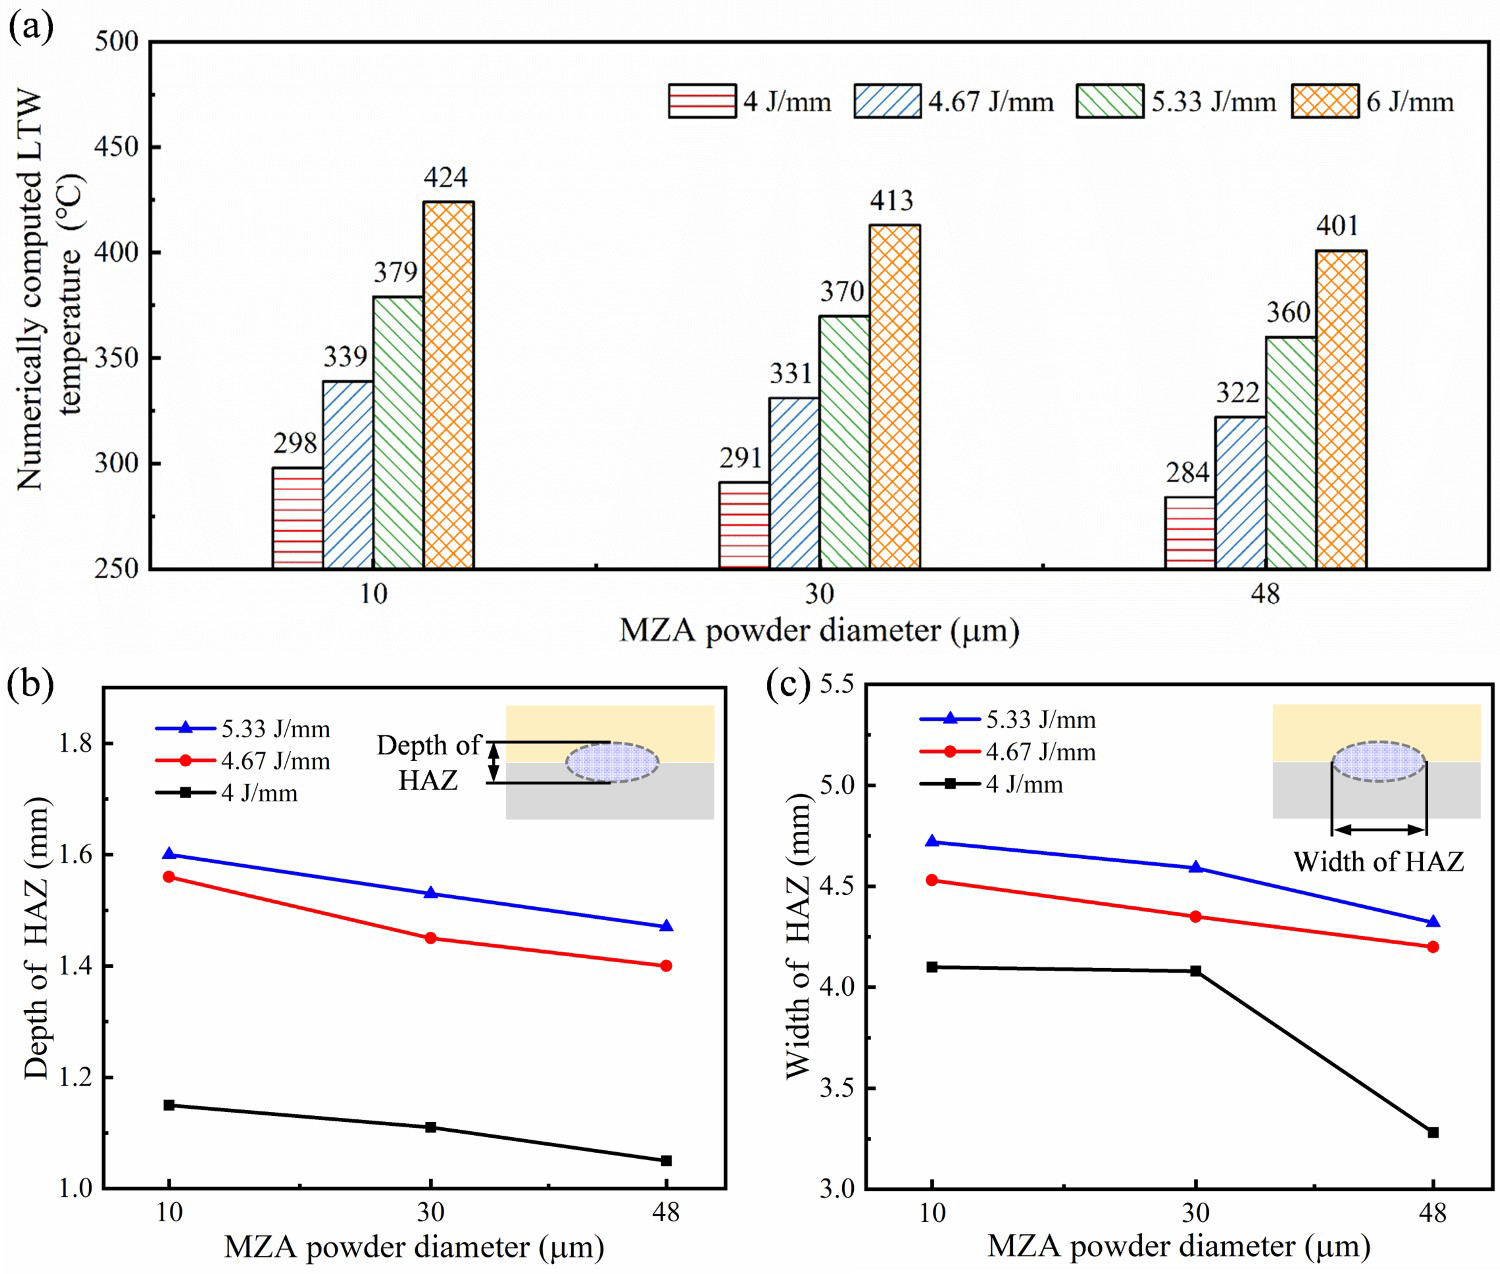
After welding, the joint of the weldments were ground and polished before measuring the depth and width of the heat affect zone (HAZ). Figure 6(b, c) depicts the depth of HAZ and width of HAZ as a function of MZA powder diameter, respectively. The line energy density with 5.33 J/mm, 4.67 J/mm, and 4 J/mm was applied to fabricate the weldment. As for the constant line energy density, the weldments with an MZA powder diameter of 48 µm have the smallest values of depth and width of HAZ. With the MZA powder diameter decreasing, the depth and width of HAZ increase. These further indicate that the increased MZA powder diameter reduces the temperature level which is due to the larger powder diameter reducing the absorption. It refers to the attention of the black area in the supplemental document of Figure S5, which indicates the occurrence of thermal degradation. Although, the numerically computed temperature of 379 °C is lower than the decomposition temperature of PC with 402.27 °C at this time. Das et al. [37] and Paran et al. [38] claim that the thermal degradation of thermoplastics always presents in the welding process. There is a conclusion that the line energy density should be lower than 5.33 J/mm for the MZA powder with a diameter of 10 µm.
Conclusions
The established mathematical model could predict the temperature profile precisely with considering the laser-MZA powder interaction, and its accuracy is verified by the measured temperature when removing the upper thermoplastic. The deviation of average temperature is within 5.2%, indicating that the established mathematical model can be used to predict heat generation. The numerical simulation clarifies the temperature level of the LTW process and determines the effect of process parameters on temperature variation. When the laser line energy is between 4.67 J/mm and 5.33 J/mm, the numerically computed LTW temperature is between 322°C and 379°C. The temperature decreases with increasing the powder diameter or lowering the laser line energy density. This proposed model could provide guidelines for high-quality welding of thermoplastics using MZA powder.
Footnotes
Disclosure statement
No potential conflict of interest was reported by the authors.