
Abstract
To substantially reduce the cost of extracting petroleum from ultra-deepwater sources, manufacturing risers from 7175 aluminium (Al) alloys rather than steels is being considered. Friction stir welding (FSW), a solid-phase joining technique, is widely applied to 7XXX Al alloys because its mechanical properties are retained within the nugget zone. And, the primary technical objective of the current study is the development of high-strength, corrosion-resistant weldments that connect 7175 Al riser flanges and pipes. However, as the welding thickness increases, the welding speed can be greatly impeded, which lowers the manufacturing efficiency and weakens the mechanical properties in the heat affected zone (next to the nugget). Therefore, obtaining high-performance thick plate 7175 Al alloy joints via FSW is challenging. To overcome this dilemma, the current work optimises the tool design and welding parameters for achieving high-performance joints between 25.4 mm thick 7175 Al alloy plates in butt joint configuration.
Keywords
Introduction
The U. S. offshore federal petroleum production in Fiscal Year 2020 reached approximately 641 million barrels, which accounts for ∼15% of overall domestic petroleum production [1]. Various types of risers (specially constructed pipes) are used to transport produced petroleum as well as production materials (i.e. injection fluids, control fluids, etc.) between seafloor and the surface drilling facilities. Financial analysis has shown that replacing steel production risers with aluminium is a promising approach to dramatically improve the economics of oil production from ultra-deepwater resources [2,3]. Specific benefits of aluminium risers include ∼34% weight reduction compared to steel, higher strength-to-weight ratio, lower string tensioning force, reduced deck load per foot of riser, and reduced transport costs which all lead to deeper and more cost-effective drilling capability. And, high-strength aluminium alloys (i.e. 7XXX aluminium alloys) stand out in energy efficiency owing to their high specific strength (strength-to-weight ratio) and corrosion resistance and have been adopted by deepwater riser manufacturers [4,5]. Therefore, a reliable welding method for joining thick, high-strength aluminium alloys is required. However, 7XXX aluminium alloys generally exhibit poor fusion weldability as a result of their high crack susceptibility and high thermal expansion coefficient, and because alloying elements Zn and Mg have low vaporisation temperatures, which increase their susceptibility to weld defects such as cracks and pores [6].
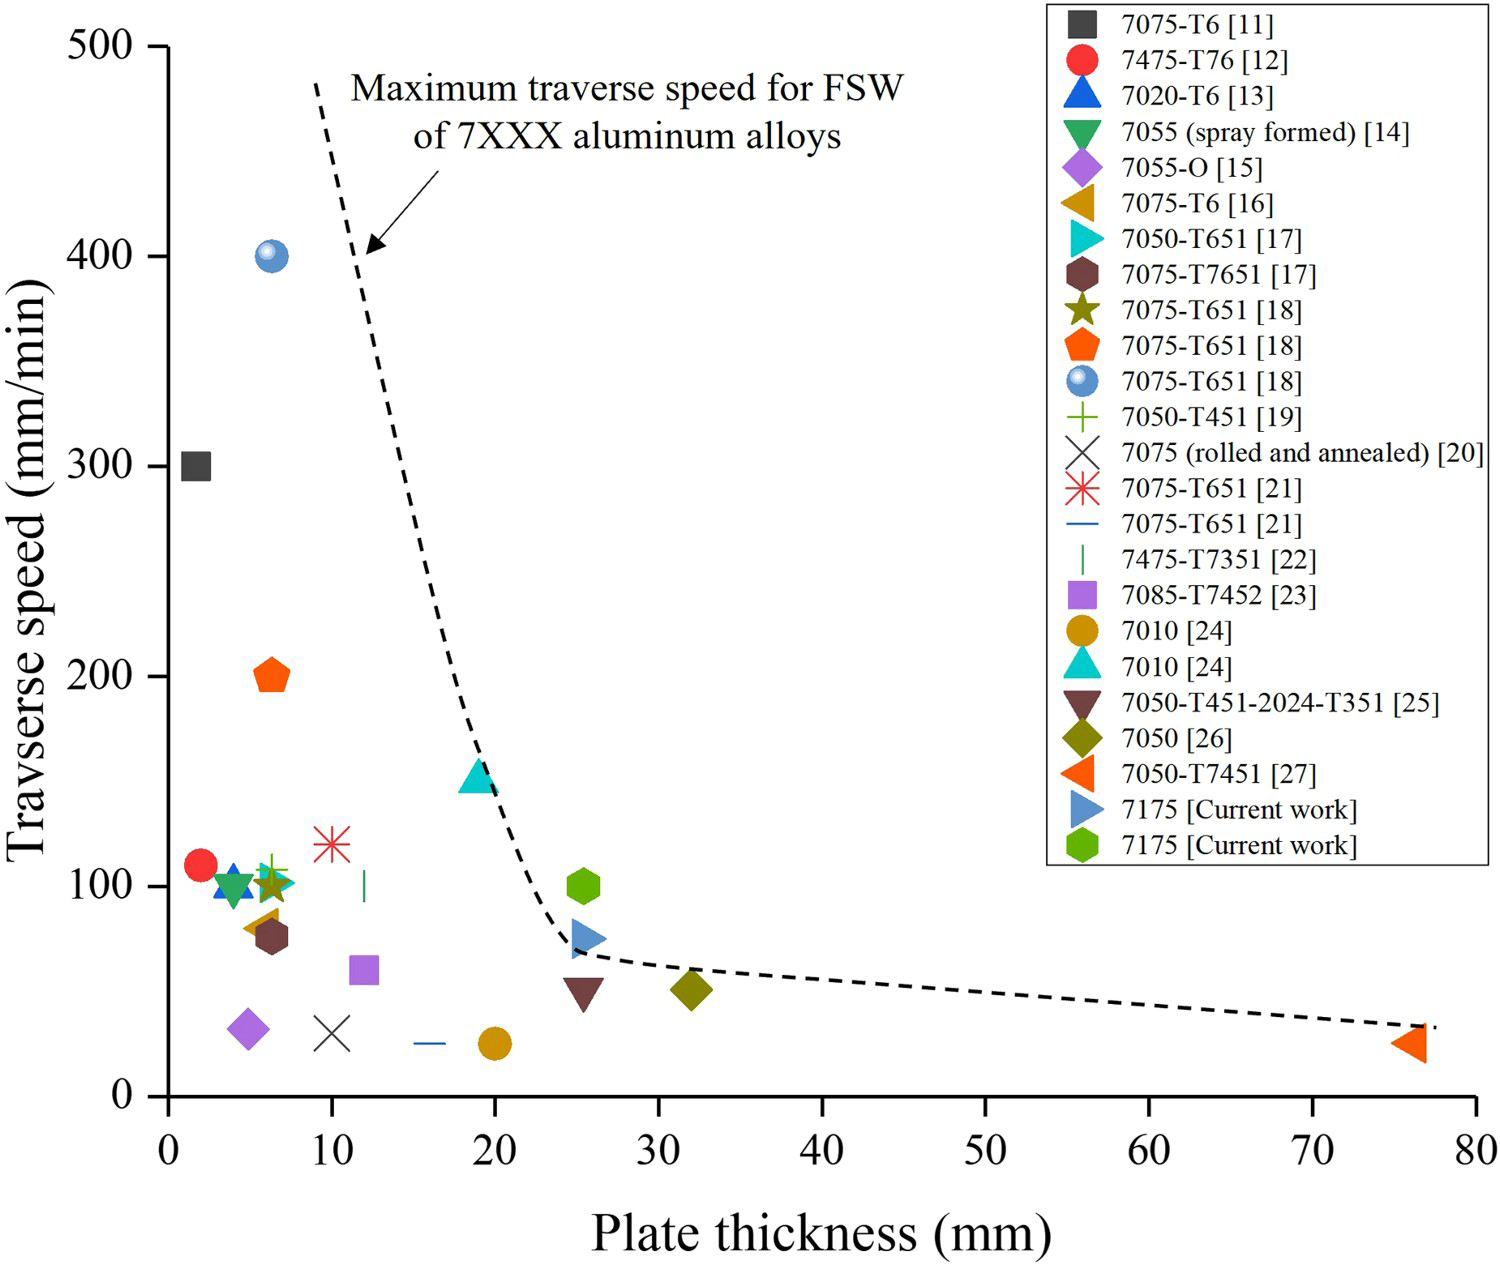
Unlike conventional fusion-based welding processes, friction stir welding (FSW) is a solid-phase welding technique, which has been proved to be one of the most effective welding methods for aluminium alloys over a wide range of thicknesses [7]. According to the literature, the maximum traverse speed of the FSW tool declines rapidly as the workpiece thickness increases (see Figure 1). The reduction in traverse speed generally results in a higher peak temperature and wider heat affected zone (HAZ), which degrades the joint's mechanical performance [8,9]. Therefore, an enhancement in the traverse speed of FSW on thick 7XXX Al alloy is greatly needed to improve the joint performance of thick workpieces of 7XXX Al alloys.
In the current study, six different FSW tool designs based on the collective experience of the project partners were investigated. The tool designs were subsequently narrowed down to two based on weld surface appearance, weld defects, geometry of the weld nugget, tensile properties, and the machine forces generated during the weld. The two favourable tool designs were applied over various welding temperatures and weld speeds to determine their effectiveness. The constant welding temperatures for various welds are achieved by the implementation of a robust temperature control algorithm. Detailed explanation regarding this temperature control algorithm can be foundin literature [10]. Our investigation determined that increasing the welding speed and decreasing the welding temperature of the FSW process have the greatest potential to influence the mechanical performance of the weldment. Meanwhile, the current study paves the road for high-speed FSW of high-strength aluminium alloys with thicknesses ≥ 25 mm and will guide further research on economical tool design in application-specific FSW.
FSW tooling features
Six different tools were designed with similar dimensions for the tool shoulder diameter (35.3 mm) and pin length (25 mm) but having various pin diameters and different shoulder and pin (threads with flats/flutes) features. Detailed tool dimensions and features are displayed and described in Supplementary Material (Figure S1, and Table S1). Note that the effect of tool geometric features on friction stir weld response parameters has been reported in our previous study [28]. All the tools were manufactured from alloy MP159. A K-type thermocouple was embedded in the shoulder at its surface to control the welding at a specified temperature.
FSW parameters
In the first part of this study, Tools #1–6 were applied to conduct FSW with the same welding parameters: welding temperature was held constant at 450 °C, and the welding traverse speed was 75 mm/min. For the second part of the work, Tools #5 and #6 were down selected. Different welding temperatures (425, 450, and 470 °C) and traverse speeds (75 and 100 mm/min) were applied to study the effects of welding parameters on the forces during FSW and the joints’ mechanicalperformance. It is important to note that the FSW tool temperature was controlled by dynamically modulating the spindle torque from the current supply to the servo motor, which dictates the spindle's rotational speed in a feedback loop [10]. As a result, to maintain a steady temperature of 425, 450, and 470 °C, the corresponding rotational speeds ranged from 80 to 90 RPM, 95–110 RPM, and 115–130 RPM, respectively. The specific rotational speed was influenced by the tool's features and their effect on plasticising materials at a given temperature and welding speed.
Sample preparation
After performing FSW on 25.4 mm thick AA7175-T79 (nominal composition in percent weight [wt.%] is 5.1–6.1 Zn, 2.1–2.9 Mg, 1.2–2.0 Cu, 0.18–0.28 Cr, 0.15 Si, 0.20 Fe, 0.10 Mn, 0.10 titanium with balance Al), the processed plate was then stored at −60 °C right after FSW to inhibit the evolution of precipitates. The welded plates were then cross sectioned, polished, and analysed under optical microscopy for processing defects. Cross-weld tensile testing of the welds in as-welded condition was performed on an MTS 222 kN servo hydraulic test frame per ASTM B557-15 [29]. Quasi-static conditions were maintained using a crosshead displacement rate of 5.1 mm/min. A Correlated Solutions stereoscopic digital image correlation system and VIC-3D analysis software were used to quantify strain. Three replicates were tested for each weld condition.
Surface appearances of runs made by (a) Tool #1, (b) Tool #2, (c) Tool #3, (d) Tool #4, (e) Tool #5, and (f) Tool #6 using constant a welding temperature of 450 °C and constant traverse speed of 75 mm/min; (g) forces in x, y, and z axes during runs displayed in Figure 2(a–f).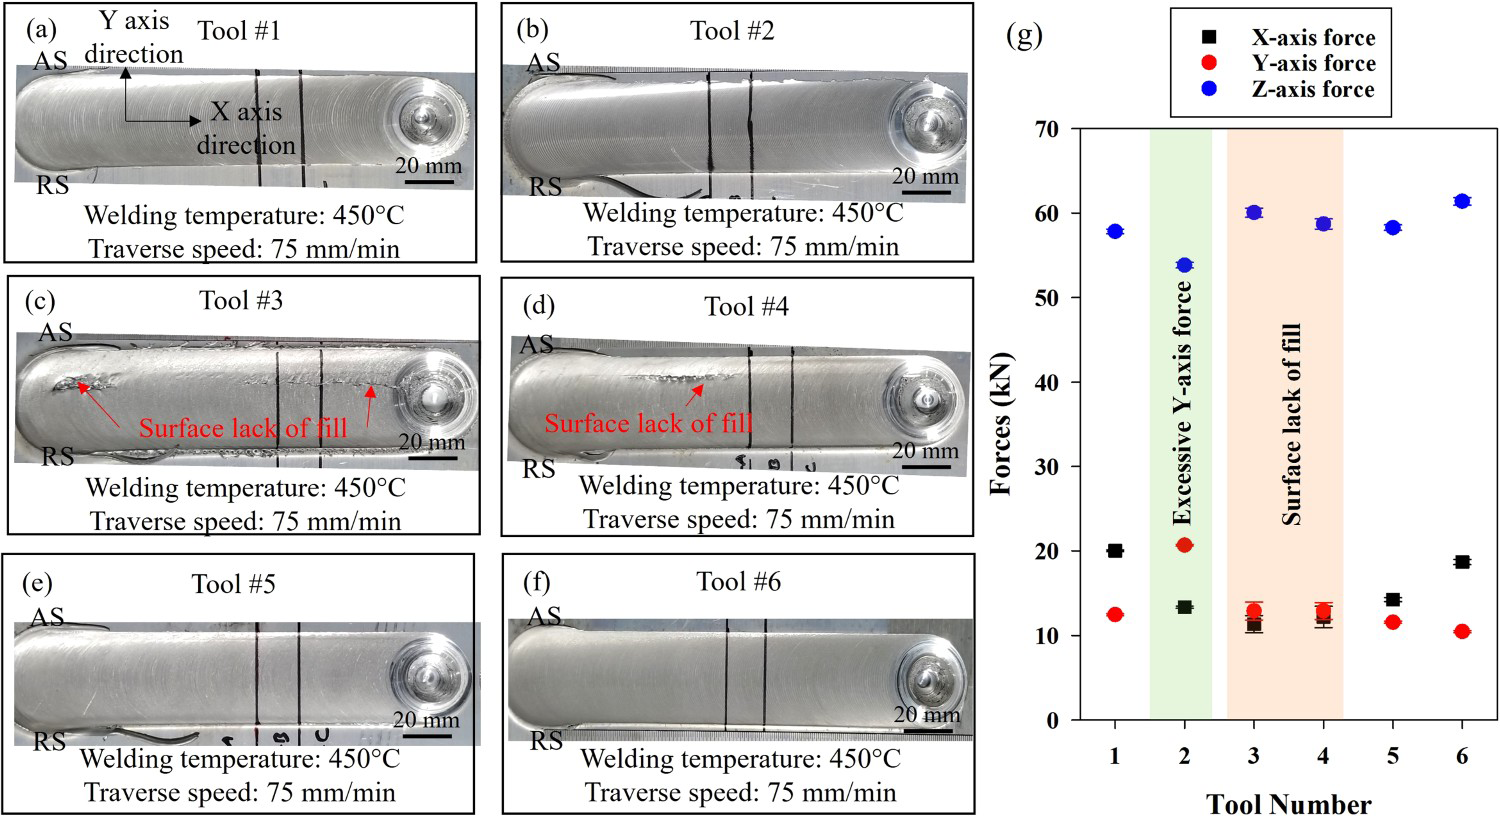
Effects of tool features on weld quality and process variables
The surface appearance of welds made with each of the six tools is illustrated in Figure 2. Welding temperature was controlled at 450 °C and a constant traverse speed of 75 mm/min was applied. As can be observed in Figure 2, welds by Tools 3 and 4 exhibited surface lack-of-fill defects. The occurrence of such defects could be linked to the flowability of materials with coarser and deeper thread geometry, as well as the larger projected areas of the pins on Tool 3 and 4, which result in a slightly higher swept volume. Nevertheless, the authors attempted to minimise the effect of differences in swept volume as a variable. When compensated for shoulder geometry features (as indicated in Table S1), the difference in swept volume among Tools 1, 2, 5, and 6 is insignificant (less than 2%). Generally, the threads on FSW pins are designed to effectively move material downward to the weld bottom to produce a sound joint and eliminate voids near the weld root. If too much material is being transported downward by aggressive threads, surface lack-of-fill defects are created because material is lacking near the weld crown at the interface with the tool shoulder. With the evidence from Figure 2, Tools # 3 and 4 were eliminated from further investigation for their inability to produce defect-free welds.
In addition, x-axis, y-axis, and z-axis force data from the machine during FSW were compared among the different tools and used as criteria for further screening of tool design by eliminating some. The x-axis and y-axis direction were labelled in Figure 2(a), and z-axis direction is into the page. Figure 2(a–g) summarises the process response variables (x, y, and z axis forces) with average values for each welding condition using all six tools. Interestingly, Tool # 2 exhibited excessive y-axis force. The y-axis force on a FSW tool acts in a direction perpendicular to the welding direction due as material is extruded along the retreating side (RS) from the leading to the trailing edge. This y-axis force is attributed to the flow resistance of material as it is continuously extruded from the advancing side (AS) and deposited behind as the tool traverses. Higher y-force is undesirable; it contributes to additional pressure on the pin from the RS to the AS, which can induce workpiece spreading, especially in butt welding [30]. Although no surface defect was observed for Tool #2, it was eliminated from further investigation since the previous study has shown that higher y-axis force tends to induce defects [28]. It is worth highlighting that the fluctuation of the X- and Y-axis forces, as depicted by the error bars in Figure 2(g), is more pronounced for Tools #3 and #4, and is likely associated with the formation of surface lack of fill defects.
Effects of tool features on mechanical properties of joints
Based on the results described in the previous section, Tool #1, Tool #5, and Tool #6 underwent tensile testing with the results displayed in Figure 3. Three samples were tested for each condition, and the tensile testing curves are displayed in Figure 3(a,b,c). The authors acknowledge that strain does not represent uniform deformation in a cross-weld tension test. Rather, the strain reported is the summation of localised strains from the weld nugget, HAZ and thermos-mechanical affected zone (TMAZ) on the AS and RS of the weld which individually have very different deformation responses. Most of the samples fractured through the HAZ on the RS, except one sample in the run made using Tool #6 fractured through the HAZ on the AS, as can be seen in fractured samples displayed in Figure 3(a,b,c). This observation on fracture location is consistent with the literature [16]. The optical image for each weld condition before testing is also included.
Tensile test curves and fracture samples for runs made by (a) Tool #1, (b) Tool #5, and (c) Tool #6. Optical images of cross sections of each run are also inset. Yield strength, tensile strength, and strain at fracture comparisons: (d) Tool #1, (e) Tool #5, and (f) Tool # 6.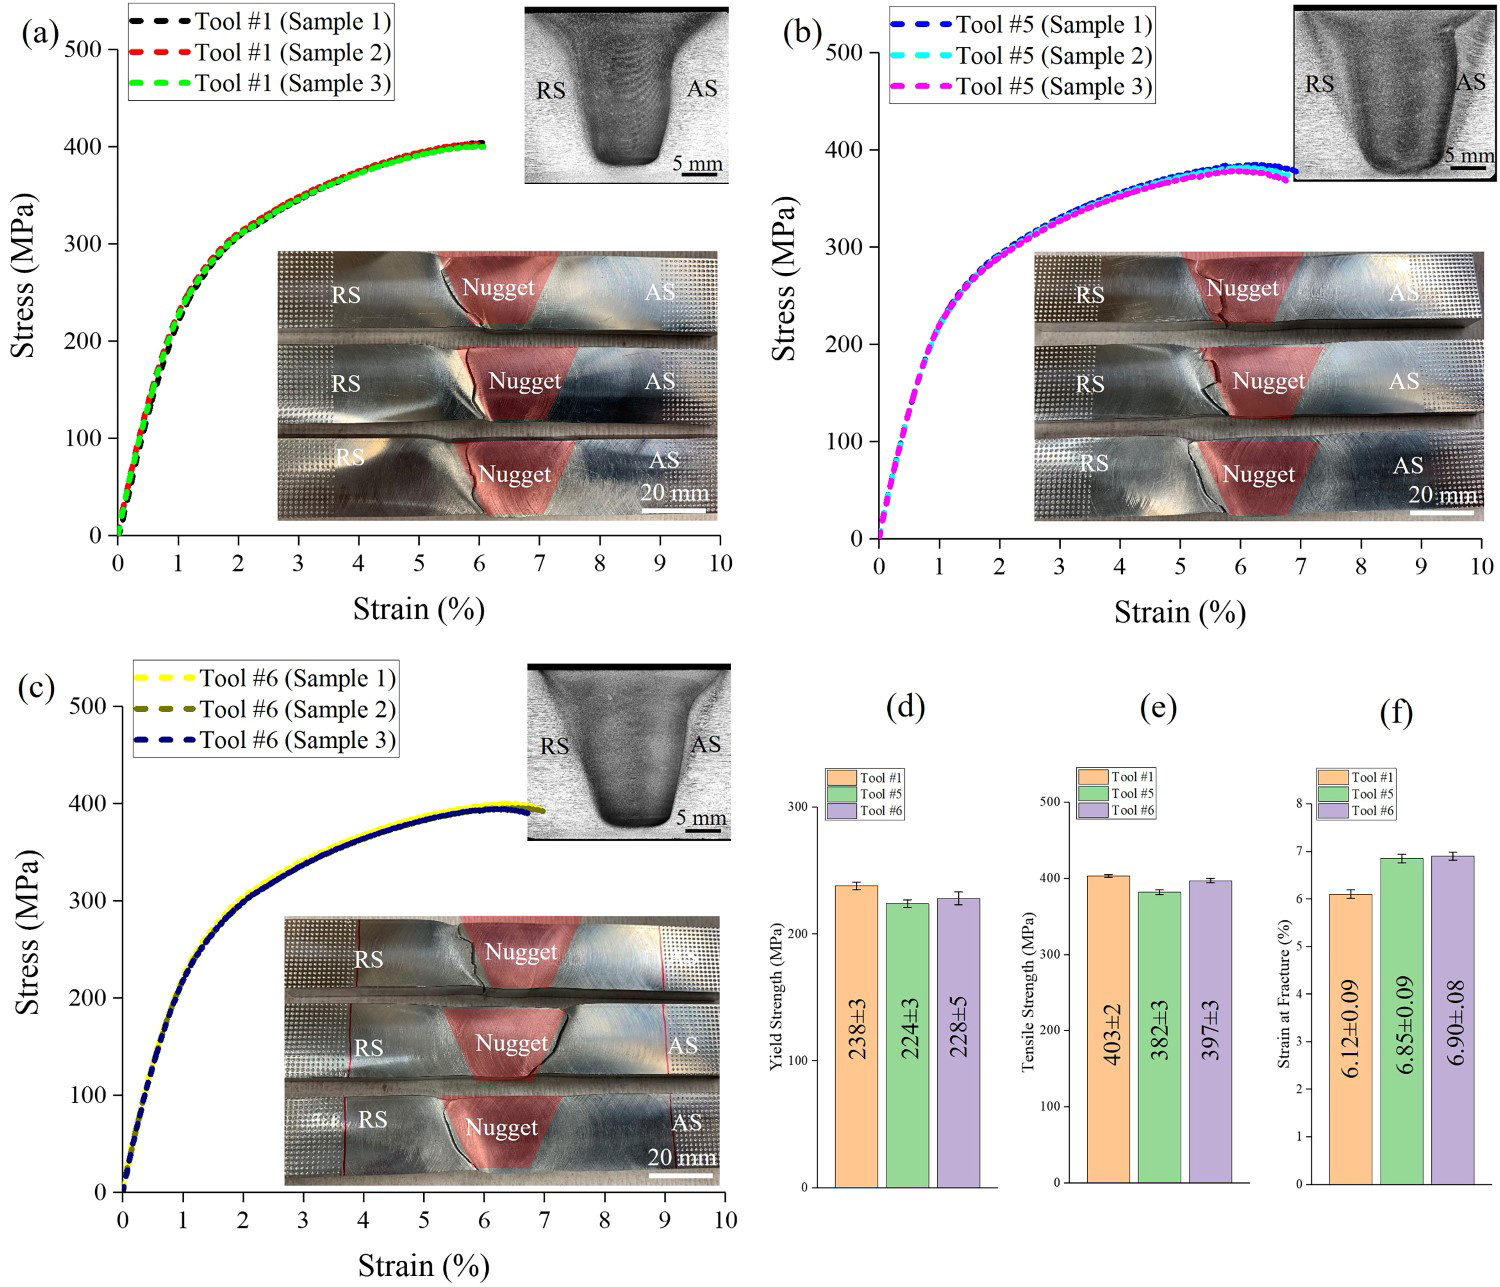
The mechanical properties of the runs made by Tools #1, #5, and #6 are compared in Figure 3(d,e,f). The runs made via Tool #1 have a slightly higher yield strength and tensile strength but a lower strain at fracture, as compared with runs made via Tool #5 and Tool #6. Tool #1 also tended to create a nugget with the plate bottom unprocessed, which can lead to lack of penetration, as shown in the optical image inset in Figure 3(a). Hence, this study subsequently undertook further investigation of FSW welding parameters for Tools #5 and #6.
This section describes variation of two primary process parameters, welding temperature, and traverse speed, to investigate their effects on machine forces on the x axis, y axis, and z axis. Welding traverse speed was either 75 mm/min or 100 mm/min, and welding temperature varied among 425, 450, and 470 °C for both Tool #5 and Tool #6. Figure 4(a–f) provide a summary of the average responses in the x-, y-, and z-axis forces, along with the corresponding variation (as represented by the error bars).
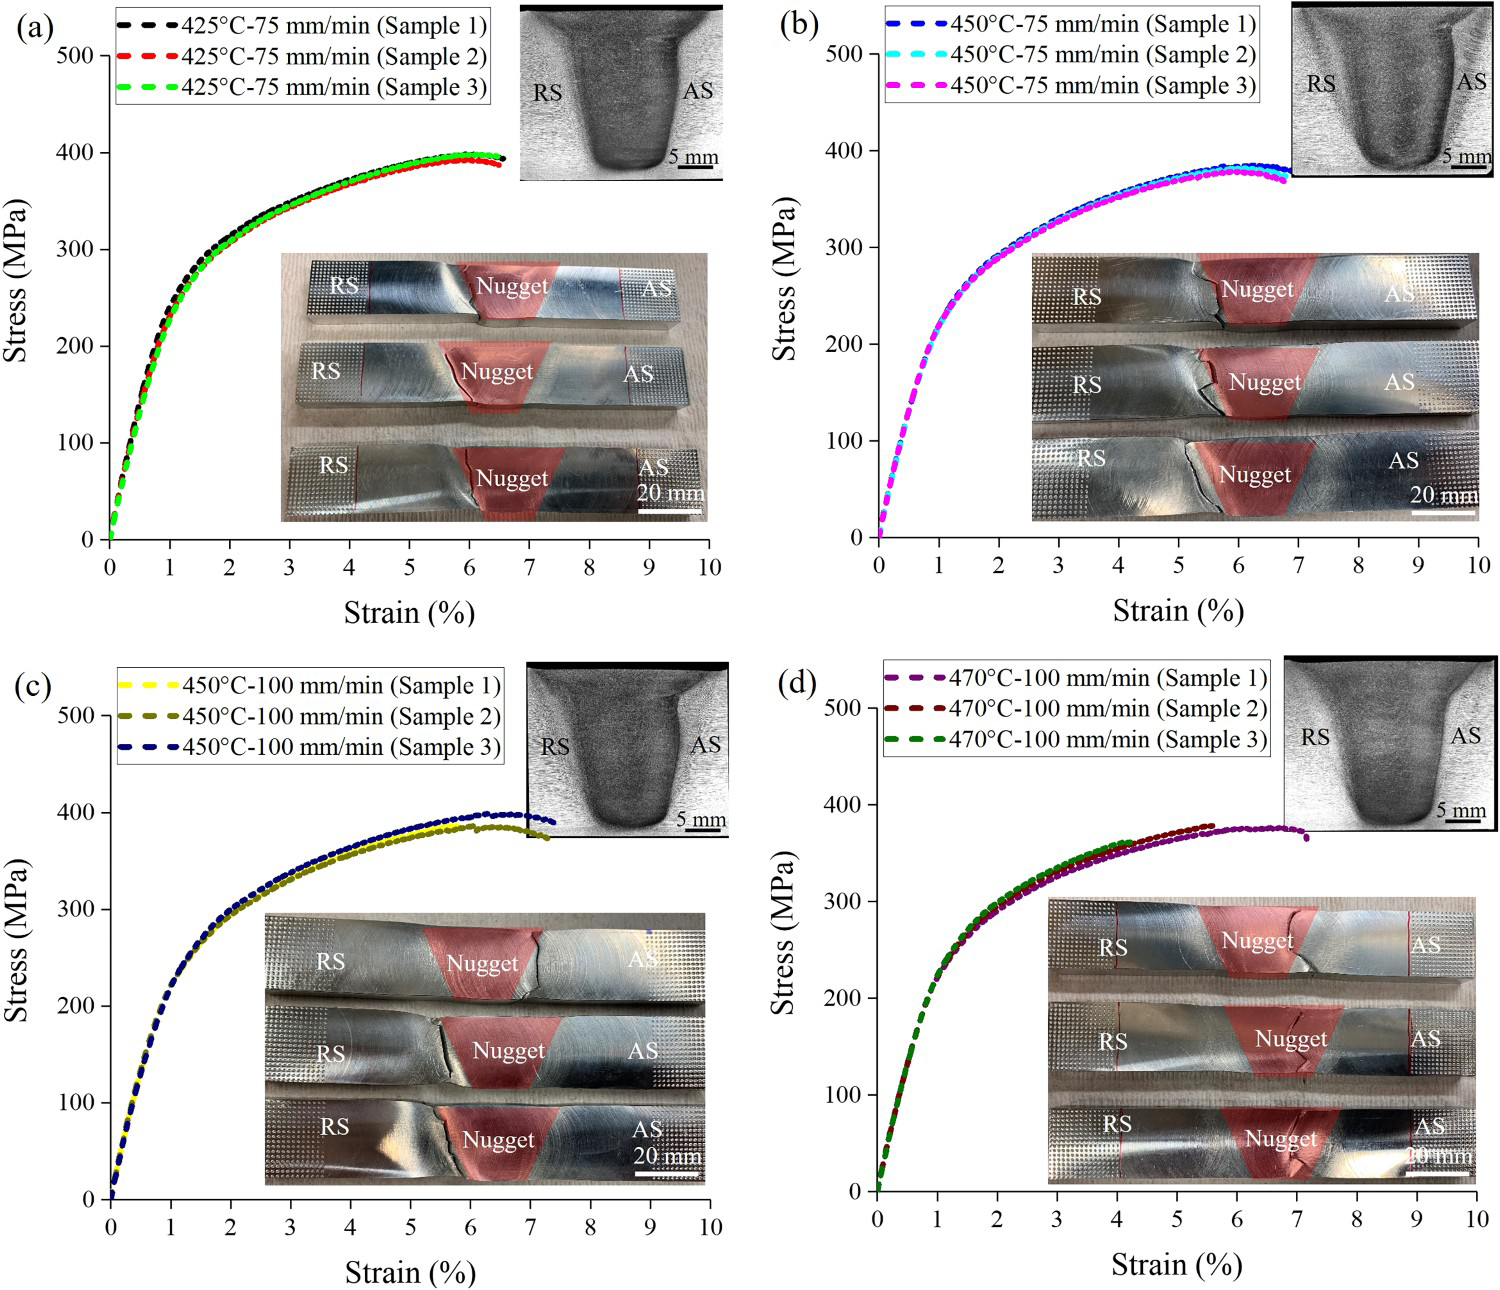
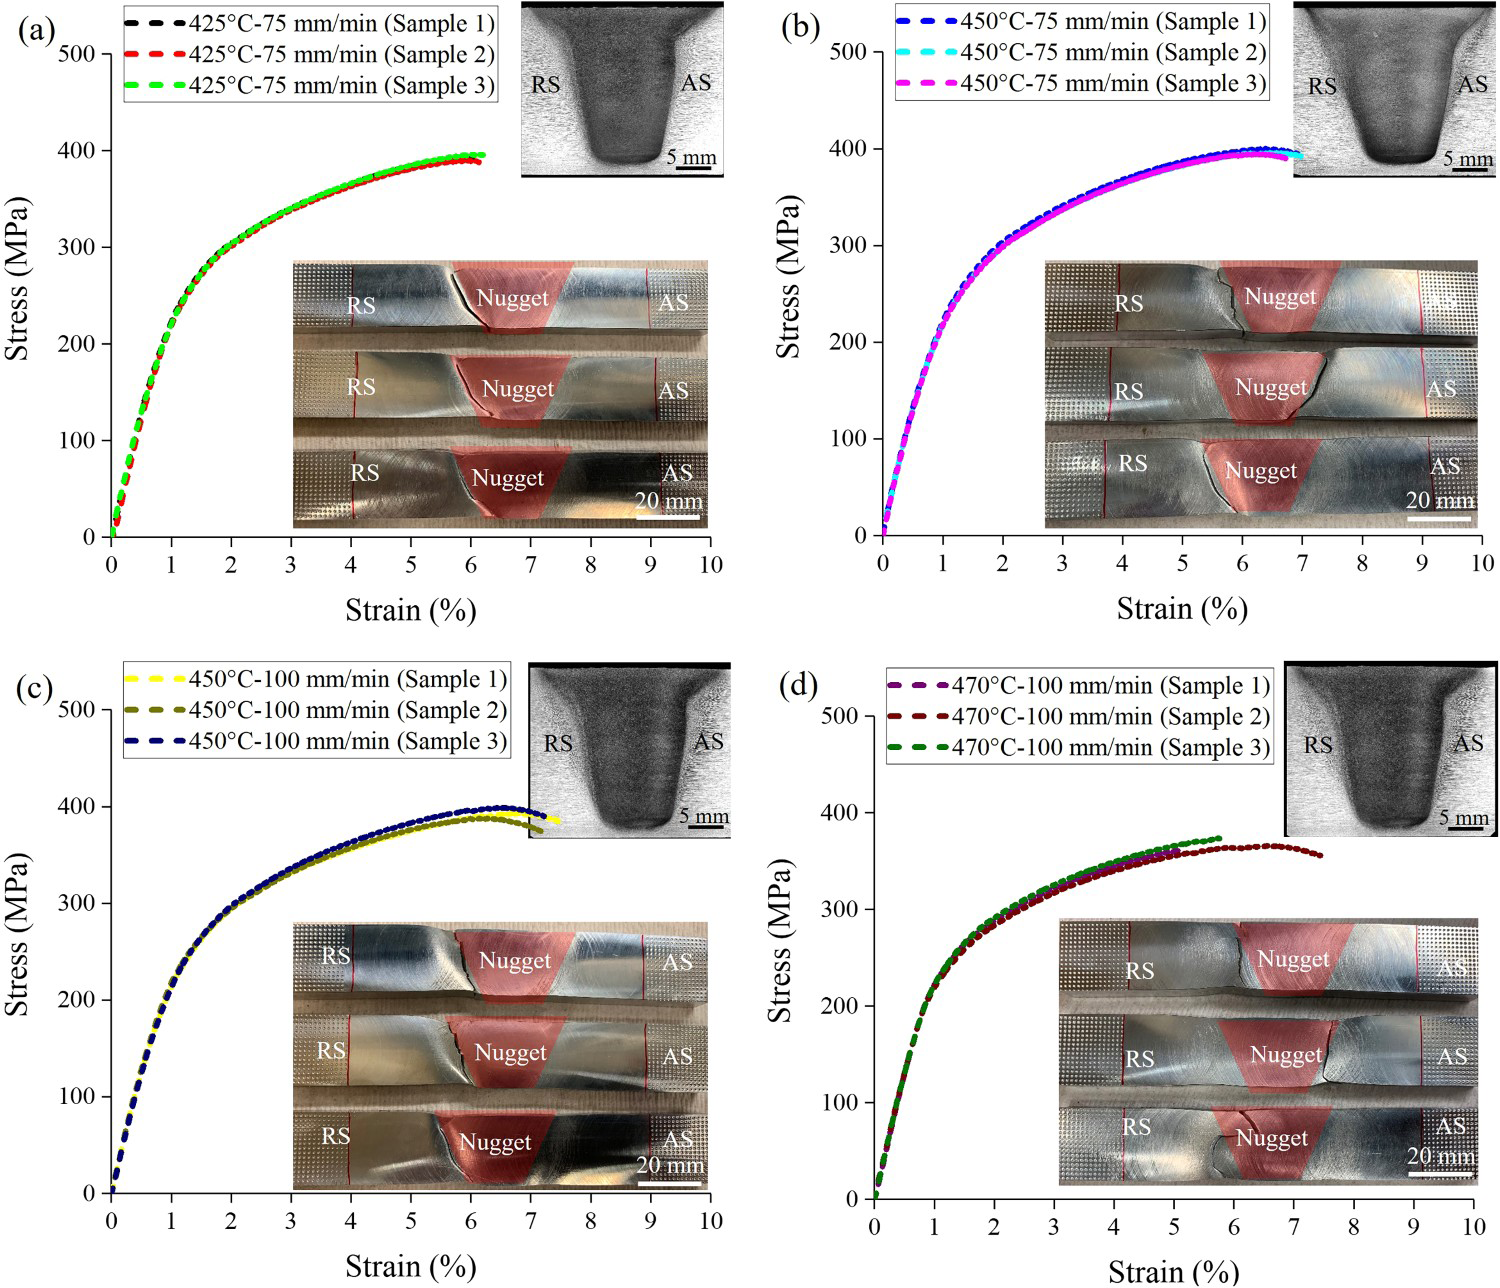
Machine force responses to applying various welding temperatures and welding traverse speeds for Tool #5 in (a) x-axis direction, (c) y-axis direction, (e) z-axis direction; and for Tool # 6 in (b) x-axis direction, (d) y-axis direction, (f) z-axis direction. Tensile test curves and fracture samples for runs made using Tool # 5 using different welding parameters: (a) welding temperature of 425 °C with welding traverse speed of 75 mm/min, (b) welding temperature of 450 °C with welding traverse speed of 75 mm/min, (c) welding temperature of 450 °C with welding traverse speed of 100 mm/min, and (d) welding temperature of 470 °C with welding traverse speed of 100 mm/min. Optical images of cross sections of each weld are also inset. Tensile test curves and fracture samples for runs made by Tool # 6 using different welding parameters: (a) welding temperature of 425 °C with welding traverse speed of 75 mm/min, (b) welding temperature of 450 °C with welding traverse speed of 75 mm/min, (c) welding temperature of 450 °C with welding traverse speed of 100 mm/min, and (d) welding temperature of 470 °C with welding traverse speed of 100 mm/min. Optical images of cross sections of each weld are also inset.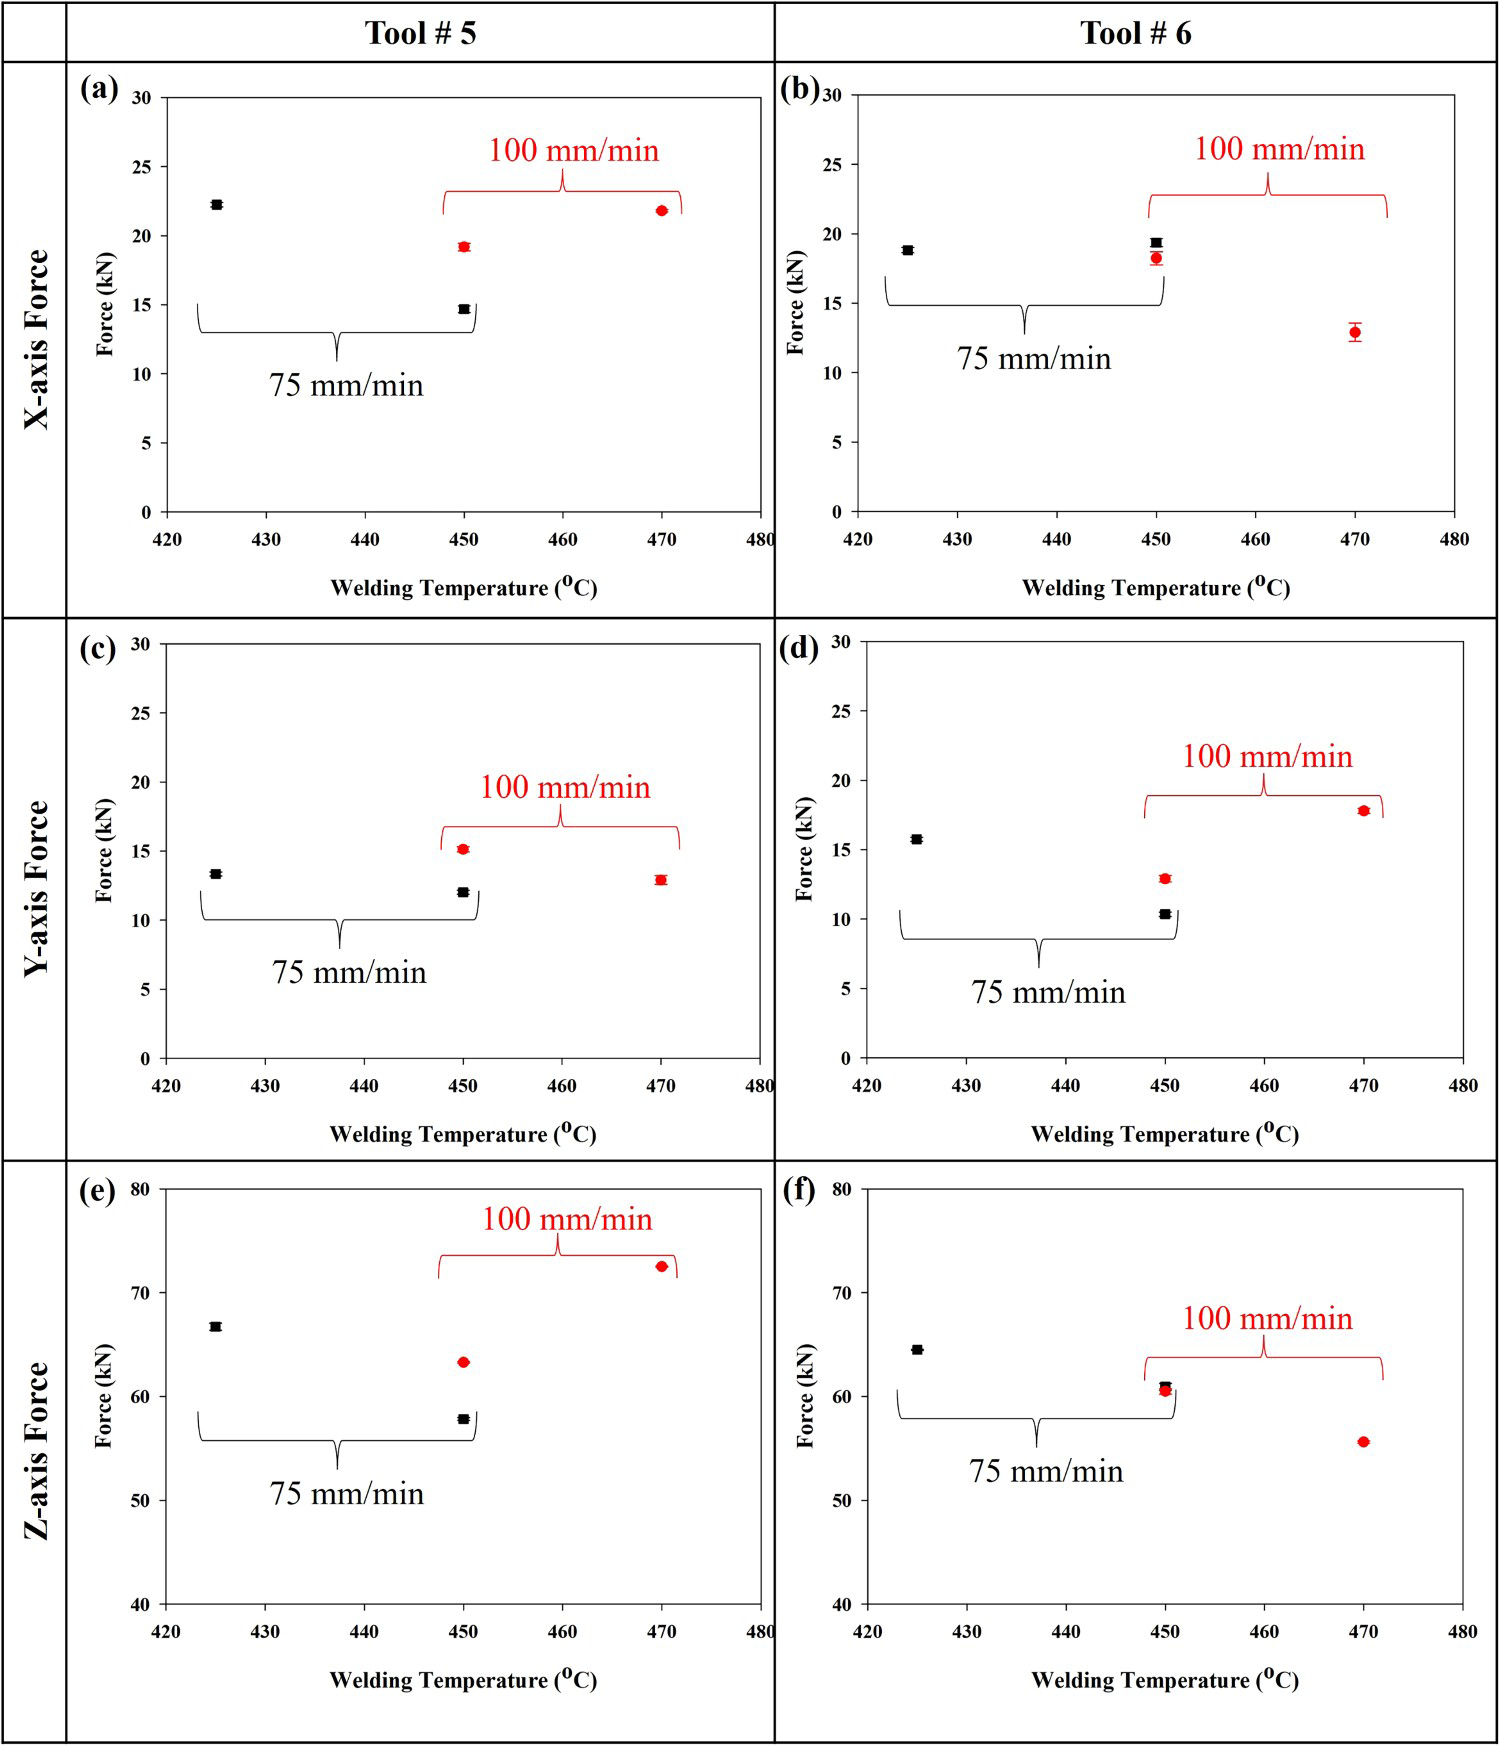
For both Tool #5 and Tool #6 at a traverse speed of 75 mm/min, x, y, and z-axis forces decreased as the welding temperature increased from 425 °C to 450 °C, especially for the x-axis force [Figure 4(a,b)]. This is because material was softened as the welding temperature increased. However, at a traverse speed of 100 mm/min, results for Tool #5 and Tool #6 diverged. For Tool #5 at a traverse speed of 100 mm/min, x-axis and z-axis forces increased while y-axis force decreased as the welding temperature increased from 450 °C to 470 °C [Figure 4(a,c,e)]. For Tool #6 at a traverse speed of 100 mm/min, x-axis and z-axis forces decreased while y-axis forces increased as the welding temperature increased from 450 °C to 470 °C, [Figure 4(b,d,f)]. It should be noted that the FSW data acquisition was conducted at 20 Hz for this study that might capture less fluctuation of the forces plotted in Figure 4. Hence, to better understand this inconsistent force response to variation in welding parameters, further investigation using a high-frequency data acquisition system is necessary.
The tensile testing results of the runs made by Tool #5 and Tool #6 are displayed in Figures 5 and 6, respectively. Three samples were tested for each condition. The mechanical performances of all the samples were consistent, and almost all the samples broke along the nugget boundary on either the AS or RS (HAZ region). Detailed descriptions are as follows. For Tool #5 with traverse speed of 75 mm/min and welding temperatures of 425 and 450 °C, the tensile samples all broke along HAZ on the RS [Figure 5(a,b)]. For Tool #5 with traverse speed of 100 mm/min, the fracture location varied. With the welding temperature of 450 °C, two tensile samples broke along the HAZ on the RS, while one tensile sample broke along the HAZ on the AS [Figure 5(c)]. With the welding temperature of 470 °C, all the tensile samples broke along the HAZ on the AS or within the nugget, [Figure 5(d)]. For Tool #6 with traverse speed of 75 mm/min and welding temperatures of 425 and 450 °C, the tensile samples all broke along the HAZ on the RS except one, which broke along the HAZ on the AS [Figure 6(b)]. For Tool #6 with traverse speed of 100 mm/min and welding temperature of 450 °C, all tensile samples broke along the HAZ on the RS, [Figure 6(c)], while when the welding temperature was 470 °C, one tensile sample broke at the HAZ on the RS, one sample broke along the HAZ on the AS, and one sample broke within the nugget [Figure 6(d)]. It should be noted here that the asymmetric nature of the microstructure by process temperature variations [31] and small differences in defecting during the FSW can lead the failures in the AS or RS of the joint. The critical mechanical properties including yield strength, tensile strength, and strain at fracture from the tests displayed in Figures 5 and 6 are summarised in Supplementary Table S2.
The critical mechanical properties including yield strength, tensile strength, and strain at fracture are plotted and compared in Figure 7(a–f). For Tool #5 with traverse speed of 75 mm/min, yield strength and tensile strength decreased as the welding temperature increased from 425 °C to 450 °C, while strain at fracture slightly increased with increased welding temperature [Figure 7(a,c,e)]. For Tool #5 with traverse speed of 100 mm/min, yield strength increased as the welding temperature increased from 450 °C to 470 °C, while tensile strength and strain at fracture decreased with the welding temperature increase [Figure 7(a,c,e)]. For Tool #6 with traverse speed of 75 mm/min, yield strength decreased as the welding temperature increased from 425 °C to 450 °C, while tensile strength and strain at fracture slightly increased with the welding temperature increase [Figure 7(b,d,f)]. For Tool #6 with traverse speed of 100 mm/min, yield strength slightly increased when the welding temperature was increased from 450 °C to 470 °C, while tensile strength and strain at fracture decreased with the welding temperature increase [Figure 7(b,d,f)]. Reducing the welding speed causes the temperature to rise, which is retained in the weld and neighbouring Thermo-Mechanically Affected Zone (TMAZ) and Heat Affected Zone (HAZ) for an extended period. This can lead to a wider HAZ, which can compromise mechanical performance since fracture typically occurs in this region [8,9]. Moreover, increasing the welding temperature has been shown to result in lower joint strength (tensile and yield strength) due to over-aging during FSW [24]. However, a future study using transmission electron microscopic level characterisation would be needed to fully understand the correlation between joint strength and precipitation kinetics.
Mechanical properties of joints obtained by applying various welding temperatures and welding traverse speeds: with Tool #5 (a) yield strength, (c) tensile strength, (e) strain at fracture; and with Tool # 6 (b) yield strength, (d) tensile strength, and (f) strain at fracture.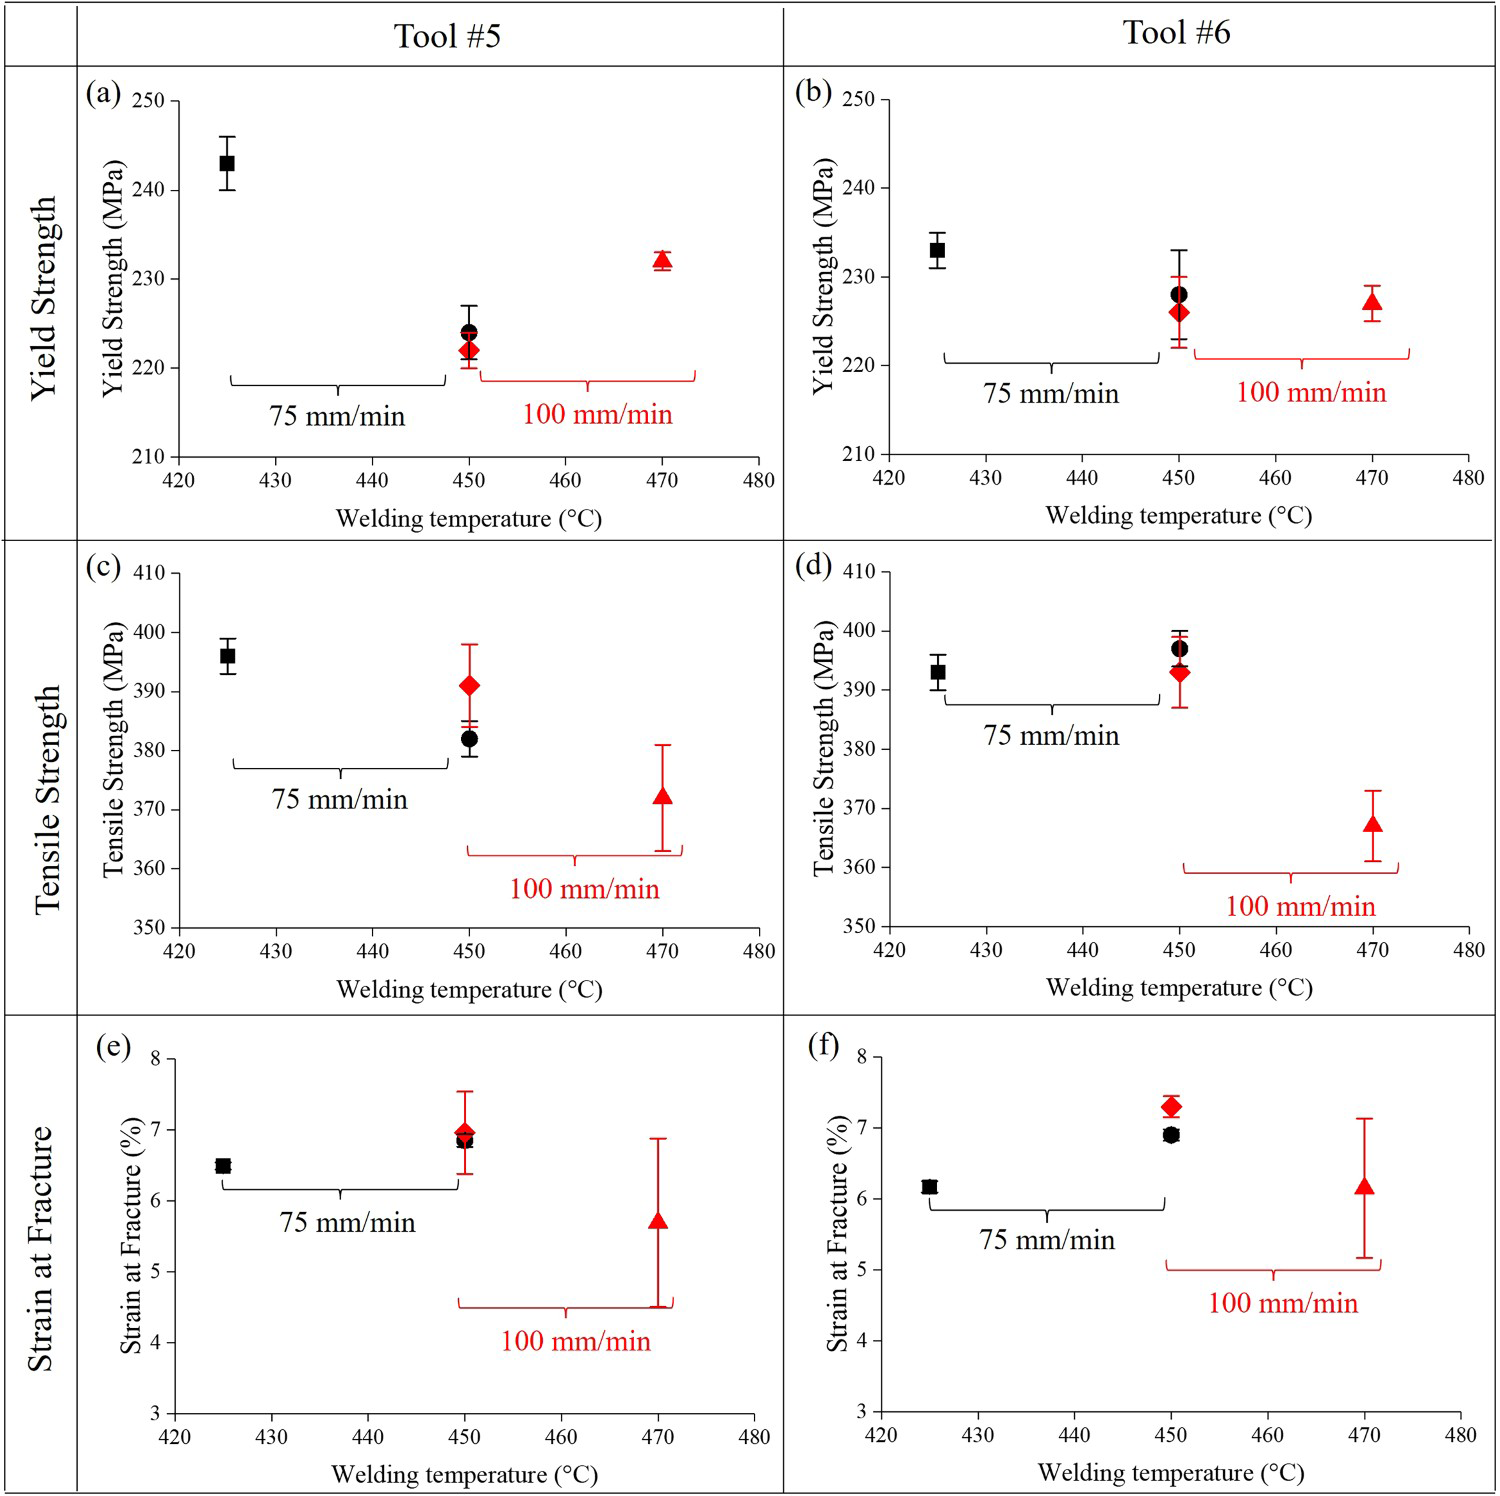
According to the results displayed in previous sections, the fracture location varies with the different process parameters. Especially, fracture location tends to change from HAZ to nugget when the welding temperature increased to 470 °C (see Figures 5(d) and 6(d)). Meanwhile, the tensile strength and strain of joints that break within nugget are lower than joints that fail along HAZ (see Figure 7(c,d,e,f)). To explain this observation, two schematics showing joints breaking along the HAZ for low welding temperature, as well as joints breaking within the nugget for high welding temperature are displayed in Figure 8(a,b), respectively. For low temperature, the nugget has higher yield strength, but lower strain at fracture as compared with the HAZ, therefore, the stress–strain curve of the overall joint is governed by the HAZ stress–strain curve, and the facture occurs at the HAZ [Figure 8(a)]. As for high temperature, the nugget has comparable yield strength, but lower strain at fracture compared with the HAZ, therefore, stress–strain response of the overall joint is governed by the stress–strain curves of the nugget and HAZ, and the facture occurs at the nugget since the nugget has lower strain-to-failure than HAZ [Figure 8(b)].
Schematics showing correlation between mechanical properties and fracture locations of joints obtained with (a) low temperature and (b) high temperature.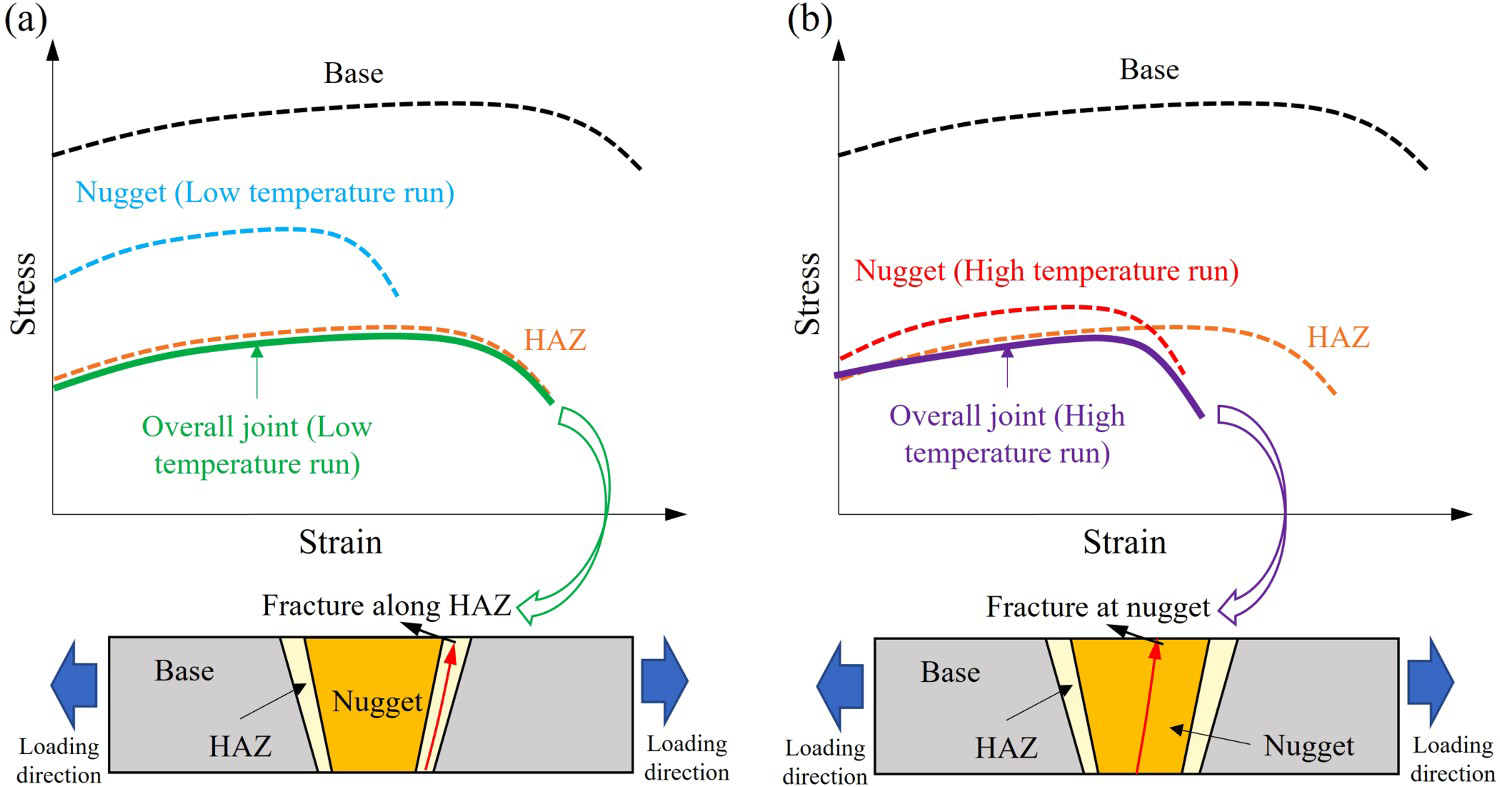
Friction stir welding was applied for joining 25.4 mm thick 7175 aluminium plates. Different FSW tool designs and welding parameters including welding temperature and traverse speed were applied to investigate their influence on machine forces and joint mechanical performance. The important outcomes of this work are summarised as follows.
With a constant tool shoulder diameter and welding parameters, an increase in tool pin diameter tended to introduce surface lack-of-fill defects at the weld top (crown) or exhibited an excessive force in a direction perpendicular to the welding direction. Using a fine threaded (1.41 mm pitch) pin with a lower swept volume and convex shoulder geometry can effectively eliminate welding defects under reduced tool forces and various operating temperatures, while ensuring superior joining performance. Both welding temperature and traverse speed can significantly influence the mechanical performance of the joints. Lower welding temperatures can assist in minimising over-aging effects by affecting precipitation kinetics. In this study, the use of a welding temperature of 425 °C and a traverse speed of 75 mm/min resulted in optimal joint mechanical performance. As the welding temperature increased to 470 °C, the total accumulated strain and fracture locations of the joints produced by the two tools began to diverge, with the fracture location shifting from the HAZ to the nugget due to over-aging of the nugget bottom.
Footnotes
Acknowledgements
This research was funded by the U. S. Department of Energy (DOE), Office of Fossil Energy and Carbon Management under Field Work Proposal 71971. The authors would like to acknowledge the guidance and support from Roy Long and Dave Cercone, Technology Managers, Offshore Oil and Gas, National Energy Technology Laboratory. Pacific Northwest National Laboratory is operated by Battelle for DOE under contract DE-AC05-76RL01830. The authors would like to thank PNNL colleagues Anthony Guzman and Timothy J. Roosendaal for assistance in sample preparing and mechanical testing. Finally, the authors would like to extend their appreciation to Mr. Douglas Waldron, President, Xymat. for his continuous support to this project including providing the feedstock materials.
Disclosure statement
No potential conflict of interest was reported by the authors.
Data availability statement
The raw process data required to reproduce the welds cannot currently be shared prior to pending patent filings.
Declaration of competing interest
The authors declare the following financial interests/personal relationships that may be considered as potential competing interests: The authors declare no conflict of interest. The views and opinions of the authors expressed herein do not necessarily state or reflect those of the United States Government or any agency thereof. Neither the United States Government nor any agency thereof, nor any of their employees, makes any warranty, expressed or implied, or assumes any legal liability or responsibility for the accuracy, completeness, or usefulness of any information, apparatus, product, or process disclosed, or represents that its use would not infringe privately owned rights.
Author contribution statement
Tianhao Wang: Writing – original draft. Md Reza-E-Rabby: Investigation, methodology, and writing – review and editing. Hrishikesh Das: Investigation, methodology, and writing – review and editing. Glenn J. Grant: Supervision and writing – review and editing. Scott Whalen: Supervision and writing – review and editing.