
Abstract
Aluminium alloy AA6061 and mild steel Q235 were welded by resistance element using an aluminium rivet as the element. The microstructure and properties of the joints were characterised. The temperature distribution on the cross-section of the joints was calculated by using ABAQUS numerical simulation software. The observation results on the cross-section of the joints show a nugget formed at the interface between the rivet tip and steel of lower plate. The maximum tensile shear load of the joints reached 5.82 kN at the welding current of 26 kA. This study reveals that the bearing interface of the resistance element welded joint between aluminium alloy and mild steel is like-to-like interface of aluminium alloy which strengthens the joint.
Introduction
Under the requirements of saving energy, protecting environment and developing low-carbon economy, automobile lightweight design has become a competitive highland and an important development direction of the whole industry [1]. Automobile lightweight not only in the body, but also in the power transmission system and other components should be actively promoted [2]. The weight of the driveshaft itself accounts for a larger proportion of the weight of the power system components, and its lightweight has very high cost-effective. In view of this, in some light trucks, pickups and other models using aluminium alloy (AA) and other light materials manufacturing driveshaft has become a development trend [3]. As one of the most important parts of the automobile transmission system, the driveshaft is responsible for the transmission of rotational motion and torque in the process of vehicle running [4]. The dynamic balance characteristic of the driveshaft is not only one of the key factors affecting the reliability and comfort of the vehicle at high speed, but also the friction and wear between the drive shaft and its associated parts [5]. Similar to ordinary steel driveshaft, aluminium hollow driveshaft extruded inevitably has wall thickness difference and affect its dynamic balance characteristics due to the constraints of extrusion forming technological factors [6]. Therefore, it is necessary to correct the driveshaft to realise the symmetrical distribution of mass and meet the dynamic balance requirements.
Some material is added to the proper position of the driveshaft to compensate the weight and achieve its dynamic balance by welding method. Owing to the limitation of the service space of the driveshaft and the influence of the counterweight efficiency, the aluminium driveshaft needs to be configured with more dense metal as counterweight. Considering the manufacturing cost, mild steel (MS) is considered as a suitable counterweight material. Thus, the compensation correction of aluminium hollow driveshaft inevitably involves the welding between AA and MS.
Because AA and MS have great differences in physical and metallurgical properties, it is difficult to obtain reliable joint by fusion welding [7,8]. Owing to the limitation of the driveshaft structure, some solid-state joining methods with low welding temperature such as diffusion welding, friction stir welding and explosive welding are also considered unsuitable for the correction of the driveshaft. Resistance spot welding (RSW) is a kind of welding method suitable for the compensation correction of driveshaft because it is easy to operate and does not need filling material [9]. However, RSW of AA/MS also presents some challenges due to the local melting of the base metal during RSW [10–14]. Therefore, a resistance element welding (REW) suitable for dissimilar material joining was developed on the basis of RSW [15,16]. Meanwhile, Qiu et al. [17] studied REW of AA/MS using a headless rivet as an element; Fei et al. [18] processed the prefabricated hole into a conical shape and welded AA and steel using countersunk head rivet as an element. Gunter and Meschut [19] took conical rivet as the element and carried out self-penetrating REW between AA and steel without prefabricated holes. Recently, REW has been used to weld different combinations of AA and steel, such as A6061/22MnMoB [20], A6061/HS1300T [21], A6061/DP600 [22], A6061/Q235 [23], A5052/SPFC980 [24]. The results show that REW of AA and steel using the steel as a lower plate and steel rivet as an element can successfully transfer the bearing interface of the joint to the steel/steel interface, thus improving the performance of the joint. To transfer the bearing interface to the interface between similar materials, aluminium rivet should be used as the element for REW in the compensation correction of aluminium hollow driveshaft. However, there are few reports on REW of AA and steel using an aluminium rivet as the element. Therefore, aluminium rivet was selected as the element in the study to weld AA and MS.
Experimental materials and procedures
Considering that the wall thickness of hollow driveshaft is generally 2 mm–8 mm, AA6061 AA sheet and Q235 MS sheet with 2 mm thickness were selected as experimental materials. As a laboratory exploratory study, the hollow driveshaft was simplified into a plate for resistance spot welding in this study. The sheets were cut at a size of 100 mm × 30 mm. Their nominal compositions are Al-1.0Mg-0.15Mn-0.25Zn-0.04Cr-0.15Ti-0.6 and Si Fe-0.14C-1.0Mn-0.3Si-0.04P-0.02S (wt-%), respectively. An aluminium rivet with tip diameter of 6 mm, cap diameter of 10 mm, tip length and cap thickness of 2 mm was used as an element.
A 6 mm diameter hole was fabricated by machining in the centre of the faying zone of the MS sheet. After washing with anhydrous ethanol and drying, AA and MS sheets were assembled to the specimens using for tensile shear and cross tension tests, respectively. The MS sheet was used as upper plate and the AA sheet was used as the lower plate.
Welding current and welding time were changed respectively to implement welding. The welding current was varied every 2 kA in the range of 14–28 kA keeping welding time of 300 ms and electrode force of 3.1 kN; the welding time was changed every 100 ms in the range of 100–500 ms when the welding time was 22 kA and the electrode force was 3.1 kN. The tip diameter of electrode was 6 mm. ABAQUS numerical simulation software was used to calculate the thermal, electrical and mechanical fields and study temperature field during REW of AA and MS. The details of establishing the model are available in the work by Zhao [25]. In this study, the model was utilised to simulate the REW processes in order to obtain temperature histories at special positions of Al-steel AA/MS interface.
After welding, the tensile shear and cross tension tests were performed at room temperature under a crosshead velocity of 1.7 × 10⁻⁵ m/s. The average value of 5 specimens in each condition was used to evaluate both nugget diameter, tensile shear load (TSL) and cross tension load (CTL). The weld joints were cut perpendicular to the faying interface through the weld centre and a cross-section observation experiment was conducted after grinding and polishing. The microstructure of joints was investigated by scanning electron microscopy (SEM), while the chemical compositions of the reaction products were assessed by energy-dispersive X-ray spectroscopy (EDS). Electron backscattered diffraction (EBSD) of the interracial zone was performed on the SEM.
Experimental results and discussion
Figure 1(a,c) displays the calculated temperature distribution at the moment the welding current was cut off when the welding current was 16 and 20 kA, respectively. From the transverse point of view, the width of the region where the temperature exceeds the melting point of AA was smaller than the diameter of the rivet tip when the welding current was 16 kA, whereas that was larger than the rivet tip diameter when the welding current was 20 kA. From the perspective of thickness, the part of rivet tip and lower plate near the interface of them reached the melting state when the welding current was 16 kA, whereas the lower plate and the rivet (including the rivet tip and cap) were close to full penetration when the welding current was 20 kA.
Comparison of physical macrographs to simulated cross-sectional joints, (a) simulated cross-section (16 kA); (b) physical macrograph (16 kA); (c) simulated cross-section (20 kA); (d) physical macrograph (20 kA); (e) physical macrograph (18 kA); (f) physical macrograph (22 kA).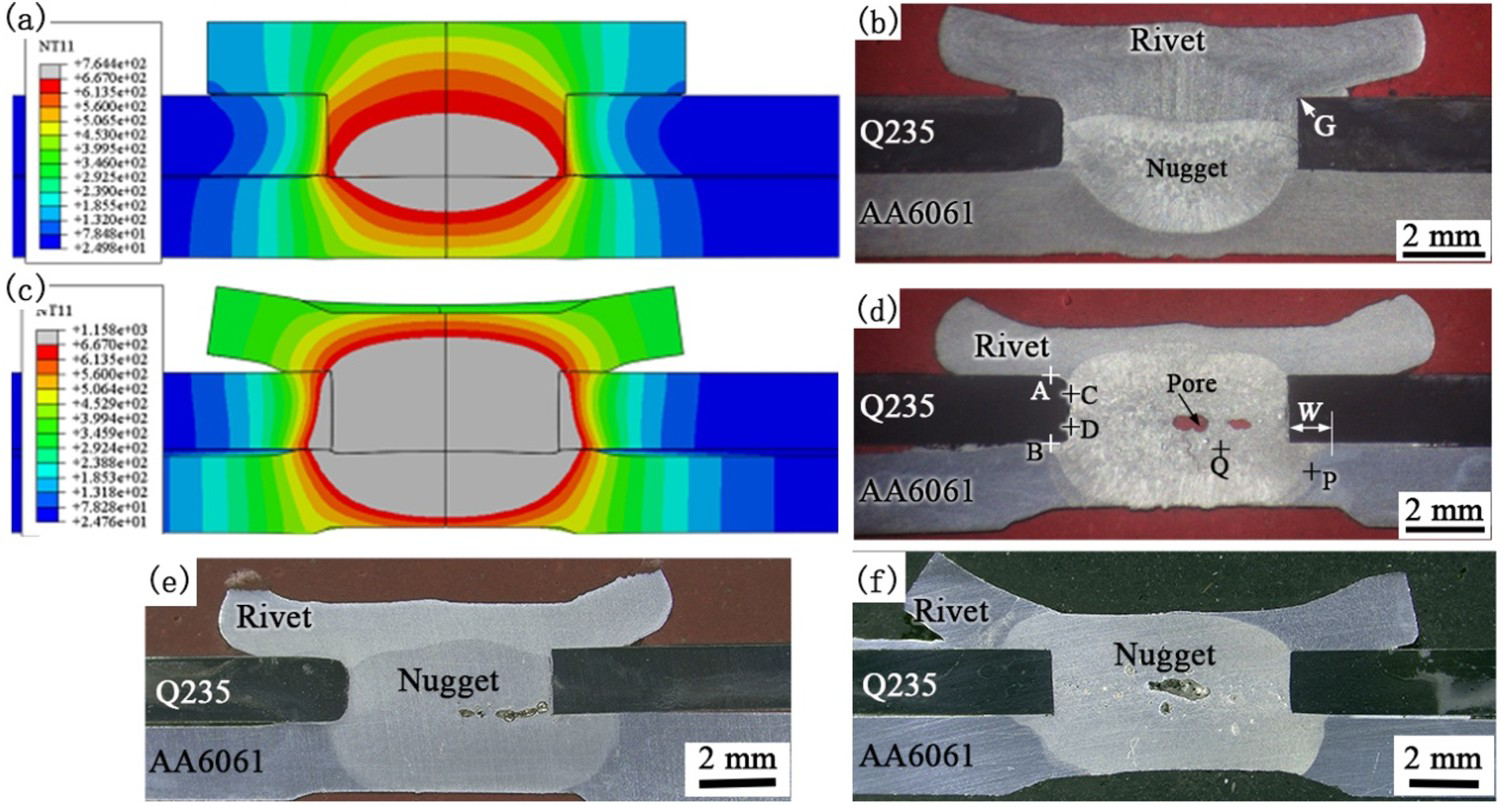
Figure 1(b,d–f) displays the optical micrograph of REW joint cross-sections welded at 16, 18, 20 and 22 kA, respectively. A nugget was detected in each joint. As shown, no matter how the welding current, the MS of the upper plate did not reach the melting state. The MS edge line remains relatively straight at the interface between rivet tip and MS, which indicates that the MS did not melt during welding.
It can be seen from Figure 1(a,b) that the calculated AA molten zone was slightly smaller in thickness, but it was close in width compared with the nugget cross-section shape of the joint. The difference between them is mainly manifested in that the boundary contour of the upper side of the nugget (the side of the rivet cap) is flat, whereas that shows an arc protruding in the numerical simulation results as shown in Figure 1(a). When welding current was 20 kA, the calculated molten zone of the AA was very close to the shape of the joint nugget in terms of width and thickness. The edge effect of welding current in the welding process can result in a larger current density at the outer edge of the fitting interface between the rivet tip and the lower plate, at where more heat can be formed. This may cause the upper and lower boundary contour of the nugget to be relatively flat. However, more heat is formed and high-temperature duration is longer in the welding zone when the welding current is larger, which may shield the influence of edge effect on the nugget shape. In the case of low welding current, the boundary contour of the lower side (lower plate side) of the nugget is arc protruding because the heat is easily lost along the AA of lower plate, whereas the end of the nugget formed in the rivet tip was thicker due to the poor thermal conductivity of the MS of upper plate. Namely, the boundary contour of the upper side of the nugget became flatter under the superposition influence of the transverse heat conduction and the edge effect as shown in Figure 1(b). Because the influence of edge effect on heat generation was not considered in the numerical simulation analysis, the calculated AA molten zone was slightly smaller in thickness compared with the nugget when welding current was 16 kA.
By comparing Figure 1(b) and (d), it can be observed that the characteristics of the formed nugget varied with the welding current. First, the electrode indentation depth was different. The electrode indentation of the joint welded with lower welding current was shallower as shown in Figure 1(b), whereas that of the joint welded with larger welding current was deeper as demonstrated in Figure 1(d). With increasing welding current, the molten AA in the electrodes holding area increased and the resistance to electrode pressure decreased, so the electrode indentation deepened accordingly.
Second, the separation degree between the rivet cap and the upper plate varied with the welding current. The rivet cap of the joint welded at 16 kA was slightly warped upward and failed to fit with the upper plate as demonstrated in Figure 1(b). This is due to the plastic deformation during welding. Under the electrode force, the high temperature metal between the upper and lower electrodes clamping area was pressed and plastic deformation occurred. This caused the rivet cap to act like a lever, in which the upper edge of the prefabricated holes (G in Figure 1) was regarded as the fulcrum. Then, the central zone of the rivet cap under the electrode was compressed, and the outer edge was warped upward. However, the rivet cap fitted well with the upper plate without warping when the welding current was greater than 18 kA. So, the larger the welding current, the deeper the electrode indentation of joint. The contact area between the electrode and the plate increased with the increase of the electrode indentation depth. When the diameter of the contact area was larger than the rivet tip diameter, the G location (in Figure 1) lost the role of the lever fulcrum; and the riveted cap was pressed to the upper plate by electrode to make them fit together. Additionally, it can be observed from Figure 1(a,b) that the simulation results were inconsistent with the experimental results in the deflection between the rivet cap and the upper plate. This may be because the leverage effect of the riveted cap was not considered in the modelling, which needs further study in the future work.
Third, the formation of holes in the nugget was observed in Figure 1(d), while no holes were observed in Figure 1(b). The experimental results reveal that the formation of holes was observed in the nugget of joints welded under the welding current over 16 kA. These holes can be judged to be caused by insufficient metal in the nugget during solidification by their size and shape. The reasons for its formation can be found in literature [26]. Additionally, the splash during welding cause the loss of metal in the nugget, which can also lead to the formation of holes in nugget.
It should be noticed that different welding current resulted in different geometrical dimensions of the nugget as demonstrated in Figure 1(b,d). Figure 2 displays the effects of welding current on the nugget diameter, nugget thickness and nugget extension width. Here, the nugget diameter and thickness were determined on the joint cross-section. With the increase of welding current, the heat generated increased, and the nugget grew. When the welding current was greater than 18 kA, the nugget grew laterally up to the MS of the upper plate (nugget fully filled with rivet tip in the radial). Although the MS did not melt due to its high melting point, the nugget continued to grow outward along the lower plate, formed the pattern shown in Figure 1(d). Here, the part of the nugget end beyond the junction of the rivet tip, upper plate and lower plate was called the nugget extension width (W). As demonstrated in Figure 2, the nugget extension width increased with increasing welding current. It should be reminded that the value of W was negative when the welding current was 14 and 16 kA. This is to say that the end of the nugget has not reached the junction of rivet tip, the upper plate and the lower plate in this case.
Effects of welding current on the nugget diameter, nugget thickness and nugget extension width.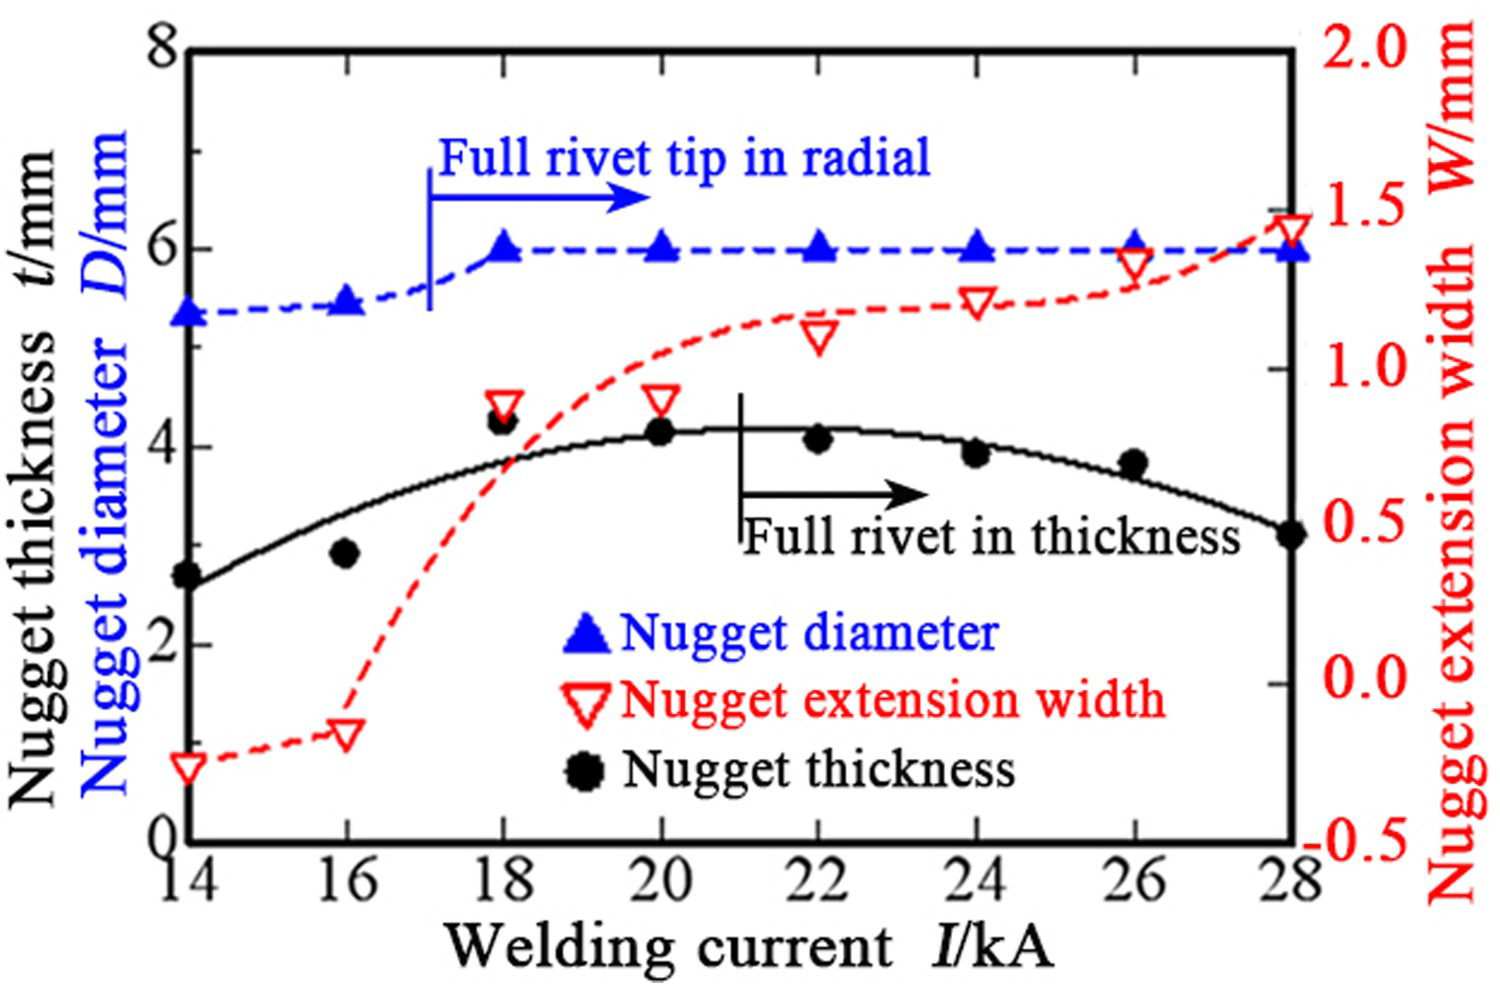
As demonstrated in Figure 2, the nugget thickness first increased within the welding current range of 14–20 kA with increasing welding current. However, the nugget thickness decreased with increasing welding current in the case above the welding current of 22 kA, even though the lower plate and the rivet (including the rivet tip and cap) were full penetration. The larger the welding current, the more Joule heat was generated. This is the reason for the nugget thickness increased with increasing welding current. The heat generated made the lower plate and rivet reached full penetration when welding current above 22 kA. As mentioned earlier, the larger the welding current, the larger the plastic deformation and the smaller the thickness of the welding zone (including the lower plate, rivet tip and cap) under the action of electrode force. In addition, the larger the plastic deformation, the more sufficient the contact of the electrode/AA and the electrode/rivet cap, which may make the current conduction path wider and the current density along the faying surface lower. As a result, the nugget thickness also became thinner.
Figure 3(a,c) displays a SEM image of the interface between the rivet cap and MS (position of A in Figure 1) and temperature history curve of its corresponding position, respectively. Here, the moment when the welding current was switched on was recorded as the temperature history curve started moment. Notably, no reaction products were observed at the interface, although the rivet cap fitted well with the MS. It can be seen from Figure 1(c) that the temperature at the position in the welding process was low and did not reach the melting point of AA (667°C). This is the reason for no reactants were formed at the interface. The temperature history curve reveals that the temperature at the position rose to approximately 584°C at the time 187 ms, and there was little change in the temperature at the position as the welding current continued to flow. This means that there was almost a balance between heat conduction and heat loss. This means that there was a near balance of heat at the position, which the heat lost by heat dissipation was approximately equal to the heat transferred from the heat supply source in unit time.
SEM images and temperature history of A and B positions in Figure 1, (a) SEM image at A; (b) SEM image at B; (c) temperature history at A; (d) temperature history at B.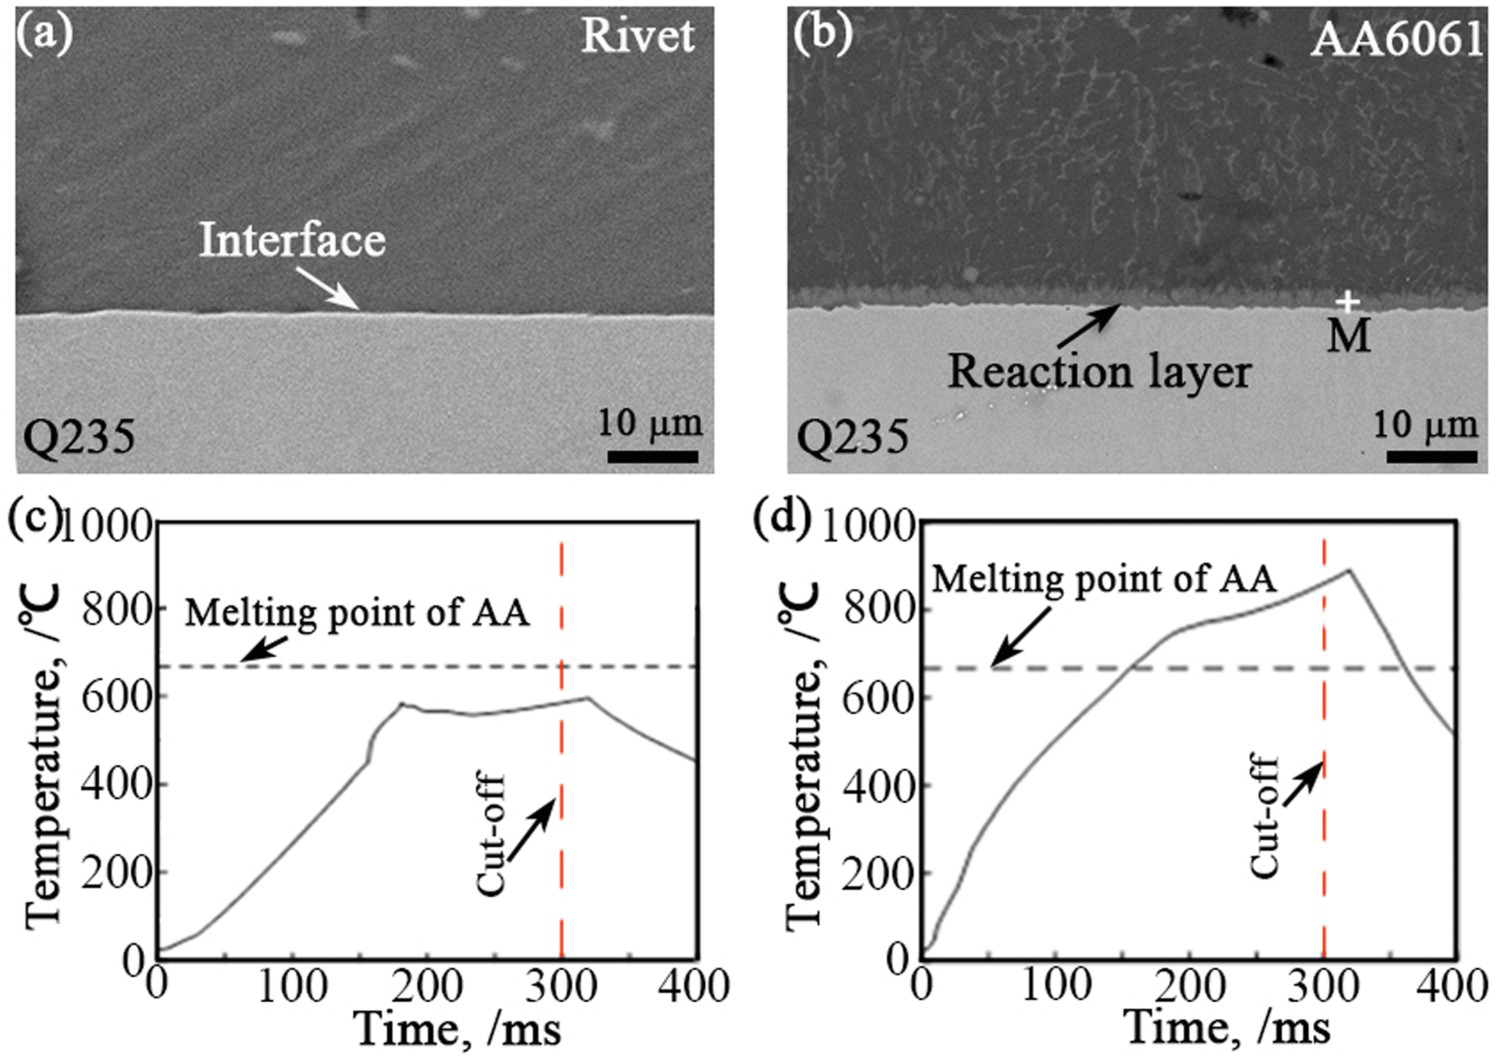
Figure 3(b,d) displays a SEM image of the AA/MS interface (position of B in Figure 1) and temperature history curve of its corresponding position, respectively. A reaction layer (RL) was found at the interface. The thickness of RL was approximately 1.9 µm. It can be seen from the calculation results as shown in Figure 3(d) that the highest temperature reached 900°C and the high temperature (temperature exceeds the melting point of AA) duration was about 200 ms at the position during welding. Under the circumstances, the RL was formed at the interface. From the transverse perspective, the distance from the two points A and B to the axis of the rivet is almost the same as demonstrated in Figure 1(d). However, the interfaces at these two positions have different morphology. And that’'s because the distance between the heat supply source and these two points was different. In the welding process, the metal at the interface between the rivet tip and the MS melted first because the resistance was larger, and then the melting zone of the metal expanded laterally and thickly. The horizontal centre of the interface between the rivet tip and the MS was farther from A position than it was from B position as demonstrated in Figure 1(d). This resulted in different temperature history at the positions of A and B. Compared with the temperature history of position A, that of position B not only had a longer high-temperature duration, a higher maximum temperature, but also a faster temperature rise.
Figure 4(a,b) displays the typical morphology of the interface between the rivet tip and MS at the positions of C and D in Figure 1(d), respectively. Notably, a RL was also detected at the interface. The thickness of the RL varied along the interface depending on where they were located. The closer to the AA of lower plate, the thicker the RL. For example, the RL at the position of C and D was about 1.5 and 2.3 µm thick, respectively. Figure 4(c,d) shows the calculated temperature history curves at point C and D in Figure 1, respectively. It should be noted that the highest temperature at both positions exceeded the melting point of AA but did not reach that of MS, which means that the RL formed at the interface was also metallurgical reaction products between liquid AA and solid MS during welding. By comparing Figure 4(c) and (d), it can be seen that the highest temperature at the position of D was higher than that at the position of C, and the high temperature duration at the position of D was longer than that at the position of C during welding. This is considered to be the reason why the RL at the D position was thicker than that at the C position.
SEM images and temperature history of C and D positions in Figure 1, (a) SEM image at C; (b) SEM image at D; (c) temperature history at C; (d) temperature history at D; (e) EDS results; (f) EBSD image.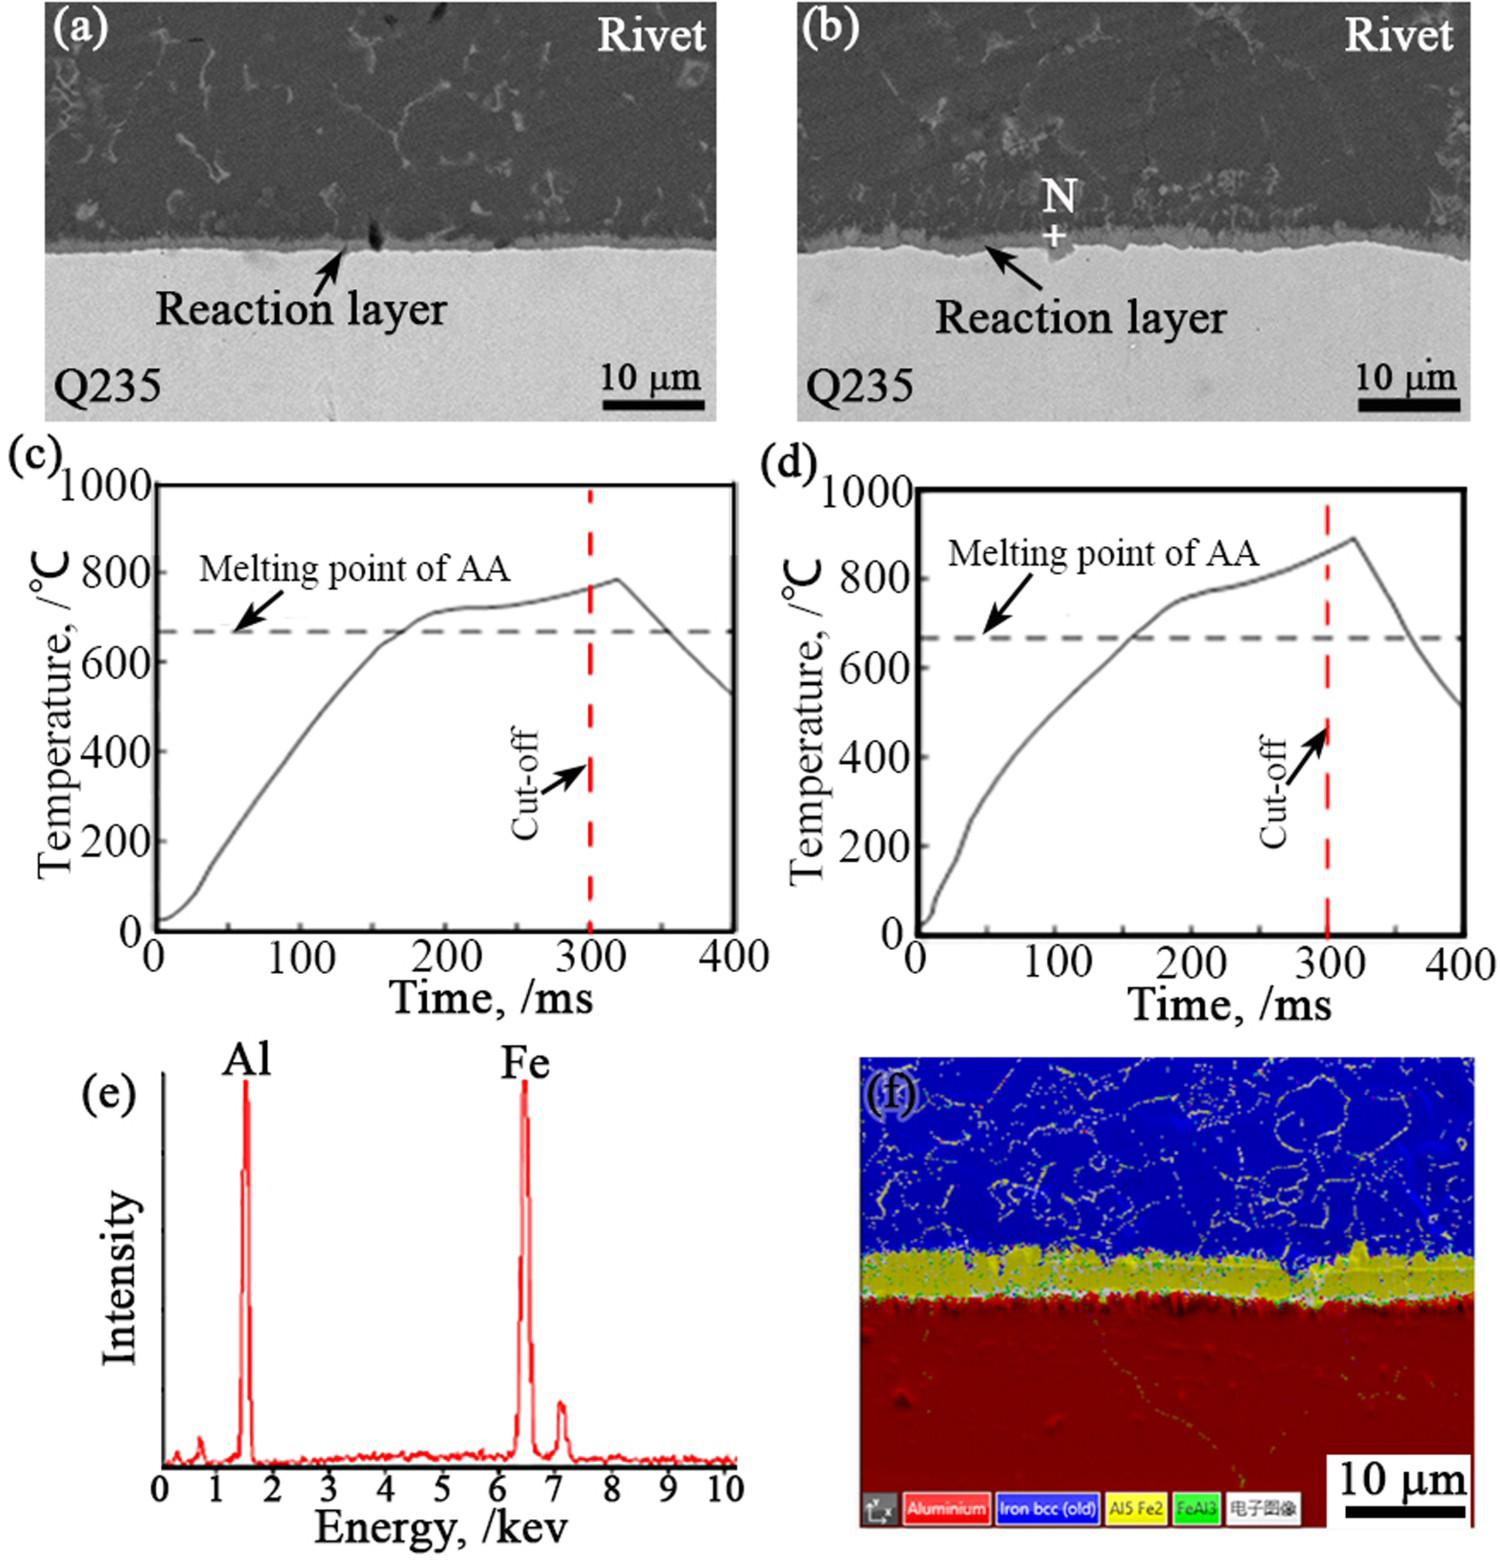
To assess the chemical compositions of the RL, EDS spot analysis was conducted on spot of M in Figure 3(b) and N in Figure 4(b). EDS analysis shows that these reaction layers mainly contain Al and Fe elements as shown in Figure 4(e) which is the detection result at N position. Figure 4(f) shows an EBSD layered image taken from the rivet tip/MS interface zone as shown in Figure 1(d). It can be seen that the reaction layer is mainly composed of Fe2Al5 and a little FeAl3. Although FeAl3 is mainly distributed near the aluminium alloy side, it still does not form a layered structure. This is inconsistent with the double-layered reaction layer reported in literatures [13,27,28]. The reason is not clear, probably due to the thin reaction layer, reaction time is short in this study.
It can be seen from Figures 3 and 4 that the highest temperature was reached for each position about 17 ms after the welding current was cut off. There are two main factors contributing to the result. First, there was a lag period in the conduction of heat from the heat-producing region to its surrounding region where the points of A, B, C and D were located. Second, the latent heat released during solidification of molten metal continued to heat its surrounding region after cutting off the welding current.
Figure 5(a) shows the metallographic image taken from the outside region of the nugget, as indicated by position P in Figure 1(d). A heat affected zone (HAZ) with a width of approximately 140 µm was observed outside the nugget. Grain boundaries were coarsened in the HAZ. This is due to the melting of the low melting point precipitate at the grain boundary. Figure 5(b) shows a magnified metallographic image taken from position E as indicated in Figure 5(a). Some columnar crystals were observed as shown in Figure 5(b). The direction of the columnar crystal was approximately perpendicular to the contour line of the nugget, consistent with the direction of heat dissipation. This is the result of epitaxial solidification and preferred growth. In the solidification process of nugget, its surrounding solid-state wall acted as the particles of grains nonuniform nucleating for crystallisation nucleation, and then the grains with opposite growth direction and heat dissipation direction grew faster and formed columnar crystal. Figure 5(c) shows a metallographic image taken from the central region of the nugget, as indicated by the position Q in Figure 1(d). There is no obvious directivity of the grains observed in the case. As cooling and solidification continue, the solute was discharged to the front edge of solid and liquid, which led to the increase of grain nucleation particles in the central region of the nugget. Additionally, the heat dissipation from the nugget central region to its surrounding also lacked of directivity. These are considered to be responsible for the formation of equiaxed crystals in the central region of the nugget.
Metallographic images of nugget zone, (a) HAZ; (b) enlarged view at E; (c) image of the nugget central region.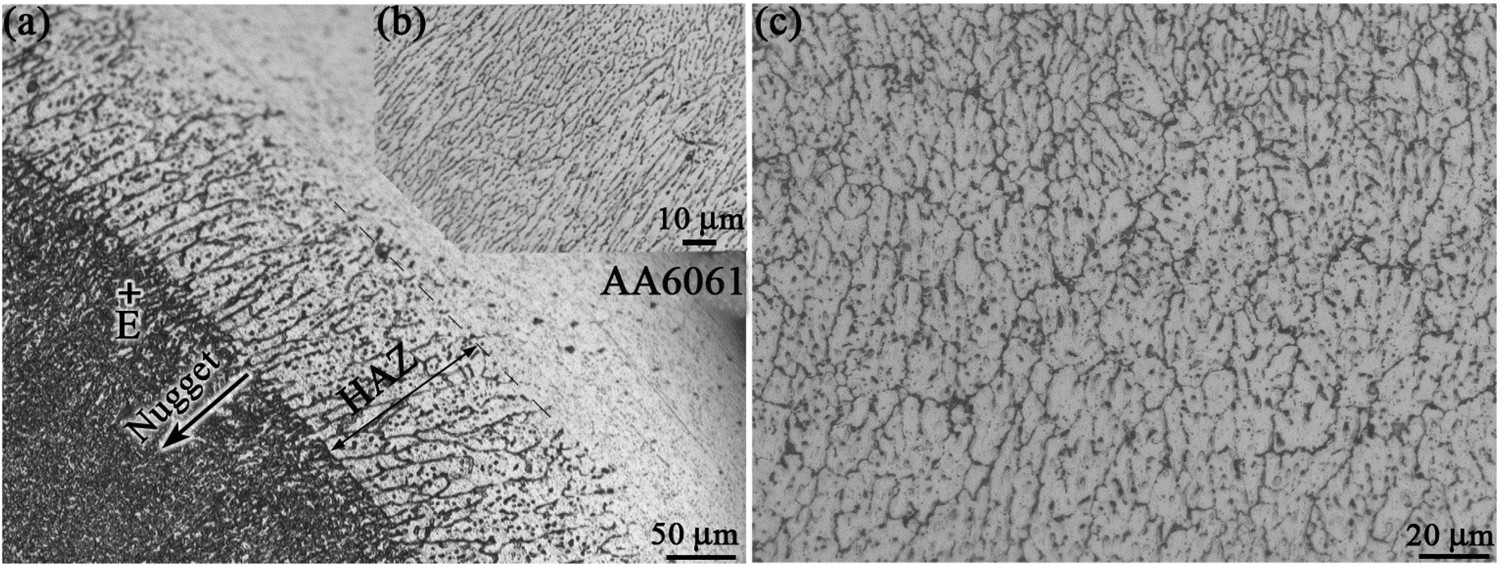
Figure 6 demonstrates the effects of welding current on the TSL and CTL of the joint. With increasing welding current, the TSL of the joint increased within the welding current range of 14–26 kA, and then decreased above the welding current of 26 kA. The maximum TSL of 5.82 kN was obtained at the welding current of 26 kA. On the other hand, the CTL of the joint first also increased and then decreased with increasing welding current. When the welding current was 20 kA, the CTL of the joint achieved the maximum value, which was about 1.92 kN. The diameter of nugget increased with increasing welding current in the range of 14–18 kA. When the welding current was 18 kA, the diameter of nugget reached 6 mm, and the welding current continued to increase, so did the nugget extension width as demonstrated in Figure 2. As a result, the bearing area of the joint increased with increasing welding current. However, when the welding current was too large, the RL formed at the interface between the upper plate and the lower plate was thicker, the pores formed in the nugget were more serious, and the electrode indentation was deeper. Therefore, the TSL of the joint tended to decline when the welding current exceeded 26 kA. For similar reasons, the CTL of the joint also showed a trend of first increasing and then decreasing with the increase of welding current. Because the direction of load borne by the joint was perpendicular to the interface between the upper plate and the lower plate in the cross tension test, the CTL was more sensitive to discontinuous defects such as holes and RL at the interface between the MS and the AA. This is the reason why the CTL reached the inflection point before TSL with the extension of welding time.
Effects of welding current on the TSL and CTL of joint. Effects of welding time on the TSL and CTL of joint. Fracture of joint, (a) AA side; (b) enlarged view at B1; (c) HAZ; (b) enlarged view at C1; (d) MS side; (e) enlarged view at E1; (f) enlarged view at F1.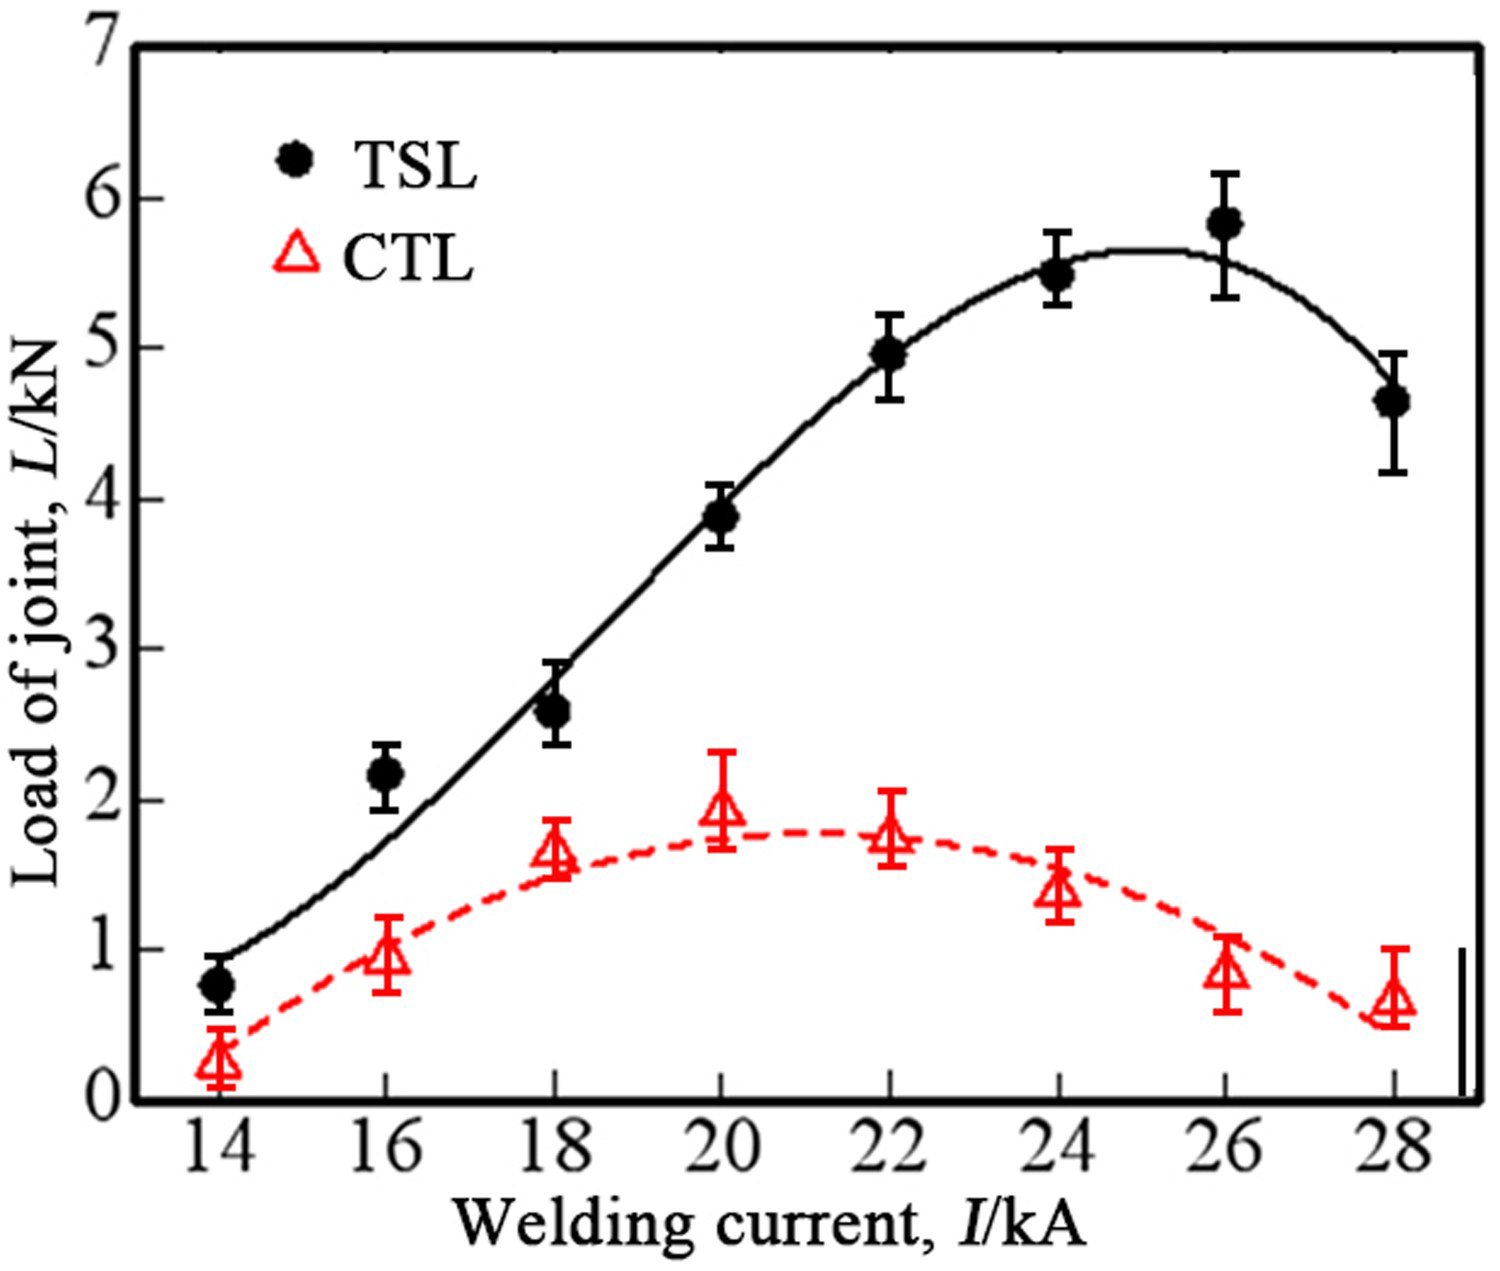
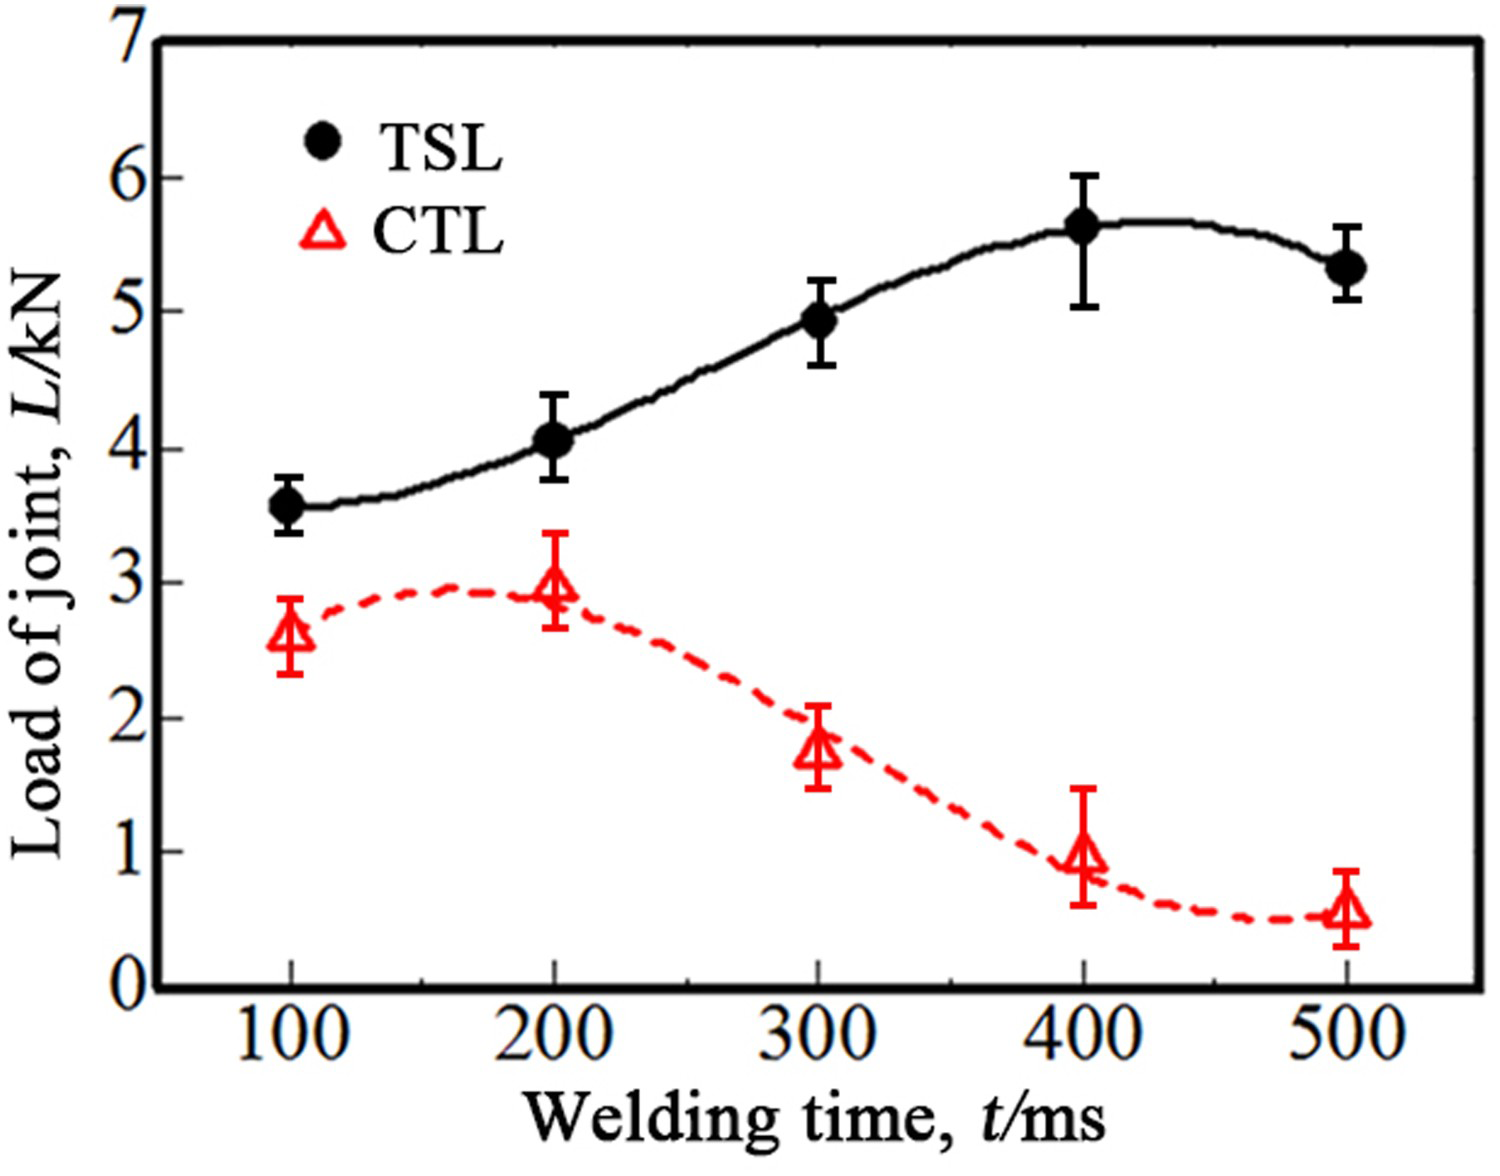
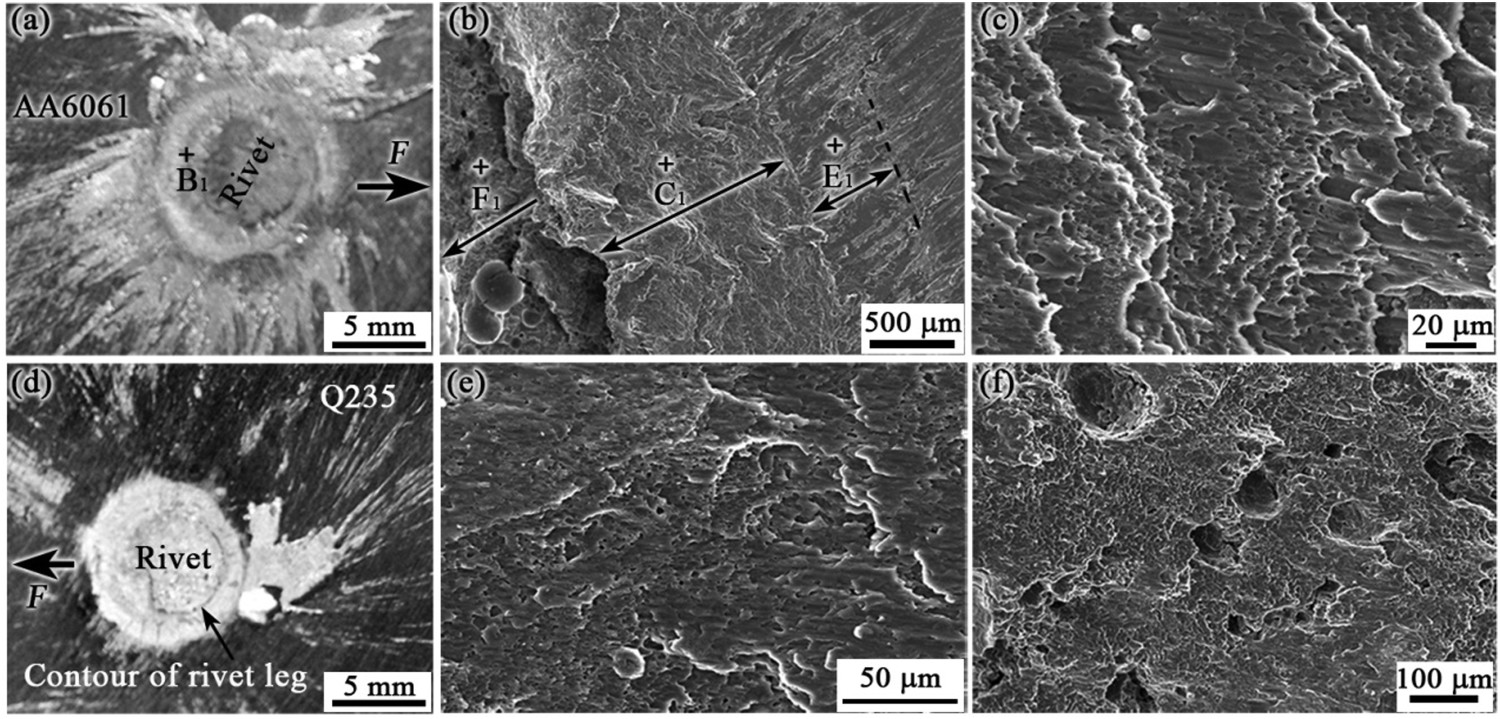
Figure 7 demonstrates the effects of welding time on the TSL and CTL of the joint. With the extension of welding time, the TSL and CTL of the joint increased first and then decreased. The TSL and CTL of the joint achieved the maximum values of 5.64 and 2.96 kN at 400 and 200 ms, respectively. Welding time is also a factor affecting heat generation during RSW. With the increase of welding time, more heat can be generated and more metals can be melted to form a larger nugget. However, too long welding time also caused more holes in the nugget, deeper electrode indentation and thicker RL formed at the interface between the MS and AA. The combined action of two types of factors made the CTL of the joint increase first and then decreased with the extension of welding time.
In the tensile shear and cross tension tests, the failure mode of the joint was rivet tip fracture. Figure 8(a,d) shows typical fracture of AA side and MS side of the joint fractured by tensile shear tests, respectively. The joint was welded at 20 kA welding current, 300 ms welding time and 3.1 kN electrode force. Notably, some residues of splash were observed on both fractures of the joint, which also confirmed the occurrence of interplate splash during welding. As mentioned earlier, this was also a major factor in the formation of the hole in the nugget. It can be seen from Figure 8(d) that there was aluminium on the outside of the rivet tip contour. In terms of geometric correspondence, this region corresponds to the nugget extension as shown in Figure 1(d). Combined with the characteristics of the fracture on both sides, it can be concluded that the failure occurred in the AA in this region.
Figure 8(b) shows an enlarged view at the position of B1 in Figure 8(a). According to the surface characteristics of the fracture, the fracture can be divided into three regions. Figure 8(c) displays an enlarged view at C1 in Figure 8(b), where some parabolic dimples were observed. This reveals the region was torn by the force during the tensile shear testing. Figure 8(e) shows an enlarged view at E1 position where was the outer region of the fracture as demonstrated in Figure 8(b). Although the torn traces were also observed in the region, its surface undulation was gentler than at C1 region as shown in Figure 8(c). From the perspective of geometry, the region is in the nugget extension part, which was composed of coarse columnar crystals. Therefore, the increase of nugget extension width (W) can amplify the bearing area of the joint, which is beneficial to increase the TSL of the joint. Figure 8(f) shows an enlarged view at F1 position where was the central region of the fracture as demonstrated in Figure 8(b). Holes were observed at the region in the fracture. This indicates that the crack propagated through the holes when the joint failed. The formation of holes in the nugget reduces the bearing area of the joint and affects the performance of the joint.
Conclusions
Through the study, the following conclusions can be drawn:
A nugget formed at the interface between rivet tip and AA of lower plate. The MS did not melt in the joint when AA6061 AA and Q235 MS were welded by REW with an element of aluminium. The TSL and CTL of the joint increased first and then decreased with increasing welding current and welding time. The maximum TSL and CTL values of the joint were 5.82 and 2.96 kN, respectively. The highest temperature and high-temperature duration of each point at the interface between the rivet tip and upper plate MS during welding varied with its position. The thickness of the RL formed at the interface also varied with its location. The REW between AA and MS using aluminium rivet as an element can change the bearing interface of the joint into like-to-like interface of AA, and strengthen the joint.
Footnotes
Disclosure statement
No potential conflict of interest was reported by the author(s).