
Abstract
This paper investigates the microstructural characteristics of Ti layer in ultrasonic additive manufacturing of Ti/Al laminate composites by electron backscattered diffraction and transmission electron microscopy. Results show that a face-centred cubic (FCC) phase is formed in the Ti matrix around the Ti/Al bonding interface, and it keeps
Introduction
Structural metal materials for engineering applications are expected to possess high strength and toughness combination to ensure durability. However, strength and toughness are mutually exclusive in general [1]. Joining dissimilar metals to fabricate layered structures has been proven to be an effective method in achieving required strength and toughness. In the last few decades, a variety of laminated metal composites (LMCs) such as Fe/Al, Ni/Ti and Ti/Al have been developed [2]. Among those LMCs, Ti/Al system is a desirable solution for exceptional mechanical properties within lightweight constraints. For example, in the aerospace field, the aircraft wing is usually a composite structure that consists of a titanium skin welded to an aluminium honeycomb. This structure was designed to balance the high performance and concurrent weight requirements [3]. Additionally, Ti/Al LMCs can be designed as cellular structures with a controllable thermal expansion coefficient for drastic environments use, such as the outer space with extreme temperature variations [4]. However, conventional LMCs forming processes such as hot press sintering (diffusion welding) and hot rolling are predisposed to induce the formation of undesirable and detrimental intermetallic compounds (IMCs) at the interlaminar bond interface, which may result in performance deterioration.
The ultrasonic additive manufacturing (UAM), which integrates ultrasonic consolidation (UC) and computer numerically controlled machining techniques allows obtaining the required geometry directly while avoiding IMC formation, ideally suited to joining dissimilar metals [5]. Since UC was first developed by White [6], it has become a widely utilised technique for manufacturing laminated metal structures. However, limited by the power of the present transducer, UC is relatively suitable for consolidation of metal/metal, where at least one has high plasticity, for instance Al/Al [7–9], Cu/Cu [10,11], Al/Cu [12,13], Al/Ti [14–16] and Al/steel [17,18]. In the case of harder/harder metals such as steel/steel [19–21], steel/Ti [22], steel/Ni [23], preheating, prolonging processing time and even post-treating are often required to obtain acceptable bond strength [19–21,23].
Thus far, numerous researchers have clarified the physical and metallurgical mechanisms involved in UC by characterising the microstructure around the consolidated interface [7,8,12–14,24]. It is generally accepted that during the UC of soft metals, e.g., Al/Al or Al/Cu, interfacial bonding is primally produced by shear deformation-induced dynamic recrystallisation [7,13]. A recent theoretical calculation has revealed that the temperature increase caused by interfacial friction may surpass the recrystallisation threshold [25], and careful microscopy observations of the consolidated interface confirmed grain refinement, which is associated with dynamic recrystallisation [16,18,26]. Furthermore, dynamic recrystallisation can enhance atomic mobility and thus facilitate the formation of metallurgical bonds [27]. In the case of dissimilar metals with varying degrees of softness or hardness, such as aluminium and titanium, it is widely acknowledged that shear deformation occurring at the interface of the soft metal plays a crucial role in achieving consolidation. Sridharan et al. [14] investigated the Ti/Al consolidation interface by electron back scatter diffraction (EBSD). It was discovered that the deformation is primarily concentrated within the Al layer, resulting in the development of robust recrystallisation texture ({100} < 110>) and shear texture ({112} < 111>) components, which are similar to those observed after accumulative roll bonding. They concluded that the severe shear deformation of Al at the interface is the primary mechanism for bond formation in UC of Ti/Al. However, those studies mostly focused on texture analysis of softer metal via EBSD, but precise characterisation performed by transmission electron microscopy (TEM) is still lacking, especially for harder metals.
When titanium and its alloys are subjected to severe plastic deformation such as ultrasonic surface rolling (USR), the transition from hexagonal close-packed (HCP) to face-centred cubic (FCC) structure could be activated to accommodate external strain, following two typical orientation relationships (ORs) between the two structures, namely the B-type OR (
Similar to USR, the UC process involves cyclic shear deformation under high-strain rate (>105 s−1) on the welding surfaces of the metal foils [33]. In the present study, a newly added interfacial forming mechanism, i.e. the formation of FCC phase induced by interface shearing during UC of commercially pure Ti/Al dissimilar metals was reported for the first time. Systematic characterisations were performed to investigate the microstructure change of Ti layer and reveal the morphology and crystallography, and formation mechanism of FCC phase.
Materials and methods
Commercially pure titanium (TA1, Fe ≤ 0.25, C ≤ 0.10, N ≤ 0.03, H ≤ 0.015, O ≤ 0.020, in wt-%) and pure aluminium (Al 1100, Mn ≤ 0.035, Zn ≤ 0.01, Cu ≤ 0.05, Si ≤ 0.45, Fe ≤ 0.35, in wt-%) foils were used as feedstock for the preparation of specimens via a very-high power (9 kW) UC machine. Both Ti and Al foils are 200 μm in thickness, and 24.5 mm in width. During the UC of Ti/Al foils, a bilayer Ti/Al consolidation unit in the order of Ti over Al was adopted, as shown in Figure 1(a). A pilot study was performed to determine viable consolidation parameters for Ti–Al builds. It was found that a satisfactory interfacial strength could be achieved using an oscillation amplitude that is greater than 24 μm when applying a normal load of 2000 N, a welding speed of 25 mm s–1 and a preheating temperature of 190°C. Subsequently, two oscillation amplitudes, namely the low amplitude (LA) of 28 μm and the high amplitude (HA) of 32 μm, were selected to investigate their influence on the interfacial microstructure due to the significantly increased bonding strength in the amplitude range from 28 to 32 μm. The cross-sectional characteristics of the LA and HA specimens are shown in Figure 1(c) and 1(d), respectively. It can be seen that excellent Ti/Al bonding is achieved. However, the interfacial morphologies of the two specimens are hardly distinguishable on this scale. A Ti foil was subjected to a one-pass consolidation process (UC-Ti) using the same parameters as HA to investigate the phase composition.
(a) Ultrasonic consolidation process and coordinate system definition of the sample, (b) testing region of EBSD and FIB sampling region of TEM, (c) and (d) SEM images of Ti/Al interface fabricated by LA and HA, respectively.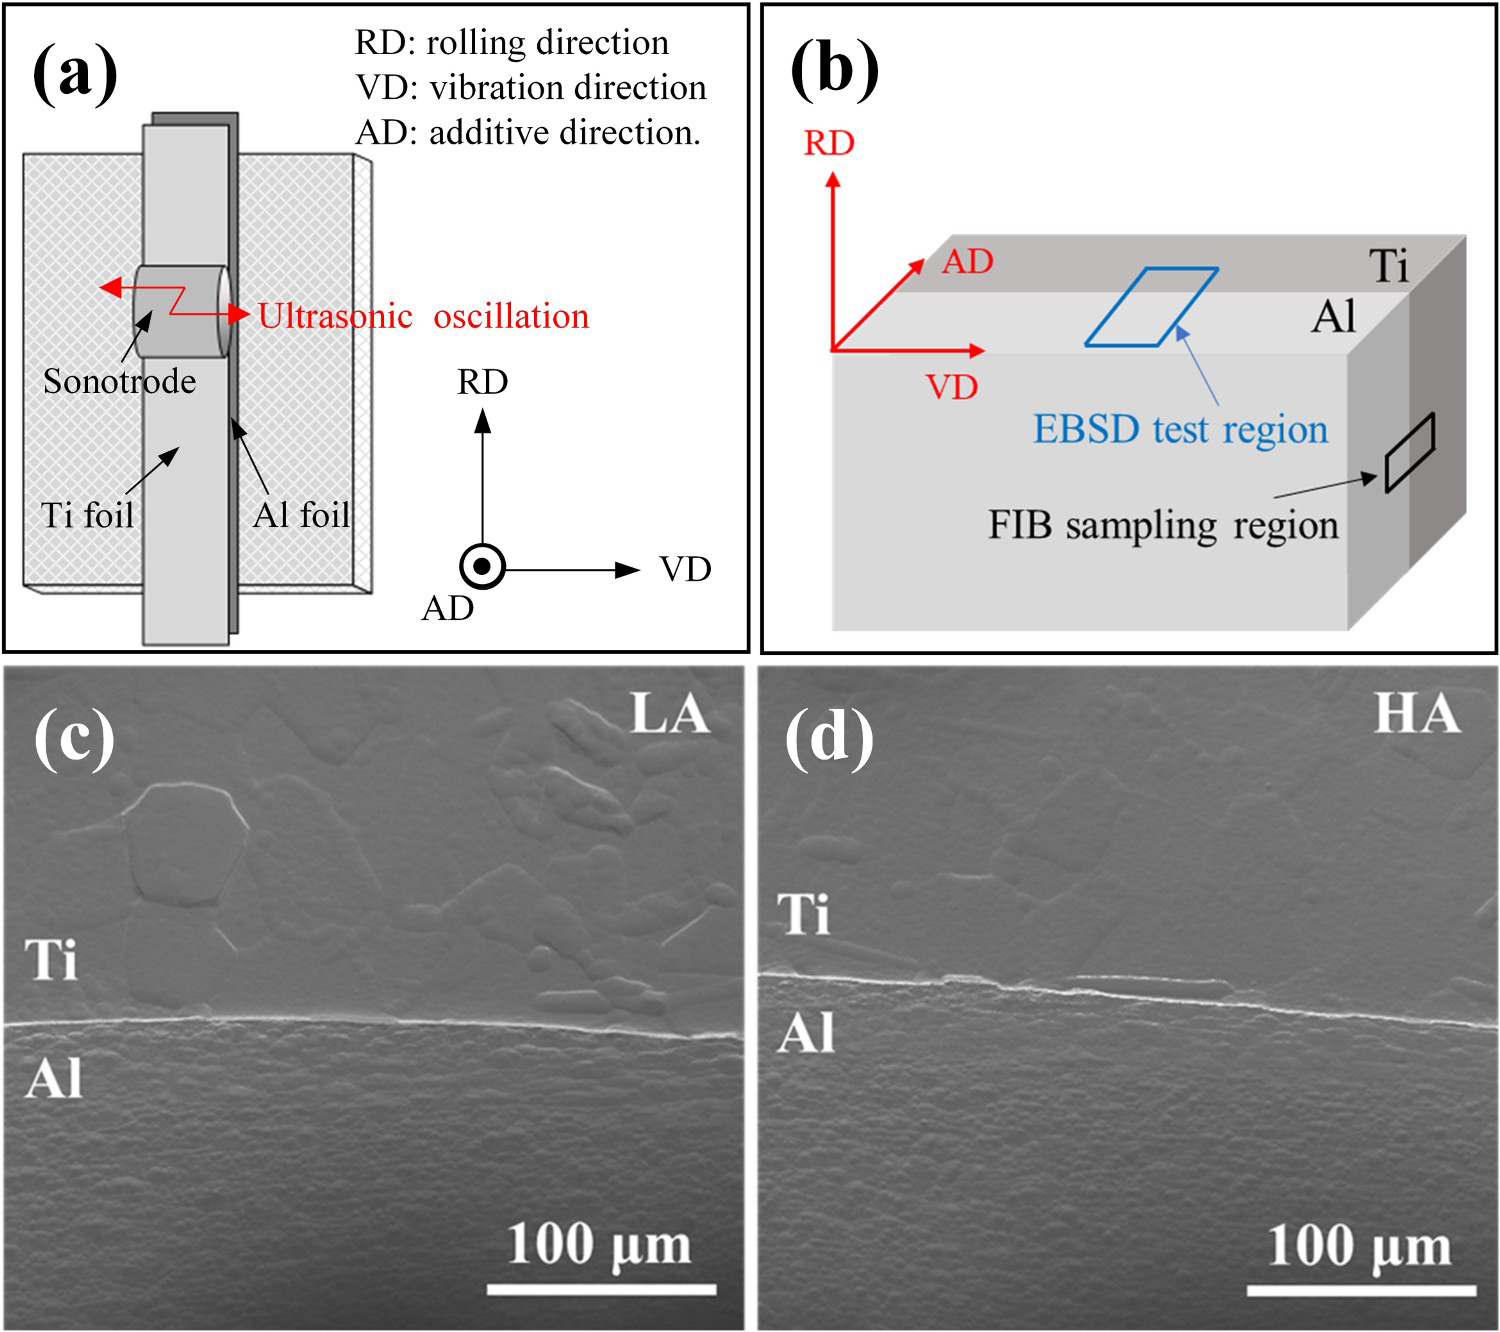
After argon beam milling, scanning electron microscopy (SEM, JSM-7200F) observation was carried out to examine the interfacial consolidation quality. EBSD analysis was performed via a Hitachi S-3400 N SEM equipped with an HKL-EBSD system to analyse the texture of the deformed region at a step size of 0.3 μm. All the SEM and EBSD observations were conducted in the AD-VD plane, as shown in Figure 1(b). In addition, the crystallographic orientation data of the Ti layer were collected utilising a scanning Osher nanoprobe (PHI 710) at a step size of 15 nm. Samples of the Ti/Al interface for precise TEM (FEI Talos F200) analysis were machined with a Ga+ -focused ion beam (FIB, FEI Helios Nanolab 600i), which were sampled from the AD-RD plane and welded to copper grids (Figure 1(b)). The UC-Ti for TEM (FEI Talos F200) observation was mechanically milled to a thickness of about 100 μm, followed by further reduction using a twin-jet electropolisher with voltage of 20 V at −25°C. The electrolyte was a solution of 90 vol. % methanol and 10 vol. % perchloric acid.
A universal testing machine (Instron 5500R) was used to characterise interfacial bonding strength through peeling tests in accordance with ASTM D3167 [34]. An HVS-1000A micro-Vickers sclerometer was employed to measure the microhardness distribution across the Ti/Al interface with a load of 25 g and holding time of 10 s. Three testing points with spacing of 150 μm in the direction perpendicular to the thickness were taken for one microhardness output at a position and per travel of 40 μm along the thickness direction was adopted.
Results and discussion
EBSD analysis around the Ti/Al interface
Analogous to the UAM of Ti/Al LMCs reported by Sridharan et al. [14], the visible deformation on the microscale is predominantly concentrated in the Al layer. Figure 2 shows the texture analysis of Al matrix near the interface. After UC process, a strong <011 > orientation can be found in the Al grains of sample LA, which is parallel to the sonotrode vibration direction. As marked in Figure 2(a and b), the dominant texture components in Region I contain Copper ({112} < 111>), S ({123} < 634>) and Brass ({110} < 112>), which are the typical rolling deformation texture components for FCC metals. Moreover, it is noted that the intensity of rolling texture in Region II and Region III decreases in turn. During the UAM process, thermal and acoustic softening effects facilitate interfacial plastic deformation [35], which results in further rolling deformation of the Al matrix near the interface (Region I). Therefore, the rolling texture is enhanced. While in the lower bulk region of the Al layer (Region III), the synergistic effect of preheating and friction causes slight recrystallisation, thus diminishing the intensity of rolling texture.
Microstructural characteristics around the interfaces of samples LA and HA: (a) inverse pole figure (IPF) map of LA interface, (b) polar figures (PFs) derived from IPF map region in (a), (c) the IPF map and (d) the PFs of the sample HA.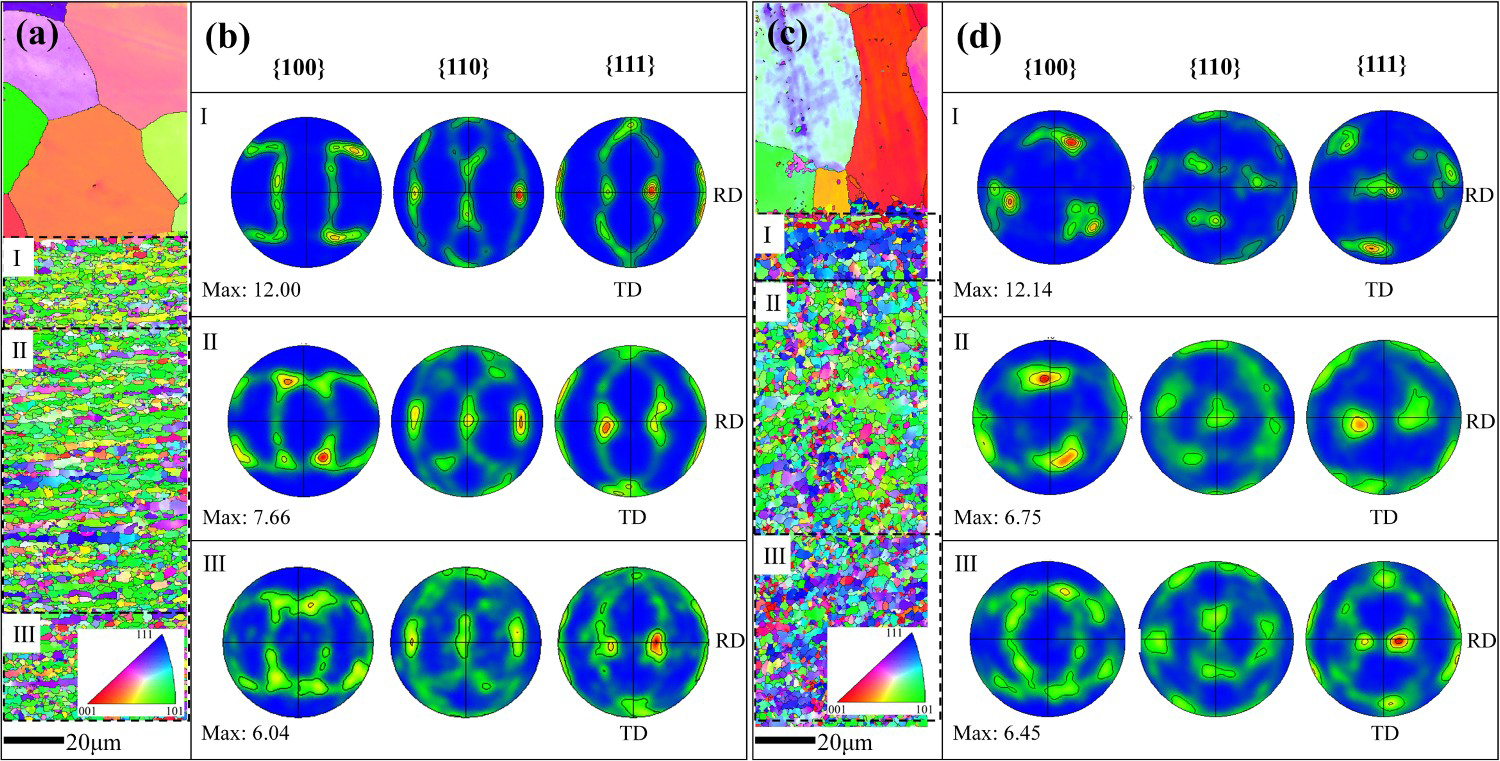
As a result of the increased degree of shear deformation created by the high amplitude, the dynamic recrystallisation driving force of the sample HA is much higher than that of sample LA. Additionally, the high amplitude results in a higher interfacial temperature rise, which contributes to accelerated interfacial migration during recrystallisation [25]. Consequently, the Al grains of sample HA exhibit more random orientation, but shear textures F ({111} < 112>) and E ({111} < 011>) were formed near the consolidated interface (Region I and Region II as marked in Figure 2(c)). However, the microstructure of lower bulk (Region III) is more affected by temperature rise, which shows a strong recrystallisation texture, while the rolling texture intensity is reduced significantly. In addition, recrystallisation textures including Cube ({011} < 100>) and Brass-R ({236} < 385>) are identified in both samples LA and HA.
The formation of shear texture in sample HA indicates that the high amplitude favours plastic deformation of Al near the interface. However, it remains unclear whether it is sufficient to trigger plastic deformation in micro-regions or induce local stress concentrations in the hard Ti layer. Therefore, the distribution of kernel average misorientation (KAM) was analysed to evaluate the local plastic strain in the Ti layer near the interface, as illustrated in Figure 3(a). It is evident that sample HA exhibits increased KAM values than sample LA. While the high KAM values can be attributed to the higher local plastic strain or lattice distortion associated with the high amplitude.
(a) KAM maps of the Ti/Al interface region of samples LA and HA, (b) inverse pole figure (IPF) map of the interested region in sample HA, (c) corresponding KAM map of (b), (d) the IPF map of the rectangular area marked in (c) with crystallographic orientation data acquired at a step size of 15 nm, (e) phases map of one grain separated from (d), (f) pole figure (PF) of HCP and FCC phases separated from (e).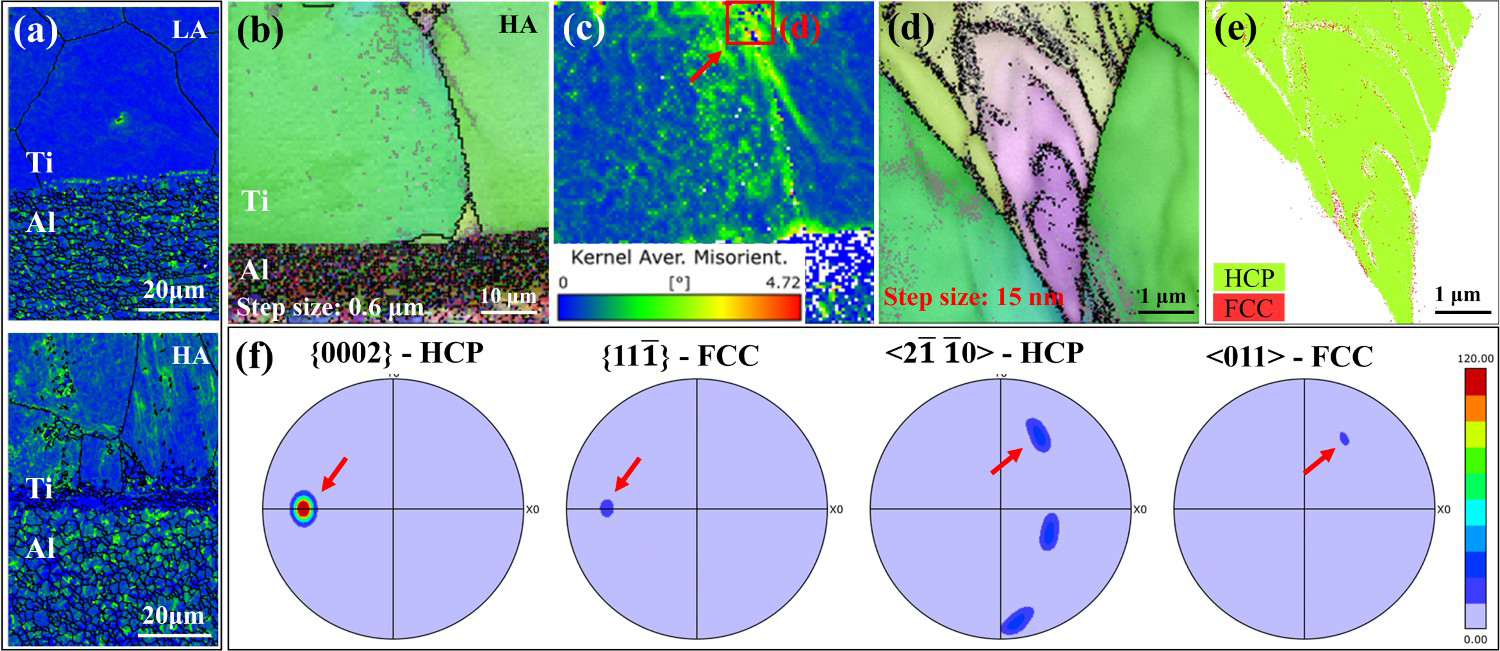
To further investigate the microstructural evolution of the Ti layer, precise EBSD analyses were conducted to examine the microstructure of the Ti side near the interface of sample HA. First, a 50 μm × 50 μm area was selected for crystallographic orientation data collection with a step size of 0.6 μm. Figure 3(b) presents the IPF map of the Ti/Al interface, and the corresponding KAM map (Figure 3(c)) shows a high KAM value of 4.72 for the region marked with a red rectangle, indicating that high local plastic strain is produced in the Ti matrix. Subsequently, the phase constituents were determined by precise crystallographic orientation data acquired at a step size of 15 nm. Figure 3(d) displays the IPF map of the high KAM value region with three grains contained. The middle grain was separated for determining the phase composition, as shown in Figure 3(e). As expected, the FCC phase is formed within grain or along grain boundaries and exhibits a punctiform distribution on the micron scale. Additionally, the FCC phase keeps the B-type OR with HCP-Ti, as clearly exhibited in the pole figure (Figure 3(f)).
TEM characterisation of Ti/Al interfacial microstructure
HRTEM analysis was performed to reveal the effect of ultrasonic oscillation amplitude on interfacial characteristics. Figure 4 displays the interfacial characteristics at the cross-section of sample LA. It is seen that superior metallurgical bonding is achieved from the bright field (BF) image (Figure 4(a)). However, there is barely interatomic diffusion occurring across the Ti/Al interface except that an oxygen-enriched layer is evident along the interface, as verified by the high angle annular dark field (HAADF) scanning TEM image (Figure 4(b)) and corresponding STEM-EDS mapping (Figure 4(c)) of the marked area in Figure 4(a). In addition, oxygen-enriched clumpy regions are present on the Al side. As a result of the friction between Ti and Al at the interface, alumina is partially removed from the surface of the raw Al foil and then dispersed into the soft Al matrix [12]. Across the interface arrowed in Figure 4(a), the concentration profiles of elements are shown in Figure 4(d). From the concentration variations of Ti and Al, it can be inferred that the interface width of Ti/Al is about 20 nm. However, considering interface tilting and the divergence effect of characteristic X-rays (spot size: ∼4 nm), the exact interface width should be narrower. Such trace amount of atomic diffusion across the interface are associated with the low welding temperature and short welding time of the UC process. In agreement with Ref. [14], the gradually varying concentration profiles also suggest that no intermetallic phase is formed. At low amplitudes, complete removal of surface oxides from Ti and Al foils is challenging, and those oxides may aggregate after consolidation. Furthermore, titanium and oxygen have a high affinity and tend to form solid solutions. Consequently, the O concentration is significantly elevated in the bonding region.
Interfacial characteristics of sample LA: (a) BF TEM image, (b) HAADF-STEM image of a region with a flat interface, (c) corresponding STEM-EDS mapping of the rectangular area marked in (a), (d) line scanning distribution of Ti, Al and O along the line in (a), (e) SAED and key diagram of Ti side near the interface, (f) DF TEM image of FCC-Ti and (g) HR-TEM image of the interface region and schematic diagram of formation of FCC-Ti by Frank partial dislocation.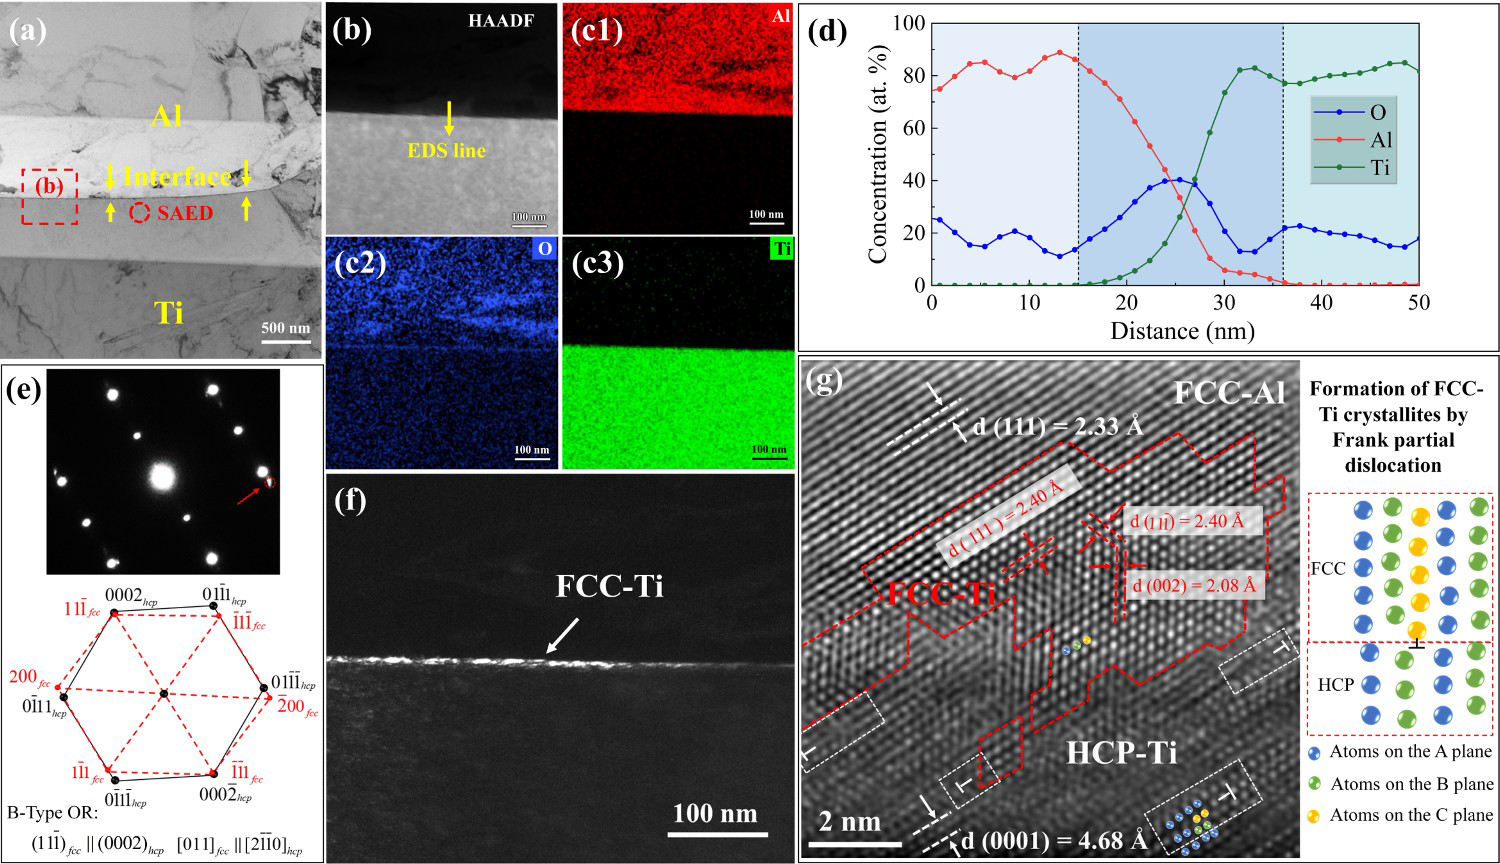
The selected area electron diffraction (SAED) was performed on the Ti side with a zone axis of
Unlike the straight bonding interface of sample LA, the interface of sample HA is relatively curved as shown in Figure 5(a), which can be attributed to the severe deformation under HA [10]. Although no visible diffusion layer is found on HAADF scanning TEM image (Figure 5(b)) and STEM-EDS mapping of Ti, Al and O (Figure 5c), there is a strip-like structure on Ti side near the interface, suggesting that part of HCP matrix may have undergone a phase transition. Figure 5(d) is the concentration profiles of elements across the interface marked by the arrows in Figure 5(c), the variation of the element concentration is similar to that of sample LA. The SAED of the marked region of Ti side near the interface (Figure 5(e)) reveals that the FCC phase is formed and it roughly obeys the B-Type OR with HCP matrix, described as Interfacial characteristics of sample HA: (a) BF TEM image, (b) elementary concentration profiles along the line in (a), (c) HAADF-STEM image of the region marked in (a) and (d) corresponding STEM-EDS mapping, (e) SAED and key diagram of Ti side near the interface, (f) DF TEM image of FCC-Ti.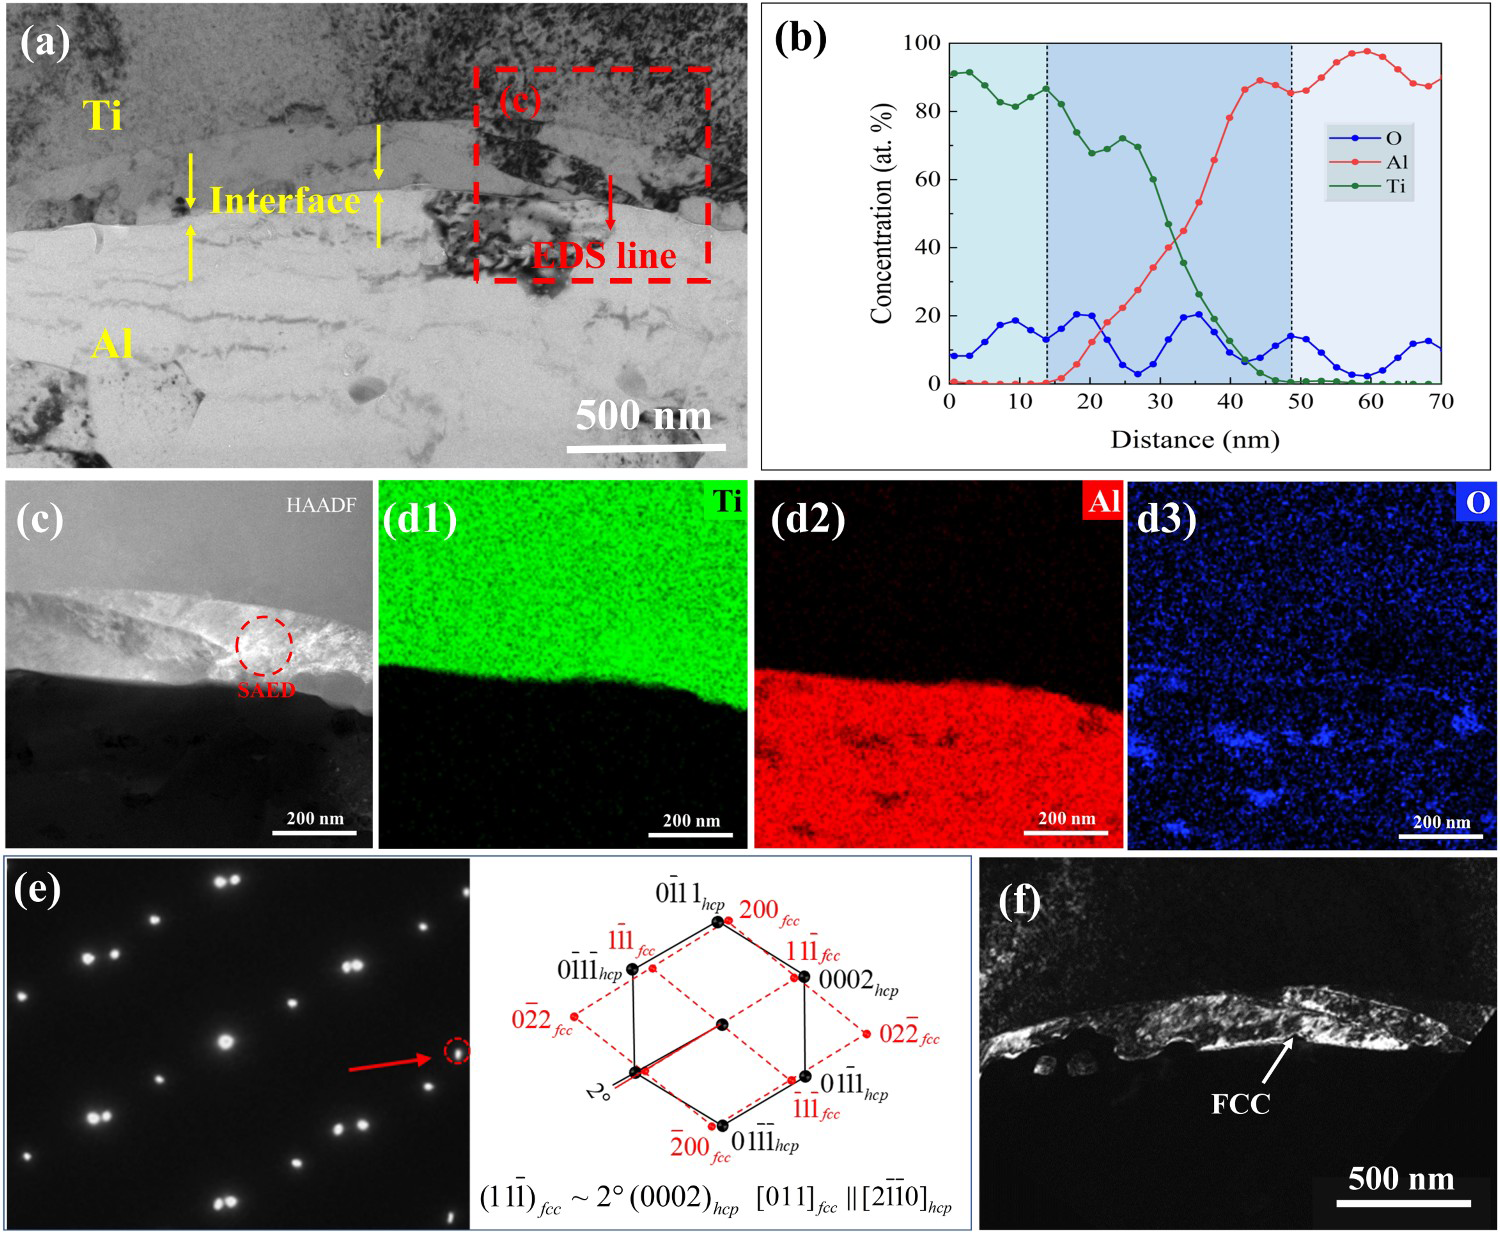
Figure 6(a) presents the HRTEM image of one end region of the FCC phase surrounded by SFs. The corresponding distribution of shear strain along the (a) HRTEM image of one end of FCC phase, (b) 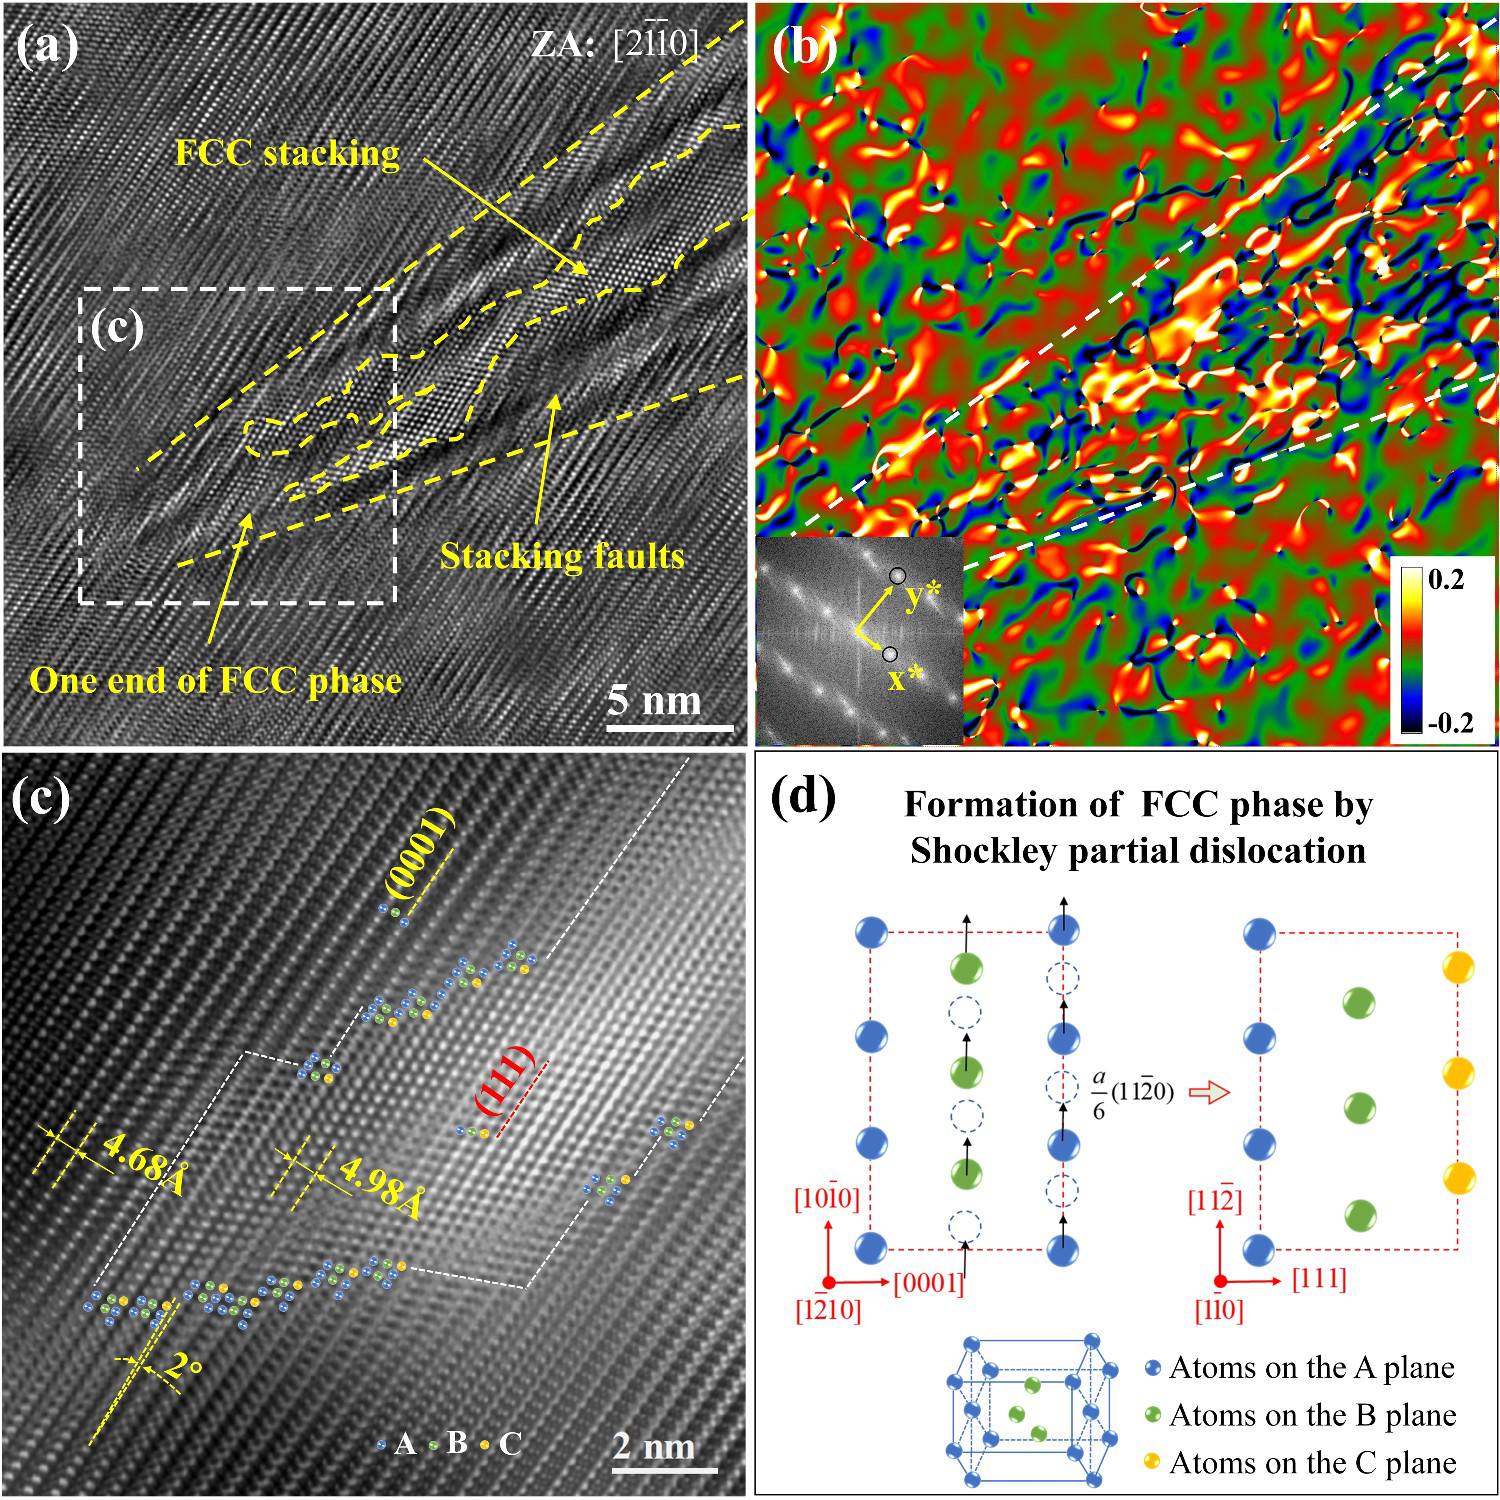
Reconfirmation of FCC phase formation induced by ultrasonic shear deformation
Variants of Ti hydrides related to hydrogen contamination during FIB have often been suggested as the culprit for the observed FCC Ti phase. The high-energy Ga+ ion may induce the formation of titanium hydrides (δ-TiH2, and or γ-TiH) with FCC structure [38,39]. However, most Ti hydrides are needle-like and show a low contrast in HAADF mode due to the small average atomic number. As shown in Figure 5(b), the FCC phase is bright in this study. Moreover, the samples prepared by a twin-jet electropolisher for TEM observation also contain the FCC phases, see Figure 7. The BF TEM image (Figure 7(a)) shows that the UC-Ti contains a quantity of deformation twin lamellae, implying that severe plastic deformation occurred. It is noted that a bulk structure formed at the tips of the twin has different diffraction contrast, as marked with a red circle in Figure 7(b). As expected, SAED performed by serial rotation from [001] to [011] zone axis confirms that the crystal structure of the bulk region is FCC (Figure 7(c and d)). Additionally, a strip-like structure attached to the twin boundary is also identified as FCC by serial rotation of the SEAD from [001] to [013] zone axis, as shown in Figure 7(e tog). The DF TEM image for the FCC structure phase taken by exciting (13 FCC phase in UC-Ti confirmed by TEM serial rotation: (a) microstructure of UC-Ti, (b) BF image of a region with a bulk FCC phase, (c) and (d) the corresponding diffraction patterns of [001] to [011] zone axes, (e) BF image of a region with strip-like FCC phase, (f) and (g) diffraction patterns of [001] to [013] zone axes, (h) DF TEM image of FCC phase taken by exciting (13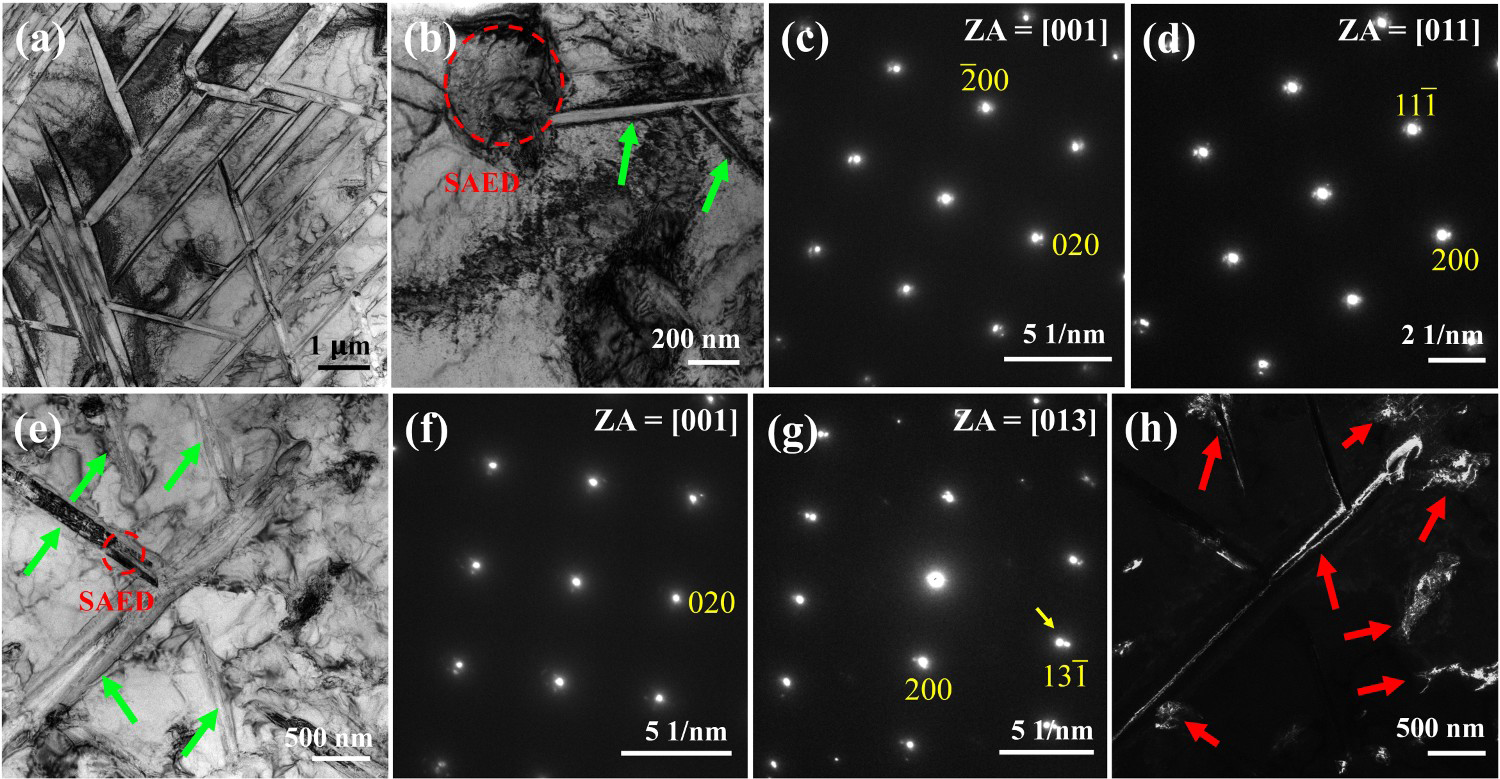
Bonding strength and microhardness of Ti/Al interface
Peeling tests were conducted to quantitatively determine the bonding strength of the interface. As shown in Figure 8(a), the peeling load of sample HA is significantly higher than that of sample LA, indicating that good interfacial bonding is achieved for HA. Figure 8(b) shows the fractured surfaces of Ti foils side after peeling test. It can be seen that more residual Al is attached to the fractured surface of sample HA. It means that the Ti/Al interfacial bonding strength is higher than that of the Al matrix. If the bonding strength of the weld interface for the joint is strong enough, the crack cannot propagate across the weld interface [41]. During the UC process, the high amplitude is more conductive to the dynamic recrystallisation, which results in higher strength metallurgical bonding [42].
(a) Peeling Load–Displacement curves of the Ti/Al bonding interface, (b) fractured surfaces of Ti foils side after peeling test, (c) microhardness profiles across the Ti/Al bonding interface and (d) schematic of microhardness test.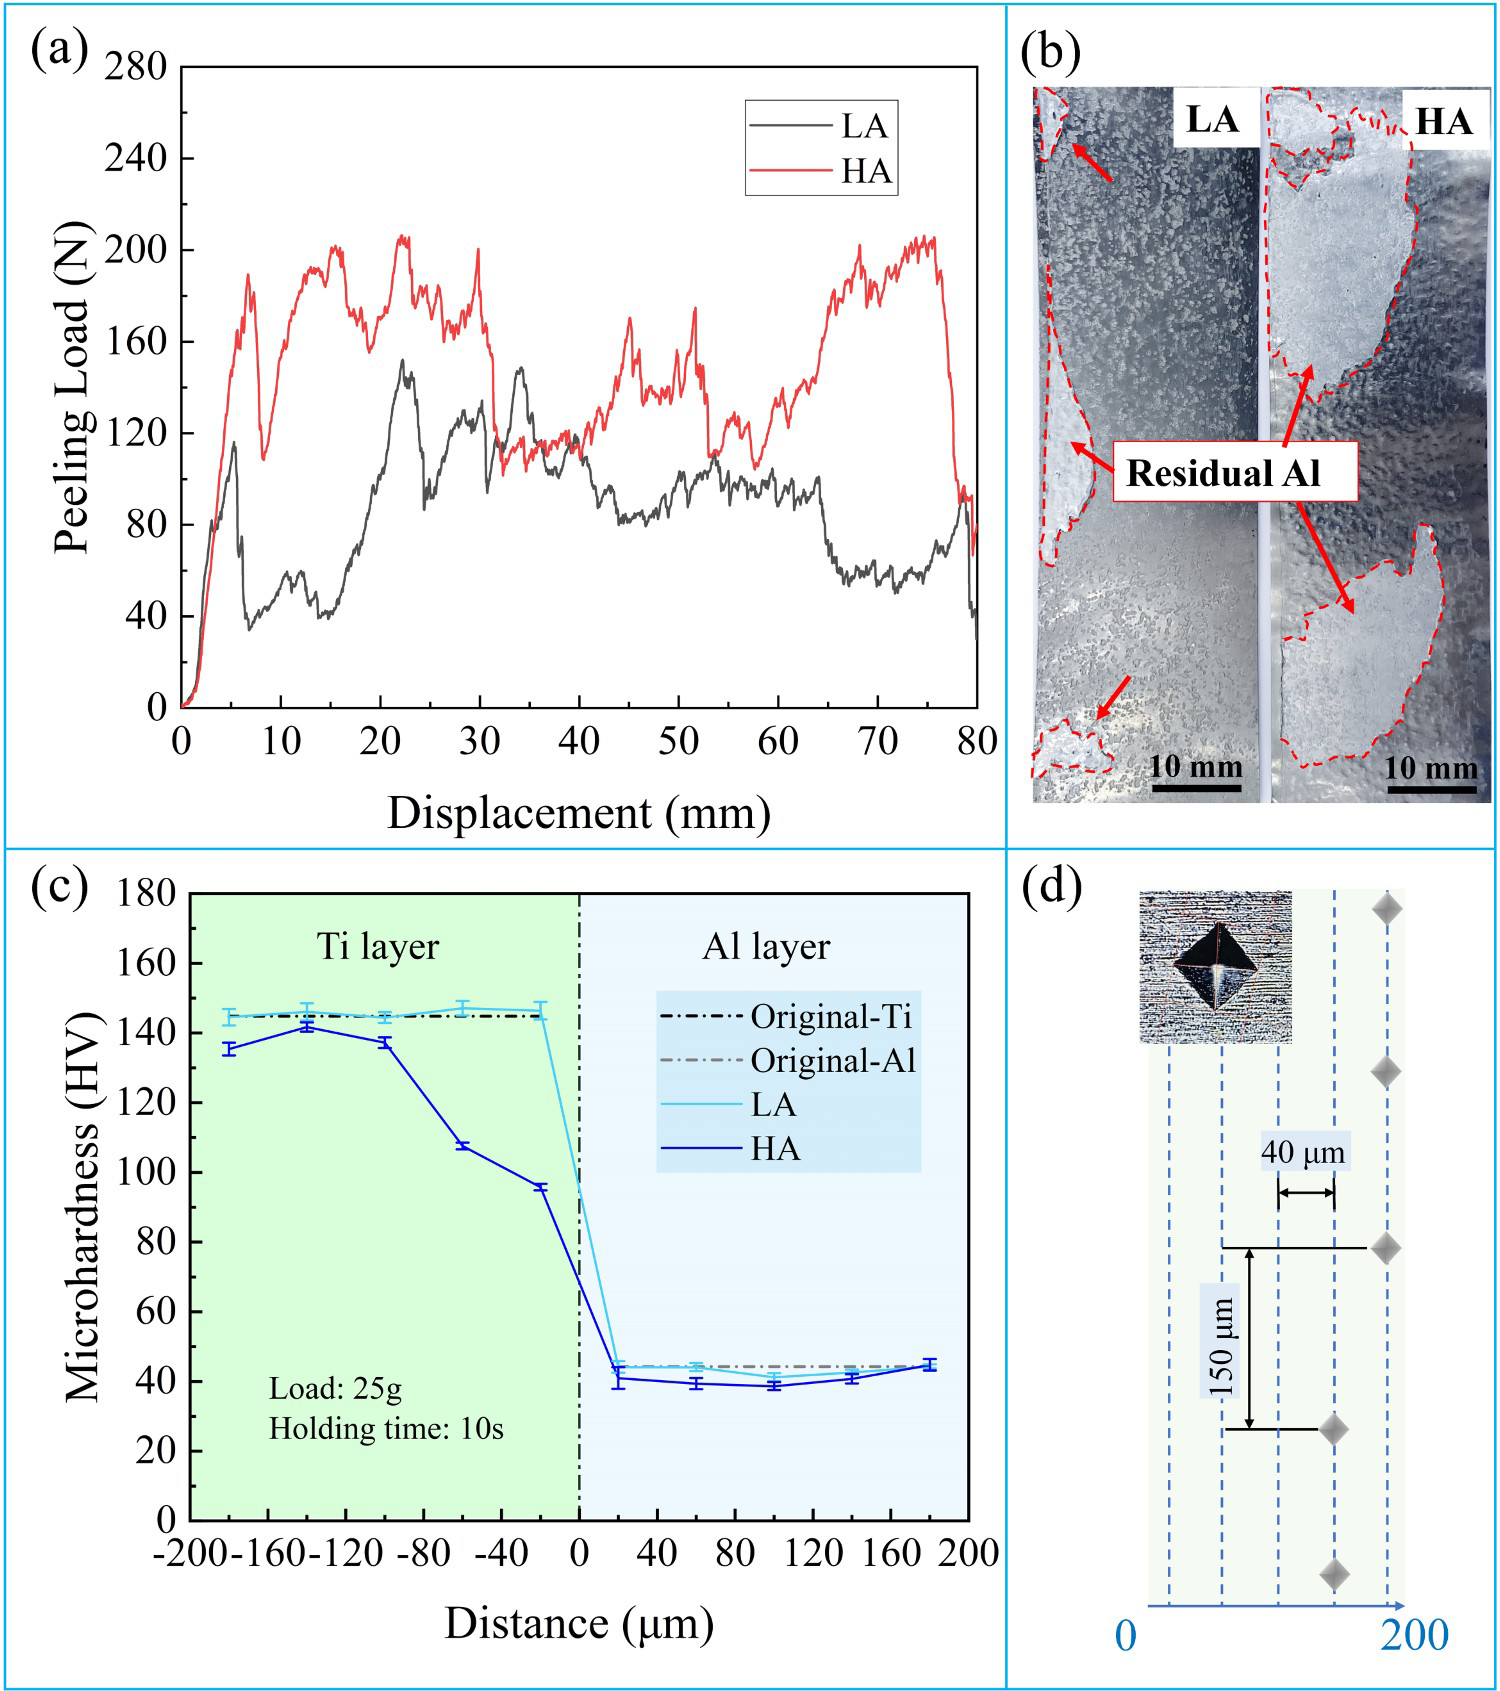
Moreover, the plastic deformability of the Ti layer can be improved when a high-volume fraction of FCC-Ti phase forms near the interface of sample HA [29,30]. This point is confirmed by microhardness testing across the interface, as shown in Figure 8(c). The decreased microhardness gradient across the Ti/Al interface due to the FCC-Ti formation can enhance the interfacial shear deformation ability. In addition, the mechanical interlocking of metal to oxide is a potential method of interlaminar bond formation [24], but its strength is obviously lower than that of the metallurgical bonding of metal to metal. Therefore, the higher O content could have harmful effect on the peeling properties for sample LA. Of course, other factors such as voids and roughness [43] also influence the bonding strength of the interface, and more work is needed later to clarify the effects. Obviously, this is beyond the scope of this paper.
Conclusion
In this paper, the microstructure of Ti layer in Ti/Al laminate composite fabricated by ultrasonic additive manufacturing (UAM) was systematic characterised via electron backscattered diffraction (EBSD) and transmission electron microscopy (TEM). Results show that the visible deformation on the microscale was predominantly concentrated in the Al layer with shear textures formed. In Ti layer, face-centred cubic (FCC) structure phase was formed near the Ti/Al interface, and it obeys
Footnotes
Disclosure statement
No potential conflict of interest was reported by the author(s).