
Abstract
This paper presents rate dependent uniaxial tensile behaviour and relaxation response of high strength acrylonitrile butadiene rubber (NBR) with moderate carbon black content. The rate dependent uniaxial tensile response is investigated for large deformations over moderate range of elongation rates (50–500 mm min−1). Effects of elongation rate on the overall deformation behaviour in terms of stress–strain response, total elongation at break as well as on the breaking stress of the material are investigated. Experimental results revealed that the material behaviour, including elongation at break and breaking stress, is rate dependent. Relaxation behaviour over a temperature range of 30–90
 C, investigated using uniaxial compression experiments, shows drop of stress over the duration of the tests. Additionally, a generic rate dependent hyperviscoelastic model to predict the rate dependent response of the material and simulations of the relaxation tests are presented. Single-step stress relaxation tests from an inbuilt experimental setup and tensile response obtained from test conducted at 200 mm/min elongation rate were used in calibration. The numerical results obtained are seen to be in good agreement with the experimental observations for the range of deformation rate and temperature considered in the uniaxial tensile and relaxation tests, respectively.
Keywords
Introduction
Nitrile Butadine Rubber (NBR) and its composite variants are synthetic rubbers that are termed as highly flexible materials. These materials find applications in diversified fields, e.g. aircraft, automotive and appliance industry, to name a few. More specifically, in automotive and aeronautical applications, they find use in fuel and oil hoses, grommets, seals, and self-sealing tanks, due to their excellent oil and fuel resistant properties. During service, they are subjected to complex loading conditions at harsh environments, for example, loading at different rates and temperatures. The resultant deformation of the material will involve moderate to large strains, tearing/breaking of the material and recovery. These responses can be highly sensitive to rate of loading and temperature. Design of ancillary components using these materials should account for such rate and temperature dependent characteristics of the material. Experimental studies for families of rubber material have been of interest in the past. In the 1960s, a need was felt to develop equipments in order to determine their physical and mechanical properties. Properties of rubber in pure homogeneous strain have been well documented by Jones and Treloar [1]. Measurements were carried out to develop the relationship between principal stresses and corresponding stretches. Such materials are known as hyperelastic materials owing to nature of their response. Ogden [2] has derived an energy functional for rubber materials, which can be used to estimate the various stresses as a function of stretches and material coefficients (termed as Ogden constants), whose values can be determined using experimental studies for uniaxial tension, pure shear and equibiaxial tension. In 1999, Buckley et al. [3] carried out biaxial experiments and showed how they benefit in obtaining the correct property estimates for the development of constitutive models. Hussein et al. [4] have compared the mechanical properties of NBR and Hydrogenated NBR (i.e. HNBR) blends for the same content of acrylonitrile and mooney viscosity. This study involved rheological, thermal, and mechanical testing. Comprehensive experimental studies of rubber-like materials have also been carried out by several researchers over the years, which cover tensile, stress relaxation, creep, thermomechanical, biaxial, planar compression, and planar tension investigations [5-8]. Over the last few decades, focus has been on the study of the NBR material behaviour subjected to deformation under quasi-static conditions, moderate to high elongation rates, dynamic loading and temperature related tests to investigate their recovery, creep and aging behaviour. Khan et al. [9] have analysed the large uniaxial deformation responses of HNBR and have concluded that HNBR is viscoelastic in nature as its stress–time relationship is nonlinear at various temperatures and strain rates. It was also found that the stress drop rate was function of strain rate. This rate was high at the beginning of the test, diminished and remained almost constant thereafter. Tension behaviour of HNBR over the temperature range of
 to 150
 was investigated by Ilseng et al. [10]. It was observed that stiffness and viscosity increased with decreasing temperature. These observations can be readily explained by the material behaviour changing from rubbery to glassy state. More recently, Akulichev et al. [11] have investigated the elastic recovery behaviour of HNBR subjected to low to moderate temperatures. In these experiments, the compression set was found to increase with cooling up to 100% at
 C, the glass transition temperature. Subsequently, with decrease in temperature below its glass transition temperature, the compression set was also found to decrease. Alcock et al. [12] investigated low temperature crystallisation of HNBR by subjecting it to low temperature storage (between 0 and
 C). The degree of crystallinity due to low temperature exposure was estimated to be quite small. This effect may have implications for low temperature sealing applications. For high acrylonitrile NBR, at low temperature, there is a possibility of crystallisation.
There are number of literature investigating the behaviour of the NBR with additives [13-16]. Typical additives added to NBR to improve their properties include high abrasion furnace black composites – with and without graphite, carbon black, fly ash, etc. In general, additives have been known to improve the storage modulus of the material. However, they also lead to decrease in the linear elastic region of the deformation response. It is also known that higher quantities of curing agent may have to be added in addition to fillers to obtain a more stable higher modulus. The filler-rubber bonding is also known to play a role in determining the material failure mode [16]. Bergström and Boyce [17] have critically investigated and simulated the mechanical response of hyperelastic materials. They evaluated the performance of NBR as a function of strain rate at constant strain, and observed that, for a broad range of strain rates, the stress is proportional to the logarithm of applied strain rates. They have also performed uniaxial compression tests at different strain rates and captured the hyperelasticity of NBR. Thermomechanical constitutive models of polymers based on experiments have also been developed by Bardenhagen et al. [18] in 1997, Khan and Zhang [19] in 2001, in 2006 by Khan et al. [20], and in 2006 by Khan and Farrokh [21]. The behaviour of the material at high strain rate has also received attention in the literature. Niemczura and Ravi-Chandar [22] have analysed latex and nitrile rubbers at higher strain rates (500−70,000 s−1) by examining waves propagated through them. They have analysed the effects of hysteretic material behaviour on the free retraction of prestretched rubber by utilizing a stress–strain power law model. Rate dependent testing of rubbers for various strain rates using testing devices such as Split-Hopkinson pressure bar, along with their constitutive modelling can be found in the literature [23-30]. A detailed review of constitutive behaviour modelling of rubber-like materials under quasistatic loading can be found in the work of Ali et al. [31] and Steinmann et al. [32]. A critical review of literature reveals that most of the efforts are focused on the rate dependent mechanical properties and recovery effects. There is not much literature available on the breaking stress and elongation at break of the material as a function of the elongation rates. Furthermore, relaxation behaviour of NBRs under compression at different temperatures is essential, since they may be subjected to a large range of temperatures. Additionally, constitutive model to predict the rate dependent behaviour of the material and simulation strategies to predict relaxation will be useful during the preliminary design of ancillary components using NBR materials. The following are the main objectives of the paper: (a) investigate the rate dependent stress–strain behaviour, elongation at break and breaking stress of the NBR material; (b) relaxation behaviour of the NBR material for a range of temperature; (c) demonstrate the capability of a generic hyper-viscoelastic model to predict the rate dependent behaviour of the NBR material and (d) simulate rate independent viscoelastic dominated relaxation behaviour of NBR. The shear modulus necessary for the hyperviscoelastic constitutive model has been determined from single-step stress relaxation tests in tension. The paper is organised as follows. In Section 2 presents the details of the material used in the experiments and the experimental methods. Experimental results are reported in Section 3. Section 4 describes the details of the constitutive modelling and simulations. The paper ends with important conclusions and summary of the work in Section 5.
Materials and experimental methods
Materials
Compound was cured at
 C for about 20 minutes. The scorch time (
 ), optimum cure time (
 ), minimum torque (
 ) and maximum torque (
 ) of NBR/CB blends were obtained using an oscillating disc rheometer, Geotech 3000 A type, in accordance with the ISO 3417 method to get cure rate index (CRI). These details are received as given by the rubber supplier. The CRI [33, 34] is defined as
 C [34] and apparent activation energy of 70 KJ mol−1 [35] is used in estimation of curing time.
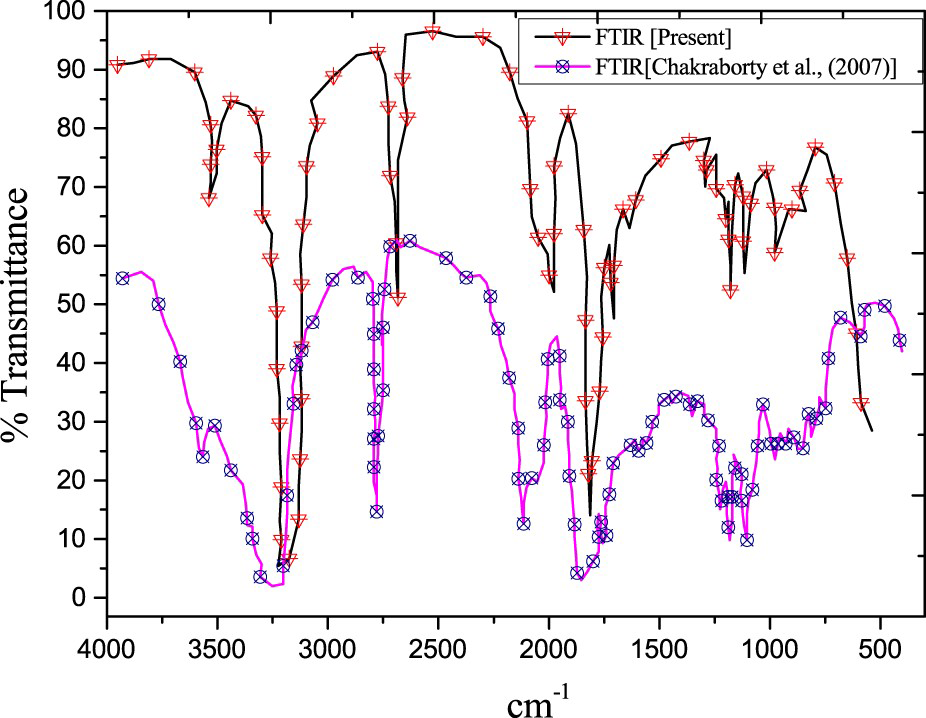
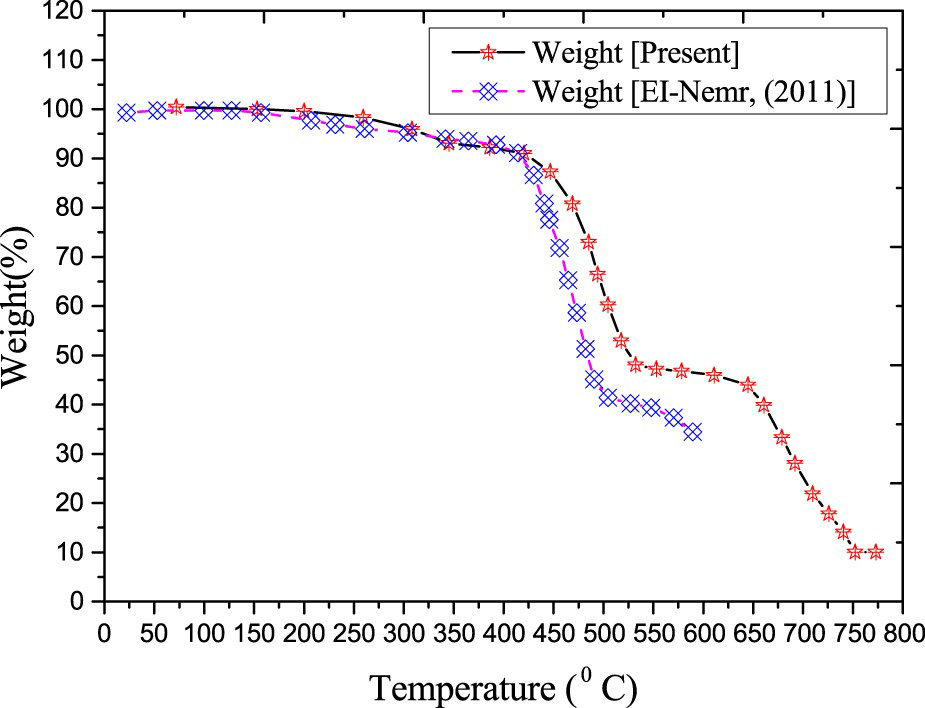
Since the compound under consideration is having more acrylonitrile, chemical analyses such as Fourier transform infrared spectroscopy (FTIR) and thermogravimetric analysis (TGA), have been carried out for the purpose of comparison with low strength NBR. Figures 1 and 2 show the data obtained from FTIR and TGA. These details confirm that the compound is a polymer with higher acrylonitrile having 55% of polymer and 33% of Carbon black. This matches with data from material composition. Glass transition temperature of the material is
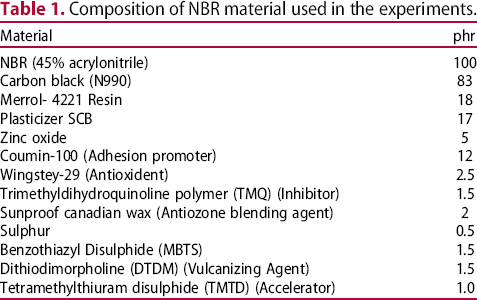
FTIR spectra of high strength NBR. FTIR data from low strength NBR reported by Chakraborty et al. [37] is shown for comparison. Weight (%) of high strength NBR sample against temperature obtained from thermogravimetric analysis test. Data corresponding to NBR material reported by EI-Nemr [38] is shown for comparison. Composition of NBR material used in the experiments. C. The difference in the composition between the NBR material used in the present study and those reported in literature [37, 38] can be seen in Figures 1 and 2. Composition of materials used in NBR compound is shown in Table 1. In the formulation used, carbon black type is thermax N990 and Wingstay 29 is used as antioxidant. It does have a chemical structure which is represented as p-oriented styrenated diphenylamine.
All the tension tests were conducted following the ASTM D-412-C and IS-3400 Type-2 standard. The tests were conducted at the elongation rates
 ranging from 50 to 500 mm/min. For each experimental case, at least three samples of the NBR material were tested to confirm the statistical representativeness of the measured data. The gauge length was noted by placing two white marks 20 mm apart at the central zone. Test specimen was gripped in the jaws, with inter-jaw distance varying from 45 to 55 mm. S-type load cell of 5 kN capacity was used in the tests along with video extensometer and computer interface for data acquisition. Video extensometer is used for measurement of distance as deformation is uniform between two markers. Transverse strains are not required to be measured as material is assumed to be incompressible. These tests were used to determine the stress–strain behaviour, breaking stress and elongation at break of the material. All the tensile tests were carried out under room temperature. Since the material can be affected by moisture, all the test specimens were conditioned under the humidity level of
 for over 24 hours before the experiments. There was no distinction between the stress–strain response obtained from the samples tested under ASTM D412 and IS 3400 standard; hence, no distinction will be done between the data obtained from the experiments following these two standards in the results and discussion. Tension test data was also used to determine the breaking stress and the elongation at break of the samples. Stress relaxation tests were carried out at ambient and elevated temperatures. Hence, all the stress relaxation in compression tests were carried out following the IS0 3384-1 standard. The material specimen geometry can be either cylindrical or ring as per the standard. In the current work, specimens of cylindrical shape having diameter of 29 mm and depth equal to 12 mm were considered. All the specimens were subjected to an initial compression of 14–16% and left to relax at each of the test temperature, ranging from 30 to 90
 C, for over 10 hours. Data from the tests were sampled every hour. Sufficient care was taken to ensure that there was no material failure at high temperatures.
Experimental results
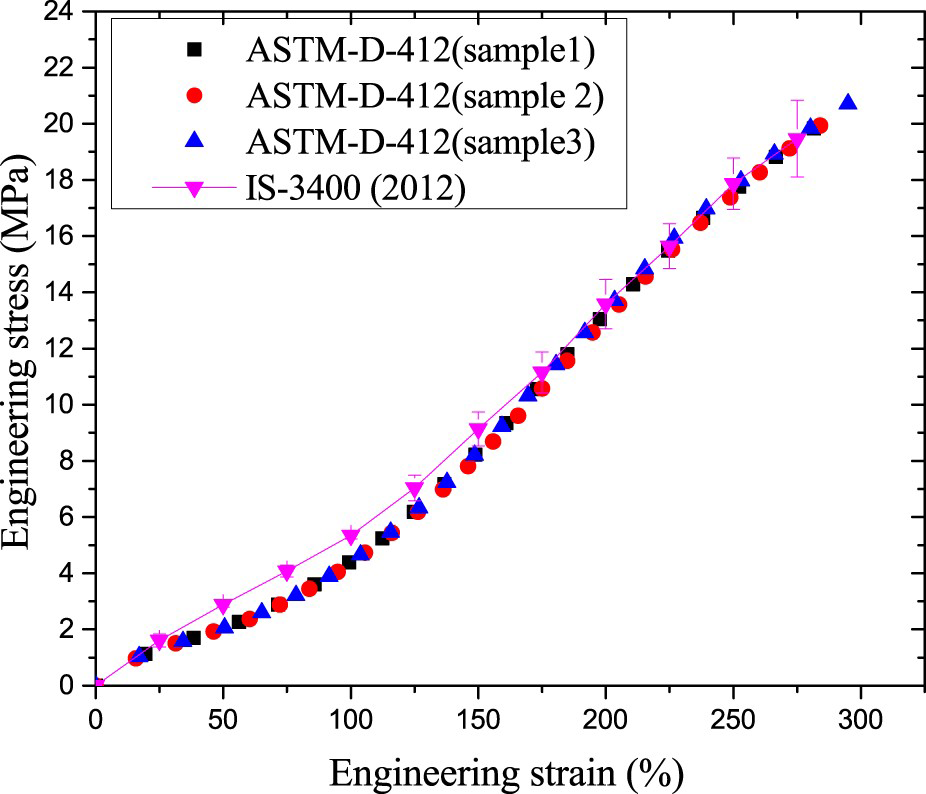
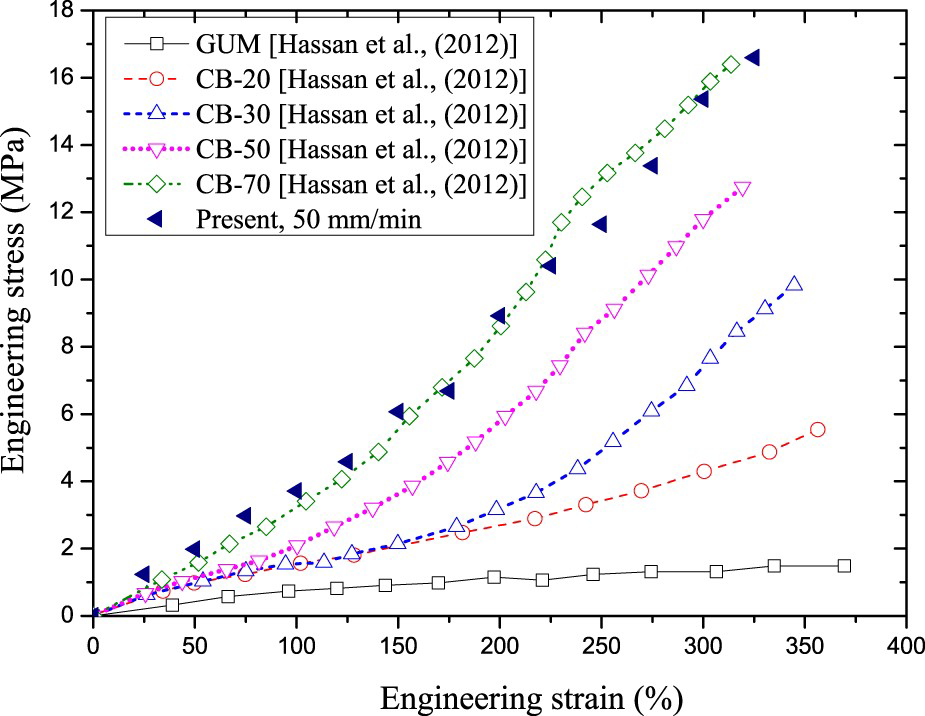
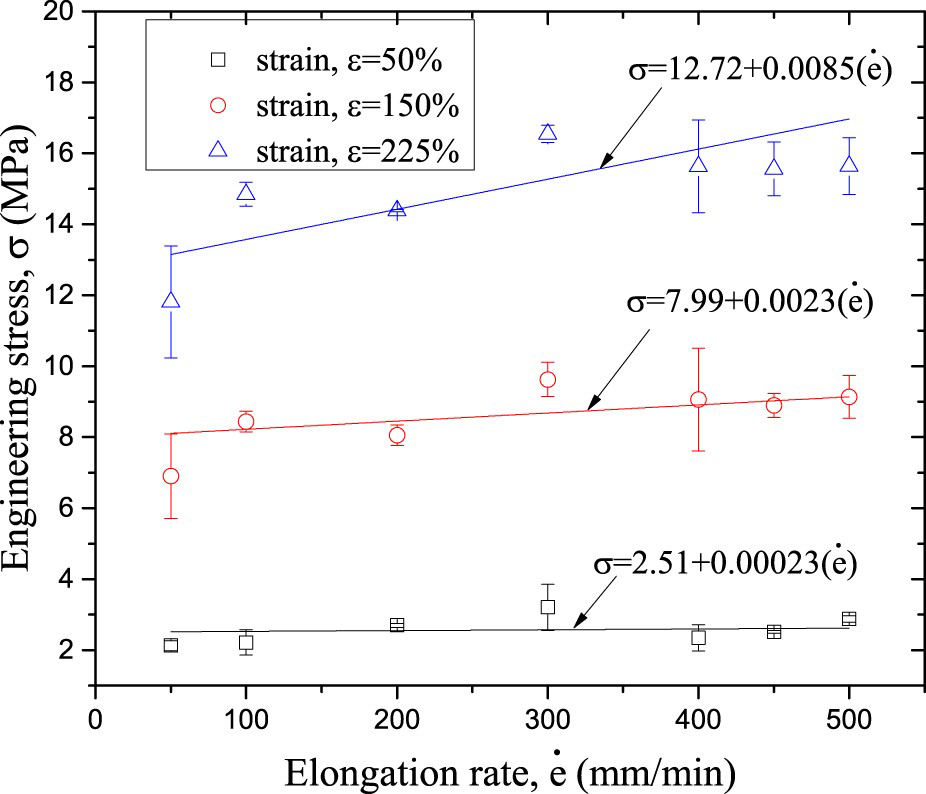
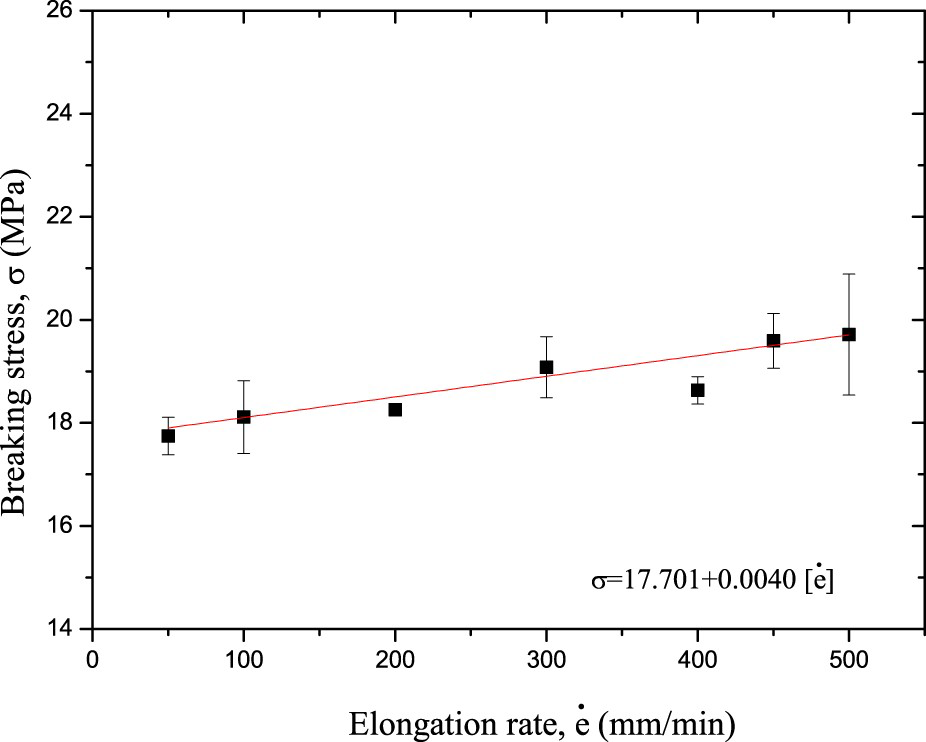
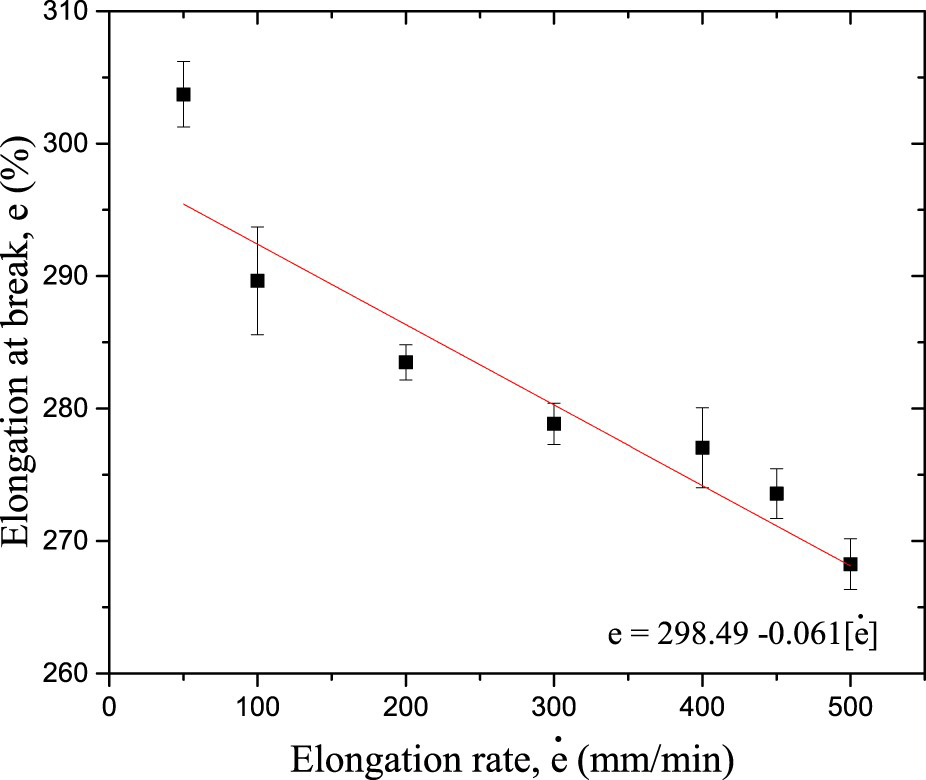
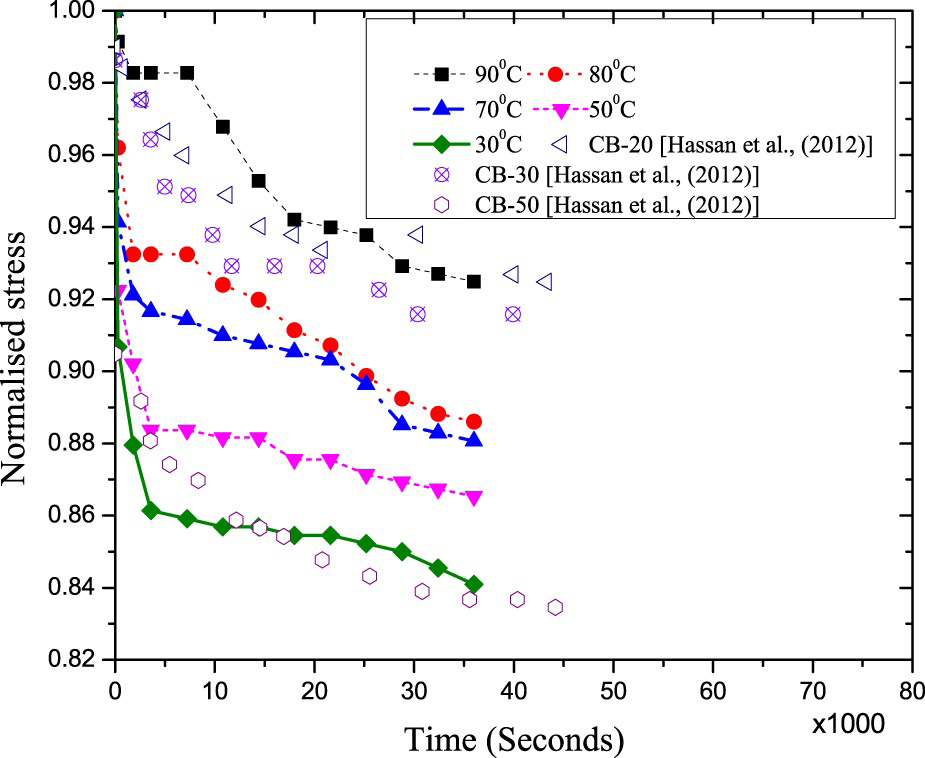
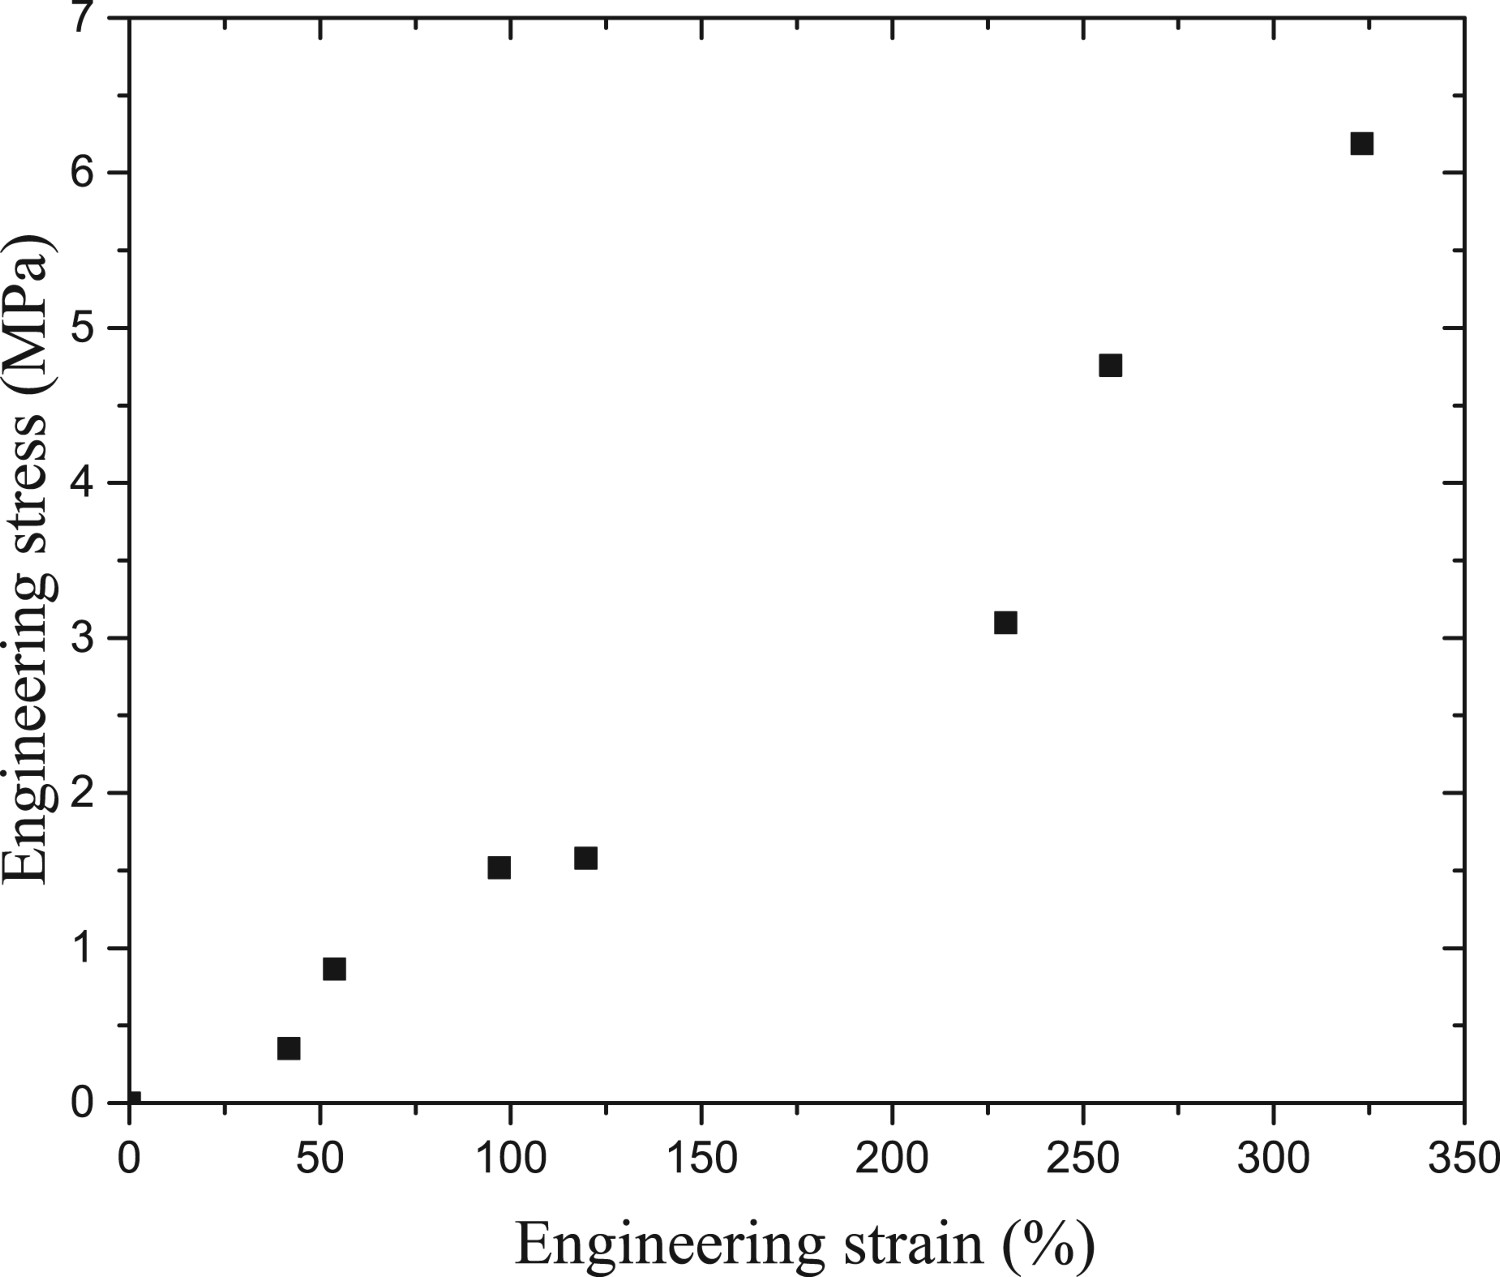
In this section, the experimental results obtained from the tension tests corresponding to different elongation rates and recovery tests at different temperatures are presented and discussed. A representative stress–strain behaviour of the NBR material from the tensile test conducted at an elongation rate of 500 mm/min following the ASTM D412 and IS 3400 is shown in Figure 3. It was observed that the response of the specimen did not differ based on the testing standard followed. In particular, before 30% and after 150% strain till failure, response did not differ as observed in Figure 3. At 75% strain, difference is 21.93%, at 100% it is 14.20%, while at other strains between 30–75% and 100–150%, it is below 10%. Error bars are shown in figure to know statistical variations. Hence, test data obtained from both the standards are included in the results without any distinction. The stress–strain response of the NBR material obtained from the test conducted at 50 mm/min elongation rate is compared with the response of the NBR material having different Carbon black percentages ([15]) in Figure 4. The engineering stress and strain are reported in Figures 3 and 4 to allow comparison with similar experimental data reported in the literature. In general, it was observed that the deformation response of the material, as in [15], was nonlinear. Three distinct regions can be identified in the stress–strain response of the material that are characterised by three different slopes. Stage-I is the initial regime up to 100% strain during which the rise in stress is gradual; but in stage-II, beyond 100% strain and below 200%, there is steep rise in stress or hardening in the material with deformation. Beyond 200%, the deformation is in stage-III regime where response shows some moderation in the build up of the stress with a reduced slope than during the stage-II phase. The stress at 300% strain in the experiment was found to be 17 MPa. This is approximately four times the stress reached in the low elongation rate experiment of the NBR with 20% Carbon black. The effect of the elongation rate on the stress–strain response of the NBR material is shown in Figure 5. It shows representative engineering stress against engineering strain. In experiments, at least three specimens were tested and mean values were obtained. It can be seen that irrespective of the elongation rate the overall stress–strain response is nonlinear. The stress–strain behaviour shows three distinct regimes under all the elongation rates used in the tensile tests. These three regimes identified in the response are more distinct when the material is deformed at lower elongation rate of 50 mm/min. This distinction begins to fade at higher elongation rates as observed from the stress–strain response of materials subjected to rates of 200 mm/min and above. The stage-I and stage-II hardening was observed to increase with increasing elongation rate but this effect was more in stage-II than in stage-I. Figure 6 shows the stress at 50, 150 and 225% in specimens subjected to different elongation rates in the range of 50–500 mm min−1. In general, it was observed that for a give strain the stress in the material increased with increase in elongation rate. However, from Figure 6, it can be observed that the rate of increase with elongation rate is higher at higher strains as seen from the slopes of the linear fits corresponding to different strains. This suggests that the stage-II hardening increases with increase in the elongation rate. The breaking stress of the material corresponding to different elongation rates is shown in Figure 7. Breaking stress is defined as the maximum stress beyond which a noticeable damage is initiated in the material. The stress in the material, subsequent to the damage initiation, begins to drop until the material completely undergoes failure. It was observed that the breaking stress increases with increase in the elongation rate. Although there were statistical variance in the data from the experiments, the general trend agrees with data reported in the literature [39]. The mean breaking stress (engineering) of the material, when subjected to 500 mm min−1 elongation rate, was found to be more than 10.55% of the breaking stress of the material undergoing deformation at 50 mm/min elongation rate. The corresponding data of elongation at break is shown in Figure 8. It was observed that the capability of the material to stretch before break decreased with increasing elongation rate of deformation. This was due to the high stress developed within the material at a given strain with increasing elongation rate. Furthermore, this result is in contrast to the behaviour observed in SBR material. Experimental results for SBR materials [39] show that elongation rate does not have any effect on the elongation at break. This contrasting behaviour maybe an effect of cross linking of long chains and their bond breaking observed at higher elongation rates when compared to lower elongation rates in NBR materials as observed in [39]. Stress relaxation response from compression set experiments is shown in Figures 9 and 10. The relaxation response is shown for temperatures ranging from 30 to
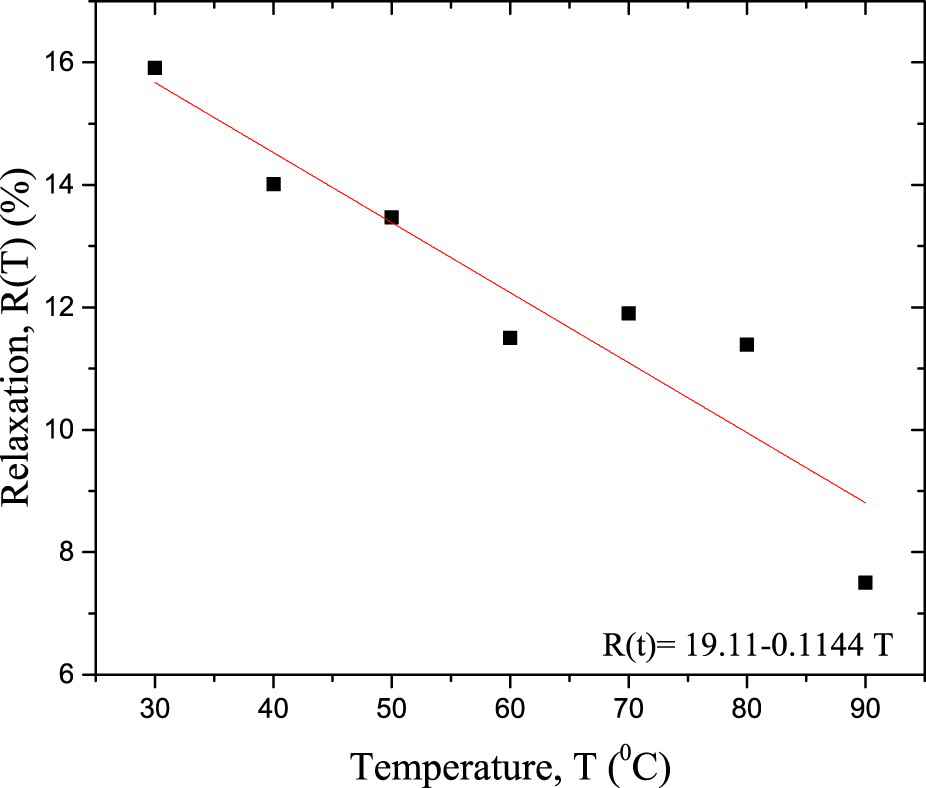
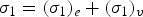
Engineering stress–engineering strain response of high strength NBR subjected to an elongation rate of 500 mm min−1 from IS-3400 (2012) and ASTM-D-412 standard tests. Comparison of Engineering stress–engineering strain response of high strength NBR shown in comparison to the response of the NBR-CB materials reported in [15]. Engineering stress versus engineering strain response of high strength NBR subjected to tensile loading at different elongation rates. Engineering stress of the material when subjected to different elongation rates at 50, 150 and 225% strain. Tensile test data showing breaking stress versus elongation rate of high strength NBR. Engineering strain (% elongation at break) at failure of high strength NBR when subjected to tensile tests corresponding to different elongation rates. Normalised relaxation behaviour at different temperatures. Relaxation data from Hassan et al. [15] corresponding to NBR material with different Carbon black percentage is shown for comparison. Relaxation (%) versus temperature of high strength NBR from stress relaxation experiment. C. Considerable time was expended in conducting the tests (around 10 days in total). Each data is recorded after half hour for a period of five minutes to ensure that there are no significant variations in the observed data. Generally, the relaxation of rubber proceeds according to a slow powerlaw or even a logarithm. Therefore, Y -axis can be drawn as semi-log Y axis. The relative stress levels decayed with time and especially at higher temperature, this decay was found to be exponential. However, the decay was more in materials undergoing relaxation at lower temperatures. This behaviour of the material where its rate of relaxation increased with decreasing temperature was also observed in HNBR materials reported in [11]. In fact, in [11], they reported that no significant relaxation was observed in HNBR at temperatures below its glass transition temperature. For the purpose of comparison, relaxation response in NBR materials corresponding to different Carbon black content reported in [15] is also shown in Figure 9. In the case of NBR with different carbon black content, the rate of relaxation increased with Carbon black content in it. In Figure 10, relaxation (%),
 is defined as
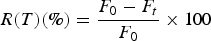
 is initial counterforce at the start of experiment at each temperature and
 is counterforce at any time t. In the next section, an attempt is made to present capability of a generic hyper-viscoelastic constitutive model to predict the rate dependent behaviour and only visoelastic behaviour to simulate the stress relaxation response of the material.
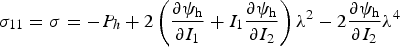
Deformation response of the NBR material consists of hyperelastic or quasistatic response and overstress or viscoelastic response. Material can be represented by elastic spring (say E), which is parallel with a Maxwell element (say M). The elastic springs A and B are hyperelastic. The total stress at any time can be considered as
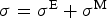 . Rate dependent force is taken care of by Maxwell element M through elastic spring. For very small loading rates, the deformation is governed by only spring E since the applied force is not transmitted through the viscous damper in M. The material is in fully relaxed mode and corresponding equilibrium response is captured by hyperelastic constitutive equation.
For incompressible material, three-dimensional hyperelastic constitutive equation can be written as
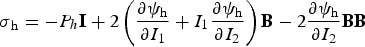
 is hydrostatic pressure imposed due to incompressibility condition;
 is energy density functional;
 and
and
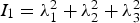
 are invariants of right Cauchy-Green tensor; left Cauchy- Green tensor
 ; right Cauchy- Green tensor is
 ;
;
 is the deformation gradient;
 =
=
 ;
;
 ; and
; and
 .
.
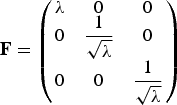
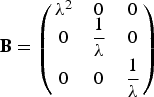
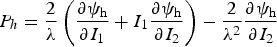
NBR is assumed to be an incompressible material in this work. The deformation gradient tensor for a material undergoing uniaxial tension can be represented as
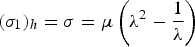
Energy functional for hyperelastic part (quasistatic response) is
 , μ being the shear modulus of the material.
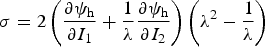
Following Equation (3), it is possible to write [40]
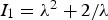 and
and
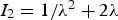 . Also, we have the conditions:
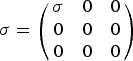
 , for plane stress and for uniaxial stress. The pressure can be expressed as
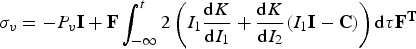
The rate effect in the material was determined by assuming a smooth polynomial based on the history effect of energy potential. Viscoelastic materials are having primary characteristic of retaining history of previous stress, strain and strain rates. For isotropic, homogeneous and incompressible material, constitutive relationship [41-44] can be expressed as
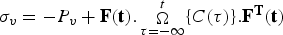
 is pressure for viscoelastic material, Ω being matrix functional describing effect of strain history on stress; and
 is the Green strain tensor. This relationship is objective [44]. For solids, numerical approximations are detailed in the work by [44-46] for the matrix functional Ω. More treatment on the constitutive models involving non-linerar viscosity is described by [46] while review of work done is explained in [47]. Major task to be considered here is to simplify the matrix functional Ω; for instance BKZ model [41, 42] and associated applications [48]. Stress due to viscosity can be expressed as
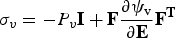

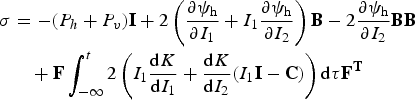
Using Equation (10) for hyperelastic response and Equation (15) for viscoelastic response, hyperviscoelastic constitutive rule can be represented as
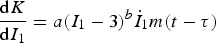
 is memory function;
 is the time rate of first invariant. Further


 are memory weight factors and
 are relaxation times. Substituting Equations (17)–(19) in Equation (16), we get the following form for the Cauchy stress

 ;
;
 ;
;
 is strain rate and ξ is a stretch like variable. The pressure due to viscoelasticity is obtained as


Basic elastic response of the material where time dependent component is not considered is known as the equilibrium response of the material. In the context of developed constitutive model, this is same as hyperelastic response. Uniaxial tests performed under near quasi-static conditions can be used to obtain the equilibrium response. These experiments are time consuming. Alternatively, single- or multi-step relaxation tests on the material can be done as proposed in [49]. In the current work, single-step relaxation tests at different strains have been performed. Furthermore, relaxations times are required to evaluate model. Though program is written to compute relaxation times, initial trial guess is required. Thus, solution obtained need not be global minimum. In order to support values of relaxation times at different elongation rates, these tests are performed. To conduct these tests, in-house testing facility is developed. Schematic describing the test setup is shown in Figure 11. At the left end, under the clamp, specimen is fixed which is customised dumbbell. Moving jaw has plate connected to it with other end of plate fixed to load cell via another clamp. This clamp is housing the load cell and other end of the clamp is bolted to a reciprocating rod of the pneumatic cylinder. Thus, as the rod reciprocates, moving jaw does. With specimen under the grip of the moving jaw, reaction force offered by rubber material could be easily captured. Developed establishment is also equipped with Arduino uno R3 controller and ultrasonic sensors for displacement measurements. Alternative arrangement using a scale is also made for displacement measurement and is thus a cross check. Setup is developed such that very low to moderate elongation rates are possible. Multiple tests are possible using the setup. In present work, it is used for tensile relaxation tests. Before the beginning of each experiment care must be taken to ensure that the test specimen does not slack that may lead to some twisting and sagging. The specimen is fixed at one end and at the other end highlighted in the schematic, a fixed displacement rate of lower magnitude is applied. Displacement rate was applied through the pneumatic actuator. Corresponding load is measured by load cell (force sensor). The capacity of the load sensor is 2 kN with a sensitivity of 1.999, i.e. nearly 2 mV/V. In more clear words, output generated by force sensor is 2 mV for excitation voltage of 1 V. Thus, for 10 V DC supply voltage which is recommended supply voltage for the selected force sensor, output generated will be 20 mV for rated load.
Test setup used for stress relaxation experiment.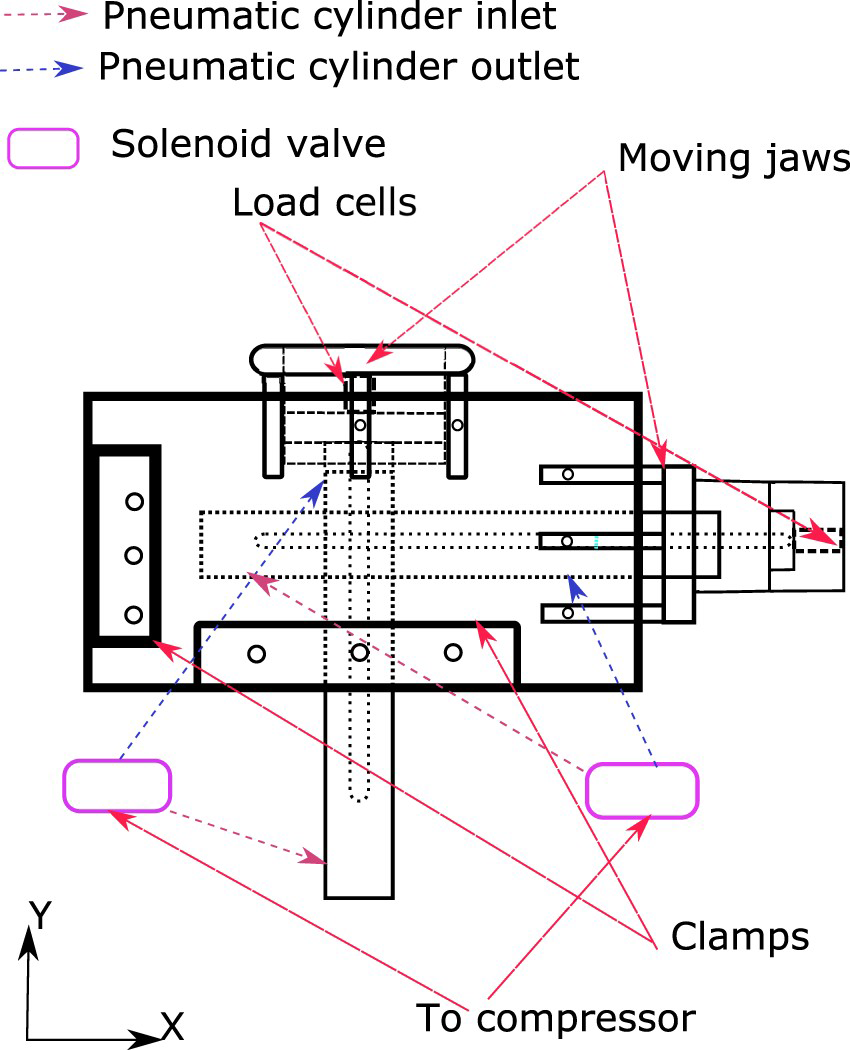
Test specimens were deformed in tension and held at a given strain for sufficient time period to attain equilibrium and stress relaxation. The stress relaxation response of the specimens from these interrupted tensile tests are shown in the Figure 12 and the equilibrium stress–strain response is depicted in Figure 13. To determine shear modulus based upon quasistatic data, data obtained as shown in Figure 13 is used. Unlike in other models, since the response is quasistatic, it is sufficient to use Neo-Hookean functional for the quasistatic part. At higher elongation rate and with additional tests, constants a and b were determined.
Stress relaxation in single-step tension relaxation test at different strains. Equilibrium stress versus strain response of high strength NBR from tensile stress relaxation test.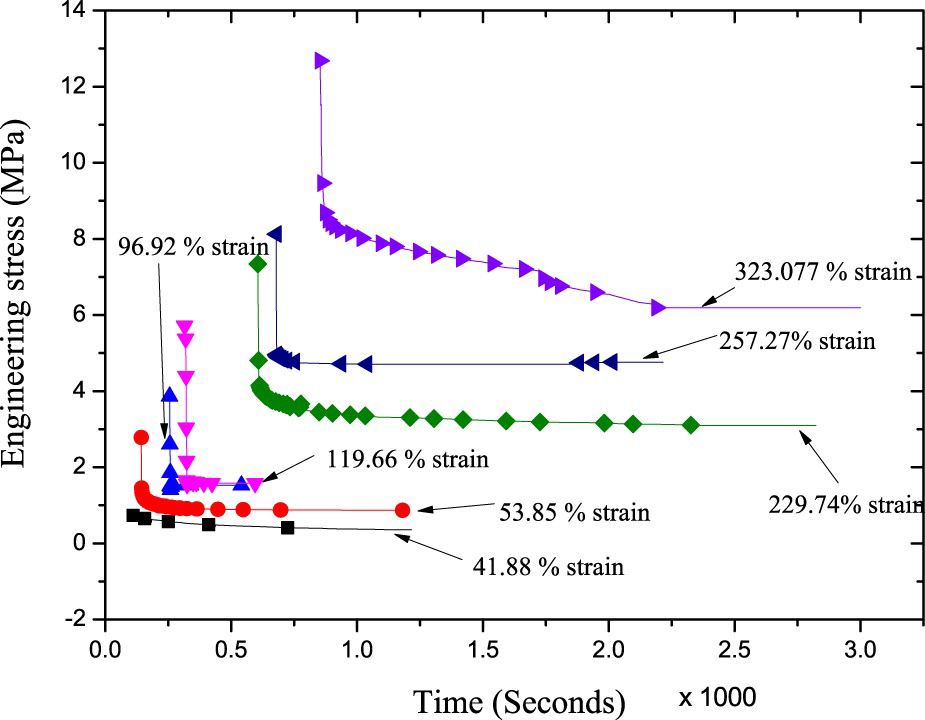
To determine the relaxation times, the derived model is calibrated using data corresponding to 200 mm min−1 elongation rate. Data obtained from stress relaxation tests in tension also give relaxation times as discussed earlier. Typical constants corresponding to 200 mm min−1 elongation rate data are determined to be:
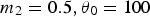
Comparison of engineering stress versus engineering strain between proposed constitutive rule and experimental results of tensile tests at different elongation rates.
 s and
s and
 s. Figure 14 compares analytical results of proposed constitutive model with obtained experimental results. It can be observed that overall results agree well with experimental results. Memory weight factors and relaxation times controlled material response effectively. Relaxation times are observed to be increasing as elongation rate is lowered. This trend continues with memory weight factors as well. At higher strains and at moderate elongation rates, material response is governed by relaxation times and memory weight factors (fading memory) effect.
In general, model was able to predict the three-stage nonlinear response of the material characterised by the moderate hardening in stage-I, high hardening in stage-II and again moderation of the hardening in stage-III region of the response. The model also captured the diminishing or the fading of the distinction between these stages with increase in the elongation rates. Furthermore, the model predictions were found to be accurate for the material response at larger elongation rates. Deviations between the model predictions and the experimental response was found to be minimum. At elongation rate of 200 mm/min the difference was found to be up to 16% only for one point at around true strain of 1.3 (engineering strain= 250% approximately). It was observed that both quasistatic and moderate elongation rate behaviour (as in the current test data) can be well captured by present modelling. Relaxation times were observed to be within the range of 100–270 s.
Stress relaxation behaviour was simulated with commercial finite element program (ABAQUS). Since specimen is cylindrical, only one quarter of the same is sufficient to model the behaviour. X symmetry and Y symmetry boundary conditions were imposed on planar surfaces of specimen. Downward displacement amounting 14% of specimen thickness was applied on top surface while bottom surface was under encastre condition. C3D8RH was selected as the element type. Total number of elements were 19320 while number of nodes found to be 40770. In all the simulations, viscoelastic procedure was followed with static analysis and with a stabilisation of 0.0002. First, material was evaluated for viscoelastic parameters. Relaxation times are found to be 225 s and
Comparison of the normalised compression set stress obtained from simulations with experimental results corresponding to temperature of
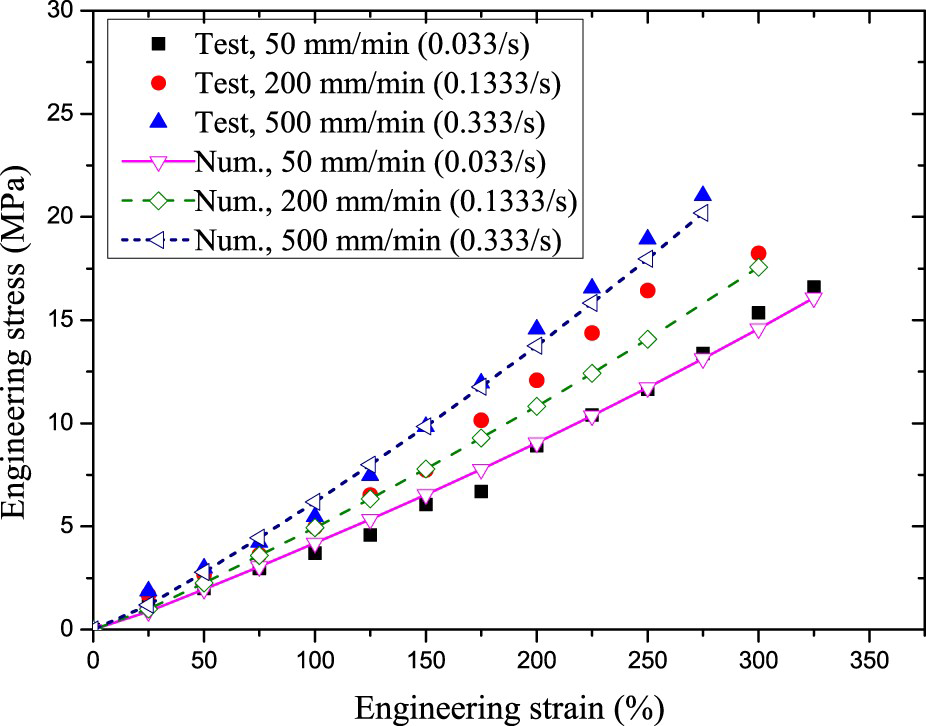
Total displacement of specimen geometry in relaxation simulations of compression experiment. at
at
 C with root mean square error of 0.39% corresponding to experimental data at at the same temperature. Temperature was applied as predefined field for simulations at higher temperatures. The compression set data from the simulations were determined after exposure of the material to fixed time range a different temperatures and upon unloading. The simulation results presented in Figure 15 show good quantitative agreement with the relaxation response from the experiments. Further as mentioned earlier, material is assumed as incompressible. From barrelling observed in relaxation simulations, as in experiments, it is again confirmed that material analysed in present work is having incompressibility and hence transverse strains are not required to be determined. This is observed from the total displacement of compression relaxation experiment conducted at
 C as shown in Figure 16.
 C and
C and
 C.
C.
In this paper, rate dependent uniaxial tensile and relaxation behaviour at different temperatures of high acrylonitrile butadiene rubber (NBR) with higher carbon black content is presented. It is observed that the effect of elongation rate sensitivity on stress for lower strains is small and it gets pronounced for higher strains. Relation between breaking stress and elongation rate is linear and it shows increase in breaking stress with increase in elongation rate. Whereas relation between elongation at break and elongation rate is linear but it shows reduction in elongation at break with increase in elongation rate. The rate dependent material behaviour was captured using hyperviscoelastic constitutive model. The model was able to predict the rate dependent stress–strain response for a range of elongation rates. Relaxation times were found to be increasing with decrease in elongation rates and similar trend is observed for fading memory functions. It was observed from uniaxial compression test at different temperatures that the elaxation reduces linearly with increase in the temperature with initial sharp drop in stress with respect to time. These results are validated using finite element based simulations for viscoelastic material. Simulations undertaken using viscoelastic material behaviour to predict the compression set values showed good quantitative agreement with the experimental results.
Footnotes
Disclosure statement
No potential conflict of interest was reported by the authors.