
Abstract
Creep behaviour of an epoxy matrix composite with a similar arrangement of composites used in a root joint of a wind turbine blade is investigated in this research. The vacuum infusion process was used to manufacture the composite. Due to the linearity of the viscoelastic behaviour of the composite, the time-temperature superposition principle (TTSP) is applied by using an activation energy shifting method to predict long-term creep behaviour. The activation energy (ΔH) is determined to be 281 kJ mol−1. The calculated shift factor in generating the master curve at the reference temperature of 20°C is 4.75 for a 50°C-creep curve and 7.3 for a 70°C-creep curve. Under operating conditions of the root joint, namely at 20°C/40 MPa, the creep compliance is determined to be 0.63 × 10⁻¹² Pa−1 within 27.8 h (105 s) and increases to 8.6 × 10⁻¹² Pa−1 within 10 years (108.5 s). The creep compliance master curves at 20°C/40, 100 and 300 MPa within 1157 days (108 s) are determined to be 7.1 × 10⁻¹², 12.5 × 10⁻¹² and 18.3 × 10⁻¹² Pa−1, respectively. Scanning electron microscopy examination shows cusps, scarps and pull-out of fibres.
Keywords
Introduction
In recent years, fibre-reinforced polymer composites (FRP) have been selected for the manufacturing of wind turbine blades [1]. These composites are the most studied and applied materials [2], which have been related to the unique properties such as high strength-to-weight ratio [3], slow fatigue crack growth [1], non-corrosive nature and ultraviolet resistance [4]. The FRP composites are exposed to creep due to the viscoelastic behaviour of the polymer matrix [5] and show dimensional instability and structure failure at stress values well below the ultimate tensile strength (UTS) of the material [6]. Creep test is performed to model the viscous behaviour of the composites and their phases [7]. There are investigations on composite rheology that presented significant stress variation over time due to the creep behaviour of polymeric materials [8-12]. Other researches showed the viscoelastic problem has a vital role in the design and verification process [7, 13, 14].
According to the DNV-GL standard for the design of wind turbines, creep failure of the composite at a T-bolt in the root joint of the blade is a failure mechanism for a wind turbine blade [15]. Even if creep failure does not occur, slow creep deformation leads to the lower effective performance of the structure [16]. The lack of long-term performance data is the major obstacle that limited more full acceptance of FRP materials in infrastructure applications [4]. Long-term creep tests are impractical and costly [16]; accordingly, researchers prefer to estimate the long-term creep behaviour of composite by modelling approaches. Findley's model, thermal activation theory, time-temperature superposition principle (TTSP), and mechanical analogues are the main models used to predict long-term creep behaviour of the FRP materials. The TTSP is an acceptable and simple method and provides valid results [17].
The TTSP modelling has been employed for several types of polymers and polymeric foams in such industrial applications as aerospace, transportation, medical device, and packing industry [18]. This approach can also be applied for composites and adhesives [19]. Linear viscoelastic behaviour is the first assumption required for developing the TTSP model [20]. According to Leaderman's observations, all creep curves exhibit similar procedures for different temperatures and materials. Also, the curve extends along the time axis as the temperature rises [21, 22]. For this purpose, creep tests are done at several values of temperature and constant amount of stress. The reference temperature is determined, and shift factors are calculated using the Arrhenius equation to transform the creep curves and to develop the plots of master curves [23].
Raghavan and Meshii [20] investigated the creep resistance of epoxy and carbon fibre/epoxy composites. They demonstrated that the creep strain increased with temperature. Li et al. [24] presented the effects of temperature and stress on the creep resistance of carbon fibre composites. They showed, in a given time, the creep rate and strain increased with temperature and stress level. Piyush et al. [17] studied the creep behaviour of an E-glass/polyester composite. Their results were similar to those of Kawai and Sagawa [25], indicating decreases in the time of creep fracture and creep resistance with increasing either temperature and/or stress level.
Goertzen and Kessler [16] defined long-term creep compliance of the carbon fibre/epoxy composites. They found the 50-year creep tensile strength of the composite at 30°C was 84% of the UTS, while it reached 42% of the UTS at 50°C. Vaidyanathan et al. [26] evaluated the long-term creep behaviour of dental composites by the TTSP modelling method. They showed that the creep compliance at the stress level of 5 MPa increased 2–3.5 times within 3 years. Briody et al. [18] estimated the long-term creep behaviour of polyurethane by TTSP modelling and obtained the master curve. Creep behaviour of bamboo fibre-reinforced recycled polylactic acid was studied by Yang et al. [22] based on TTSP modelling. They suggested that the volume fraction of the fibre affects the long-term creep resistance of the composite. Other parameters that influence the creep behaviour of the FRP composites include fibre orientation [27], glass transition temperature [28], and curing conditions [29].
The present work is aimed to investigate the creep behaviour of composite used in wind turbine blades under operating conditions (maximum stress in the root joint) and to ensure maximum security and serviceability of the structure. Long-term creep behaviour of the composite is evaluated by TTSP modelling; the TTSP modelling is selected because of the linear viscoelastic behaviour of the composite. Creep master curves were generated at stress levels of 40, 100, and 300 MPa and temperature range of 20–100°C. Finally, because of the limited fractography on creep fracture on FRPs up to now, fractography analysis was performed on the creep fracture surfaces by scanning electron microscopy (SEM).
Experimental
Materials
Epolam 2040 epoxy resin and Epolam 2047 hardener were supplied by Axson Technologies Company (USA). Densities and viscosities of the epoxy resin and hardener at room temperature are 1.16 g cm−3 and 1100 MPa S−1, and 0.94 g cm−3 and 10 MPa S−1, respectively. Unidirectional and bi-directional E-glass fibre mat from STA Company (Turkey) were used.
Sample preparation
The resin to hardener ratio of 100:32 was used for all specimens. Resin and hardener were mixed for 5 min and subjected under vacuum for 10 min to eliminate bubbles. The mixture was moulded to produce the epoxy specimens. To prepare test specimens of the E-glass/epoxy composite, the vacuum infusion process (VIP) was employed, where the mixture was infused by vacuum pressure through the E-glass fibre.
Arrangement of the glass fibre layers in the composite was as follows: [90, 0, ±45, 0, ±45, 0, 90], which is an element of the root joint composite arrangement. The epoxy and composite specimens were cured in two stages: (1) at room temperature (25°C) for 24 h and (2) at 70°C for16 h.
The composite specimens for creep tests and epoxy specimens for creep and tensile tests were made according to standard ASTM D-638 [30]. Rectangular samples for the tensile test of the composite were made according to ASTM D-3039 [31]. To evaluate the glass transition temperature of the composite, dynamic mechanical thermal analysis (DMTA) was performed. Dimensions of the specimens used for the DMTA tests were 1.8,10, 37 mm.
Tests
Tensile tests were performed by Zwick Z250 universal testing machine. The composite samples were subjected to a tensile test according to ASTM D-3039 at a loading rate of 2 mm min−1. Also, the tensile test on epoxy specimens was performed according to ASTM D-638 at a loading rate of 5 mm min−1. Creep tests were in the tensile mode because the creep mode in the root joint is in tensile mode. Creep tests were conducted according to the ASTM D-2990 [32] on SANTAM STM-150 universal testing machine. DMTA tests were performed by Triton Technology DMTA machine (Ltd.) at three frequencies (1, 5, and 10 Hz) and temperature range of 21–120°C at a heating rate of 5°C min−1.
SEM was carried out on an LEO-1450VP (Germany) operating at 20 kV. Before the SEM examination, a creep test was performed on the composite specimen at 20°C/330 MPa and for 14 h up to the failure of the sample. Thermogravimetric analysis (TGA) was done on the composite using a Shimadzu TGA50 universal machine (Japan) to determine the fibre content of the composite. For this test, the temperature increased from 25 to 1000°C at a heating rate of 10°C min−1. The fibre content of the composite was measured to be 69 wt-%.
Results and discussion
Tensile test
The stress–strain curve of the composite specimens is presented in Figure 1. Mechanical properties and standard deviation (σ) for the composite are summarised in Table 1.
Stress–strain curves of EP and C-RJR samples. Mechanical properties of EP and C-RJR samples.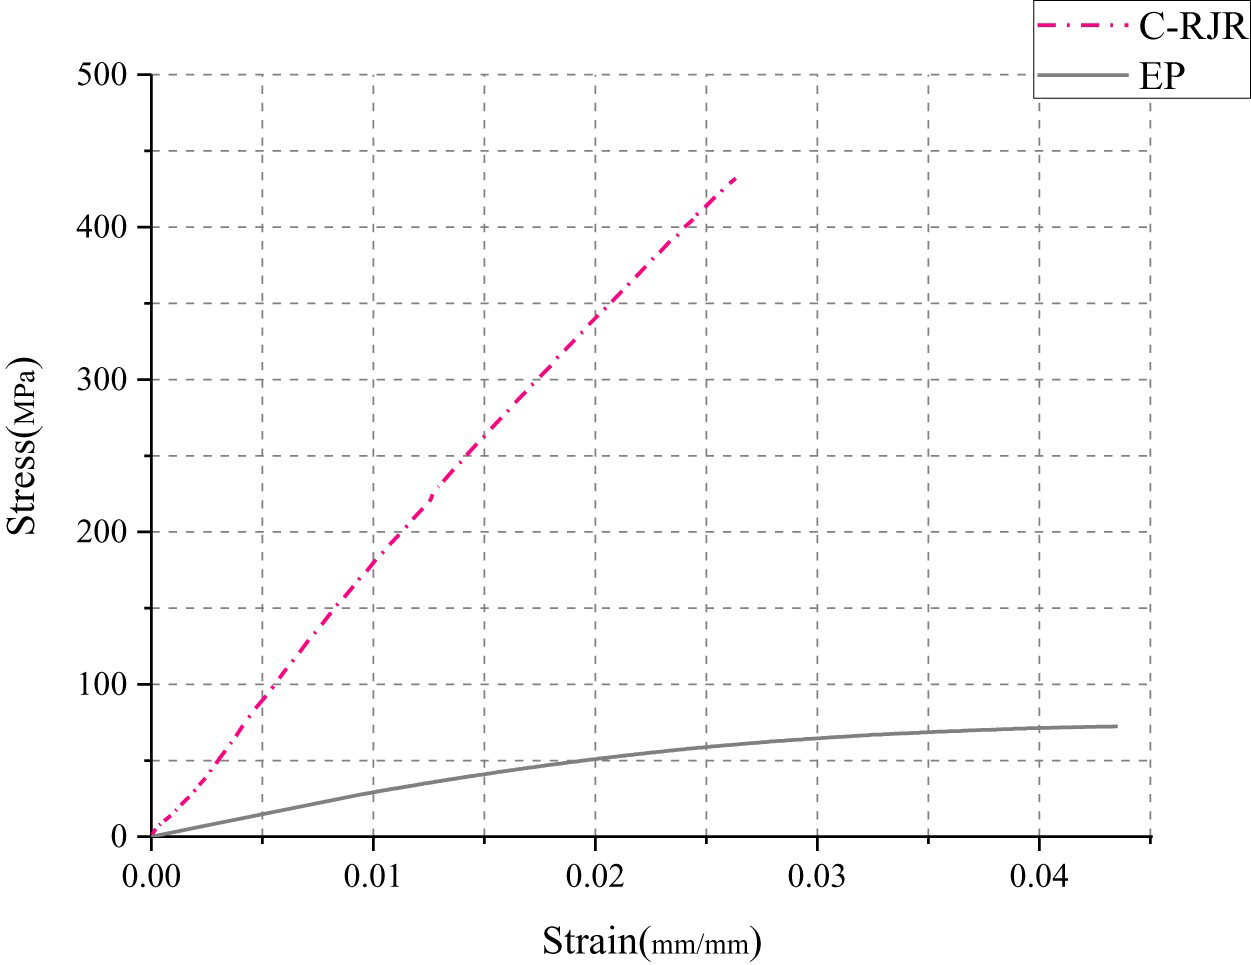

Creep test
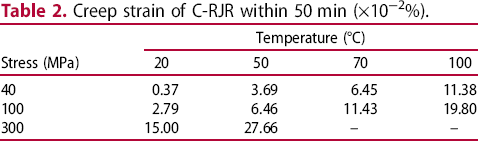
Creep test at 20°C/40 MPa (maximum load at root joint of the blade) resembles the operating condition of the wind turbine (see Figure 2). The 50-min creep strain is about 4 × 10⁻⁴ (%), which shows the risk of deformation for a blade composite. Figure 2(a,b) shows the creep test results at different temperatures for 40 and 100 MPa, respectively. The 50-min creep strain at 20°C/100 MPa is found to be 2.79 × 10⁻² (%). By raising the temperature up to 100°C, the strain increases to 19.80 × 10⁻² (%). Table 2 summarises the results of creep strain within 50 min.
Creep curves of E-glass/epoxy composites at 40, 100 MPa and 20–100°C. Creep strain of C-RJR within 50 min (×10−2%).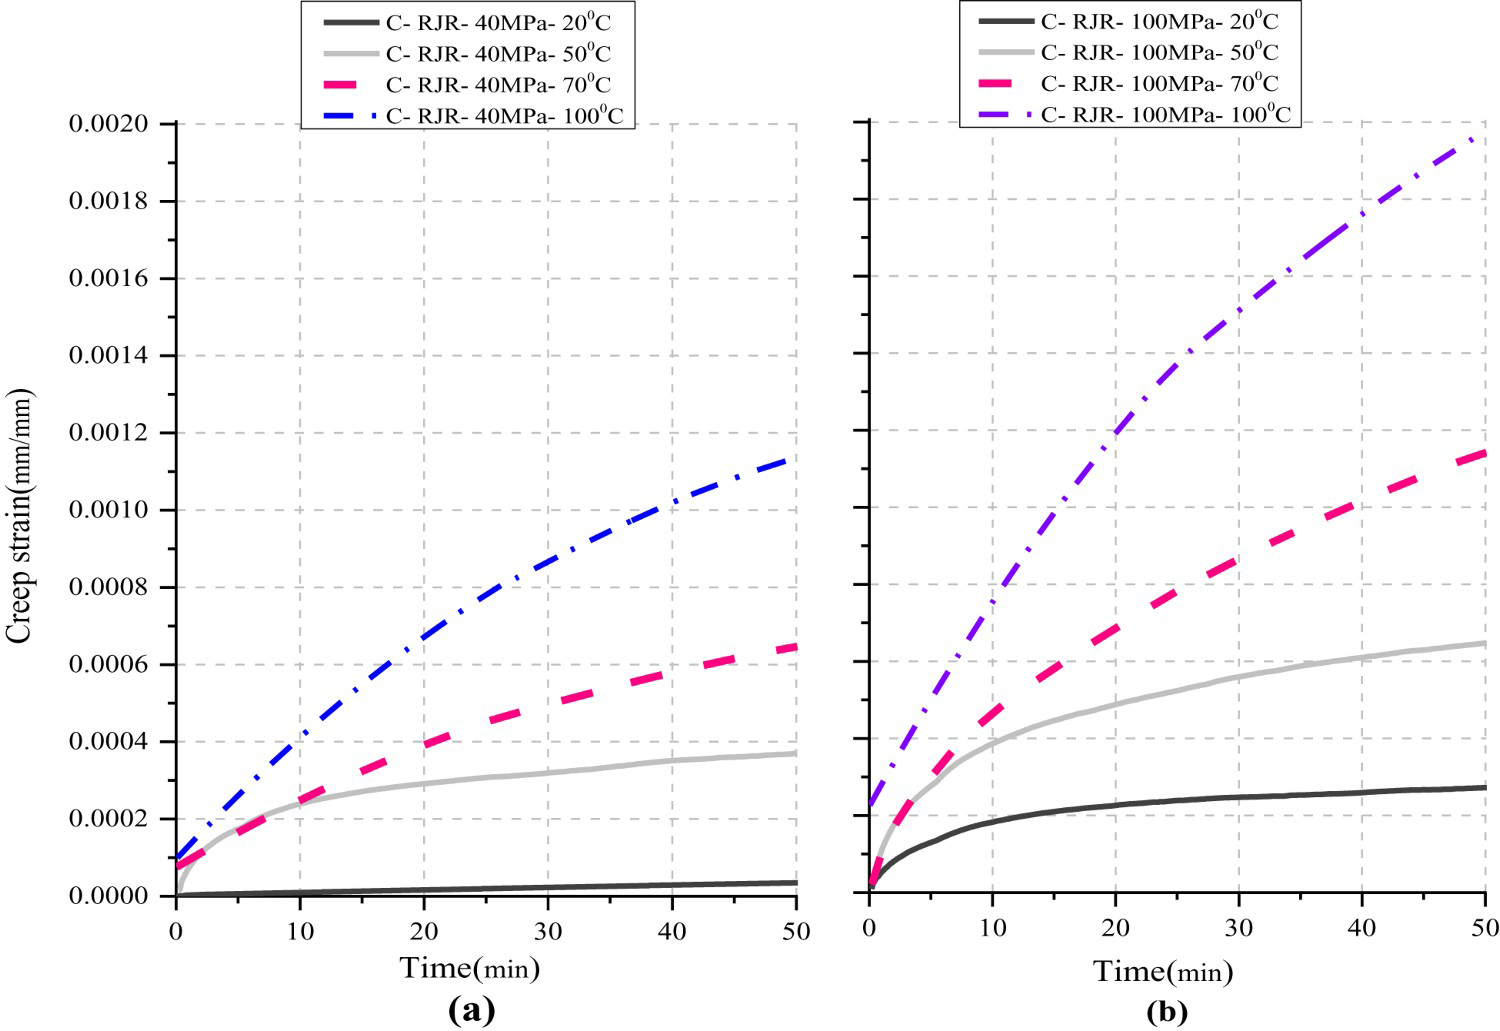
At higher values of temperature and stress, the free volume of the polymer matrix increases. Thereby enhancing the mobility of polymer segments, it leads to increase the creep strain as has been observed by other researches [26, 33].
The creep rate at different temperatures and stresses are shown in Figure 3. The effect of stress and temperature on the creep rate of the composite is clearly depicted in this graph. For example, the creep rate at 100°C/100 MPa is about 42 times that of at 20°C/40 MPa. The creep behaviour of the polymer material is found to be highly dependent on the temperature [34] and the stress-to-strength ratio [35].
The creep rate of composite within 40 min of creep test.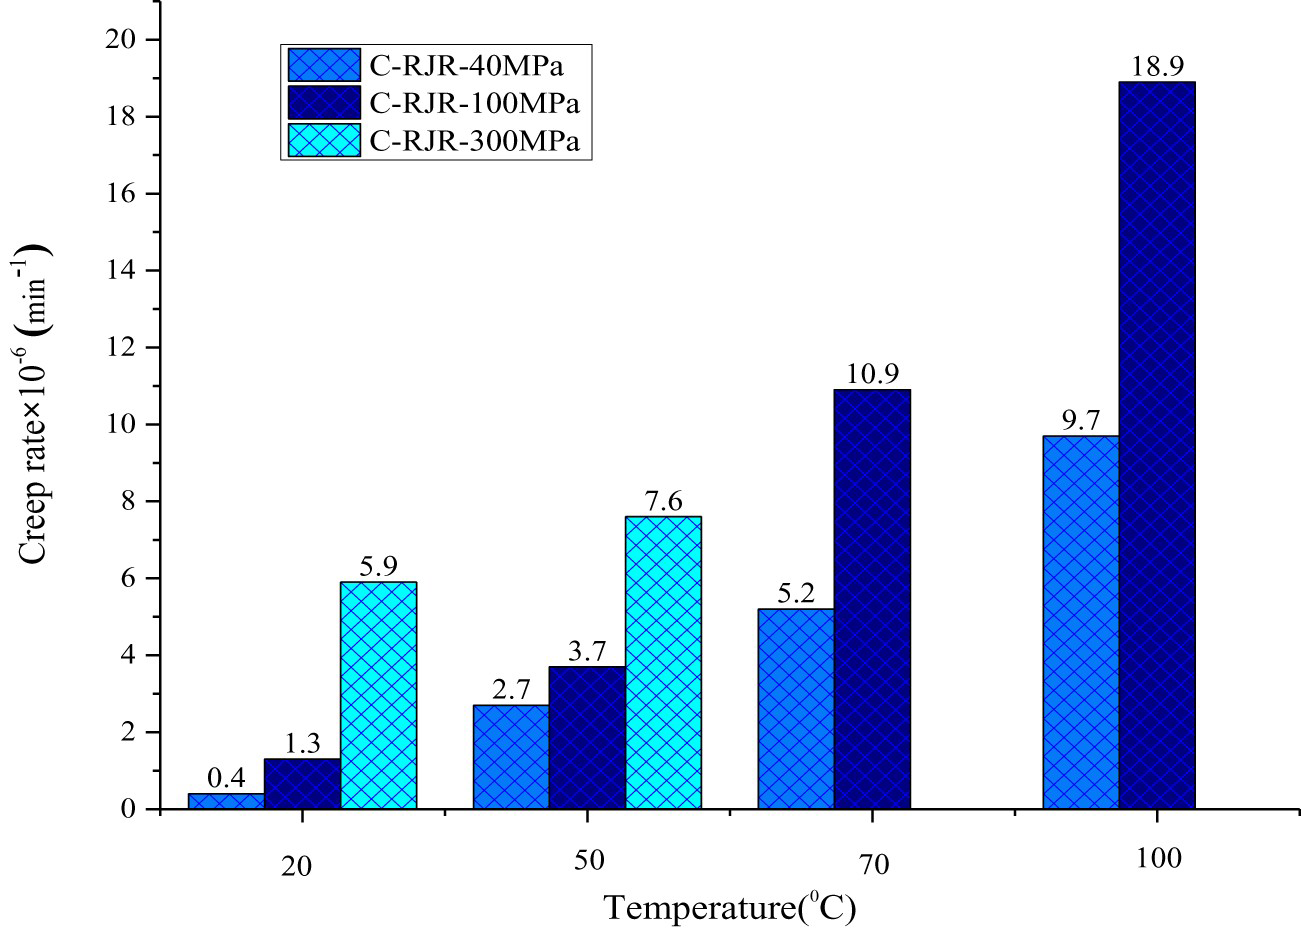
Time-temperature superposition principle (TTSP)
The isochronous curve was plotted at 50°C to confirm the linearity of the viscoelastic behaviour of the composite within the stress range of 40–300 MPa (see Figure 4). The TTSP estimates the long-term creep behaviour due to the linear viscoelastic behaviour of the composite.
The isochronous curve of the composite at 50°C.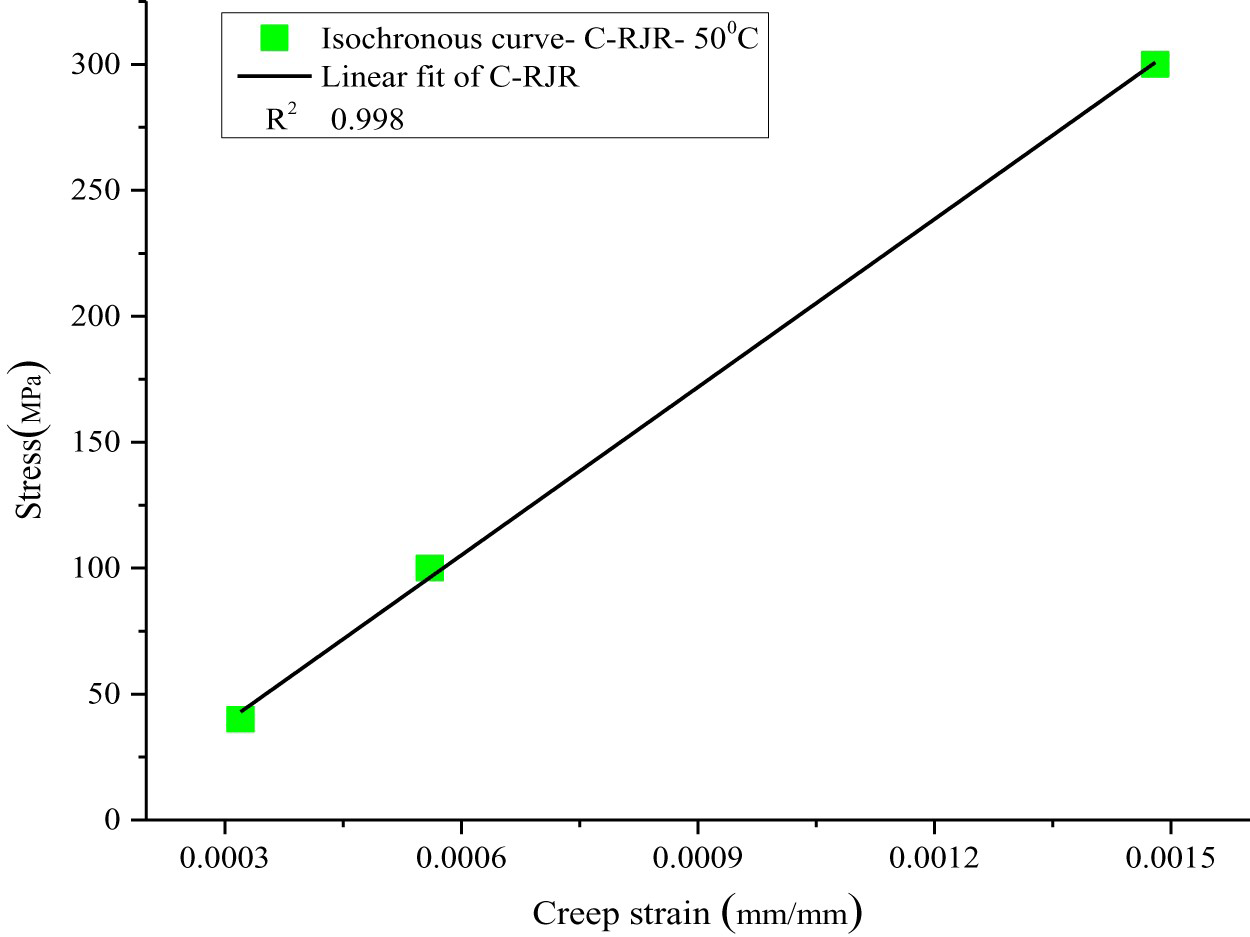
DMTA was performed at three frequencies (1, 5, and 10 Hz) to determine glass transition temperature of the composite and to calculate the activation energy of the creep phenomenon of the composite. Glass transition temperatures at the frequencies of 1, 5 and 10 Hz are obtained to be 50, 55.9, and 57.8°C, respectively (see Figure 5(a)). The glass transition temperature increases with frequency due to improved elastic behaviour of the polymer, as stated by Menard et al. [36].
(a) Tan delta versus temperature and (b) ln (f) versus reverse Tg for composite.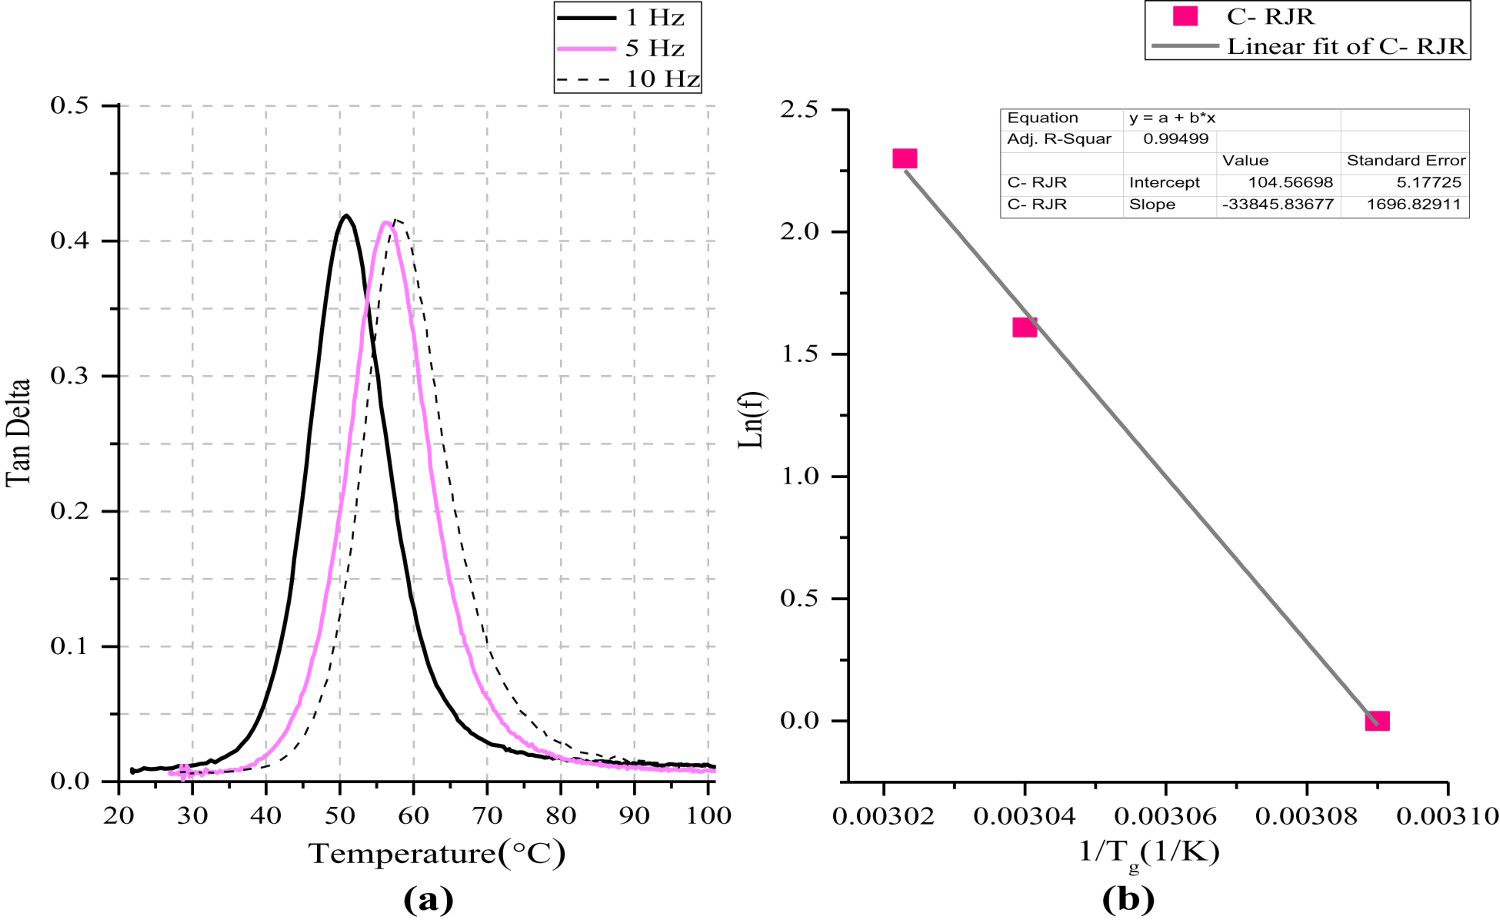
Figure 5(a) shows the variations of tan delta versus temperature at several test frequencies and those of the natural logarithm of the frequency ln (f) versus the inverse of the glass transition temperature (see Figure 5(b)). The slope of ln (f) versus inverse glass transition temperature gives the activation energy of the creep phenomenon. Replacing the slope of the graph of Figure 5(b) in Equation (1), the activation energy is determined [16].
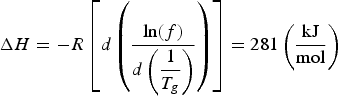
First, the shift factor for each creep curve in different temperature is determined to predict the long-term creep behaviour at the reference temperature. The shift factor is calculated according to the Arrhenius equation (2). Creep curves are transformed using the shift factor, along the horizontal axis to predict the long-term creep behaviour of the composite [16].
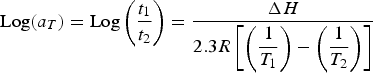
As seen table 3, to plot the master curve at 20°C (the reference temperature), the logarithm of the shift factor (log (aT)) for the creep curves at 50 and 70°C are calculated and found to be 4.75 and 7.3, respectively. If the reference temperature is 50°C, the log (aT) for the 70°C-creep curve is 2.64. The obtained values of the activation energy and the shift factors are similar to those stated by other researches [16, 22, 23].
The graphs of creep compliance versus the logarithm of time are developed at 20, 50, and 70°C/100 MPa. The creep curves are transformed using the corresponding shift factors. The master curve at 20°C/100 MPa is shown in Figure 6. The 2.8-h (104 s) and 1157-day (108 s) creep compliance is estimated to be 3.3 × 10⁻¹² and 11.6 × 10⁻¹² Pa−1, respectively. Accurate overlap of the transformed creep curves verifies the acceptable application of the TTSP modelling. Because of the viscoelastic behaviour of the polymer composite, any increase in creep compliance values decreased the material strength.
The creep compliance master curve versus log (t) at 100 MPa and 20°C for C-RJR sample. Logarithm of shift factor for master curve at temperature (T) respect to the reference temperature.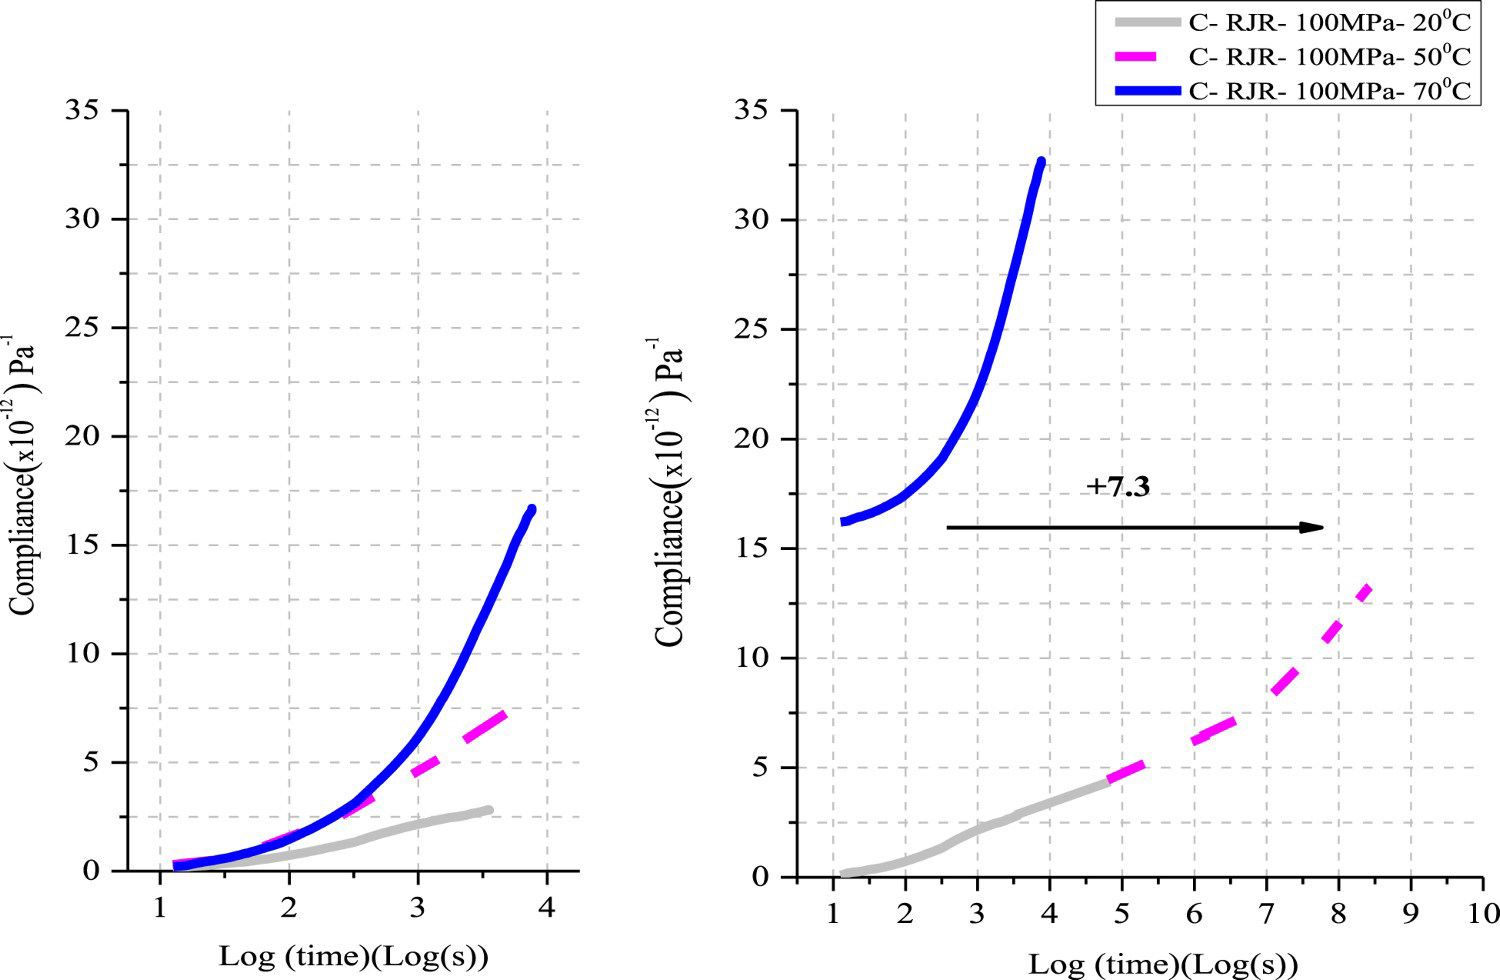
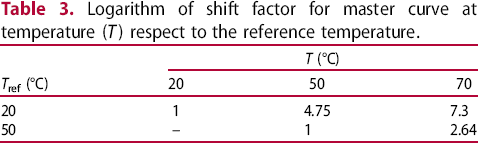
The master curves at 20°C/40, 100, and 300 MPa are illustrated in Figure 7. The result of the creep test at 20°C/40 MPa shows the 27.8-h (105 s) creep compliance is 0.63 × 10⁻¹² Pa−1 and reach to 8.6 × 10⁻¹² Pa−1 within 10 years (108.5 s). This states the possibility of the structural strength degrading over time due to the increased creep strain. Creep tests at 70°C, 100°C/300 MPa show the samples failed prematurely, and it would be infeasible to perform the creep tests because of the high level of stress and temperature. The creep compliance at 20°C/40, 100, and 300 MPa within 1157 days (108 s) are determined to be 7.1 × 10⁻¹², 12.5 × 10⁻¹², and 18.3 × 10⁻¹² Pa−1, respectively.
The creep compliance master curves at 40, 100 and 300 MPa in 20°C.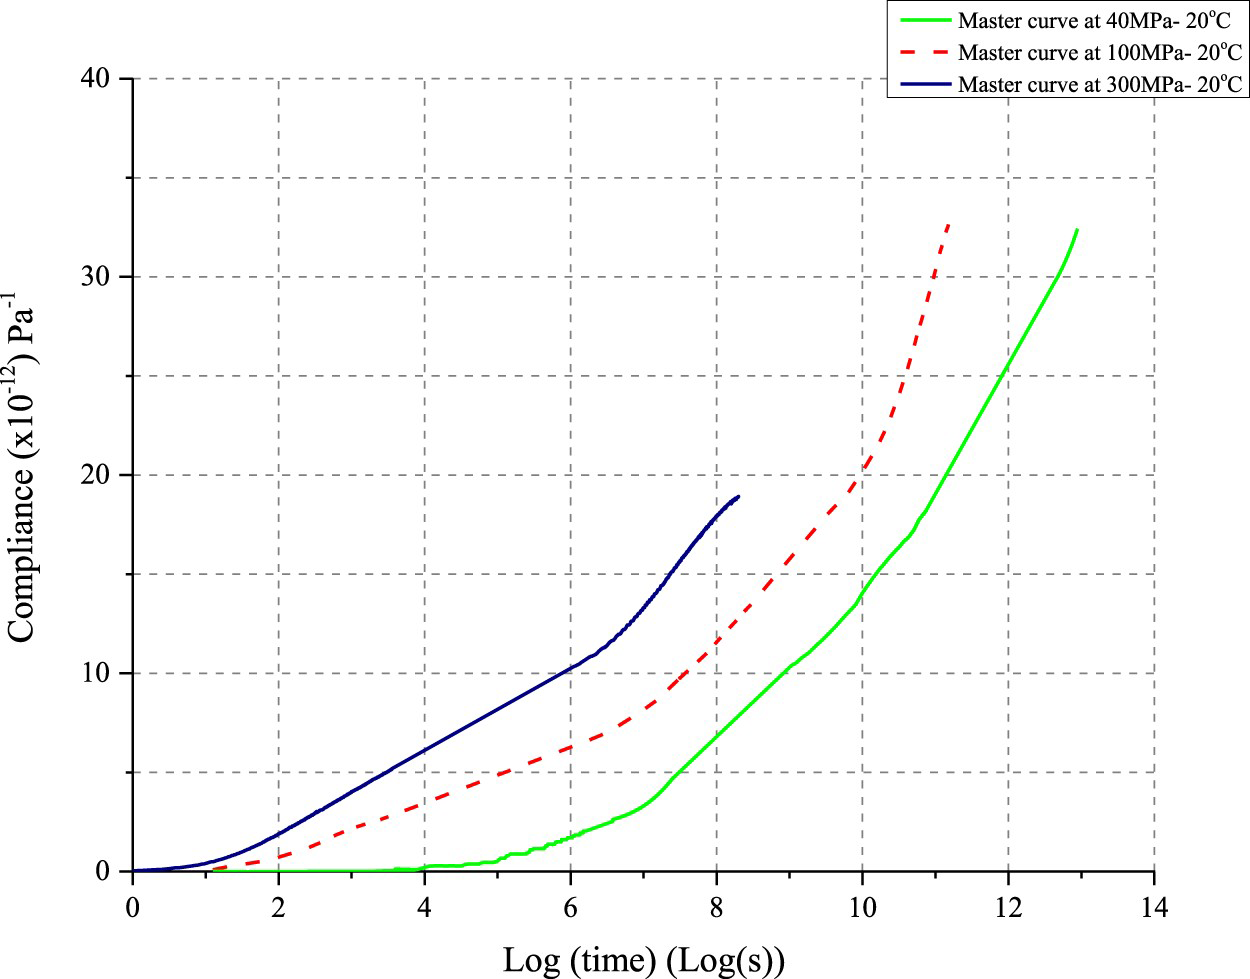
Scanning electron microscopy (SEM)
Fractography studies on creep fracture surfaces of the composite were performed based on SEM. The fractographic features of the composite at different magnifications are illustrated in Figure 8(a–f). Figure 8(a) shows more broken fibres and pore spaces. The micrograph shows debonding more than fibre pull-out. The debonding may be due to the lack of proper sizing of the fibreglass to enhance a good bonding with the epoxy resin.
SEM micrographs of creep fracture surfaces of C-RJR composites.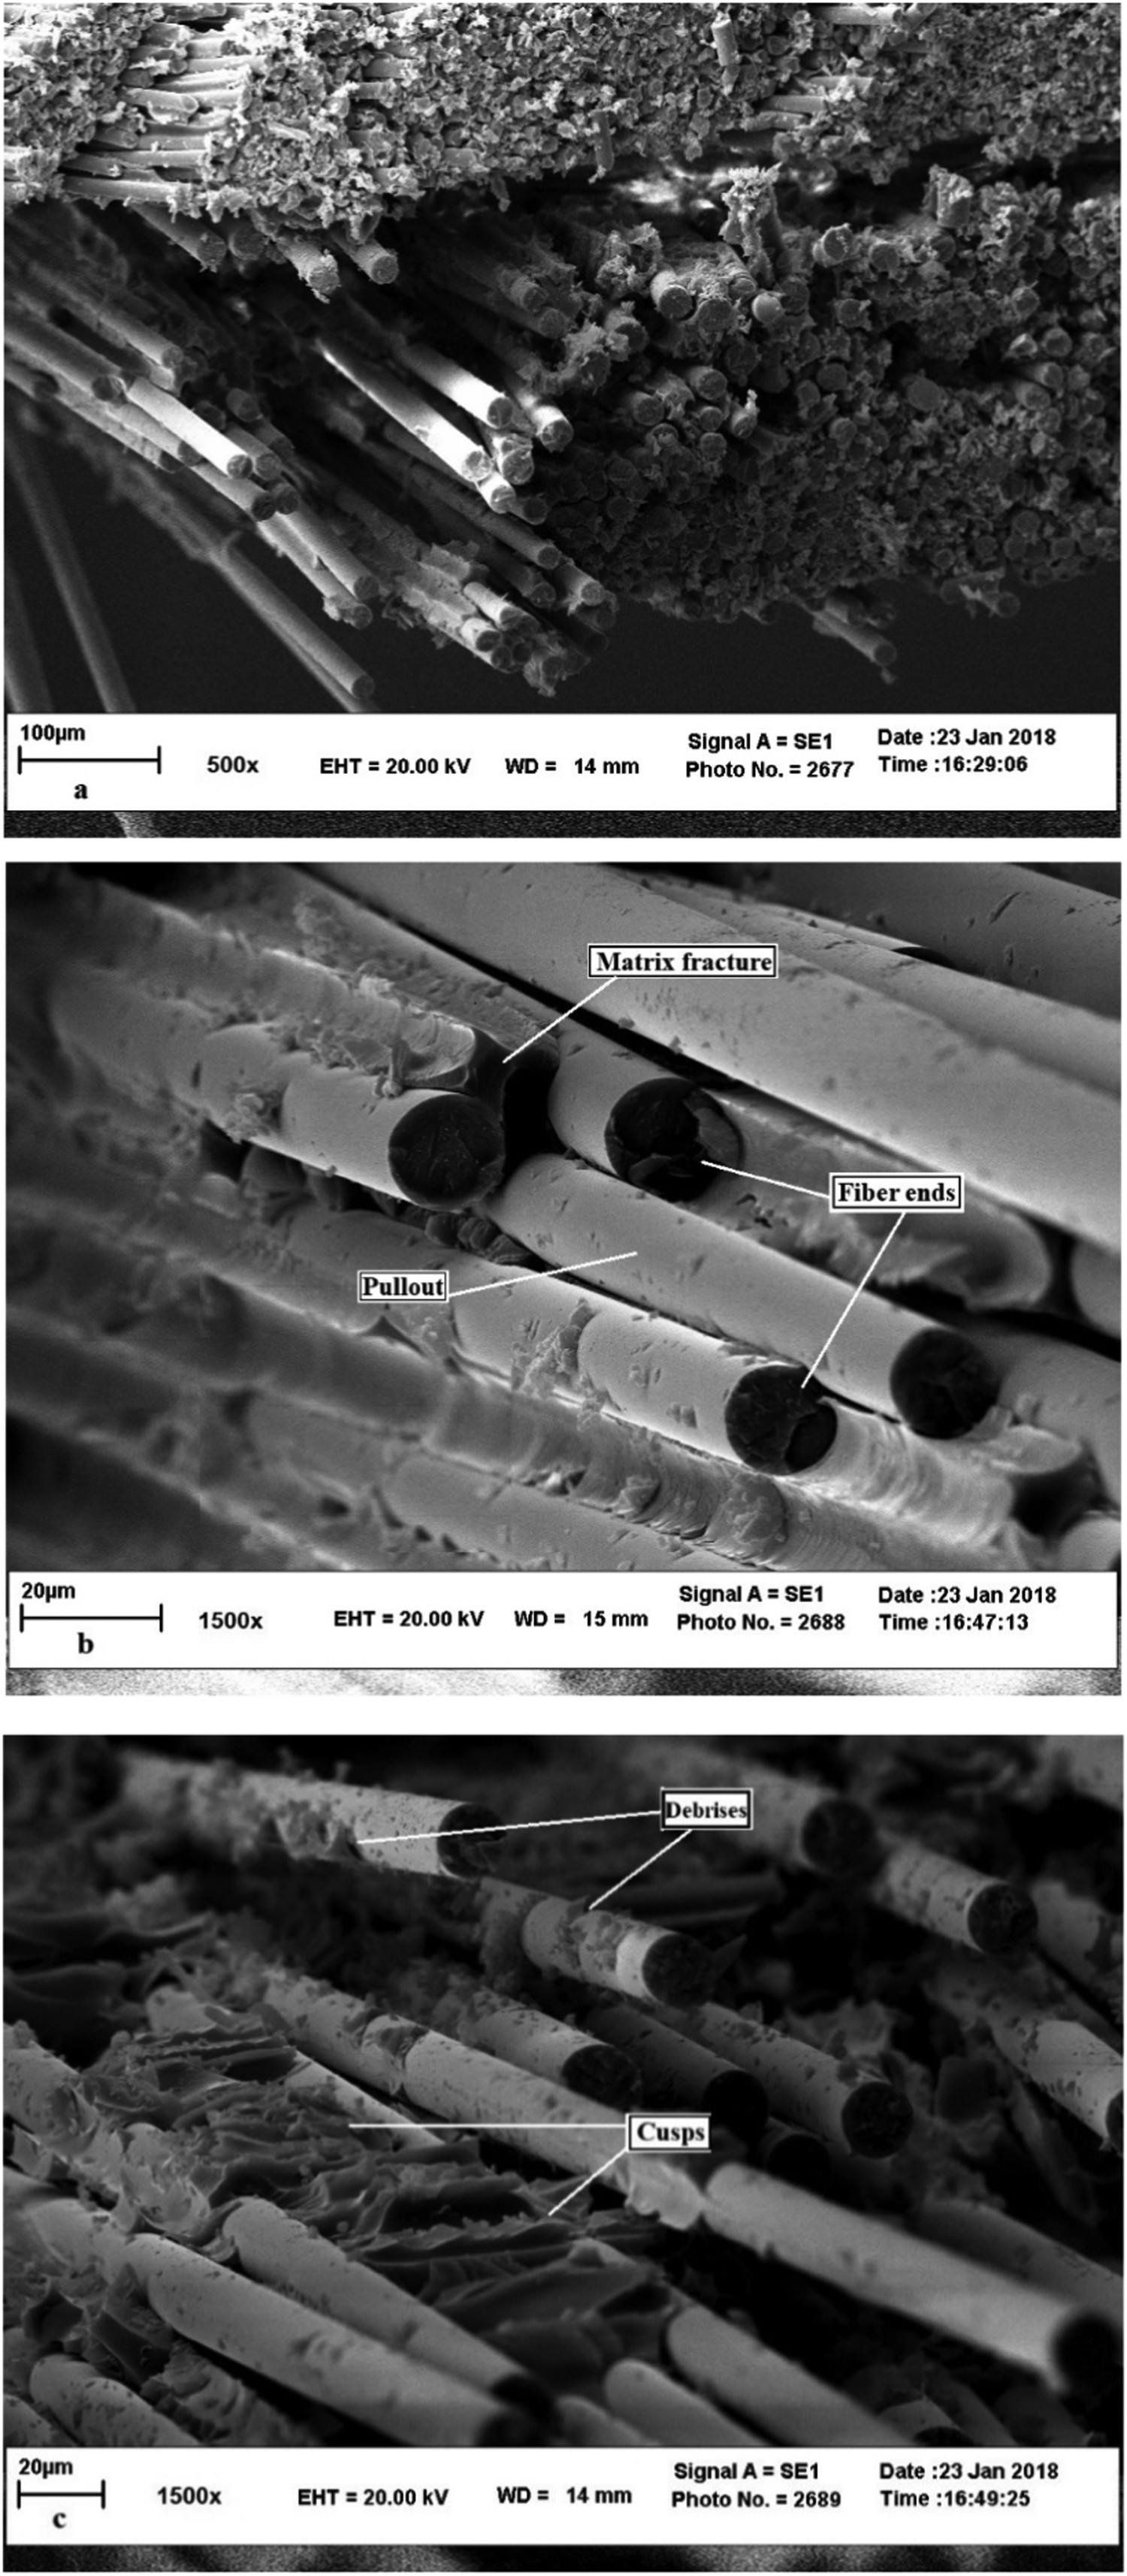
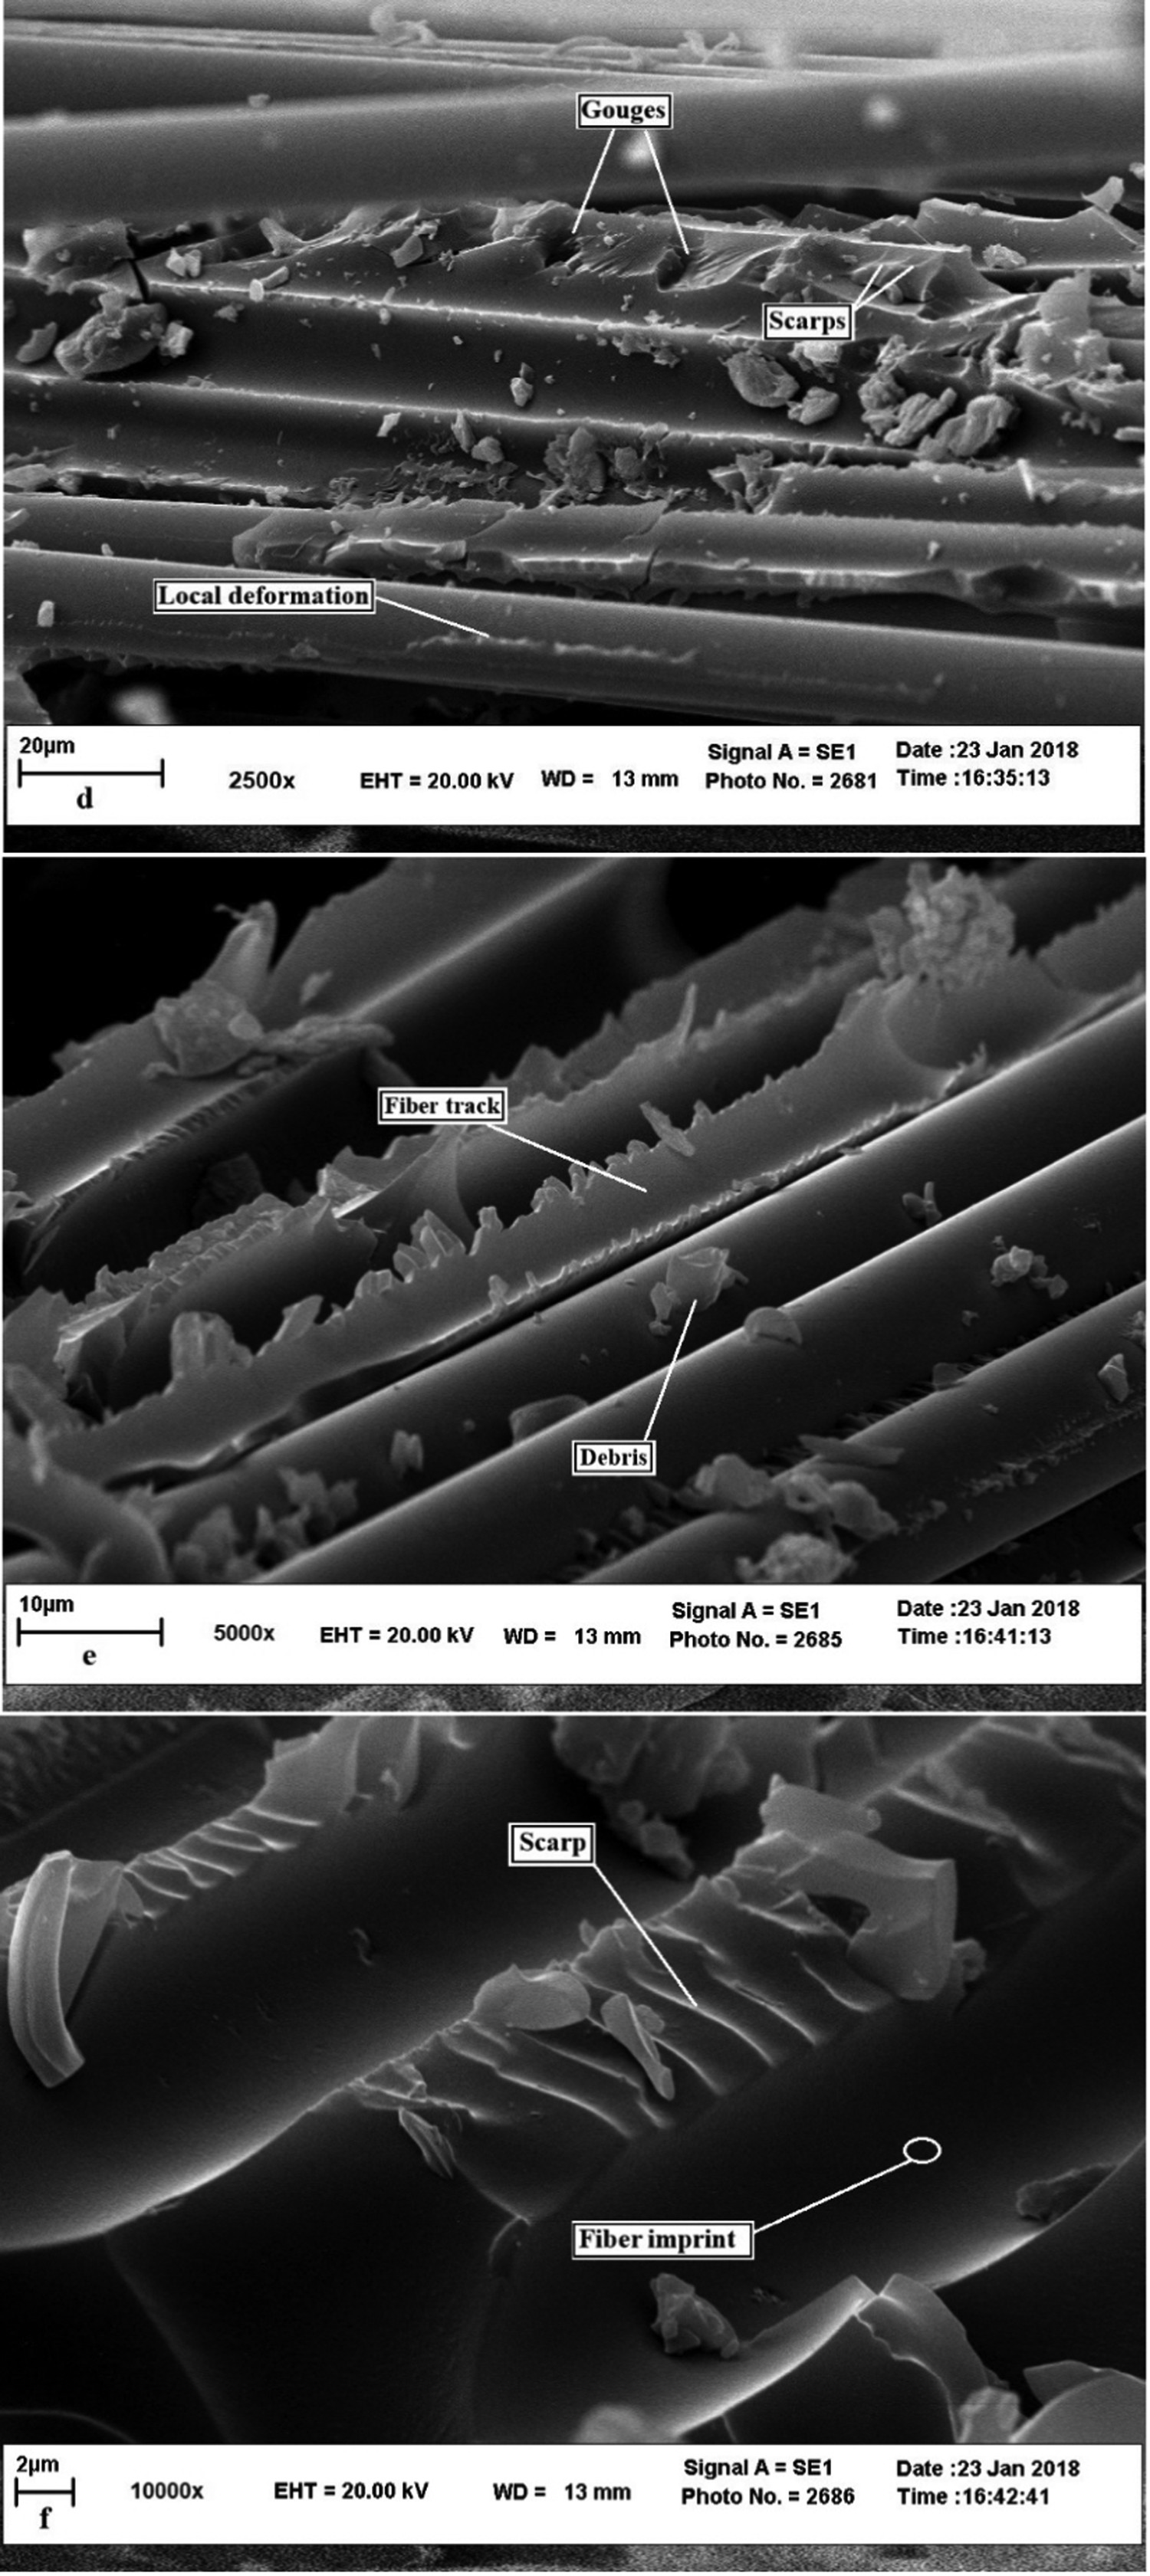
Fibre termination, matrix fracture, and pull-out of fibres are seen in Figure 8(b). The SEM micrographs in Figure 8(c) highlighted the presence of debris and cusps that caused by abrasion between the fracture surface during shear loading [37]. Debris generated by the fracture surface grinding up against each other. Cusps are the dominant fractographic feature for mode п (shear loading) fracture surfaces and are caused by the fibre being pulled from the surface during the crack propagation [37].
The scarps, gouges, and the local deformation of the epoxy are shown in Figure 8(d). Delamination is seen as a fracture mode that is very common in laminated composites. Deep gouges in the matrix have developed perpendicular to the failure tracks, associates with the base of a cusp, and seem to extend from the resin layer beneath the cusp [37]. In higher magnification in Figure 8(e,f), the presence of debris, fibre tracks, and scarps are shown.
Conclusions
The E-glass/epoxy composite was produced by the vacuum infusion process (VIP). Experimental creep tests and long-term creep modelling by TTSP due to the linearity of viscoelastic behaviour were performed on composites. The concluded results are followed by:
Investigation of temperature impact on creep behaviour shows the creep strain at 20°C/100 MPa within 50 min is 2.79 × 10⁻² (%), and by increasing temperature to 100°C, it reaches to 19.80 × 10⁻² (%). Suitable overlap of the transformed creep curves verifies the acceptable superposition and prediction of long-term creep behaviour according to the superposition principle. The value of the creep compliance is 0.63 × 10⁻¹² Pa−1 within 27.8 h (105 s) and 20°C/40 MPa (under service condition of wind turbine blade composite), and within 10 years (108.5 s) this value reaches to 8.6 × 10⁻¹² Pa−1. The effect of stress level on long-term creep compliance was evaluated. The results show the value is 12.5 × 10⁻¹² Pa−1 at 20°C/100 MPa, and by increasing the stress level to 300 MPa, the value reaches to 18.3 × 10⁻¹² Pa−1 within 1157 days (108 s). Matrix fracture, fibre termination, and pull-out of fibres are seen by SEM. More presented debonding may be due to the lack of proper sizing of the fibreglass to enhance a good bonding with the epoxy resin. SEM observation shows the formation of cusps, scarps, and clean fibre as a result of separation in fibre/matrix interface and pull-out of fibres.
Footnotes
Disclosure statement
No potential conflict of interest was reported by the author(s).