
Abstract
Acrylic adhesives offer design flexibility with its viscoelasticity. However, its use with composite parts has not been studied. In this regard, the aim of this work is to characterise the mode I delamination of acrylic adhesive bonded composite joints subjected to various displacement rates. This study used carbon/epoxy composite as the adherent and 3M adhesive film (VHB 4930F) as the adhesive. Double cantilever beam test was conducted and the mode I fracture toughness GIC was calculated using the simple beam theory. Results show that GIC increases with displacement rate. The maximum GIC is achieved at 500 mm/min, with 155% increment compared to the GIC at 5 mm/min. Furthermore, the cohesive failure is found to be more dominating as the displacement rate increases. Through the quantification of the cohesive area, it is noticed that both GIC and cohesive area correlate well. Both parameters are well fitted using the proposed rate-dependent model.
Introduction
Adhesive bonding refers to the joining technique that acts as alternative to bolting, rivet and welding [1]. Adhesive bonded joints offer advantages in aspects of weight saving, design flexibility, fatigue resistance, uniform stress distribution and corrosion effect elimination [2, 3]. During their service life, adhesive bonded joints could be subjected to various loading rates. Moreover, the opening mode is usually the most critical one compared to other modes of loading [4]. As adhesive joints are commonly recognised to be sensitive to the strain rate [5, 6], it is essential to characterise the mode I delamination of adhesive bonded joints under different loading rates.
The common types of adhesive used for composite and metallic joints are epoxy and polyurethane. For the studies on the rate-dependency of adhesive bonded joints, various research works have been published on pure mode I loading. For example, by testing Betamate 1496V epoxy adhesive bonded maraging steel 1.6358 (X2NiCoMo18-9-5) joints using tapered double cantilever beam (TDCB) test, May et al. [7] reported that mode I fracture toughness GIC increased within the velocity range of 0.06–3 × 104 mm min−1. The GIC value at the highest velocity was approximately 40% higher compared to the value at the lowest velocity. Blackman et al. [8] tested Betamate XD4600 epoxy adhesive bonded HTS/6376 and IM7/977-2 unidirectional carbon/epoxy composites using double cantilever beam (DCB) test. In addition, TDCB test was conducted on the same type of adhesive bonded with EN AW-2014-A aluminium alloy. Within the loading rate range of 1–9 × 105 mm min−1, the authors discovered that GIC decreased by approximately 40%. When testing Denatite 2204 epoxy adhesive bonded spring steel (SUP-10) joints using a double cantilever beam (DCB) test at 5 and 1.8 × 105 mm min−1, Yamagata et al. [9] found negligible difference in GIC. Nevertheless, by testing polyurethane adhesive bonded spring steel (SUP-10) joints under the same testing conditions, they found an approximate 55% increment in GIC. On the other hand, Jia et al. [10] found that the GIC of polyurethane adhesive bonded stainless steel joints decreased with increment of loading rates. Compared to 0.5 mm min−1, the decrement was 32% and 50% at 5 and 500 mm min−1, respectively when tested at room temperature. For the joints tested at – 20°C, a drop of 19% and 46% respectively were attained. As for the testing temperature of – 40°C, the deterioration was 22% and 40%, respectively. From the above-mentioned findings, it is apparent that the discrepancies in the findings of loading rate effects on mode I delamination behaviour of adhesive bonded joints reported in the literature are still not fully understood. Currently, the understanding of the mechanism behind it still relies heavily on experimental works. Acrylic adhesives offer design flexibility with its viscoelasticity. However, up to the authors’ knowledge, its use with composites parts has not been studied. Hence, there is a need to further explore the rate-dependency of acrylic adhesive bonded joints used with composite laminates for lightweighting purposes.
The objective of this study is to characterise the mode I delamination behaviour of 3M adhesive film (VHB 4930F) adhesive bonded carbon/epoxy composite joints under different displacement rates. This type of acrylic tape eases the bonding process compared to paste adhesive. It provides excellent energy absorbing, stress relaxation and durability performance for both indoor and outdoor applications. Specifically, it eases the bonding process of the small parts of vehicle components in a secured manner. In addition, it also has good bonding ability over a wide range of materials, which include metals, glass, plastics and paints. In this study, mode I delamination test was conducted using double cantilever beam (DCB) test at the crosshead speeds of 5, 50, 250 and 500 mm min−1. Mode I fracture toughness GIC was then calculated and the relationship between GIC and the crosshead speed was established subsequently. After that, the cohesive area was quantified with the aid of JMicroVision 1.2.7 software. Finally, the variation of the cohesive area with the crosshead speed was plotted and correlated.
Materials and methods
Materials
The adherent material used in this study was unidirectional carbon/epoxy composite supplied by X-Plas Singapore [4]. It has a nominal ply thickness of 0.15 mm with an average fibre volume fraction of 65.7%. The 10-layer composite laminate was fabricated using a hand lay-up technique and cured in a hot-press machine. The composite plate was then cut into specimens with a dimension of 190 mm length × 20 mm width × 1.5 mm thickness. The 3M adhesive film, type of VHB 4930F was used as the adhesive. The 0.64 mm-thick adhesive was cut into 120 mm length × 20 mm width. First, the adherent surfaces were polished with sand paper of #1000 grit size. The surface polishing on the adherents was required to create mechanical interlocking, that could provide better adhesion between the adhesive and the adherents [11]. The surfaces were then cleaned using acetone before the bonding process, where a constant pressure of 137 kPa was applied using a cold press machine for 15 s on the adhesive bonded specimen. After that, the adhesive joints were left to cure for 72 h at room temperature as suggested by 3M adhesive supplier. Subsequently, both upper and lower surfaces of one end of the specimen were bonded with hinges of 20 mm × 20 mm size using Sikadur adhesive. The specimens were left for one week for the adhesive to be fully cured. The initial crack length was 50 mm for all specimens. Figure 1 represents the schematic diagram of the DCB adhesive bonded joint.
Schematic diagram of the DCB adhesive bonded joint.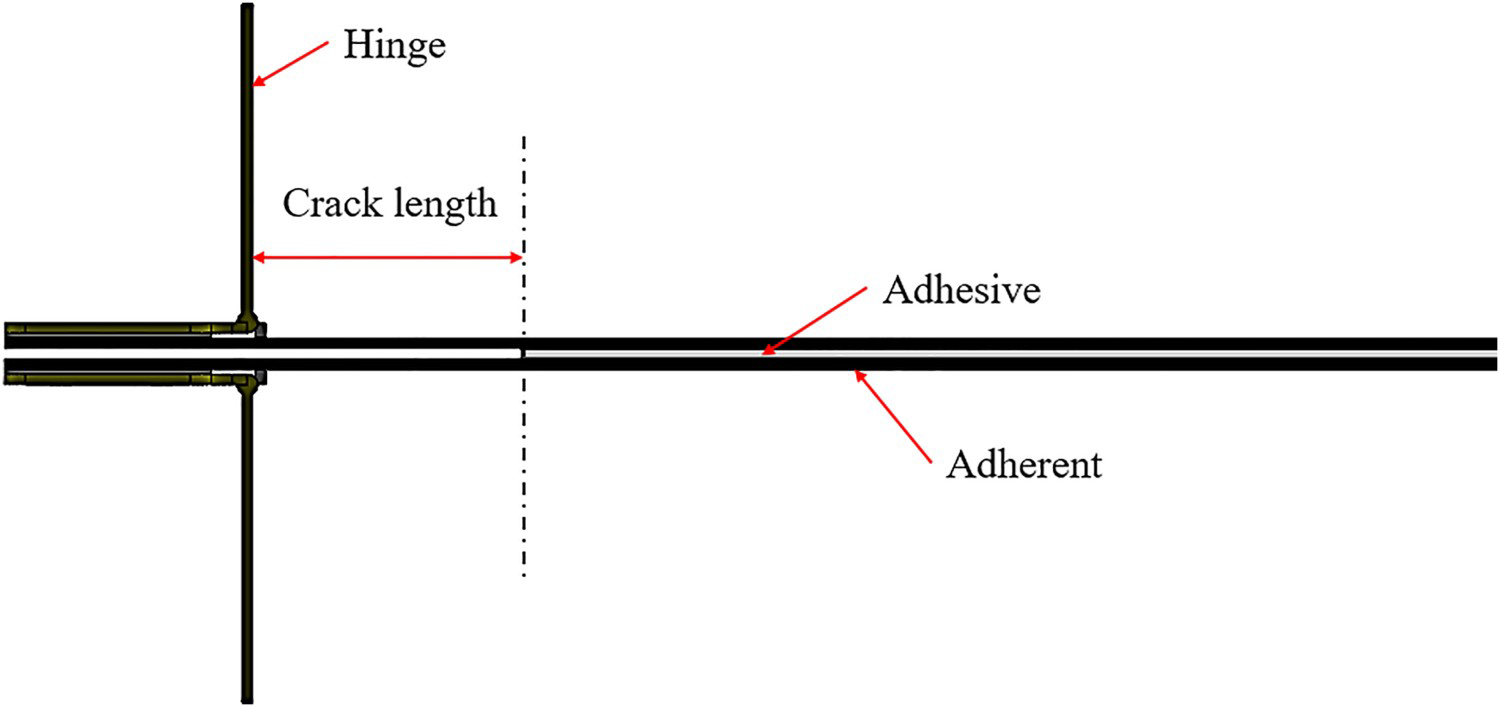
Mode I delamination test
The mode I delamination test was conducted using Instron Universal Testing Machine 5982 with a 5 kN load cell at ambient conditions. Both hinges of the specimen were gripped firmly and mode I opening was induced by loading the specimen in the tensile mode. The specimens were tested at four displacement rates or crosshead speeds, which were 5, 50, 250, 500 mm min−1. At least three specimens were tested for each displacement rate.
Data reduction scheme
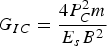
The mode I fracture toughness GIC of the adhesive bonded joints was calculated using the simple beam theory [12]:
Results and discussion
Force–displacement graphs
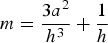
Figure 2 illustrates a typical experimental force–displacement curve of the adhesive bonded joints under mode I double cantilever beam (DCB) test. Three different regions are detected for this adhesive bonded joint, i.e. ‘I’ the elastic region, ‘II’ the non-elastic region and ‘III’ the fracture region. In the elastic region, the force increases linearly with the crosshead displacement. The linear behaviour ends at point ‘a’ and there is deviation in the slope which indicates the start of the second linear region that is marked as ‘II’. The change in the slope is due to the hyper-elastic adhesive used in this study. Previous studies by Benjamin et al. [5] showed similar behaviour of a hyper-elastic adhesive, where the slope was varied before the peak load was attained. The maximum force at point ‘b’ indicates the critical load of the adhesive bonded joint before the crack starts to propagate. The subsequent loading is accompanied by a load drop which signifies the crack growth region (marked with ‘III’). Testing was stopped at crosshead displacement of 100 mm (point ‘c’).
A typical force–displacement curve of the adhesive bonded joint: ‘I’ the elastic region, ‘II’ the non-elastic region and ‘III’ the fracture region.
Figure 3 shows the experimental force–displacement curves for the adhesive bonded joints at all displacement rates investigated in this study. In general, the peak load increases with the displacement rate. This agrees with the trend as reported by Johar et al. [14] previously. Besides, two distinctively different slopes are observed. Higher loading rates (250 and 500 mm min−1) attained a larger slope compared to lower ones (5 and 50 mm min−1). For the first linear region (within 20 N), the average slopes are 3.94, 3.73, 5.12 and 4.80 N mm−1 at 5, 50, 250 and 500 mm min−1, respectively. By using the slope at 5 mm min−1 as reference, the slope has increased by 30% and 22% at 250 and 500 mm min−1, respectively. As for the second linear region (between 40 and 70 N), the average slopes are 1.70, 1.94, 2.84 and 2.87 N mm−1 at 5, 50, 250 and 500 mm min−1, respectively. Compared to 5 mm min−1, the slopes at 250 and 500 mm min−1 have augmented by approximately 65%. Since the stiffness of the same composite (without adhesive bonding) was found to be independent of the displacement rate up to 500 mm min−1 [4], the difference in the slopes is therefore attributed to the hyper-elastic behavior of the adhesive.
Overall mode I force–displacement curves for the adhesive bonded composite joints.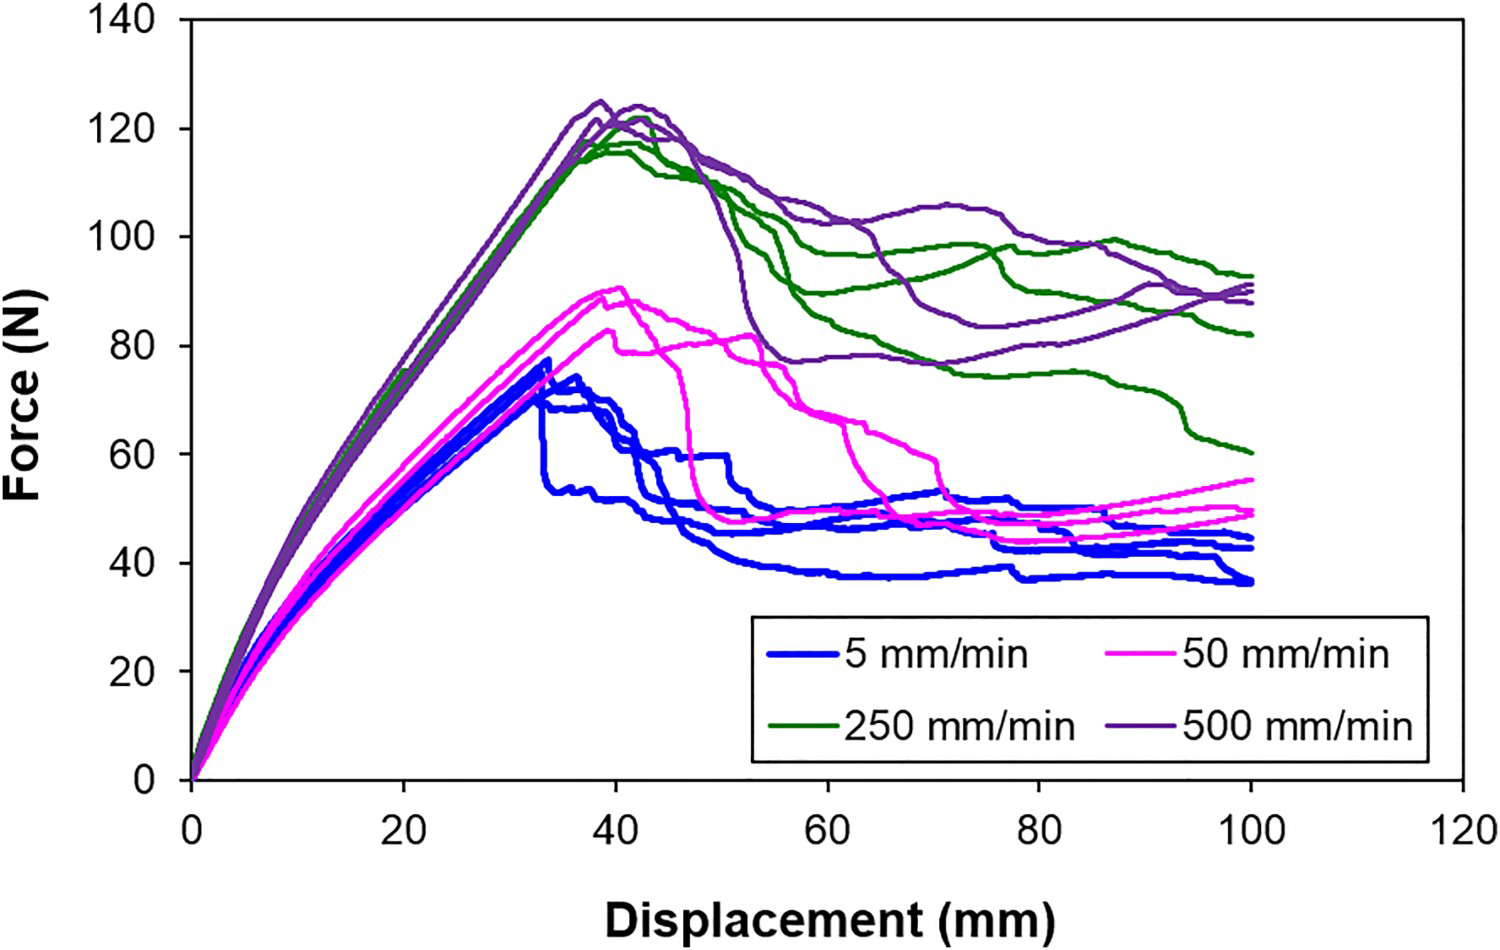
Mode I fracture toughness
Figure 4 describes the variation of the mode I fracture toughness GIC with respect to the crosshead speed. The average GIC values at each speed are also indicated in Figure 4. It is apparent that GIC increases exponentially with the crosshead speed. In addition, the error bars refer to the standard deviation. The coefficient of variation (C.V) of the test is below 10%, which signifies good repetition of the results. By using the loading rate 5 mm min−1 as the reference, GIC has increased by 34%, 139% and 155% at 50, 250 and 500 mm min−1, respectively. A higher GIC indicates that a higher energy is required in order to initiate delamination in the adhesive bonded joints under opening mode. In the previous study using the same type of carbon/epoxy composite (without adhesive bonding), the GIC values of the composite interface were found to be invariant with the crosshead speed within the range of 1–500 mm min−1 [4]. The GIC values of the composite calculated using simple beam theory were in the range of 241–254 N m−1. Hence, the variation in the GIC of the adhesive bonded composite joints must be attributed to the acrylic adhesive used in the study.
Variation of mode I fracture toughness with the crosshead speed.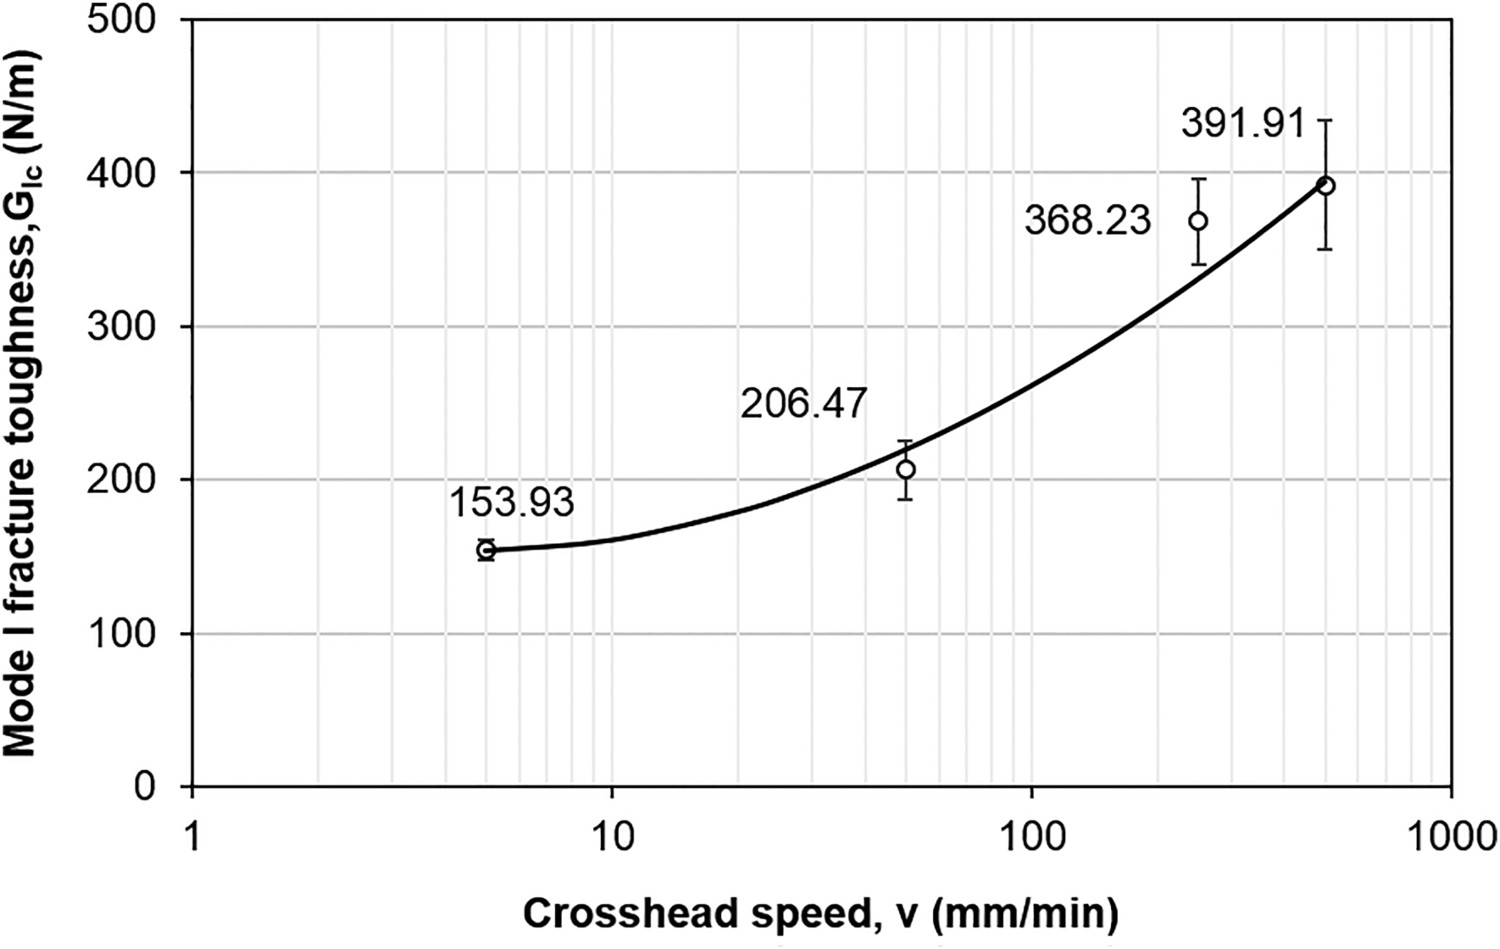
By considering the value at quasi-static loading, the GIC of acrylic adhesive obtained in this study (153.93 N m−1) is lower compared to other types of adhesives published in the literature. These include polyurethane adhesive bonded stainless steel joints (1570 N m−1) [10], polyurethane adhesive bonded spring steel (SUP-10) joints (2475 N m−1) [9], Betamate 1496V epoxy adhesive bonded maraging steel 1.6358 (X2NiCoMo18-9-5) joints (≈ 4500 N m−1) [7], Betamate XD4600 epoxy adhesive bonded HTS/6376 and IM7/977-2 unidirectional carbon/epoxy composites (3500 N m−1) [8]. Nevertheless, it is comparable to Denatite 2204 epoxy adhesive bonded spring steel (SUP-10) joints (283 N m−1) [9]. Hence, the finding of this study shows that acrylic adhesive is more suitable to be used to bond non-load critical composite components such as the secondary structures. The performance of the adhesive improves significantly when it is used at high loading rate application with enhanced stiffness and mode I fracture toughness GIC.
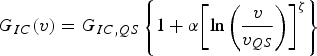
Subsequently, the variation of the GIC values with the crosshead speed can be fitted using the following equation:
Mode I failure mode
There are three types of failure mode on adhesive bonded joints during debonding, which are adhesive, cohesive and mixed-mode failure. The adhesive failure refers to the interfacial detachment of adhesive from the adherent, while cohesive failure indicates the cracking within the bulk of the adhesive layer itself where a layer of adhesive remains on both adherent surfaces. The mixed-mode failure implies a combination of adhesive and cohesive failure. Cohesive failure within the adhesive is typically preferred to adhesive failure because the former indicates that the maximum strength of the bulk adhesive has been reached. To quantify the failure mode of the adhesive bonded joints, the delaminated surfaces were evaluated using JMicroVision 1.2.7, an open source image analysis software. The cohesive area within the delaminated area of 100 mm length × 20 mm width of the specimens was captured using a digital camera under white light. The percentage of cohesive area that represents the cohesive failure in the adhesive bonded joints was measured and calculated by:
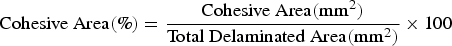
Figure 5 depicts the debonded surfaces of the adhesive bonded joints after testing for each crosshead speed ranging from 5 to 500 mm min−1. It could be seen that adhesive failure dominates at 5 mm min−1, while the extent of cohesive failure increases with the crosshead speed.
Failure mode of the adhesive bonded joints at crosshead speeds of (a) 5 mm min−1, (b) 50 mm min−1, (c) 250 mm min−1 and (d) 500 mm min−1.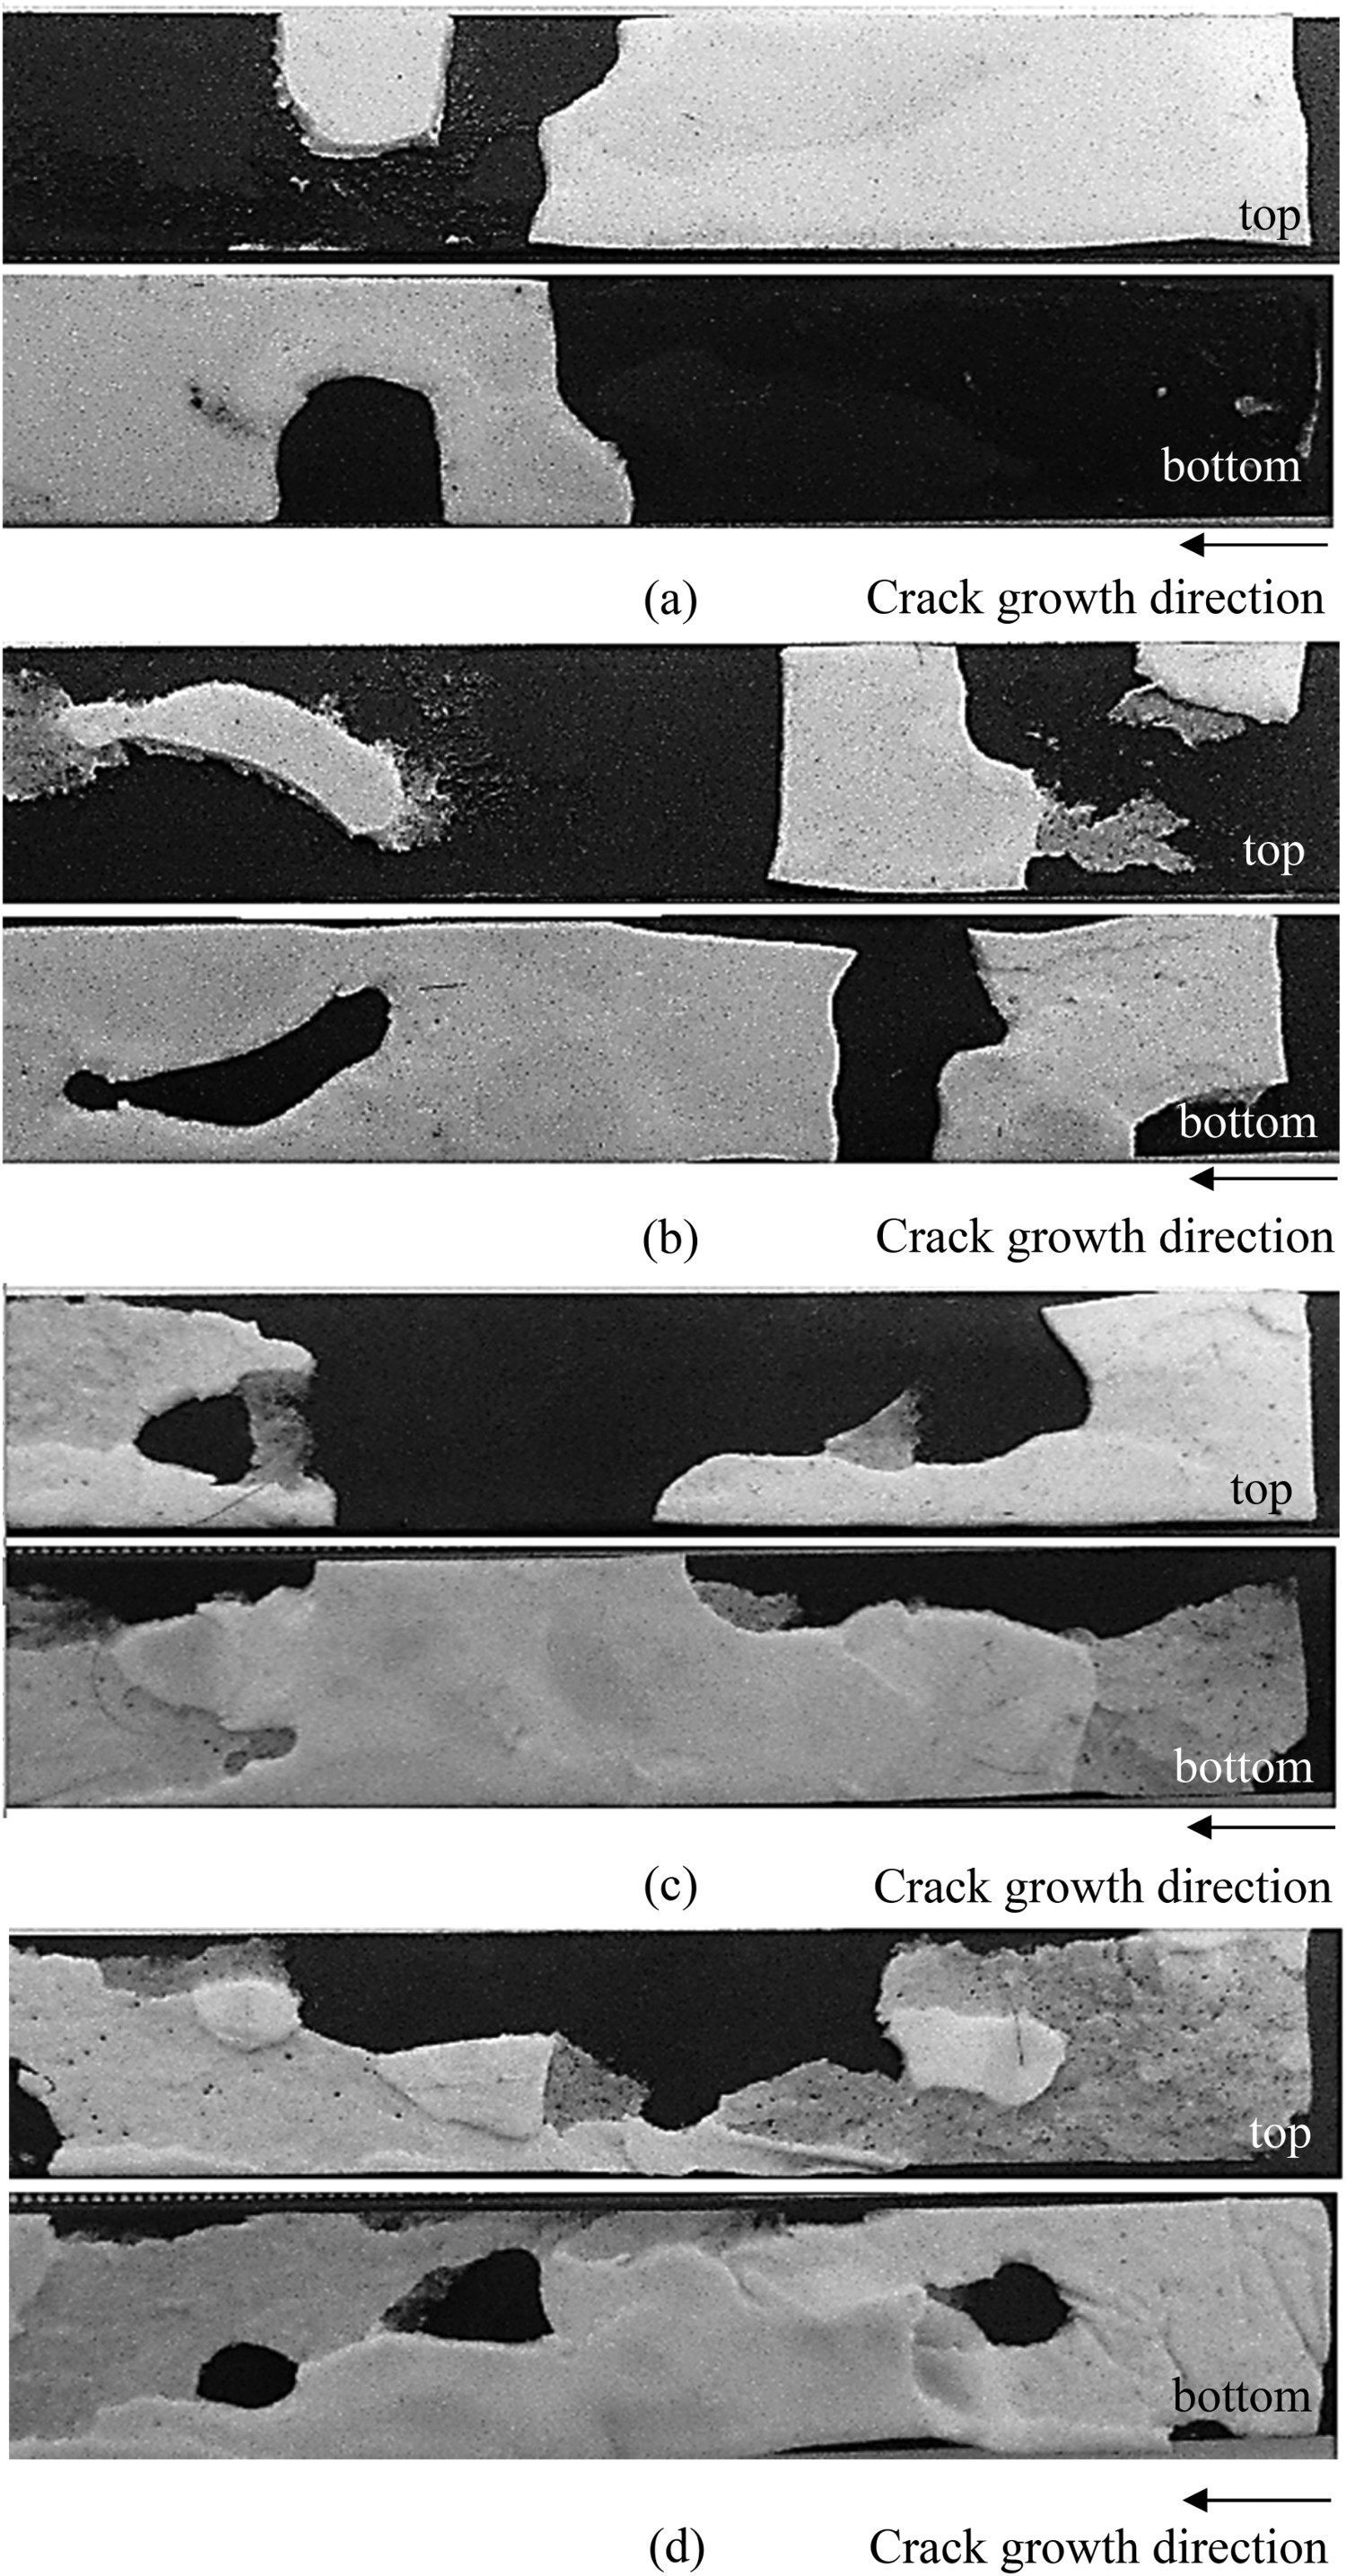
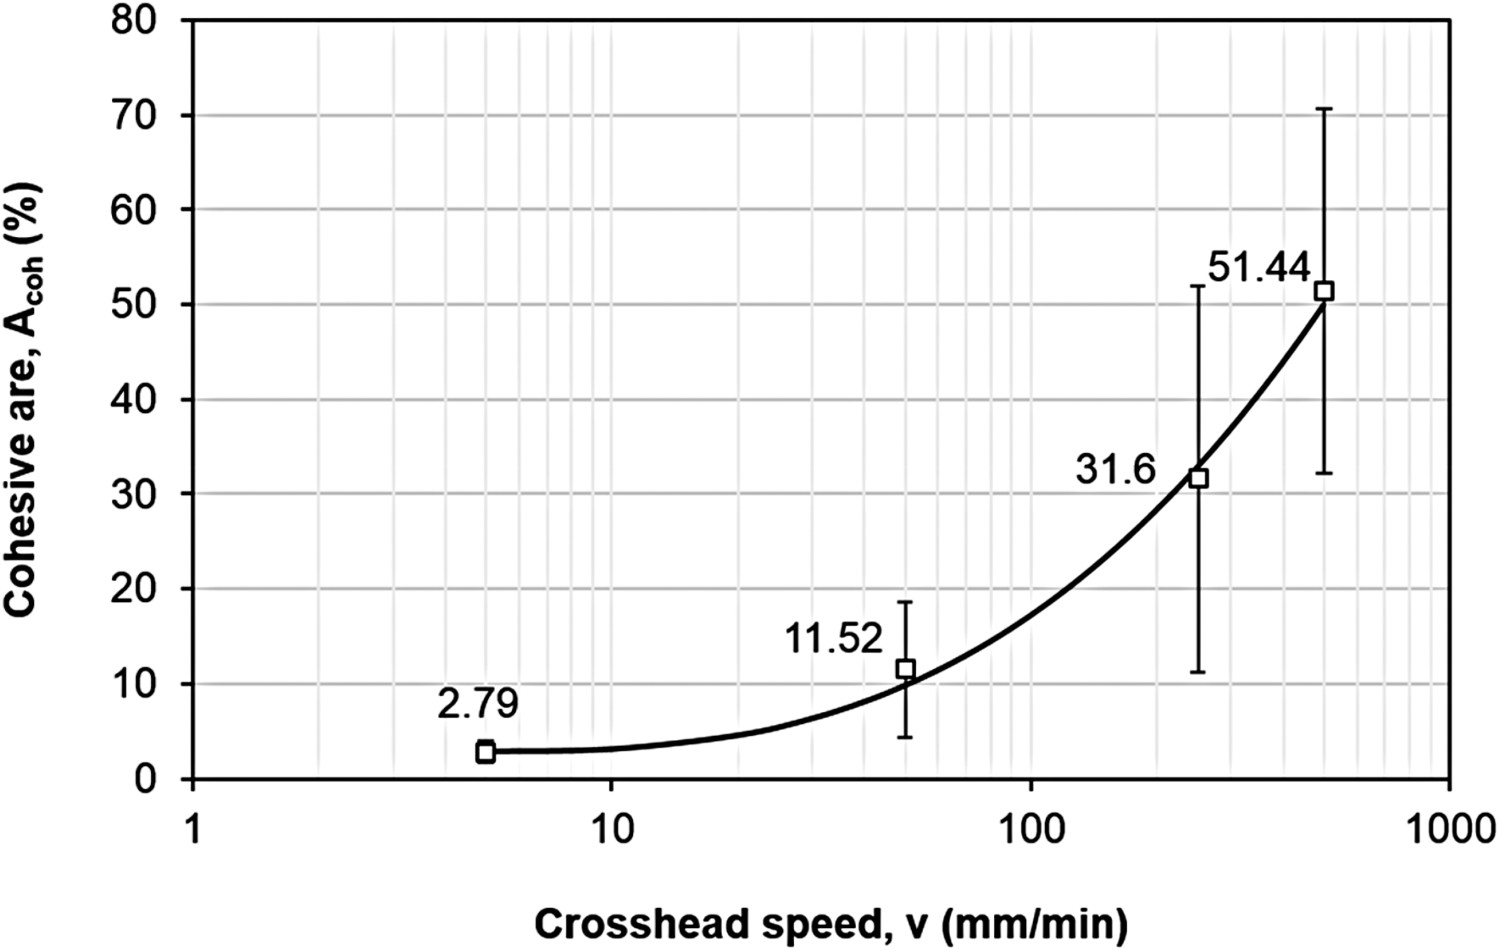
Figure 6 quantifies the cohesive area as a function of crosshead speed. It is apparent that the cohesive area increases with the crosshead speed. The highest average cohesive area is obtained at 500 mm min−1 with 51.44%, while the lowest is obtained at 5 mm min−1 with an average cohesive area of 2.79% only. The trend of the cohesive area follows the similar trend of mode I fracture toughness GIC and there exists correlation between them. Having a higher cohesive area represents a better adhesion between adhesive and adherent, thus showing a larger presence of cohesive failure [18, 19]. It is demonstrated in this study that cohesive failure is more desirable than other failure as it gives a higher fracture toughness value. Mubashar et al. [20] also reported that the ratio of cohesive to adhesive area followed the similar trend as the failure load of the adhesive bonded single lap joints. The relatively large standard deviation observed in the cohesive area is possibly due to the variation in the localised damage among the specimens. In addition, fitting the cohesive area using Equation (5) (an equation similar to Equation (3)) also gives a good fit, with α = 0.25, ζ = 2.76 and R 2 close to unity (solid line in Figure 6). The study shows that an acrylic adhesive such as 3M VHB 4930F is recommended for composite components loaded at a high displacement rate to benefit from its higher fracture toughness.
Variation of cohesive area with the crosshead speed.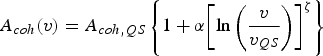
Conclusions
The displacement rate effects on mode I delamination of VHB4930F adhesive bonded with carbon/epoxy composite have been examined experimentally within the range of 5–500 mm min−1. Double cantilever beam (DCB) test was conducted and the mode I fracture toughness GIC was calculated using the simple beam theory (SBT). The force-displacement curves exhibit two distinct slopes, where 5 and 50 mm min−1 has a similar slope which is lower than the one at 250 and 500 mm/min. Compared to 5 mm min−1, the maximum increment in the slopes are 30% and 65%, respectively. The average GIC values are 153.93, 206.47, 368.23 and 391.91 N m−1 at crosshead speeds of 5, 50, 250 and 500 mm min−1, respectively. The maximum increment (at 500 mm min−1) is 2.6-fold higher compared to the GIC at 5 mm min−1. In addition, the amount of the cohesive area is also found to increase with the crosshead speed. The average cohesive area are 2.8%, 11.5%, 31.6% and 51.4% at 5, 50, 250 and 500 mm min−1, respectively. The positive effect of loading rate on GIC suggests that the acrylic adhesive composite joints used in this study is suitable to be used for higher loading rate above 250 mm min−1. However, the GIC value is comparatively lower than the reported values of polyurethane and epoxy adhesive joints from the literature. Hence, it is more suitable to be used for the bonding of composite components of non-load critical secondary structures. Finally, it is also worth to note that the variation of both GIC and cohesive area correlate well and can be described accurately using the proposed rate-dependent model.
Footnotes
Acknowledgements
This work was supported by Universiti Teknologi Malaysia through UTMShine grant number 09G16 and Collaborative Research grant number 08G01.
Disclosure statement
No potential conflict of interest was reported by the author(s).